How #wind and #solar power help keep America’s farms alive — Paul Mwebaze (TheConversation.com)

About 60% of Iowa’s power comes from wind. Farmers can earn extra cash by leasing small sections of farms for power production. Bill Clark/Getty Images

Paul Mwebaze, University of Illinois at Urbana-Champaign

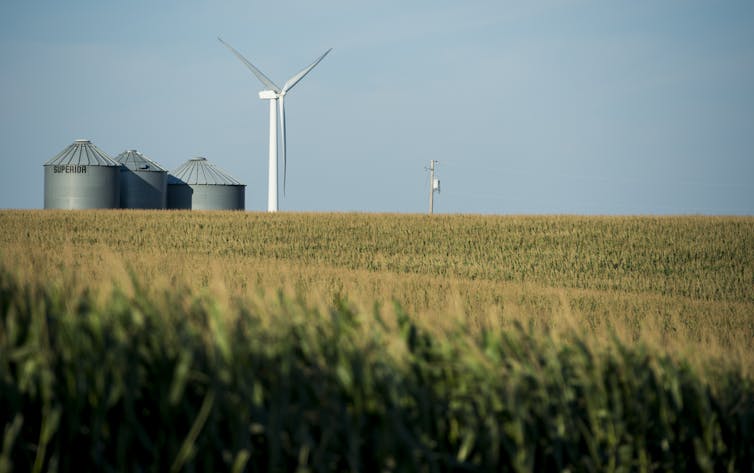
Drive through the plains of Iowa or Kansas and you’ll see more than rows of corn, wheat and soybeans. You’ll also see towering wind turbines spinning above fields and solar panels shining in the sun on barns and machine sheds.

For many farmers, these are lifelines. Renewable energy provides steady income and affordable power, helping farms stay viable when crop prices fall or drought strikes.

But some of that opportunity is now at risk as the Trump administration cuts federal support for renewable energy.

Wind power brings steady income for farms

Wind energy is a significant economic driver in rural America. In Iowa, for example, over 60% of the state’s electricity came from wind energy in 2024, and the state is a hub for wind turbine manufacturing and maintenance jobs.

For landowners, wind turbines often mean stable lease payments. Those historically were around US$3,000 to $5,000 per turbine per year, with some modern agreements $5,000 to $10,000 annually, secured through 20- to 30-year contracts.

Nationwide, wind and solar projects contribute about $3.5 billion annually in combined lease payments and state and local taxes, more than a third of it going directly to rural landowners.

A U.S. map shows the strongest wind power potential in the central U.S., particularly the Great Plains and Midwestern states.
States throughout the Great Plains and Midwest, from Texas to Montana to Ohio, have the strongest onshore winds and onshore wind power potential. These are also in the heart of U.S. farm country. The map shows wind speeds at 100 meters (nearly 330 feet), about the height of a typical land-based wind turbine. NREL

These figures are backed by long-term contracts and multibillion‑dollar annual contributions, reinforcing the economic value that turbines bring to rural landowners and communities.

Wind farms also contribute to local tax revenues that help fund rural schools, roads and emergency services. In counties across Texas, wind energy has become one of the most significant contributors to local property tax bases, stabilizing community budgets and helping pay for public services as agricultural commodity revenues fluctuate.

In Oldham County in northwest Texas, for example, clean energy projects provided 22% of total county revenues in 2021. In several other rural counties, wind farms rank among the top 10 property taxpayers, contributing between 38% and 69% of tax revenue.

The construction and operation of these projects also bring local jobs in trucking, concrete work and electrical services, boosting small-town businesses.

A worker wearing a hardhat stands on top of a wind turbine, with a wide view of the landscape around him.
A wind turbine technician stands on the nacelle, which houses the gear box and generator of a wind turbine, on the campus of Mesalands Community College in Tucumcari, N.M., in 2024. Colleges in other states, including Texas, also developed training programs for technicians in recent years as jobs in the industry boomed. Andrew Marszal/AFP via Getty Images

The U.S. wind industry supports over 300,000 U.S. jobs across construction, manufacturing, operations and other roles connected to the industry, according to the American Clean Power Association.

Renewable energy has been widely expected to continue to grow along with rising energy demand. In 2024, 93% of all new electricity generating capacity was wind, solar or energy storage, and the U.S. Energy Information Administration expected a similar percentage in 2025 as of June.

Solar can cut power costs on the farm

Solar energy is also boosting farm finances. Farmers use rooftop panels on barns and ground-mounted systems to power irrigation pumps, grain dryers and cold storage facilities, cutting their power costs.

Some farmers have adopted agrivoltaics – dual-use systems that grow crops beneath solar panels. The panels provide shade, helping conserve water, while creating a second income path. These projects often cultivate pollinator-friendly plants, vegetables such as lettuce and spinach, or even grasses for grazing sheep, making the land productive for both food and energy.

Federal grants and tax credits that were significantly expanded under the 2022 Inflation Reduction Act helped make the upfront costs of solar installations affordable.

A farmer looks at the camera with cows around him and a large red bar with solar panels on the roof behind him. The photos was taken at the Milkhouse Dairy in Monmouth, Maine, on Oct. 3, 2019.
Solar panels can help cut energy costs for farm operations like dairies. Shawn Patrick Ouellette/Portland Press Herald via Getty Images

However, the federal spending bill signed by President Donald Trump on July 4, 2025, rolled back many clean energy incentives. It phases down tax credits for distributed solar projects, particularly those under 1 megawatt, which include many farm‑scale installations, and sunsets them entirely by 2028. It also eliminates bonus credits that previously supported rural and low‑income areas.

Without these credits, the upfront cost of solar power could be out of reach for some farmers, leaving them paying higher energy costs. At a 2024 conference organized by the Institute of Sustainability, Energy and Environment at the University of Illinois Urbana-Champaign, where I work as a research economist, farmers emphasized the importance of tax credits and other economic incentives to offset the upfront cost of solar power systems.

What’s being lost

The cuts to federal incentives include terminating the Production Tax Credit for new projects placed in service after Dec. 31, 2027, unless construction begins by July 4, 2026, and is completed within a tight time frame. The tax credit pays eligible wind and solar facilities approximately 2.75 cents per kilowatt-hour over 10 years, effectively lowering the cost of renewable energy generation. Ending that tax credit will likely increase the cost of production, potentially leading to higher electricity prices for consumers and fewer new projects coming online.

The changes also accelerate the phase‑out of wind power tax credits. Projects must now begin construction by July 4, 2026, or be in service before the end of 2027 to qualify for any credit.

Meanwhile, the Investment Tax Credit, which covers 30% of installed cost for solar and other renewables, faces similar limits: Projects must begin by July 4, 2026, and be completed by the end of 2027 to claim the credits. The bill also cuts bonuses for domestic components and installations in rural or low‑income locations. These adjustments could slow new renewable energy development, particularly smaller projects that directly benefit rural communities.

While many existing clean energy agreements will remain in place for now, the rollback of federal incentives threatens future projects and could limit new income streams. It also affects manufacturing and jobs in those industries, which some rural communities rely on.

Renewable energy also powers rural economies

Renewable energy benefits entire communities, not just individual farmers.

Wind and solar projects contribute millions of dollars in tax revenue. For example, in Howard County, Iowa, wind turbines generated $2.7 million in property tax revenue in 2024, accounting for 14.5% of the county’s total budget and helping fund rural schools, public safety and road improvements.

In some rural counties, clean energy is the largest new source of economic activity, helping stabilize local economies otherwise reliant on agriculture’s unpredictable income streams. These projects also support rural manufacturing – such as Iowa turbine blade factories like TPI Composites, which just reopened its plant in Newton, and Siemens Gamesa in Fort Madison, which supply blades for GE and Siemens turbines. The tax benefits in the 2022 Inflation Reduction Act helped boost those industries – and the jobs and local tax revenue they bring in.

On the solar side, rural companies like APA Solar Racking, based in Ohio, manufacture steel racking systems for utility-scale solar farms across the Midwest. https://www.youtube.com/embed/Bcet_aaaMq8?wmode=transparent&start=0 An example of how renewable energy has helped boost farm incomes and keep farmers on their land.

As rural America faces economic uncertainty and climate pressures, I believe homegrown renewable energy offers a practical path forward. Wind and solar aren’t just fueling the grid; they’re helping keep farms and rural towns alive.

Paul Mwebaze, Research Economist at the Institute for Sustainability, Energy and Environment, University of Illinois at Urbana-Champaign

This article is republished from The Conversation under a Creative Commons license. Read the original article.

Where is the snow? A look at the warm, dry weather and what to expect for the start of 2026 — Allie Mazurek (#Colorado #Climate Center)

December 20, 2025

The past several weeks have felt more like an extension of fall rather than the beginning of winter in Colorado. While the warmth has been a welcome reprieve to the winter-loathers, it has been accompanied by dry conditions that have brought worsening drought, poor snowpack, and fire danger. In this post, we’ll look back at some recent trends we’ve been watching and provide a look forward at what we might expect as we head into the start of 2026.

Snowpack and snowfall

We’ll kick off the post with a late December snowpack check-in. Unfortunately for CO (and the West more broadly), there is little good news to report. Looking at percent of 30-year average (1991-2020) snow water equivalent (SWE), a fundamental snowpack metric, shows all of Colorado’s river basins running much below average as of December 18. Conditions are similarly poor throughout the state, with all major river basins sitting between 54% to 63% of their normal snowpack.

Percent of 30-year (1991-2020) average snowpack for Colorado’s river basins as of December 18. [Source: NRCS]

While basin-wide percentages are similar across the state, there are some particularly concerning numbers across the state’s northern basins. There, several SNOTEL stations are currently reporting their lowest or second-lowest snowpack on record. While it’s worth noting that several of these sites have relatively short record periods (~22 years) compared to others in the SNOTEL database, there are some stations with 40+ year records that are reporting record or near-record low values for this time in the winter. Even though a major portion of the snow accumulation is still ahead of us, with more dry weather in the forecast (more on that below), that is all bad news from a water perspective.

Image: SNOTEL stations reporting their lowest (red) or second-lowest (orange) period of record snow water equivalent (SWE). The station circled in purple is Joe Wright Reservoir, and a time series for SWE at that station is shown in the following image. [Source: NRCS]
Historical and current (black line) snow water equivalent at Joe Wright Reservoir (records date back to 1979). [Source: NRCS]

Across the lower elevations, snow is also in short supply. Boulder and Denver each saw their latest and 2nd-latest first snows on record at the tail-end of November. And so far, the Front Range Urban Corridor has only seen one shovel-able snowstorm this winter (that happened on Dec. 3). Aside from those two events, Front Range flakes have been few and far between, as warm temperatures have often favored rain over snow (though liquid precipitation has also been in short supply). And further east on the Plains, many have yet to see their first flakes.  

Record-setting temperatures

Above-normal temperatures have been a familiar story throughout autumn and early winter. Fall 2025 (September-November) was the 4th warmest on record, and much of that abnormal heat can be attributed to November (ranked the 3rd-warmest on record for Colorado according to NOAA NCEI). No areas of the state were spared from the unusually warm temperatures, but the heat was most notable along the West Slope, where some locations saw their warmest fall on record.

September-November 2025 temperature rank amongst pervious falls (131 years of data). [Data from NCEI]

Mid-December has offered little relief from the record-setting heat, with widespread daily records in all corners of the state several days in mid-December. Here in Fort Collins, we notched our warmest 7-day December period on record over December 9-15. Denver recorded 9 straight days of temperatures exceeding 60°F, the 2nd-longest December streak of 60°F+ days on record (h/t to Chris Bianchi). December temperatures so far are running above average nearly everywhere in Colorado, exceeding 8-10°F (or more) above average in some parts of the state.

Left: Daily record high temperatures set on December 12. [Data from ACIS] Right: Departure from normal temperature for December 1-18, 2025. [Source: HPRCC]

Drought

The worst drought in the state continue to be in western Colorado, though conditions have begun to worsen in other parts of the state. A notable precipitation event just before Thanksgiving prevented drought from worsening in western and southwestern Colorado, and some locations even saw some minor drought improvements according to the U.S. Drought Monitor. The story is quite different if you look at north-central Colorado, however. A very dry November led to worsening drought conditions for areas that were previously drought-free. Degradations have also occurred across south-central Colorado. As of December 16, ~36% of the state is experiencing drought. That is up from ~29% at the start of November.

Left: U.S. Drought Monitor Change Map showing drought degradations (yellow/orange) and improvements (green) from November 4 to December 16. Right: U.S. Drought Monitor as of December 16, 2025. [Source: droughtmonitor.unl.edu]

Warm and dry conditions have been accompanied by high wildfire risk. Strong winds coupled with the lack of precipitation and snow-free ground cover in the Foothills has brought favorable fire weather conditions throughout this past week. On December 17, downslope winds produced severe wind gusts in excess of 100 mph. A cold front later in the day pushed gusty winds across the Eastern Plains, fanning several fires near Yuma that were ignited by downed power lines. Exceptionally dry and windy conditions returned on December 19, prompting the NWS in Boulder issued its first-ever Particularly Dangerous Situation (PDS) Red Flag Warning on December 19, a descriptor reserved only for the most severe fire risk days. The NOAA Storm Prediction Center also included parts of the Front Range Foothills and Urban Corridor in an “extremely critical” risk area in their Fire Weather Outlook, which is uncommon to see anywhere in Colorado (no more than a few of those forecasts are issued statewide each year), but they are exceptionally rare during the wintertime. Forecast products aside, fire season is year-round for Colorado’s lower elevations, as was underscored by the devastation brought by the Marshall Fire in December 2021.

Smoke from a small grass fire near the CSU Foothills campus on December 18.

Outlook

Looking ahead at the rest of December, there is high confidence that above-normal temperatures will persist across Colorado. The 8-14 Day NOAA Climate Prediction Center Outlook shows a 70-80% chance that temperatures will be above average during the final week of 2025. For precipitation, it is likely that a series of atmospheric rivers will make landfall along the West Coast throughout the last couple of weeks of December. While impacts will be greatest for the coastal states, global numerical weather prediction models indicate that these events will bring increased moisture to Colorado, especially the western part of the state. As a result, the CPC shows elevated chances for above-normal precipitation over Western Colorado during the December 26-January 1 period, which is welcome news from a drought and snowpack perspective. Current forecast model data shows that precipitation chances over the next two weeks diminish as you head further east across Colorado, and the CPC suggests that below-normal precipitation is favored for the 8-14 day period over the far eastern part of the state.

NOAA Climate Prediction Center Outlooks for temperature (left) and precipitation (right) for the next 8-14 days (December 27-January 2).

Looking further ahead towards the seasonal outlook for January-March, precipitation and temperature outlooks are less certain. The CPC outlook for the first three months of 2026 shows increased likelihood for above-average temperatures in Southwest Colorado and equal chances for above- or below-normal temperatures elsewhere. In terms of precipitation, the January outlook has Colorado sitting between increased chances of wetter than normal conditions over the Northwest U.S. and increased chances of drier than normal conditions over the Southwest U.S, highlighting uncertainty in what the rest of winter will bring. This pattern in the outlook is reflective of a typical wintertime La Niña setup, which usually situates Colorado between dry conditions to the south and wet conditions to the north (though results found in our Climate Change in Colorado Report suggest La Niña correlates with wetter conditions over the Northern Mountains, making the recent snowpack numbers even more concerning). La Niña conditions are expected to persist into early 2026 and are forecasted to shift towards the ENSO neutral phase sometime in late winter or early spring. 

NOAA Climate Prediction Center Outlooks for temperature (left) and precipitation (right) for January 2026.
Relationships between winter (left) and spring (right) precipitation and ENSO phase. Areas in red tend to be wetter during El Niño, while areas in blue tend to be wetter during La Niña. [From the 2023 Climate Change in Colorado Report]

A not-so-white Christmas: #Colorado mountain towns saw rain, record-high temperatures and record-low #snowpack — The Summit Daily

Westwide SNOTEL basin-filled map December 28, 2025.

Click the link to read the article on the Summit Daily website (Ryan Spencer). Here’s an excerpt:

December 27, 2025

Leadville, Breckenridge, Keystone and Aspen all experienced small amounts of rain on Christmas Day, according to the National Weather Service

Across Colorado, this Christmas holiday was not particularly white, as many mountain towns saw small amounts of rain, record-high temperatures and a record-low snowpack. As of Dec. 25, Colorado’s statewide snowpack stood at just 3.2 inches of snow-water equivalent and had reached the zeroth percentile, or its lowest point in at least the past 30 years, according to the U.S. Department of Agriculture’s snowpack telemetry, or SNOTEL, system.

“The winter of 1976-77 is generally thought to be the worst snow year in our mountains but the SNOTEL network wasn’t built out yet at that point, so it’s hard to make direct comparisons,” Colorado Climatologist Russ Schumacher said. “But the fact that we’re even in the same conversation with that winter is not good news.”

Out of the 94 SNOTEL stations in Colorado with at least 20 years of data, 22 of them were at a record-low snowpack on Christmas Day, and 10 were at their second-lowest snowpack on record, Schumacher said. He noted that warm temperatures and a lack of storms throughout December has not helped the state’s snowpack. Temperatures over the Christmas holiday were approximately 15 to 25 degrees above normal across the mountains, National Weather Service Grand Junction Office meteorologist Braeden Winters said Friday. The streak of unseasonably warm weather began toward the beginning of December and continued to get warmer through the holiday period…Rather than white, fluffy flakes for Christmas, Colorado’s mountain towns — including Leadville, at 10,154 feet, Breckenridge at 9,600, Keystone at 9,280 feet and Aspen at 7,891 feet —  experienced light rain and mixed precipitation on Thursday.

#ColoradoRiver Continues to Bring Unlikely Parties Together at the Colorado River Water Users Association — Daniel Anderson (Getches-Wilkinson Center) #CRWUA2025 #COriver #aridifcation

Image by Lex Padilla

Click the link to read the article on the Getches-Wilkinson Center website (Daniel Anderson):

December 29, 2025

The Colorado River Water Users Association annual conference met in Las Vegas [December 16-18, 2025]. Each year, over a thousand government officials, members of the press, municipal water district leaders, water engineers, ranchers, and tribal members meet to discuss the management of the mighty Colorado River. Hanging over the three-day conference was a stalemate between the upper and lower basin states over how to manage the Colorado River after current operational guidelines expire at the end of 2026.

Throughout the conference, the states’ inability to reach a consensus deal produced ripple effects. The stalemate held back progress on both near term shortage concerns (experts predict that Lake Powell will be only 28% full at the end of the ’25-’26 water year) and long-range planning, such as the development of the next “Minute” agreement between the United States and Mexico.

The closing act of CRWUA 2025 was an orderly (and familiar) report from each of the basin states’ principal negotiators that their state is stretched thin but remains committed to finding a consensus agreement. This final session had no discussion or Q&A. The basin states now have until February 14th to provide the Bureau of Reclamation with their consensus deal, which would presumably be added to an Environmental Impact Statement (EIS) draft that is expected to be released in early January. With time running short, many worry that public participation in the EIS process – vital to informed decision-making – will be greatly reduced.

Still, as Rhett Larson of Arizona State University said on the first day of the conference, “Desert rivers bring people together.” Tribal governments continue to innovate in the areas of conservation and storage, even in spite of ongoing challenges to meaningful access of federally reserved tribal water rights. For instance, the Colorado River Indian Tribes, or CRIT, shared news of a Resolution and Water Code recently passed by their Tribal Council which work together to recognize the Colorado River’s personhood under Tribal law. This provides CRIT with a holistic framework for on-reservation use and requires the consideration of the living nature of the Colorado River in off-reservation water leasing decisions. John Bezdek, who represented CRIT at the conference, put it this way: “If laws are an expression of values, then this tribal council is expressing to the world the importance of protecting and preserving the lifeblood of the Colorado River.” Among others, Celene Hawkins of The Nature Conservancy and Kate Ryan of the Colorado Water Trust also shared about the unique, and often unlikely, partnerships formed to protect stream flows and the riparian environment across the Colorado River basin.

Notwithstanding the basin states’ current deadlock, one theme rang true at CRWUA 2025: Despite the dire hydrologic and administrative realities facing decision-makers today, the Colorado River continues to bring unlikely parties together.

Map credit: AGU