Water across the West at risk as President Trump targets national monuments: A new study found that about 83% of water passing through public lands uses monument designation for its only protection — Wyatt Myskow (High Country News)

RuggyBearLA Photography RuggyBearLA / via Flickr

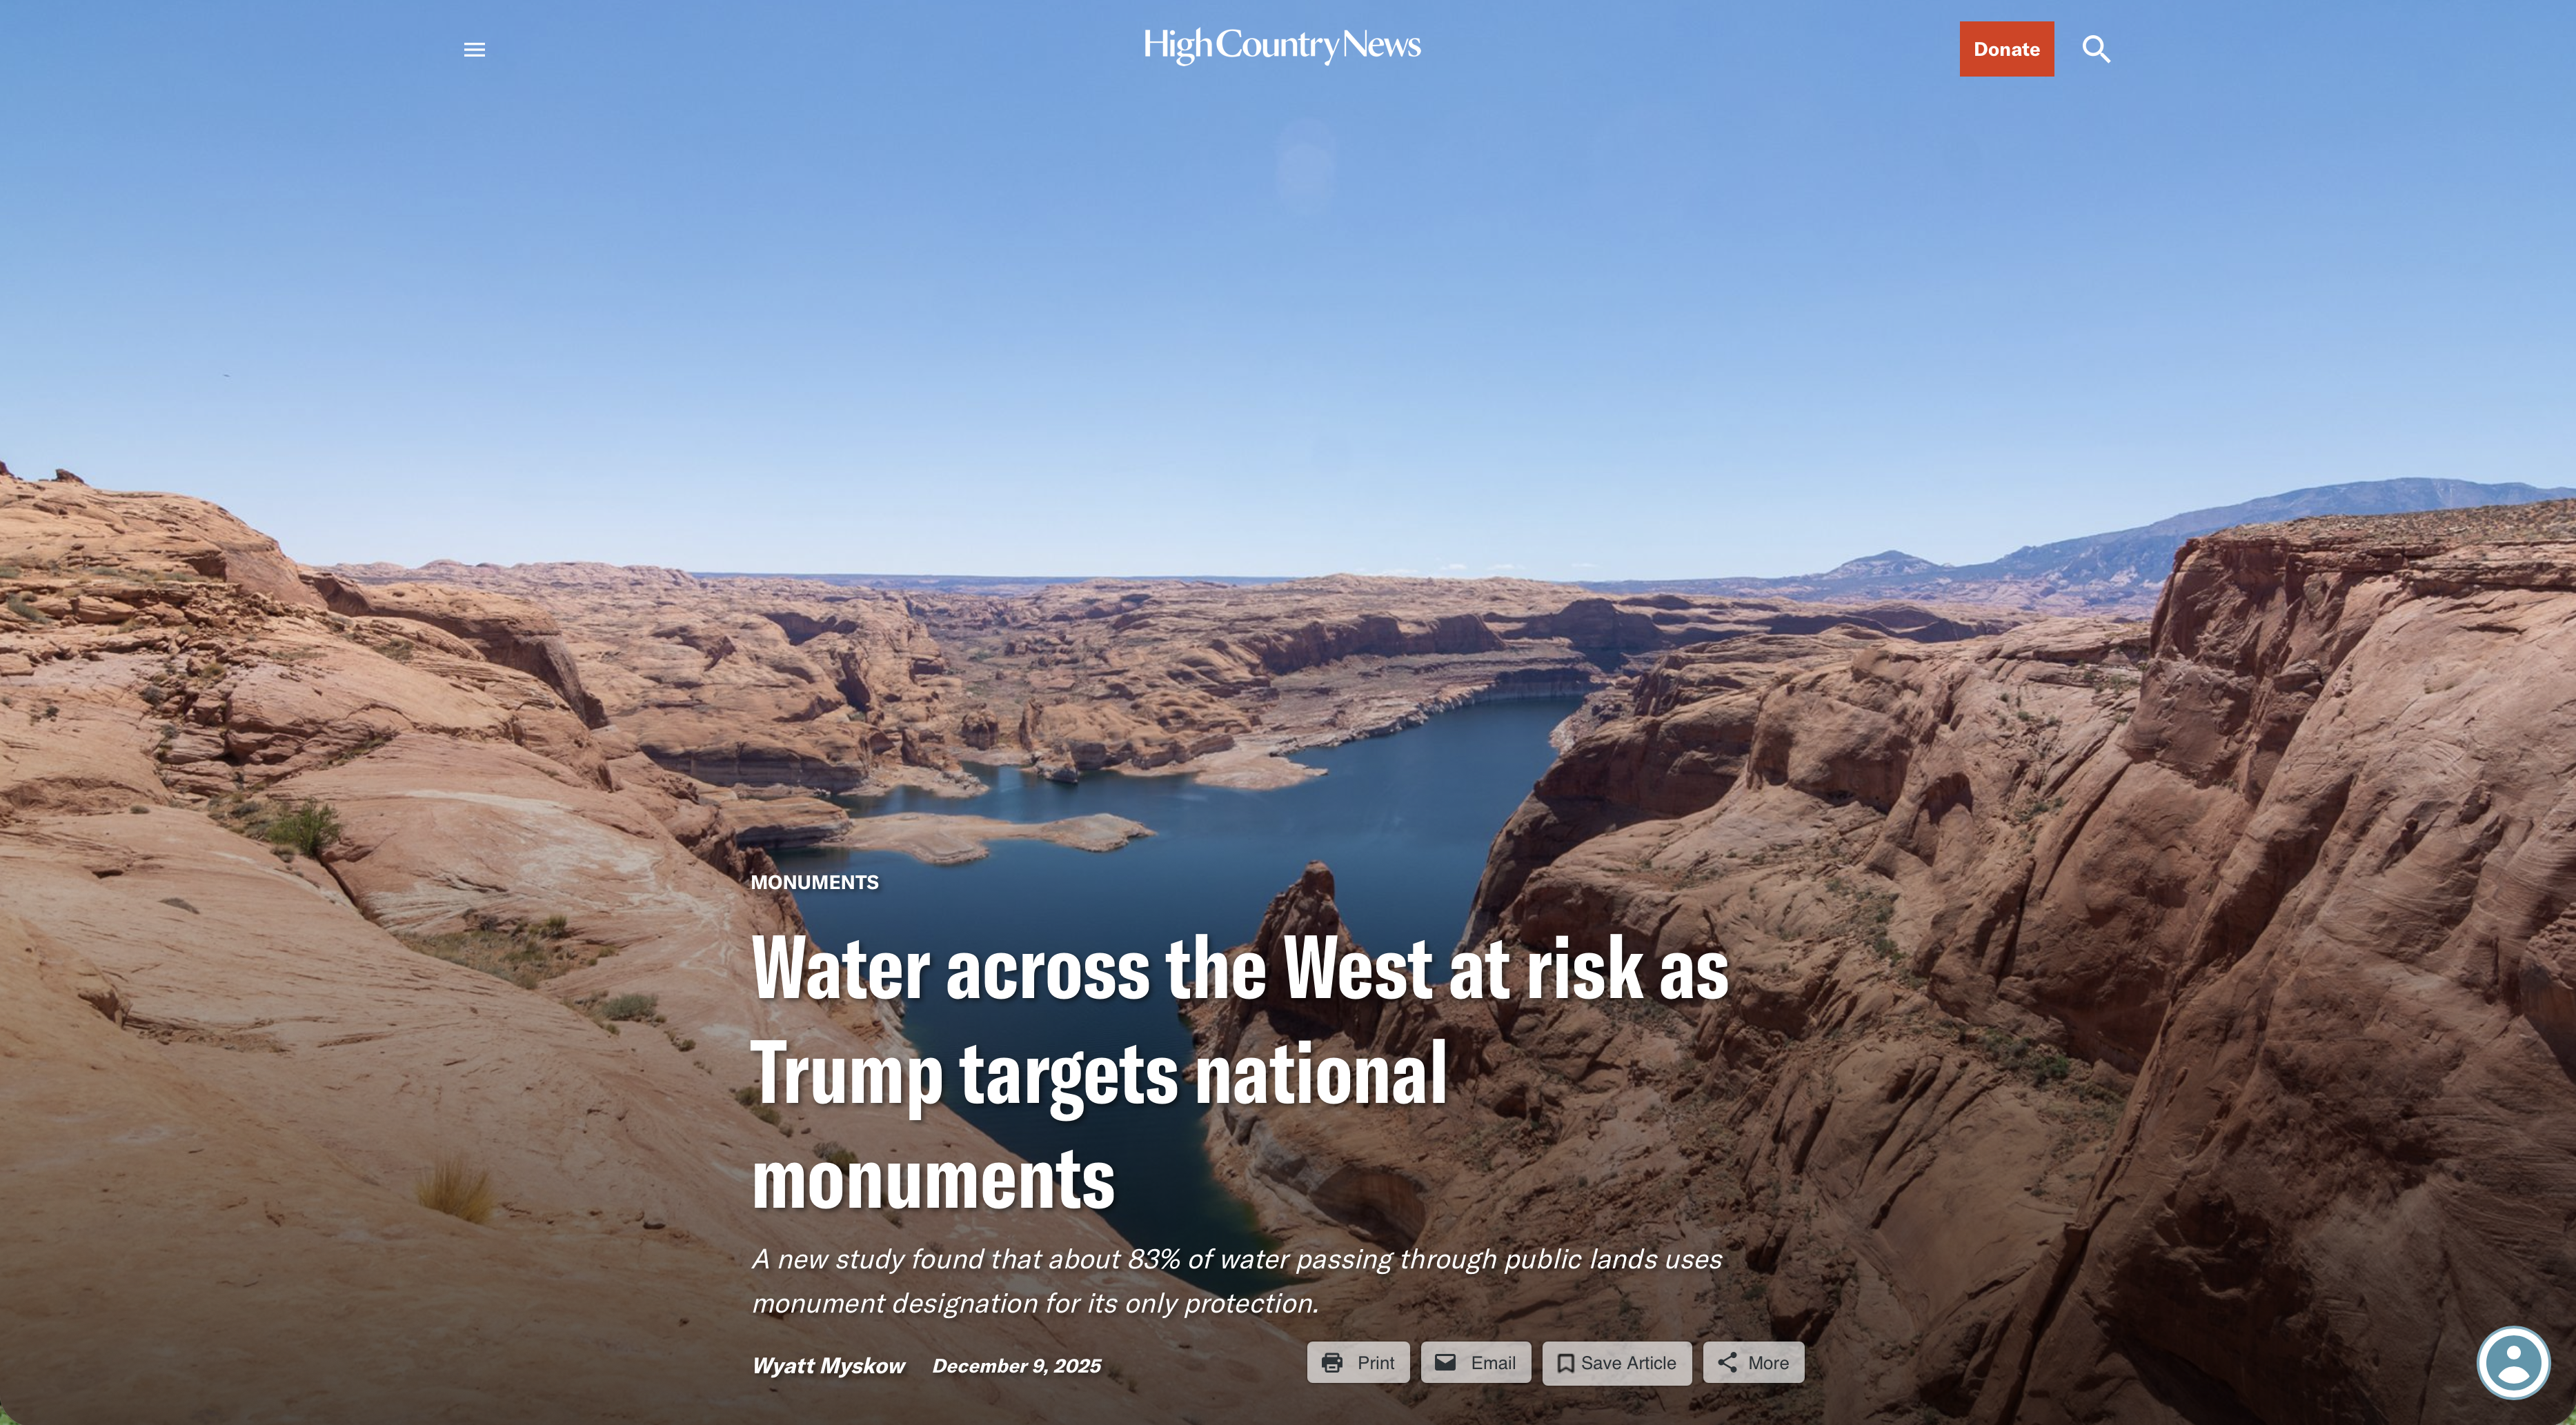
Click the link to read the article on the High Country News website (Wyatt Myskow):

December 9, 2025

This story was originally published bInside Climate News and is republished here through a partnership with Climate Desk.

The 31 national monuments designated since the Clinton administration, which could be downsized as the Trump administration pushes to open more public lands to extractive industries, safeguard clean water for millions of Americans, according to a new analysis from the Center for American Progress.

Using geospatial data to quantify the miles of rivers and watersheds within the studied national monument boundaries, as well as the number of users who depend on that water, the report found that the water supplies for more than 13 million Americans are directly provided by watersheds within or downstream of these national monuments. About 83% of the water passing through these public lands has no other protection besides the monument designations, it found.

National monuments protect more than 21,000 miles of waterways across the U.S., nearly twice as much waterway mileage as the National Wild and Scenic Rivers System, the analysis also determined.

The report comes as the Trump administration weighs downsizing or revoking the designation of  some national monuments.

Corn Springs Chukwalla Mountains California. By Michael Dorausch from Venice, USA – Corn Springs CA, CC BY-SA 2.0, https://commons.wikimedia.org/w/index.php?curid=41004589

In March, the Trump administration announced it would eliminate California’s Chuckwalla and Sáttítla Highlands national monuments before removing language from a White House fact sheet announcing that decision. The following month, The Washington Post reported that the administration was considering downsizing or eliminating six national monuments, and in June, the U.S. Department of Justice issued an opinion that the president has the power to rescind national monument designations, backtracking on a decades-old determination on the matter.

Stone and evening light, Bears Ears National Monument, Utah. Jonathan P. Thompson photo.

During Trump’s last term, Bears Ears and Grand Staircase-Escalante national monuments, established by the Obama and Clinton administrations, respectively, were shrunk to fractions of their original sizes, but they were restored by President Joe Biden after he took office.

If national monuments are downsized or eliminated, the areas surrounding a waterway will lose protections from extractive industries, including oil and gas drilling, mining and grazing. Contamination from those industries could seep into streams and, in turn, rivers. Those industries also use water, sometimes vast amounts in arid regions, further reducing the supply that flows to nearby communities. (In certain cases, some mining and grazing are already permitted on national monument lands, but the activities are limited in scale and more regulated than they are outside the monuments.)

“Landscapes and waterways go hand in hand,” said Drew McConville, a senior fellow for conservation policy at the Center for American Progress and a co-author of the report. “The clean water depends on what comes into them from natural lands … Just protecting the wet stuff itself doesn’t guarantee that you’re keeping [water] clean and durable.”

The portion of historically marginalized communities living within the watersheds of the national monuments is greater than the average for watersheds nationally, it found. Twenty-three of the monuments studied are also found in regions expected to face water shortages due to climate change in the coming decades, making the arid regions downstream even drier.

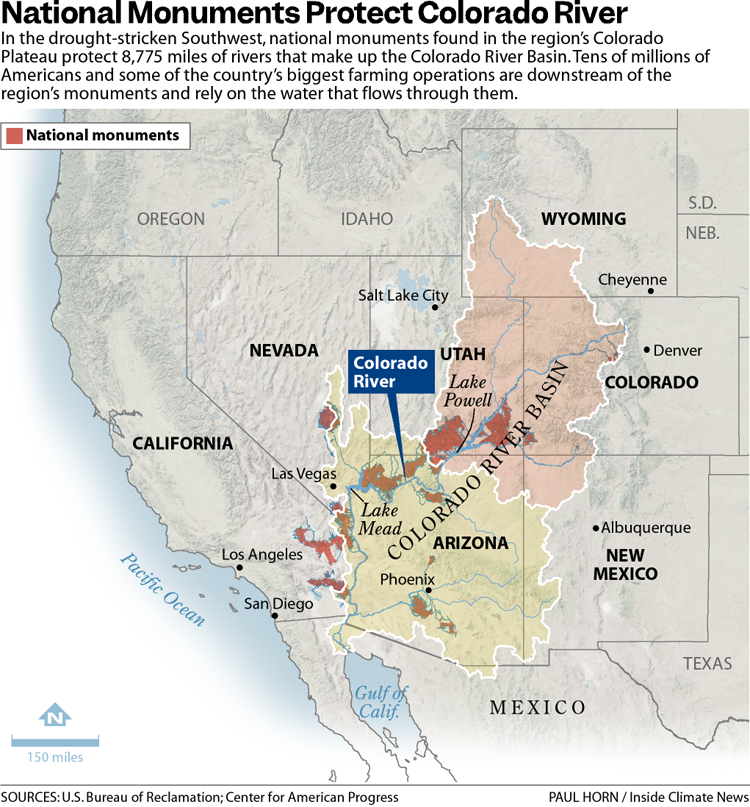
Grand Staircase-Escalante National Monument, for example, protects 2,517 miles of waterways, according to the analysis, and nearly 90% of the watersheds within the monument are expected to see declines in their water levels. The monument straddles the Upper and Lower Colorado River Basins, with the Paria and Escalante rivers flowing within its boundaries and Lake Powell, the nation’s second-largest reservoir, just to its south. 

The monument is often thought of as a sparse, arid region, which it is, said Jackie Grant, the executive director of Grand Staircase Escalante Partners, a nonprofit focused on protecting the monument that has spent $11 million to protect the Escalante River watershed and all its tributaries. It remains vital to the Colorado River System, which millions of people in the Southwest rely on. Grand Staircase-Escalante helps slow water from the Paunsaugunt Plateau in Bryce Canyon National Park, much of which starts as snowpack in the park before melting and flowing downstream. 

“People don’t think of water when they think of Grand Staircase-Escalante National Monument,” Grant said. “So when we can bring this view of water and how important it is to the protection of the monument, it helps us put another building block in our case for supporting the monument, because not only is it important for the animals, the native plants, the geology and the paleontology, water plays a huge role in the monument, and the monument protects the water itself.”

The Antiquities Act of 1906 was signed into law by Theodore Roosevelt, for “… the protection of objects of historic and scientific interest” through the designation of national monuments by the President and Congress. National monuments are one of the types of specially-designated areas that make up the BLM’s National Conservation Lands. Some of the earliest national monuments included Devils Tower, the Grand Canyon, and Death Valley. They were initially protected by the War Department, then later by the National Park Service. More recently, the BLM and other Federal agencies have retained stewardship responsibilities for national monuments on public lands. In fact, the BLM manages more acres of national monuments in the continental U. S. than any other agency. This includes the largest land-based national monument, the Grand Staircase-Escalante National Monument in Utah featured here. National monuments under the BLM’s stewardship have yielded numerous scientific discoveries, ranging from fossils of previously unknown dinosaurs to new theories about prehistoric cultures. They provide places to view some of America’s darkest night skies, most unique wildlife, and treasured archaeological resources. In total, twenty BLM-managed national monuments, covering over five million acres, are found throughout the western U. S. and offer endless opportunities for discovery. Photos and description by Bob Wick, BLM.

Stretching across 1.87 million acres of public land, Grand Staircase-Escalante National Monument is one of the country’s most expansive national monuments, protecting scores of wildlife as well as archeological resources in southern Utah. But a nine-billion-ton coal deposit is buried in the center of the monument along with deposits of minerals, including uranium and nickel. The Trump administration has long touted boosting the country’s coal production, and has established a pro-mining agenda this year.

“It’d be very easy to contaminate either one of those rivers if mining were to take place in the center section of the monument,” Grant said. 

Margaret Walls, a senior fellow at Resources for the Future who has studied national monuments but was not part of this study, said national monuments are designated to protect cultural or historical landmarks, and it can be forgotten that they can also serve purposes like safeguarding water. Though she noted that even if monument protections are loosened, the areas remain federal lands, and their changes in status do not guarantee they will be developed. 

“We don’t protect waterways the way we do land,” Walls said, “we’re going to get those water benefits by protecting the land.”

Created by Imgur user Fejetlenfej , a geographer and GIS analyst with a ‘lifelong passion for beautiful maps.’ It highlights the massive expanse of river basins across the country – in particular, those which feed the Mississippi River, in pink.

Federal Water Tap, December 8, 2025: Congressional Reps Ask for Water-Related Matters in North American Trade Talks — Brett Walton (circleofblue.org)

Click the link to read the article on the Circle of Blue website (Brett Walton):

December 8, 2025

The Rundown

  • Members of Congress want Tijuana River cleanup and Rio Grande water deliveries discussed as part of the U.S.-Mexico-Canada trade agreement.
  • EPA publishes a lead service line data dashboard.
  • Reclamation finalizes an operating plan to increase water deliveries to farms in California’s Central Valley.
  • A water pipeline break disrupts the Grand Canyon’s South Rim services.
  • DOE advisory group recommends limiting scope of state Clean Water Act reviews.
  • NOAA assesses the 2025 harmful algal bloom in Lake Erie.

And lastly, bipartisan bills in Congress would compensate farmers hurt by PFAS.

“In Maine, PFAS contamination affecting many different sectors, including agriculture, has been discovered over the past several years. The presence of PFAS in wastewater sludge once spread as fertilizer has prevented some Maine farms from selling their products, thus leading to significant financial hardship for these family farmers.” – Sen. Susan Collins (R-ME) speaking on the Senate floor about the Relief for Farmers Hit with PFAS Act. The bill would provide financial aid to farmers affected by PFAS contamination.

The pot of money authorized in the bill could be used in several ways, the representatives say. Reimbursement for lost income. Soil and water testing. Remediation systems. Blood testing for farmers exposed to the chemicals.

By the Numbers

River Mile 58.4: Estimated location, as of December 2, of the saltwater “wedge” in the Mississippi River in southern Louisiana. Due to dry weather, the wedge – saltwater that pushed upriver due to weak flows – has advanced 12 miles since mid-November.

2.4: Severity of the Lake Erie harmful algal bloom in 2025, according to a NOAA assessment. That corresponds to a “mild” bloom – the second mildest since 2008. The severity rating is a measure of the bloom’s biomass, not its toxicity.

News Briefs

Tijuana River Sewage in Trade Talks
California Democrats in the House and Senate want chronic sewage problems in the Tijuana River to be part of trade talks between the U.S., Mexico, and Canada.

The representatives made their case in a letter to Jamieson Greer, the U.S. trade representative. The three countries are beginning to discuss revisions to the trade agreement that was signed in 2018.

The California contingent asked for:

  • a multi-year funding commitment from the Mexican government
  • expand the geographical scope of an infrastructure grant program to include projects in Mexico
  • more financing from the North American Development Bank
  • a permanent funding source
  • include a formal role for existing border river institutions in the trade agreement framework.

The Tijuana River Coalition, a public interest group, also asked the Office of the U.S. Trade Representative to consider sewage pollution in a revised trade agreement.

Tijuana River sewage is not the only cross-border water problem that U.S. representatives would like to see addressed in the trade talks.

Rep. Monica De La Cruz of Texas encouraged the USTR to include Rio Grande water sharing in the agreement and to use its dispute resolution process as a way to enforce accountability. The Lower Rio Grande Valley Water District Managers’ Association also asked for Rio Grande water disputes to be handled through the trade agreement.

Studies and Reports

Lead Service Line Data
The EPA published an online dashboard with data about the number of lead service lines for each public water system.

Public water systems were required to submit lead service line inventories to the EPA by October 2024. The agency estimates about 4 million lead drinking water lines in the country.

Central Valley Project Operating Plan
The Bureau of Reclamation finalized a new operating plan for the Central Valley Project, the federal canal system that delivers water south of the Sacramento-San Joaquin Delta.

The new plan, which will maximize water deliveries to farms, stems from an executive order requiring the agency to do so.

Permitting and Energy Development
A Department of Energy advisory group that represents oil and gas interests submitted a report recommending limiting the scope of state water-quality reviews.

Like many Republican-leaning groups, the National Petroleum Council wants to prevent states from blocking fossil fuel infrastructure through use of Section 401 of the Clean Water Act, which allows states and some tribes to review projects that could pollute their waters. Notably, New York denied a water-quality permit to the Constitution natural gas pipeline in 2016.

The council’s report calls Section 401 a “procedural chokepoint” in project permitting.

The Trump EPA is promoting a “specific and limited” use of Section 401 for water-quality considerations only.

National Renewable Energy Laboratory

On the Radar

More Renaming
The Department of Energy has renamed the National Renewable Energy Laboratory.

The new name is the National Laboratory of the Rockies.

Economic Effects of Permitting Requirements
The Congressional Budget Office is seeking information that would help it better model the economic and budgetary effects of changes in federal permitting requirements for infrastructure.

Send comments to communications@cbo.gov.

Grand Canyon Water Troubles
The National Park Service is closing hotels on the Grand Canyon’s South Rim to overnight guests due to breaks in the water pipeline that serves the area.

The 12-mile pipeline crosses the canyon. The park service is in the middle of a $208 million pipeline upgrade that it expects to complete in 2027.

Federal Water Tap is a weekly digest spotting trends in U.S. government water policy. To get more water news, follow Circle of Blue on Twitter and sign up for our newsletter.

Seven U.S. states and Mexico depend on the Colorado River, shown here in the Grand Canyon. But over the past century, the river’s flow has decreased by roughly 20 percent. (Bureau of Reclamation)

Assessing the U.S. Temperature and Precipitation Analysis in November 2025: November and fall rank among warmest on record and it was exceptionally dry across much of the East — NOAA

The aspens on the southern slope of the La Plata Mountains in southwestern Colorado were right in the middle of their autumn transformation during September 2025, with higher elevation clones already leafless and lower elevation ones still deep green. Jonathan P. Thompson photo.

Click the link to read the assessment on the NOAA website:

December 8, 2025

Key Points:

  • November was unusually warm nationwide, ranking as the fourth warmest on record, with five states setting November temperature records.
  • Meteorological fall ranked third warmest on record, with seven states setting fall temperature records.
  • Dry conditions dominated the eastern U.S., with the Southeast seeing its driest fall since 1978.
Map of the U.S. notable weather and climate events in November 2025.

Other Highlights:

Temperature

The average temperature of the contiguous U.S. (CONUS) in November was 46.8°F, 5.1°F above the 20th-century average, ranking as the fourth-warmest November in the 131-year record. Much-above-average warmth covered most of the western and central U.S., while much of the eastern third remained near average. Five states—Idaho, Nevada, Oregon, Texas and Utah—set new statewide records for November temperature, with Utah (44.4°F) surpassing its 2017 record by more than 1°F. New Mexico had its second-warmest November and Colorado, Oklahoma and Wyoming each recorded their third warmest. At the county level, 100 Texas counties set new records for their warmest average November temperatures, with 30 counties recording average daily highs more than 10°F above the 20th-century average.

November U.S. Mean Temperature Percentiles Map

For meteorological fall (September–November), the CONUS average temperature was 57.2°F, 3.7°F above average, ranking as the third-warmest fall in the 131-year record. Apart from the Carolinas, all CONUS states had fall temperatures more than 1°F above the 20th-century average, and seven states—Idaho, Nevada, New Mexico, Oregon, Texas, Utah and Washington—set new statewide fall temperature records. Nationwide, 275 counties—nearly 15 million people—experienced their warmest fall temperatures on record.

Alaska’s statewide November temperature was 17.3°F, 5.6°F above the 1925–2000 average, ranking in the warmest third of the 101-year period of record for the state. The state was especially warm across parts of the Interior and the North Slope, which had its fifth-warmest November on record—more than 11°F above the long-term average. For the fall season, Alaska’s average temperature was 30.2°F, 4.3°F above average and the tenth warmest on record.

For November, Hawai’i had an average temperature of 66.9°F, 0.4°F above the 1991–2020 average, ranking in the warmest third of the 35-year record. Fall temperatures also ranked in the warmest third of the historical record.

Precipitation 

November precipitation for the CONUS was 1.70 inches, 0.53 inch below average, ranking in the driest third of the 131-year record. Precipitation was below average across much of the U.S. east of the Mississippi River, with the Southeast region experiencing its sixth-driest November on record. The Southeast region averaged just 1 inch of rainfall for the month—less than 35% of the 20th-century average. South Carolina had its second-driest November, marking its lowest November rainfall since 1931, while Florida received less than 15% of its average rainfall for its third-driest November. In contrast, precipitation in the West was mixed; portions of California and the Southwest recorded above-average rainfall, while parts of the northern Great Basin, Northwest and Rockies received below-average precipitation.

November 2025 U.S. Total Precipitation Percentiles

The fall season (September–November) was also dry for the CONUS, with a total of 5.97 inches of precipitation, 0.91 inch below average, ranking in the driest third of the record. While much of the Northwest and Rockies received near-average precipitation, wetter-than-average conditions prevailed in the Southwest and Plains, with several counties in southern California and southeastern Arizona recording their wettest fall on record. Further east, below- to much-below-average precipitation was seen across the middle and upper Mississippi Valley and Great Lakes, as well as a region stretching from the southern Plains across much of the South, Southeast, Mid-Atlantic and Northeast. The Southeast region recorded its driest fall since 1978 (sixth driest on record), with Georgia receiving less than half of its seasonal average for its fourth-driest fall. However, in contrast to the widespread dry trend in the east, parts of the Ohio Valley received above-average rainfall.

Alaska’s average monthly precipitation in November was 2.99 inches, 0.40 inch below average, ranking in the middle third of the 101-year record. The September–November total was 12.91 inches, 0.59 inch above average and in the middle third of the record.

Precipitation across Hawai’i in November averaged 5.28 inches, 1.19 inches below average, ranking in the middle third of the 1991–2025 record. Fall precipitation was 11.70 inches (4.30 inches below average), ranking in the driest third of the record.

Drought

According to the December 2 U.S. Drought Monitor report, about 41.4% of the contiguous U.S. was in drought, down about 2.3% from the beginning of November. Drought contracted or was reduced in intensity across much of the western U.S., particularly the Southwest, Great Basin and parts of the Rockies and Northwest, as well as in portions of the middle Mississippi and Ohio Valleys and the Northeast. In contrast, drought developed or intensified significantly across the Southeast and in parts of the southern Plains and upper Mississippi Valley.

Monthly Outlook

Above-average temperatures are likely across much of the southern tier, from the central Rockies through the southern Plains and Southeast, while below-average temperatures are favored in the northern Plains, upper Midwest, Great Lakes and Northeast. Above-average precipitation is expected in parts of the northern Rockies and northern Plains, and along the Gulf Coast through the Carolinas and into the Northeast, while below-average precipitation is favored across the central Plains and Florida Peninsula. Visit the Climate Prediction Center’s Official 30-Day Forecasts for more details.

Drought improvement or removal is expected in parts of the Northwest and northern Rockies, the western and central Gulf Coast, much of Alabama and Georgia, the Great Lakes, the Mid-Atlantic, the Northeast and Hawai’i. In contrast, drought is likely to persist or worsen across the central and southern Rockies, portions of the Plains, the middle and upper Mississippi Valley and the Florida Peninsula, with expansion likely in western Texas and eastern New Mexico. Visit the U.S. Monthly Drought Outlook website for more details.

Significant wildland fire potential in December is above normal across portions of western Texas and western Oklahoma, as well as southern Georgia and north-central Florida. For additional information on wildland fire potential, visit the National Interagency Fire Center’s One-Month Wildland Fire Outlook.


For more detailed climate information, check out our comprehensive November 2025 U.S. Climate Report scheduled for release on December 11, 2025. For additional information on the statistics provided here, visit the Climate at a Glance and National Maps webpages.

The latest Intermountain West briefing is hot off the presses from Western Water Assessment

Click the link to read the briefing on the Western Water Assessment website:

December 8, 2025 – CO, UT, WY

A hot and dry November left the Intermountain West with much below average snowpack conditions. November temperatures were four degrees above average region-wide and much of Utah and Wyoming baked under mean temperatures that were six to ten degrees above average. High temperatures coupled with mostly below normal precipitation caused low snow water equivalent (SWE) and worsening drought conditions.

November precipitation was much below average for much of the region, especially in Wyoming, northern Colorado and northern Utah, which received less than half of normal precipitation. Much above average November precipitation was observed in southern Utah and eastern Colorado. Record dry Novembers were observed at thirteen locations in Wyoming, ten locations in Colorado and five locations in Utah. Despite dry November conditions, regional water year precipitation is near to above average except for eastern Colorado and southeastern Wyoming.

November was an extremely warm month, especially in western Wyoming, where monthly temperatures were more than eight degrees above average. The entire region observed November temperatures that were at least four degrees above average, with all of Utah, nearly all of Wyoming and western Colorado experiencing temperatures that exceeded six degrees above average. Record warm October conditions were observed in western Colorado, southwestern Wyoming and throughout Utah.

Record low SWE conditions exist at many locations in Colorado, Utah and Wyoming. A hot and dry November left most regional river basins with SWE conditions at less than 50% of average, with the least snow in the Six Creeks near Salt Lake City, where December 1st SWE is 22% of median. Slightly better SWE conditions exist in southern Colorado and southern Utah.

Regional drought coverage expanded slightly during November, increasing from 51% five weeks ago to 54% on December 2. Eastern Colorado and eastern Wyoming remain drought-free, but drought emerged along the northern Front Range and adjacent plains. Coverage of drought in Utah dropped below 100% for the first time in five months. Utah and Colorado were last free from drought six years ago, while the current drought in Wyoming began five years ago.

West Drought Monitor map December 2, 2025.

A NOAA La Niña Advisory is still in effect as eastern Pacific Ocean temperatures are below average. Weak La Niña conditions are expected to transition (60% probability) to neutral conditions by early 2026. The NOAA December Precipitation Outlook suggests above average precipitation for most of Wyoming. For the winter months (Dec-Feb), there is an increased probability for above average temperatures in Utah and southwestern Colorado. In Wyoming, there is an increased probability for above average precipitation and below average temperatures.

Record high temperatures drive record low snowpack. On December 1, record low SWE conditions were present at 52 regional Snotel sites in northern Colorado, northern Utah, and across Wyoming. Despite very low snowpack conditions, water year precipitation is above average for the region, except in northern Colorado. During early October, daily precipitation records were set in Utah and Colorado, including widespread flooding in southwest Colorado. Due to the tropical origin of those storms, nearly all precipitation fell as rain. Contrasting precipitation, water year temperatures are much above average with record high temperatures observed in parts of western Colorado, eastern Utah, and southwestern Wyoming. Consequently, the current snow drought is primarily the result of high temperatures rather than low precipitation. While October precipitation generally fell as rain in regional mountains, above average precipitation has increased soil moisture, which could help to bolster the efficiency of runoff in 2026.