Three major water trials set for 2026: Cases involve #RioGrande Water Conservation District, local farmers, city of Alamosa — @AlamosaCitizen

Crop circles in the San Luis Valley. Credit: Alamosa Citizen

Click the link to read the article on the Alamosa Citizen website:

July 16, 2024

The biggest water trials facing the Rio Grande Water Conservation District and local farmers are set for 2026.

Peter Ampe, attorney for the Rio Grande Water Conservation District, told board members Tuesday that three major water cases are set for trial in 2026. The cases are:

  • The fourth Plan of Water Management for Subdistrict 1 scheduled for six weeks starting Jan. 2, 2026
  • Sustainable Water Augmentation Group and its proposed alternative augmentation plan for a group of irrigators in Subdistrict 1 set for a six-week trail starting June 29, 2026
  • The city of Alamosa and its confined aquifer case set for a three-week trial starting on Oct. 19, 2026

Each of the cases is subject to settlement ahead of any trial. Ampe said the city of Alamosa’s case to guarantee itself more water for future expansion has the best chance of agreement before a trial would begin.

The fourth Plan of Water Management for Subdistrict 1 is a key document that outlines future strategies to recover the unconfined aquifer of the Upper Rio Grande Basin. Farmers in the subdistrict, which covers parts of Alamosa County around Mosca-Hooper and Rio Grande County, are under pressure from state water managers to restore the aquifer.

The subdistrict’s updated water management plan has been approved by the state engineer and needs approval from the District 3 Water Court to go into effect.

The alternative augmentation plan proposed by the Sustainable Water Augmentation Group had the start of a water trial in 2023 only to have the trial come to a sudden end when the group withdrew its application. The application withdrawal came after the town of Del Norte terminated an agreement to lease water to the SWAG farmers as a replacement source for groundwater pumping by SWAG members.

Greg Higel, board chair of Rio Grande Water Conservation District, said the board will have to prioritize spending on attorney fees in its annual budgets.

MORE:
 Alamosa Citizen maintains an extensive archive of water stories.

(I’m Your) Heat Pump – Michael T Roberts and Will Hammond Jr. – Official Music Video — SwitchIsOn.org #ActOnClimate

The official music video for (I’m Your) Heat Pump by Michael T Roberts, featuring Will Hammond Jr.

Opinion: ‘#DoloresRiver Canyons very foundation of Ute Mountain Ute identity’ — The #Durango Herald

Dolores River near the confluence with the San Miguel River. Photo credit: Jonathan P. Thompson

Click the link to read the guest column on The Durango Herald website (Regina Lopez-Whiteskunk). Here’s an excerpt:

The Dolores River Canyons represent a significant portion of the cultural heritage for the Ute People that serve as a place of spiritual connection, a place to connect with our ancestors’ stories and traditional practices. These lands are not merely scenery; they are the very foundation of the Ute Mountain Ute identity. Increased mining would not just disrupt the delicate balance of the ecosystem, it would sever the cultural ties that bind my people to part of our ancestral home.

The future of the Ute Mountain Ute Tribe, and Indigenous communities across the country, lies in the enduring strength of our cultural heritage. Protecting the Dolores River Canyons is not just about safeguarding the environment; it’s about ensuring that future generations of Indigenous youth can grow up connected to their land, steeped in the traditions of their ancestors. Imagine the richness of a future where Ute children learn about their history by exploring the canyons, not by reading about the environmental devastation wrought by a bygone mining industry.

Let us choose the path that honors the past, protects the present and secures a brighter future for generations to come. Let us choose to leave a legacy of respect and cultural preservation, not one of environmental destruction and broken promises.

Invasive species discovered in #ColoradoRiver is capable of wiping out ecosystems, causing costly damage — The #Denver Post #COriver

Click the link to read the article on The Denver Post website (Elise Schmelzer). Here’s an excerpt:

July 18, 2024

An invasive species capable of wiping out entire aquatic ecosystems and causing millions of dollars in damage to infrastructure has been found for the first time in the Colorado River, the most important river in the American Southwest. Colorado Parks and Wildlife officials on Tuesday announced the discovery of zebra mussel larvae in the river east of Grand Junction. The mussels are nearly impossible to remove and pose an extreme risk to the critical river, its wildlife and its infrastructure, experts and state officials said. The discovery of the mussels so far upstream on the 1,450-mile river means the species could easily spread downstream and take over large swaths of the Colorado, said Reuben Keller, a professor who studies aquatic invasive species in the School of Environmental Sustainability at Loyola University Chicago. There is no effective way to remove the mussels from a river once they are established, he said…

The Government Highline Canal, near Grand Junction, delivers water from the Colorado River, and is managed by the Grand Valley Water Users Association. Prompted by concerns about outside investors speculating on Grand Valley water, the state convened a work group to study the issue.
CREDIT: BRENT GARDNER-SMITH/ASPEN JOURNALISM

Colorado Parks and Wildlife found the first zebra mussel larva — called a veliger —  on July 1 during routine testing in the Government Highline Canal, which is diverted from the Colorado River just east of Grand Junction. On July 8, CPW staff collected samples from two locations upstream of the canal diversion. They found a single veliger in each sample. CPW staff have not yet found adult mussels, but they plan to conduct increased sampling. Slower sections of water, like pools and eddies, are more susceptible to mussel infestation, according to the agency. Anyone who uses the river or surrounding waters needs to clean, drain and dry any watercraft or equipment, CPW spokesman Rachael Gonzales said.

“We’re looking at what’s next,” she said. “It’s going to be very difficult — if not impossible — to remove and eradicate them in a system as large and complex as the Colorado River.”

While the zebra mussel is new to the river, the closely related and equally pernicious quagga mussel has established a population further downstream. Large infestations have taken root in the system’s largest reservoirs — Lake Mead and Lake Powell — and caused millions of dollars in damage to dam infrastructure.

The Supreme Court’s Overruling of Chevron Deference — Audubon

Whooping Crane. Photo: Kenton Gomez/Audubon Photography Awards

Click the link to read the release on the Audubon website (Sam Wojcicki):

July 10, 2024

In June, the Supreme Court of the United States issued a decision in Loper Bright v. Raimondo on the deference courts must give to federal agencies interpreting and implementing through regulations the laws they administer—a doctrine informally known as “Chevron deference.” This decision will impact how critically-important environmental laws that Audubon cares about – such as the Endangered Species Act, National Environmental Policy Act, Clean Water Act, and Clean Air Act – will be implemented moving forward.

What is Chevron deference? 

Chevron deference was a result of a unanimous 1984 Supreme Court decision in the case of Chevron v. Natural Resources Defense Council. Under Chevron, when an agency adopts regulations implementing a statute, if an agency’s interpretation of a statute was challenged in court, the court must answer two questions before the challenge can prevail. First, it must assess whether the United States Congress has spoken directly to the question at issue. If Congress had, the agency’s action must align with the law. However, if Congress had not provided clear guidance on a question, the statute is ambiguous, and the court must assess whether the agency’s action is based on a reasonable interpretation of the law. If the agency had remained within the bounds of what can be reasonably construed to be Congress’s intent in passing the underlying law, the court must defer to the federal agency. 

What did the Supreme Court decide? 

Under Loper, the Supreme Court held that under the Administrative Procedures Act, courts may not defer to a federal agency’s interpretation of the law when the statute is ambiguous. The decision held that a court reviewing agency actions must “decide all relevant questions of law.” Under Loper, judges may be required to determine technical aspects of science or other detailed aspects related to how agencies should implement or enforce laws.  Although the agencies’ interpretation will be given “the most respectful consideration,” the agencies’ interpretation cannot replace the courts’ judgment. 

What are the possible impacts to conservation policies important to Audubon? 

In practice, Chevron deference allowed Congress to write laws to protect the environment while allowing Executive Branch agencies to implement the intent of the law using their technical expertise in complicated environmental matters. Under the Chevron doctrine, Congress could choose when to utilize the expertise of agency staff and when to weigh in explicitly. For 40 years, the Chevron deference was foundational to the courts’ upholding regulations protecting the environment.  With the deference, it provided enhanced certainty to agencies implementing broad laws passed by Congress. 

The implications of the decision are likely to present challenges to conservation efforts supported by agency regulations and cause increased litigation and forum shopping. By removing the deference, we may be unable to take full advantage of the scientific expertise and practical experience of federal agencies. The likely increase in litigation also will slow the successful implementation of laws designed to address climate and biodiversity challenges that protect birds and communities. 

To minimize these impacts, Congress should consider providing additional guidance on implementation when passing laws, avoid ambiguity, and enshrine aspects of agency authority where necessary to ensure effective policy implementation. 

On the other hand, environmentalists may find “wins” when challenging regulations that are incompatible with our goals, such as anti-environmental regulations. In this instance, Congress’s passing detailed laws could ensure that sound environmental policies are advanced regardless of any administration’s position on these issues.  

What are the next steps?

Policies informed by science and expertise are urgently needed to ensure that birds and people are protected. North America has lost 3 billion birds in the past 50 years, and Audubon’s science shows that two-thirds of North American bird species are at risk of extinction from climate change. 

Audubon will closely monitor how the Supreme Court’s decision affects important environmental laws in the United States. Our commitment to advancing policy to protect bird habitats and address climate change remains unchanged. We will continue to work in partnership with federal, state, local, and tribal governments to ensure a future where birds and people thrive. 

#Colorado Parks & Wildlife, Denver Zoo Conservation Alliance release endangered boreal toad tadpoles into wild near #Creede

CPW’s Daniel Cammack, left, works alongside staff from the Denver Zoo Conservation Alliance to stock boreal toad tadpoles on June 20, 2024. Photo courtesy of Denver Zoo Conservation Alliance.

Click the link to read the release on the Colorado Parks & Wildlife website (John Livingston and Jake Kubié):

July 16, 2024

Amphibian and Aquatic Species Experts from Both Organizations Released More Than 2,200 Tadpoles in High-Altitude Wetlands

In 2021, Denver Zoo Conservation Alliance (DZCA) and Colorado Parks and Wildlife (CPW) launched a new initiative aimed at boosting the state’s population of boreal toads, a species listed as endangered in Colorado and New Mexico. Starting with 95 adult toads from CPW’s Native Aquatic Species Restoration Facility in Alamosa, experts from DZCA spent more than six months preparing them for breeding and nurturing their offspring leading up to their release into the wild.
 
On June 20, 2024, teams from DZCA and CPW trekked wetlands near Creede to introduce more than 2,200 boreal toad tadpoles that officials hope could eventually host an established population of rare amphibians. This was the second successful breeding and release, including the reintroduction of more than 600 tadpoles in the Gunnison National Forest in 2022.
 
MEDIA: Photos and Video of Boreal Toad Tadpole Release on June 20, 2024
 
“This successful breeding and release effort was the result of a tremendous amount of hard work and planning by our Animal Care and Field Conservation teams and our partners at Colorado Parks and Wildlife,” said Brian Aucone, chief conservation officer at Denver Zoo Conservation Alliance. “We’re committed to continuing this effort with CPW for many years to come and doing our part to make sure this important species remains part of Colorado’s ecosystem for future generations.”
 
Once common in montane habitats between 7,000-12,000 feet in the Southern Rocky Mountains, the boreal toad has experienced dramatic population declines over the past two decades. The decline appears to be related to habitat loss and primarily infection by the chytrid fungus, which can infect most of the world’s 7,000 amphibian species and is linked to major population declines and extinctions globally. Officials estimate there may be as few as 800 wild adult toads left in Colorado. 
 
“It was a very special day to join our partners from Denver Zoo to release boreal toad tadpoles that the Zoo produced at their facility,” said Daniel Cammack, Southwest Region Native Aquatic Species Biologist with CPW. “Consistent propagation of boreal toads in captivity has been the major missing link in our conservation efforts. In the past, we relied solely on collecting fertilized eggs from wild populations to grow into tadpoles at the hatchery and stock at translocation sites. Thanks to the Zoo’s expertise and hard work, we are able to increase our capacity and get more toads out at more locations. This is a critical partnership that we hope will translate to an increase in populations of this unique amphibian across our state.”
 
Denver Zoo Conservation Alliance has been conserving endangered and critically endangered amphibian species for more than 18 years. In 2018, DZCA became the first zoo in the Northern Hemisphere to successfully breed critically endangered Lake Titicaca frogs, and has since provided more than 250 healthy frogs to zoos and aquariums in the U.S. and Europe. In 2021, the organization successfully bred critically endangered Panamanian golden frogs as part of the Association of Zoos and Aquarium’s Species Survival Plan. In 2022, DZCA and CPW released the first brood – more than 600 tadpoles – from the joint initiative to support boreal toads in a remote wetland in Gunnison National Forest.
 
CPW has devoted significant resources for more than 30 years toward boreal toad research and continues to explore ways to recover the species. Specifically, CPW researchers focus on developing methodologies for reintroducing toads in historically occupied habitats, detecting chytrid fungus in the wild, marking and identifying individual toads and improving breeding success at the Native Aquatic Species Restoration Facility, which plays a critical role in the state’s efforts to restore populations of boreal toads.
 
Officials from DZCA and CPW estimate that it will take many years to bring the species back to a level where it is secure in the Southern Rocky Mountains and expect the collaboration to be a multi-year program. Additionally, as part of the wild release program, DZCA launched a community science project where volunteers monitor the species’ high-country habitat to help officials understand the health of current wild populations and determine suitable locations for future reintroduction of toads bred at DZCA’s campus in Denver. For more information, visit DenverZoo.org.

Boreal Toad Release June 20, 2024. Photo credit: Colorado Parks & Wildlife

Opinion: ETA grant brings hope to Indigenous farmers — The Santa Fe New Mexican

The orange plume flows through the Animas across the Colorado/New Mexico state line the afternoon of Aug. 7, 2015. (Photo by Melissa May, San Juan Soil and Conservation District)

Click the link to read the article on The Santa Fe New Mexican website (Anita Hayes). Here’s an excerpt:

Jul 6, 2024

As the CEO of Northern New Mexico Indigenous Farmers, I see firsthand the struggles our farmers face every day. Our community, inherently connected to our land and rich in agricultural traditions, has been hit hard by an unreliable water system that makes it tough to keep our crops healthy and our livelihoods secure. The Hogback pump station, which should be a dependable source of water, often breaks down, causing us to lose crops and hope. Today, I want to share why securing Energy Transition Act funding for a new pump station is so crucial and how this project will bring much-needed hope to our community.

This image was taken during the peak outflow from the Gold King Mine spill at 10:57 a.m. Aug. 5, 2015. The waste-rock dump can be seen eroding on the right. Federal investigators placed blame for the blowout squarely on engineering errors made by the Environmental Protection Agency’s-contracted company in a 132-page report released Thursday [October 22, 2015]

Our organization was born out of the Gold King Mine spill, a disaster that laid bare the lack of support for our farmers. The spill made our existing problems worse, showing that without quick action, our farming future was at risk. One of the biggest issues we face is our broken-down irrigation system, specifically the Hogback pump station. Its frequent failures leave us with no reliable water supply for our crops, creating a constant state of anxiety for our farmers and resulting in fallow land. This situation can’t go on if we want our community to thrive. That’s why we applied for the ETA grant from New Mexico’s Economic Development Department, and I’m thrilled to announce we were awarded $3.6 million in funding to replace our failing pump station. This isn’t just a fix for our water problems; it’s a lifeline for our entire community. The new pump station, complete with its own solar power, will make sure our farms get a steady and reliable supply of water, leading to healthier crops and more stable incomes for our farmers. But the benefits of this project go beyond water. A reliable pump station will help us rebuild our agricultural sector, providing jobs and boosting local businesses that rely on farming. It will also help us keep our cultural traditions alive, as farming is more than just work for us — it’s a way of life that connects us to our heritage and our land. This project will also bring our community together. Alongside the new pump station, we plan to offer training for our farmers on modern irrigation techniques and sustainable land management. This training will give our farmers the tools they need to use water more efficiently and improve their yields. By learning and growing together, our community will become stronger and more united.

What Makes a Heat Wave? — @ColoradoClimate Center Blog

Click the link to read the post on the Colorado Climate Center Blog (Peter Goble):

July 31, 2024

Recent Temperatures  

Colorado is currently in the throes of yet another heat wave. Many daily temperature records and some monthly temperature records will be threatened this week across northern and central Colorado. We will see temperatures flirting with the triple digits up and down the Front Range and Urban Corridor. The image below of the National Weather Service 5-day forecast for Denver shows persistent mid-to-upper 90s. 

Just earlier this month we saw a heat wave that threatened all-time high temperature records across the state (July 12th – July 14th). The details of the last heat wave can be found in our last blog. For this blog I thought it would be fun to explore heat waves in a bit more detail. First, we’ll examine some of the record heat from around the state. Then we will explore all the factors that need to come together to produce record heat. 

Records Around the State 

Most of the population centers in Colorado have all-time high temperature records between 100 °F and 110 °F. Records on the Urban Corridor from Fort Collins down to Colorado Springs range from 101 °F to 104 °F. Pueblo gets a bit hotter, with a record of 109 °F. The terrain in western Colorado is extremely complex, and so are the high temperature records. Areas in the valleys such as Grand Junction and Montrose have seen temperatures max out at values a little bit above the Front Range (107 °F and 106 °F respectively). The hottest temperatures ever recorded in Colorado have occurred on the Eastern Plains, with records from 109 °F to 115 °F in Las Animas; this is our state record. People travel from far and wide to enjoy our Colorado mountains in the summertime, and one of the biggest reasons is the thinner, cooler, drier air. Record high temperatures in the mountains are much cooler. Dillon, CO in Summit County has famously never experienced a 90-degree day. Maximum temperature records only get cooler as one travels higher in elevation. The figure below shows record high temperatures across the state. For the sake of comparison, I have also included the maximum temperature record of 80 °F at Slumgullion Pass, which sits at 11,300 feet elevation.  

We see in the figure above an obvious relationship between the maximum temperature record observed at a station and elevation. It is much more difficult to see extremely high temperatures in the thin mountain air than in the relatively think air over the eastern plains. This probably feels somewhat intuitive, but can we explain why this is using physics? Why can’t the mountains get as warm as the plains? Why are some summers hotter than others, and why are some heat waves worse than others? The remainder of this blog is devoted to examining the anatomy of a heat wave in detail, and understanding what weather forecasters might be looking for when forecasting in the heat of summer. 

Anatomy of Hot Temperatures – What causes the hottest weather on record, or even the hottest weather of the year, and how can forecasters see it coming? To produce the highest possible temperatures, we need several factors to come together: we need the right time of day, the right season, the right large scale atmospheric pattern, stable enough air, and the right microscale conditions. Let’s explore all of these factors! 

Time of day: Of course our hottest temperatures occur during the daytime when the sun is out, but how come the heat of the day occurs in the mid-to-late afternoon when the sun is shining most directly on us at noon? Whether or not the surface temperature is increasing or decreasing is determined by whether the earth’s surface is gaining more energy than it is losing. The energy input from the sun will be greatest at noon, but energy inputs continue to be greater than outputs throughout the afternoon, so the temperature continues to rise. This effect is shown in the figure below, which comes from a University Center for Atmospheric Research COMET module. The yellow curve shows the intensity of the sunshine throughout the day. The blue curve shows outgoing radiation, or how much energy is trying to escape from the earth’s surface out to space. As temperatures rise, this number goes up. You can think about it as the earth is “trying” to cool down. The red curve shows temperature throughout a typical day. If the yellow curve is above the blue curve, the temperature increases. If the blue curve is above the yellow curve, the temperature decreases. The maximum and minimum daily temperatures occur at overlapping points. 

If you live in Colorado, summer temperatures will probably top out some time between 3:30 and 5:00 PM in summertime. This is 2:30-4:00 in standard time, or approximately 2.5-4 hours after solar noon. We can see a good example of this using the Fort Collins weather station from our last heat wave on July 12th, 2024. The temperature climbed rapidly throughout the morning, becoming close to 100 °F by 1:00 PM MDT (12:00 PM MST, solar noon), and then slowly continuing to creep upward (with small fluctuations) for the next several hours. As late afternoon approached, the energy input from the sun could not keep up with the energy output from the earth’s surface and the temperature began to fall. 

Season: We all know summer is the hottest time of year, and most of us intuitively understand why: the days are longer and the sun shines more directly on the land surface during the day. We can put a little bit of math behind this intuition. When the sun shines from directly overhead, it sends 1366 Watts/meter squared of radiative energy though the top of the atmosphere. Some of this energy will be reflected or absorbed before hitting the earth’s surface, but on a clear sky day most of it will be absorbed by the land surface, and in turn, rapidly heat up the near surface atmosphere. The sun’s energy is not truly “constant,” it fluctuates based on sunspot cycles. For the moment, let’s just call maximum output from the sun 100%, and the amount of energy we get from the sun at night 0%.  

The fraction of the sun’s energy that reaches the earth’s surface is a function of angle: how high is the sun in the sky? When the sun is directly overhead it is intense and beats directly down on the land surface. When it is on the horizon the energy is diffuse, hitting with a glancing blow. The earth’s tilt is 23.5 degrees, so in the northern hemisphere, we tilt a maximum of 23.5 degrees toward the sun in the summer and 23.5 degrees away from the sun in the winter. This means if you live in Boulder, Colorado, which sits right on the 40th, parallel, the sun will be 40 degrees south of directly overhead at midday on the spring and fall equinoxes, but 63.5 degrees from directly overhead on the winter solstice, and only 16.5 degrees from directly overhead on the summer solstice. We can take the cosine of these angles to see that the sun provides 77% of its maximum energy in Boulder at noon on either equinox, only 45% on the winter solstice, and 96% of its maximum energy on the summer solstice. 

Many of our most extreme heat waves across Colorado, and the country, do occur right around the summer solstice (late June), but may also occur throughout July and August. However, our heat waves are certainly not evenly distributed around the summer solstice. There are far fewer in late May and early June even though we receive more direct sunlight than we do in late July and early August. Why? Much as there is a lag between noon and the hottest time of day, a small lag exists between the longest, brightest days and the peak window for heat waves. It takes the atmosphere several weeks to fully equilibrate, or “catch up” to the increase in sunlight during late spring, making it easier to build “heat domes” later in the summer (more on this below). Furthermore, the land surface also tends to dry out as the summer wears on, meaning a greater fraction of the sun’s energy goes into directly heating the land, and a smaller fraction (on average) goes into evaporating water. All things considered, we end up with the largest threats for triple digit heat, in Colorado, in late June and July. The image below shows the official maximum daily temperature records for the Fort Collins weather station for every day of the calendar year. Our earliest 100-degree day on record is June 14th, and our latest is August 1st

We now know that the potential for record hot surface temperatures peaks in the mid-to-late afternoon in late June through late July, but can we explain why some days are hotter than others? Yes. The simple answer is we need the right weather conditions. Let’s explore the anatomy of a heat wave from a meteorological standpoint.  

Large-scale weather pattern: What large scale weather pattern is needed to produce heat waves? The short answer is dry air and high pressure, but we think about this in greater detail. We can think of earth’s atmosphere as being made of up airmasses and the boundaries between them. Air masses are large-scale high pressure systems that can be described as warm and dry (continental tropical, cT), warm and moist (maritime tropical, mT), cool and dry (continental polar, cP), or cool and (relatively) moist (maritime polar mP). Low pressure systems and stormy weather occur in the spaces between, where air masses collide with one another. The figure below shows different types of air masses, and where they tend to occur from Canada’s weather glossary

To obtain the hottest possible surface temperature we need a hot, dry, high pressure airmass to preside over Colorado. The air needs to be dry because moisture in the air can condense, forming clouds and blocking sunlight. If the near surface layer of air is too moist, thunderstorms will form when the air is heated, cooling conditions back down substantially. High pressure is ideal because air expands outward from high pressure centers, which leads to sinking air. Sinking air draws the driest air down from the upper atmosphere to the surface. Why is sinking air important? 

Stability: Have you heard the saying “heat rises?” If this is true, how are such high temperatures possible at the earth’s surface? Heat does indeed rise because hot air is less dense than cool air. However, as hot air rises it expands to equilibrate to the lower pressure at higher altitudes. There is an energy cost to air expanding, and because of this, air cools as it expands. When we measure this cooling, we see that rising air cools at a rate of 9.8 °C/kilometer of elevation gain (about 5.5 °F/thousand feet). The air aloft is usually cooler than the air at the surface, but so long as it is not more than 5.5 °F cooler per thousand feet of rise, the hot air at the surface will remain in place. This is why having relatively warm air aloft, and not just at the surface, is so important. If warm air is in place aloft, the air at the surface will have to be even warmer to rise.  

Stability is a big part of the reason high pressure atmospheric conditions are ideal for heat. As mentioned above, high pressure forces air aloft to sink. This air is compressed and warmed as it sinks, also at a rate of 5.5 °F/1000 feet. Hotter and drier than normal air above the surface, which is sometimes called a “heat dome,” suppresses the development of clouds and thunderstorms, forces air down from above that warms as it sinks, and lets the surface air bake to its maximum possible temperature under the hot summer sunshine.  

Stability is also why it is nearly impossible to generate triple-digit heat at high elevations. The thin air above our mountain valleys is so reliably cool. In the absence of a “heat dome,” the hot air generated at elevation usually rises and escapes, often triggering thunderstorms. Even record hot air near sea level is surprisingly cool if lifted to the elevations of our Rocky Mountains. For instance, suppose it is hot enough to produce a blistering 132 °F temperature at Furnace Creek in Death Valley. If that air was lifted to 2000 ft elevation, it would be 120 °F. As it happens, 2000 ft is the elevation of Las Vegas, and 120 °F is the all-time record high temperature in Las Vegas. Lift it another 3000 ft and you’re at the elevation of Fort Collins. That same air is now 103 °F. Hey, that is the record high temperature for Fort Collins! As it continues to rise, we hit a mark of 81 °F at 9000 ft (think Summit County) and 53 °F by the time we reach the elevation of Mt. Elbert, nearly 70 °F for just under three miles of vertical displacement. 

Thunderstorms can play a surprising role in producing heat waves. If there is too much moisture in the atmosphere, then heating up the land surface will generate thunderstorms, and kill any chance of developing record heat. However, thunderstorms that occurred earlier somewhere upstream can be a key ingredient for creating the perfect heat wave. Air in thunderstorm clouds is saturated, and as this air rises, it cools at a rate much lower than 5.5 °F/1000 feet. When saturated air rises the water vapor is condensed into liquid or even ice. This phase change of water from a gas to a liquid or solid releases latent heat of condensation, counteracting the cooling impact of air expanding as it rises. The image below shows an example of how moist air can return to the surface warmer than it started after releasing latent heat.  

The amount of latent, or “hidden” heat in moist air is enormous. If a saturated mass of air in the deep tropics was lifted high enough to condense all water vapor out of the air, and then forced all the way back down to sea level, it could be as hot as 200 °F. We never see air this hot because after moist tropical air is lifted, its density will be far too low to force all the way back to the surface. This air will have to cool for weeks if not months before returning to sea level. However, moist air that is lifted and releases its latent heat of condensation, and then is forced by high pressure to sink at least part way to the surface days later, can create a highly effective heat dome. This is what happened in the June 2021 heat wave over the Pacific Northwest. Storm activity over the Pacific Ocean lifted moisture-laden air into the upper atmosphere, releasing its latent heat. The now dry upper-level air traveled eastward until reaching the western United States. A high pressure airmass over British Columbia forced this air back down, creating a brutal heat dome over Washington and Oregon. 

Microscale weather pattern: The record high temperature for Denver is 104 °F, but have you ever driven by an area bank sign, or seen a car thermometer, that says 110 °F? Was that reading wrong? Not necessarily. If the sun is shining directly on the thermometer, then yes, it is wrong. Official temperature readings are taken in thermometer shelters, which are ventilated, but shaded (example below).  

If the thermometer is sited in a place with large amounts of asphalt/concrete/steel (e.g. downtown in a large city/Walmart parking lot) it may indeed be that hot! Long-term weather stations are supposed to be sited in more open spaces surrounded by native vegetation. If the temperature was 100 °F at a close by weather station maybe it was 109 °F where you parked your car. This is a well-known concern in large cities. All the concrete and steel and lack of green area traps heat, creating an “urban heat island.” The added heat in structure-dense cities is a major health and human safety concern in many metro areas around the country.  

Climate change: To quote a recent article on heat waves by Dr. Andrew Dressler “a rising tide floats all boats.” More heat in the atmosphere means a higher upper bound on how hot temperatures can get. That said, while we are seeing significant increases in the number of hot days (figure below) we are not seeing such obvious movement in record high temperatures. 

Conclusion: All things considered, when will you see record heat, and why? 1. Record heat will likely occur in the mid-to-late afternoon immediately after the day’s peak heating hours. 2. Record heat will probably occur in late June or July. August is hot, but the days are already getting shorter, and the intensity of the midday sun has already begun to wane. 3. The air and land will be dry. In Colorado, it is almost impossible to heat humid air to triple digits without clouds forming, and possibly thunderstorms. 4. The surface pressure will be high, which draws dry, compressed air down from the upper atmosphere at seals in warmer conditions. 5. The air above the surface can likely be traced back to thunderstorm activity somewhere else. The latent heat release from these storms is contributing to the heat dome over your head. 6. If a new record occurred at your local long term weather station, it was probably even hotter downtown and on the roadways. 

Happy 148th Birth Anniversary #Colorado!

Rocky Mountain Alpine-Montane Wet Meadow. Photo credit: Colorado Natural Heritage Program

#Drought news August 1, 2024: #Colorado saw deterioration in the N. Front Range, where extreme temperatures and low humidity made for perfect conditions for #wildfire

Click on a thumbnail graphic to view a gallery of drought data from the US Drought Monitor website.

Click the link to go to the US Drought Monitor website. Here’s an excerpt:

This Week’s Drought Summary

Heat continued to be the dominating feature in the Southwest and Plains. Temperatures were 2 to 6 degrees above normal, with isolated areas seeing temperatures of 6 to 8 degrees above normal. The Southwest reached near record temperatures once again, with the highest 1-day maximum temperature for the week reaching 120 degrees in Death Valley and 110 degrees in surrounding areas. The West and Plains missed out on much of the precipitation that fell this week. These hot and dry conditions have leant themselves to increased fire potential and wildfires. The southern Plains, missing out on the precipitation and experienced above-normal temperature, leading to more drying and degradation. Similar degradations occurred along the western border of the High Plains due to the lack of precipitation, poor soil moisture, and declining streamflows. The Southeast on the other hand received substantial precipitation, vastly improving lingering dryness in the area. The northern Appalachian region saw 1-category degradations where streamflows in north-central West Virginia are critically low…

High Plains

The High Plains received trace amounts of precipitation, leading to already dry conditions in the western and southern High Plains to further deteriorate. Poor soil moisture in much of Kansas brought about widespread 1-category degradations. In eastern Kansas, along the Missouri border there have been reports dryness and heat stress. Central Kansas has also seen reports of dry ponds and fear of total crop failures. Some of these drier conditions spilled northward into southern Nebraska, which also saw areas of the northeast and western Panhandle deteriorate because of an extended period of dry conditions, dry vegetation, and low streamflow values. Similar conditions were seen across western South and North Dakota and Wyoming. Colorado saw deterioration in the northern Front Range, where extreme temperatures and low humidity made for perfect conditions for wildfires. Two fires were reported on Monday July 29: the Alexander Mountain Fire west of Loveland, the Stone Mountain Fire southeast of Estes Park…

Colorado Drought Monitor one week change map ending July 30, 2024.

West

The Northwest saw some relief from the extreme heat this week, with temperatures in Nevada, California, Oregon, and Washington being 2 to 6 degrees below normal. Conversely, the Southwest saw more extreme heat. Southern California, the southern tip of Nevada, and western Arizona saw temperatures of over 90 degrees this week with the highest 1-day maximum temperature reaching over 110 degrees. In the northern West, Montana saw slight improvements in the far north where temperatures were slightly below normal but saw similar conditions as North and South Dakota conditions in the central and eastern parts of the state. Central Utah saw minor expansion of abnormal dryness as streamflow began to drop and vegetation is looking dry…

South

Eastern portions South saw much of the heavy precipitation seen in the Southeast. Southeastern Texas into western Louisiana recorded areas of over 8 inches of rain falling this week. There was a sharp line of where the precipitation fell and did not. West of south-central Texas, northeastward to central Arkansas saw trace amounts of rain. Temperatures were also between 1 and 4 degrees below normal, with eastern Texas and western Louisiana having temperatures of 6 to 8 degrees below normal. Except for north-central Texas and parts of Oklahoma, and western Arkansas, 1-categoy improvements were made. Oklahoma saw a mixture of above- and below-normal temperatures, with hot temperatures heating up at the end of the week (July 23 to 30). Reports of “cover crops being cooked” and “no soil moisture for native grasses to draw from and large pastures have lost much green color and have shrunk considerably” in central Oklahoma’s Logan County…

Looking Ahead

Over the next five days (August 1-6), the Midwest, Northeast, and eastern Southeast are expected to see 1 to 2 inches of rain with heavier amounts predicted in the eastern Midwest and southern Florida. The rest of the Southeast will see more modest amounts of precipitation, deviating from their previous weeks of heavy precipitation. There is currently an Atlantic Disturbance that the National Hurricane Center show a greater than 60 percent chance of developing into a tropical cyclone within the next two days (August 1-2) which could bring heavy rainfall along the Atlantic Coast in the coming week. Isolated areas from Wisconsin, Minnesota, and Iowa to Kansas and higher elevations of Colorado, New Mexico, and Arizona are expected to receive around 1 inch of precipitation. Otherwise, precipitation will be light and spotty leading to much of the West, Texas, southern Oklahoma and Arkansas missing out on the precipitation.

The National Weather Service Climate Prediction Center’s 6-10 day outlook heavily favors above-normal temperatures from the Pacific Northwest across to the Southeast with conditions becoming near normal across the central U.S. and leaning to below normal temperatures further north toward Canada. Much of Alaska is expected to be above normal with below-normal temperatures possible to the southwest. Similarly, Hawaii is leaning towards above-normal temperatures. Many of the lower 48 states are leaning towards above-normal precipitation, centering around Wyoming and Colorado, along with the Atlantic Coast, which could see remnants of the Tropical Disturbance currently in the Caribbean. Alaska’s border with Canada is seeing up to a 70 percent chance of below normal precipitation, with the probability increasing in the west and southwest. Hawaii probability of seeing below-normal precipitation is 33 to 40 percent.

US Drought Monitor one week change map ending July 30, 2024.

#Climate leaders say Vice President Kamala Harris has ‘lit an electric spark’ with young voters — The Washington Post

Denver School Strike for Climate, September 20, 2019.

Click the link to read the article on The Washington Post website (Maxine Joselow). Here’s an excerpt:

July 30, 2024

More than 350 prominent climate advocates on Tuesday endorsed Vice President Harris for president, a sign that environmental leaders believe hercampaign will energize like-mindedvoters in a way that President Biden could not. In a letter shared first with The Washington Post, big names in the environmental movement — including former U.S. climate envoy John F. Kerry, former secretary of state Hillary Clinton and Washington Gov. Jay Inslee (D)— wrote that Harris has long prioritized climate action and would continue to do so as president.

“We know that protecting our planet for ourselves and future generations requires the kind of bold leadership that Kamala Harris has demonstrated her whole life,” they wrote. “We are proud to support her and be in the fight against climate change with her.”

Inslee, whose ambitious climate proposals during his 2020 presidential campaign influenced Biden’s climate policies, said Harris could help mobilize young voters, a crucial Democratic constituency. Polls show that climate change is a top concern for young people, who are more likely than older generations to face raging wildfiresrising seas and stronger storms in their lifetimes.

“Her candidacy instantly lit an electric spark under young people across the country,” Inslee said. “That’s going to bode well for our fortunes.”

Kerry, who left the Biden administration in March, said in an interview that Harris was a “terrific ally” on climate policy. He noted that she was an early advocate of the United States reaching net-zero emissions by mid-century, and she delivered a forceful speech at the U.N. Climate Change Conference in Dubai last fall.

Some thoughts on the bid to protect the Lower #DoloresRiver — Jonathan P. Thompson (LandDesk.org)

Boulders in the Dolores River downstream from Bedrock. Jonathan P. Thompson photo.

Click the link to read the article on The Land Desk website (Jonathan P. Thompson):

July 30, 2024

The News: Western Colorado’s Mesa and Montrose counties propose a 30,000-acre national conservation area for the Lower Dolores River corridor as an alternative to the proposed 400,000-acre national monument. While this may look like a peace offering or compromise of sorts from counties that have opposed protections of any kind, it is just as likely an attempt to block any sort of designation and will probably only further fan the flames of controversy. It’s the latest volley in a half-century-long battle over the fate of the beleaguered river. 

The Context: The current controversy over the Dolores River takes me back to when I was a youngster in the early ‘80s. McPhee Dam was under construction on the Dolores River, its proponents having vanquished a movement that sought to block the dam and keep the river free. My parents had been on the losing side of the fight, and I can distinctly remember my father blaming the defeat, at least in part, on outsider environmentalists — including Ed Abbey — deriding the pro-dam contingent as a bunch of “local yokels.

I’m sure my dad took it personally. He was a fourth-generation rural Coloradan, had graduated from Dolores High School, and his mom and sisters still lived in Dolores — apparently making him a “yokel,” even though he opposed the dam. But also he saw it as a major strategic misstep. Not only were these people insulting locals, but they were falling into the pro-dam contingent’s trap, bolstering the dam-building effort in the process.

More often than not, these land protection fights are framed as well-heeled elitist outsiders and Washington D.C. bureaucrats imposing their values on and wrecking the livelihoods of rural, salt-of-the-earth local ranchers and miners. And in almost every case it is a gross oversimplification, at best, and at worst is an inaccurate portrayal and a cynical attempt to disempower locals — and anyone else — who favor land protection. So when those anti-dam folks caricatured the pro-dam contingent as local yokels, they were not only alienating locals who may have been on their side, but also validating the false depiction of the situation. 

Fresh snow on Bears Ears. Photo credit: Jonathan P. Thompson/The Land Desk

We saw this play out in the battle over the Bears Ears National Monument designation and Trump’s shrinkage of it in a gross way. The anti-monument contingent insisted that all “locals” were opposed to the monument — and the media largely bought into it — never mind the fact that effort to establish a monument in the first place was driven by local Navajo Nation and Ute Mountain Ute citizens, and was taken up by tribal nations who have inhabited the landscape in question since time immemorial. Never mind that the anti-monument “locals” were backed by mining corporations, right-wing think tanks, and conservative politicians from all over (including a Manhattan real estate magnate and reality TV personality who became President). Utah’s congressional delegation even had the gaul to attempt to disenfranchise and silence the voices of tribal leaders because they happened to be based on the other side of a state or county line that was arbitrarily drawn based on arbitrary grids by dudes in Washington D.C.  

The movement to protect the Dolores River has been portrayed in much the same way over the last several decades. It has its roots in 1968, when U.S. Rep. Wayne Aspinall, a Democrat from Colorado’s Western Slope, pushed through the Colorado River Basin Project Act, authorizing the construction of five Western water projects. One of them was the Animas-La Plata Project, a byzantine tangle of dams — including one on the Animas River above Silverton — along with canals, tunnels, and even power plants. Another was the Dolores Project, which included building McPhee Dam several miles downstream of the town of Dolores, which would impound water to lengthen the irrigation season for the Montezuma Valley and allow water to be sent, via canal, to the dryland bean farmers around Dove Creek. 

The Dolores River, below Slickrock, and above Bedrock. The Dolores River Canyon is included in a proposed National Conservation Area. Photo: Brent Gardner-Smith/Aspen Journalism.

The prospect of another river being stilled by another giant monolith sparked a movement to block the dam and to designate the Lower Dolores River corridor as a Wild and Scenic River, which would have prohibited mining and oil and gas leasing, while also ensuring enough water would be left in the stream to keep the river “wild and scenic,” which is to say a lot more water than zero, which was the lower river’s flow from mid-summer into fall due to irrigation diversions. 

Local farmers were generally in favor of the dam — and against Wild & Scenic designation, since it would likely deprive them of some irrigation water during dry times. But their cause was also backed by powerful agricultural interests on the state level, the pugnacious Durango attorney Sam Maynes, Sen. Gary Hart, the Colorado Democrat, and, probably most importantly, the Ute Mountain Ute Tribe, which would receive a portion of the vast amounts of water to which they were entitled from the Dolores Project. The project was ultimately authorized (though I doubt the local yokel comment had all that much to do with it, really). Construction of McPhee Dam began in 1979 and the reservoir began filling in 1983. 

La Plata Mountains from the Great Sage Plain with historical Montezuma County apple orchard in the foreground.

No matter how one feels about dams, you have to admit it had some benefits. In 1978 the federally funded Dolores Archaeological Program was launched to survey, excavate, and study the rich cultural sites that were spread out across the area to be inundated by the reservoir. It was a huge project that brought a slew of researchers to the area, significantly advanced scientific knowledge of the Ancestral Puebloan people who inhabited the region for centuries, and provided the seeds for future archaeological work and organizations, including the Crow Canyon Archaeological Center.

And, contrary to opponents’ fears, the dam didn’t kill the river. Rather it was like putting the river’s manic-depressive flows on lithium. The massive spring runoffs were tempered, but water managers released enough water in most years to scour beaches and preserve Snaggletooth’s whitewater snarl. And for the first time in a century the lower Dolores didn’t run dry in July. In fact, the year-round flows were enough to build and sustain a cold-water fishery for trout in the first dozen or so miles below the dam and a habitat for native fish below that. The Ute Mountain Ute Tribe got both drinking water from the project as well as enough to irrigate a major agricultural enterprise near the toe of Ute Mountain, providing much needed economic development. The Town of Dove Creek receives water from the project as do the formerly dryland farmers, allowing them to diversify their crops. The dam’s completion happened to coincide with the demise of the domestic uranium mining industry, meaning that threat mostly went away as well, along with the need for added protections.

The Dolores River at its confluence with the San Miguel River. Jonathan P. Thompson photo.

Unfortunately, drier times set in and the current megadrought, now going on a quarter century, has depleted the river’s flows and reservoir levels. In order to keep the irrigation ditches flowing as deep into the summer as possible, dam managers have released almost no water during 14 of the last 24 years, essentially desiccating the stream bed below the dam and throwing the riparian ecology out of whack. In the midst of it all the uranium industry made a short-lived comeback between 2006 and 2012. Now it seems to be emerging from its zombified state once again and is targeting numerous sites along the Dolores River. The river runs through the Paradox Formation, as well, meaning it could be targeted by lithium and potash miners. Meanwhile, visitation to the Lower Dolores River has ramped up — along with the impacts — as social media posts reveal the canyons to more people and as the Moab crowd seeks new places to play. 

Dolores River watershed

All of that spawned new Wild & Scenic campaigns for the Lower Dolores, but after it became clear they couldn’t get past political hurdles, stakeholders came together to work on a compromise, resulting in a proposal to create a national conservation area on 60 miles of river corridor below the dam, which would withdraw the land from new mining claims and oil and gas leases, bring more attention to the plight of this sorrowful and spectacular river, and possibly more funding to river restoration efforts. But it would leave another 100 miles of the Lower Dolores unprotected, in part because Mesa and Montrose Counties withdrew their support for the plan. Thus the proposal for President Biden to designate 400,000 acres as a national monument.

That proposal, perhaps predictably, has sparked a backlash and an anti-national monument campaign partly fueled by disinformation. And, just as predictably, it’s being falsely framed as a fight pitting locals vs. outsiders. It’s true that a survey commissioned by Mesa County of about 1,200 registered voters in Mesa, Montrose, and San Miguel Counties found that 57% of respondents oppose the national monument proposal. That shows that more locals oppose it, but that quite a few support the initiative, as well. And Center for Western Priorities director Aaron Weiss found that the survey may be biased since its creators consulted with national monument opponents, but not proponents, about which questions to ask and how to word them. And it shows. 

For example, the survey precedes one set of questions with: “Currently, uranium mining in the Dolores River Canyon area in the west end of Montrose County impacts the local economy by providing tax dollars and jobs. The current national monument proposal would allow some but not all existing permit holders to continue to operate, but it has not been decided if the proposal would allow new permits or permit renewals in the future.” But this is misleading, because the uranium mining industry remains virtually dead, so the economic impact is zero to negligible. Furthermore, a national monument grandfathers in all existing valid mining claims and has no effect on patented (private) claims. So even if there were operating mines, a monument wouldn’t hamper operations. [ed. emphasis mine] Other questions were similarly misleading by implying that a national monument designation would remove management from the BLM or Forest Service.

Tellingly, the survey also found that 72% of respondents support existing national monument designations “such as Browns Canyon, Chimney Rock, and Colorado National Monument.” Why? Because they value conservation and they’ve seen that national monuments don’t hurt the economy or agriculture or significantly restrict access. That they are less sure about a new national monument might have something to do with the opponents’ simplistic and unfounded argument against it, which is that it could “impose severe economic hardships,” without explaining how.

Nevertheless, Mesa County used the survey to justify a resolution opposing the national monument and supporting its proposal for a vastly scaled down national conservation area. Again, this tactic is an echo of ones used by Bears Ears National Monument opponents. National Conservation Areas don’t inherently offer more or less protections or restrictions than national monuments, but they do need to be passed by Congress. Given how dysfunctional our Congress is, that could take years or even decades. 

Yet the Lower Dolores River needs help now. No, a national monument won’t solve all its problems; it may not help the river, itself, at all. Already the fight over the proposal has shone a spotlight on a remote, largely unknown area, which will surely draw more visitors and more damage. A national monument designation at least would provide the possibility of protection against future development and burgeoning crowds.

Our River of Sorrow Jonathan P. Thompson October 27, 2021

Dolores River near Lizard Head Pass. Photo credit: Jonathan P. Thompson

Read full story

The Beaver Seekers: Citizen scientists are helping restore the ecosystem engineers to the Cascade-Siskiyou National Monument

Beaver. Ralph Arvesen (CC BY 2.0)

Click the link to read the article on The Revelator website (Juliet Grable):

July 22, 2024

“What do you think about this?” My friend, Sonya Daw, had called out to me from where she was standing at the edge of Beaver Creek. I joined her. I had just scrambled over a massive log and was grateful for an excuse to catch my breath.

“Hmm,” I said, still breathing hard. In front of us, water burbled over some branches that had fallen across the creek. Had they fallen, though? Or had they possibly been placed there by beavers?

As one of 11 teams taking part in a “beaver scavenger hunt” across the Cascade-Siskiyou National Monument in southwest Oregon, we were looking for any sign of beavers — willow stumps, sticks with “corn-on-the-cob”-style teeth marks, or even scent mounds, which beavers use to mark territories. What we and the other teams discovered would help the nonprofit Project Beaver focus their beaver-restoration efforts.

My team included Sonya, who writes for the National Park Service, her husband Charlie Schelz, the former monument ecologist, and Barb Settles, a spry 78-year-old and avid naturalist.

Photo: Juliet Grable

Charlie joined us, and we contemplated the creek. “I don’t think that’s anything,” he said. “But look how the sediment is piling up behind the branches; how cool is that?”

It was June 1 — not just a beautiful time to be hiking through the forest but the ideal window for beaver activity. Beaver moms have their babies in late spring and then send their older offspring packing. These dispersing youngsters are on the move, exploring new creeks and sampling the buffet of plants.

We took our time in flatter areas, especially where willows or red osier dogwood — beaver “dessert plants” — grew in clumps near the banks. We weren’t likely to find beavers along this steep stretch, but it was still fun to look and marvel at the enormous sugar pines, Douglas firs, and incense cedars that had escaped loggers’ chainsaws last century.

Wanted: Ecosystem Engineers

The Cascade-Siskiyou National Monument encompasses 114,000 acres, mostly in southwest Oregon. The Klamath and Cascade Mountains converge here, creating a patchwork of oak woodlands, forests, grasslands, and wetlands support a dazzling array of butterflies, bees, birds, and plants, including many that are found nowhere else.

President Bill Clinton designated the monument in 2000, not for its stunning canyons or breathtaking vistas but its “outstanding biological diversity.” In 2017 President Barack Obama expanded the monument by another 48,000 acres.

Beavers undoubtedly once populated the many streams and meadows, but by the time the monument was designated, they had been all but eradicated — the case all over Oregon. Now there is only one known established beaver family in the entire monument, says Jakob Shockey, executive director at Project Beaver. There could be others; Shockey says he’s seen evidence of random individuals on several creeks.

The Bureau of Land Management manages the monument but has partnered with the nonprofit to help bring beavers back. The task has become more urgent in the face of recent drought, which has left its mark in swaths of dead conifers. This part of southwest Oregon is dry and hot in summer, and getting more so. Beaver dams could help hold more moisture on the landscape, attracting more birds in the process. Wet meadows engineered by beavers could even serve as a firebreak, helping tame the spread of catastrophic wildfires.

Friends of the Cascade-Siskiyou National Monument, the group that hosted the scavenger hunt, is a key player in the project.

“We see our role as letting people know what makes the monument special and what’s needed to support the ecological integrity of this special place,” says Friends’ executive director Collette Streight.

Friends has hosted several “bio-blitz” events, where volunteers fan out in search of butterflies or reptiles. Streight wanted to create an event with the “juicy” energy of a bio-blitz that produced data with practical applications. After talking with Schelz, Shockey, and others, she honed in on beavers.

Photo: Friends of Cascade-Siskiyou National Monument

Pond of Dreams

Ultimately, the key to attracting beavers — and more importantly, convincing them to stay and set up shop — is restoring habitat. This “build it and they will come” approach can attract beavers from miles away.

“One of the first steps is to get information: Where are the beavers, and what are they doing right now?” says Streight.

Last summer, they beta-tested the scavenger hunt with a “Hike and Learn” led by Shockey.

“We need to know this information, and it really will impact future restoration work,” says Shockey. “What I don’t have is the ability to walk a bunch of creeks by myself.”

We didn’t find any evidence of beavers on our steep stretch of creek, but after clambering back to the car, we had just enough time to check out a meadow on the upper portion of Beaver Creek, where last fall Project Beaver installed a series of post-assisted log structures, or PALS.

The broad, flat meadow was a totally different landscape from where we’d been searching. Our boots squished as we wandered through clumps of sodden grass. Soon Sonya and I were reaching for our binoculars. Birdsong filled the meadow: Lazuli buntings called from the willows; robins chortled from a massive pine at the meadow’s edge. I broke out the Merlin bird-identification app to sort through the confounding songs of warblers.

Charlie pointed out one of the PALS — several small posts pounded into the creek bottom, with willows woven between them. Water had pooled behind the structure, creating a shallow, murky pond full of bugs.

Photo: Juliet Grable

“This is great to see,” he said, as he bent low to admire butterflies dancing across the surface and examine willow stakes that had been planted there. They were starting to leaf out. It wasn’t difficult to imagine a beaver setting up shop here, and not just for the scenery.

“Beavers like to surround themselves with water; it helps keep them from being eaten,” Charlie told us. Without that buffer, beavers are an easy (and meaty) target for a host of predators, including cougars, bobcats, bears, coyotes, wolves, and of course, humans.

A Rebranding Campaign

Beavers, once pilloried as pests, have undergone an image makeover in the Beaver State, thanks in part to legislative champions. Last year Oregon’s governor signed the “Beaver Believer” bill, which recognizes the rodent’s potential role in mitigating climate change. Beavers, whom the state had perplexingly classified as predators (they’re vegetarians), have now been rebranded as furbearers. As of this July, private landowners must obtain a permit before they can trap or kill so-called “nuisance” beavers. For the first time, the Oregon Department of Fish and Wildlife will also begin collecting data on all beavers killed in Oregon.

Some conservationists have been lobbying the Biden administration to ban hunting and trapping of beavers on federal lands. More locally, advocates have pushed for a trapping ban within the monument’s borders. They hoped it would be included in a new draft “Resource Management Plan” released by the BLM this year, but it was nixed.

Shockey has mixed feelings about such a proposal.

“Traditionally, trapping bans have been used as a wedge issue between those who hunt and those who don’t,” says Shockey. Increasingly, anglers and hunters are coming to appreciate beavers’ good work in streams and meadows — the places they fish and hunt.

And, as Shockey points out, a trapping ban won’t matter if beavers are shot out of spite. Having more beaver advocates actively monitoring in the monument might be the most effective way to protect the animals. Events like the scavenger hunt help by elevating their profile, making more people aware of their presence and importance.

“Beavers are so interesting in the way that people relate them,” says Shockey. “They’re kind of a charismatic animal and they’re easy to find compared to a lot of wildlife that people care about, yet they’re still pretty invisible.”

Setting the Stage

Late in the afternoon, after the scavenger hunt had run its course, 50 or so tired but happy citizen scientists reconvened at the local elementary school to share their findings. A few teams had discovered fresh sign, including along one stretch of creek where Shockey had never detected beavers before. Teams that found no fresh beaver signs shared other sightings — a snake skin, a junco nest, blooming lilies, chewed willow stumps from years past.

Shockey was pleased. “The data are going to directly inform where we’re going to do restoration,” he said, after he’d thanked the volunteers.

“I’m incredibly proud about what we accomplished,” says Streight. From the fundraising campaign to last-minute scrambling when two team leaders cancelled, the scavenger hunt had required a huge amount of effort. Best of all, no one had twisted an ankle or succumbed to heatstroke.

She hopes to capitalize on the scavenger hunt’s momentum. “We feel we could have volunteers at the ready” to help Shockey’s crew monitor sites or plant willow stakes, she says. “They are really jazzed.”

Project Beaver and the BLM have secured $227,000 for beaver restoration, which is enough to support an eight-person crew for three years. Each spring and fall, they will spend two weeks building and repairing structures in creeks, with the ultimate goal of enticing beavers back. They hope to allow beavers to find the habitat on their own and start breeding.

“Can we increase the amount of beaver activity through our restoration work? That’s how we’re going to measure success,” says Shockey.

Opinion: Project 2025 policies should terrify defenders of liberty and democracy: Far-right Heritage Foundation wants to guide a second Trump presidency by pushing its radical vision of America’s future — @WyoFile

Heritage Foundation President Kevin Roberts speaking with attendees at the 2022 AmericaFest at the Phoenix Convention Center in Phoenix, Arizona. (Gage Skidmore/Creative Commons/Flickr)

Click the link to read the article on the WyoFile website (Kerry Drake):

July 30, 2024

It’s not enough to be afraid of the Heritage Foundation’s Project 2025, a blueprint for Donald Trump’s White House return. Terrified is more like it.

The 900-page treatise spells out a plan to turn the United States into a MAGA paradise. That may sound like ecstasy to many Wyomingites who gave Trump his largest state margin of victory in his 2020 failed reelection bid, but it would crash the federal government beyond repair.

That wouldn’t be a good look for a state whose budget relies so heavily on funding from the federal government, but Wyoming’s dismal fiscal future is not the scariest thing on the horizon if Project 2025 gains traction.

It promotes an agenda that stands the idea of separation of church and state on its head, and rewrites federal laws to follow the guiding principles of Christian Nationalism. It throws democracy under the bus and takes away freedoms guaranteed in the Bill of Rights. 

Project 25 claims it wants to restore “God-given rights,” but its authors don’t mention those rights would only be guaranteed for those who worship the deity that has the federal government’s stamp of approval.

The Heritage Foundation, a far-right “think tank,” has produced similar manifestos since the 1970s. It must have worked overtime to create a controversial new vision of government that is anti-public education, anti-public health, anti-environment, anti-non-Christians, anti-abortion, anti-LGBTQ, anti-immigration and anti-federal workers.

What does Project 25 favor in addition to targeting all of the above? Not surprisingly, the plan endorses cutting taxes for the wealthy, matching the primary goal of the first Trump administration. The Heritage Foundation and 100 other right-wing groups that signed on want to finish Trump’s border wall.

Convicted felon Trump backs many of these proposals, including the National Guard and federal agents rounding up and deporting more than 10 million people who aren’t in this country legally. Wyoming residents in favor of kicking out all non-citizens should realize mass deportations will likely include their friends, co-workers and even family members.

Project 2025 wants to eliminate the U.S. Department of Education, end federal public school funding and send the money to private and religious school voucher programs. Wyoming’s Legislature already went down this path by creating “education savings accounts.” 

Do you want to enroll your child in Head Start? Forget about it, because the program won’t exist.

Trump has gone to absurd lengths to drive his golf cart away from the stench of Project 2025 as fast as he can because so many of its recommendations are extremely unpopular.

Don’t be fooled; he’s in bed with these guys. “This is a great group, and they’re going to lay the groundwork and detail plans for exactly what our movement will do,” Trump said at a 2022 Heritage Foundation dinner.

His biggest whopper, though, was this denial: “I know nothing about Project 2025,” Trump wrote on his Truth Social website. “I have no idea who is behind it. I disagree with some of the things they’re saying and some of the things they’re saying are absolutely ridiculous and abysmal. Anything they do, I wish them luck, but I have nothing to do with them.”

As the #GreatSaltLake shrinks, its carbon footprint grows, study finds — #Utah News Dispatch #ActOnClimate

The shores of the Great Salt Lake near Antelope Island are pictured on Tuesday, May 21, 2024. (Photo by Spenser Heaps for Utah News Dispatch)

Click the link to read the article on the Utah News Dispatch website (Kyle Dunphey):

July 30, 2024

Not only does the shrinking Great Salt Lake impact wildlife and expose Utahns to toxic dust, it’s also a major contributor to greenhouse gas emissions. 

That’s according to new research from the Royal Ontario Museum, which published a study last week that found the dry lakebed emitted about 4.1 million tons of greenhouse gases in 2020 alone, most of it carbon dioxide. 

By comparison, Utah as a whole emitted about 59 million tons of carbon dioxide in 2016, according to the University of Utah’s Kem C. Gardner Institute.  

While burning fossil fuels is the largest contributor to human-caused greenhouse gas emissions, the largest terrestrial source — meaning it comes from the earth — is soil. A study published earlier this year in the Institute of Physics’ science journal found that about 80% of the world’s terrestrial carbon is stored in soil. 

Drought causes soil to dry and crack, a process called desiccation, which can lead to increased respiration (the release of carbon dioxide). Cracking can also expose deeper and older stores of carbon dioxide in the soil. 

That’s essentially the scenario researchers found on the Great Salt Lake — as the lake recedes and exposes more dry lakebed, desiccation increases. According to the study, the drying lake is equivalent to a roughly 7% increase in Utah’s total human-caused greenhouse gas emissions. 

“Human-caused desiccation of Great Salt Lake is exposing huge areas of lake bed and releasing massive quantities of greenhouse gases into the atmosphere,” said researcher Soren Brothers. “The significance of lake desiccation as a driver of climate change needs to be addressed in greater detail and considered in climate change mitigation and watershed planning.”

Between April and November 2020, researchers measured carbon dioxide and methane emissions from exposed sediment on the Great Salt Lake, comparing the findings with the estimated release of greenhouse gases from the water. The measurements pointed to a release of about 4.1 million tons of greenhouse gases, 94% of it carbon dioxide. 

The research also found that the carbon emissions are accelerated by warming temperatures, even at areas where the lakebed has been exposed for decades. 

“These analyses showed that the original lake was not likely a significant source of greenhouse gasses to the atmosphere, making the dried-up lake bed a novel driver of atmospheric warming,” the study reads. 

The lake hit its historic low point of 4,188.5 feet in November 2022. Since then, two above-average winters brought increased runoff to the lake, with levels as of Monday at about 4,193.7 feet in the south arm. 

The north arm, which is typically lower and saltier due to the railroad causeway that restricts the flow of fresh water, is at about 4,192 feet. 

The state defines a “healthy” range for the lake between 4,198 to 4,205 feet.

Credit: USGS

Topsoil Moisture % short/very short 32% of the Lower 48 is short/very short, 3% more than last week — @NOAADrought

Soils dried in the Pacific Northwest, Plains, & parts of the Midwest. Big improvements in topsoil conditions for much of the Southeast.

The American West’s last quarter-century ranks as the driest in 1,200 years, research shows — The Los Angeles Times #ActOnClimate

Lake Mead shipwreck. Photo credit: John Fleck

Click the link to read the article on The Los Angeles Times website (Ian James). Here’s an excerpt:

July 30, 2024

Three years ago, climate researchers shocked drought-weary Californians when they revealed that the American West was experiencing its driest 22-year period in 1,200 years, and that this severe megadrought was being intensified by global warming. Now, a UCLA climate scientist has reexamined the data and found that, even after two wet winters, the last 25 years are still likely the driest quarter-century since the year 800.

”The dryness still wins out over the wetness, big time,” said UCLA professor Park Williams.

The latest climate data show that the years since 2000 in western North America — from Montana to California to northern Mexico — have been slightly drier on average than a similar megadrought in the late 1500s…Williams shared his findings with the Los Angeles Times, providing an update to his widely cited 2022 study, which he coauthored with scientists at Columbia University’s Lamont-Doherty Earth Observatory. The new findings reveal that even the unusually wet conditions that drenched the West since the start of 2023 pale in comparison to the long stretch of mostly dry years over the previous 23 years. And that dryness hasn’t been driven by natural cycles alone. Williams and his colleagues have estimated that a significant portion of the drought’s severity — roughly 40% — is attributable to warming driven by the burning of fossil fuels and rising levels of greenhouse gases. The warming that has occurred in the region, an increase of more than 2.5 degrees Fahrenheit since recordkeeping began more than a century ago, has intensified the dry conditions, making the latest megadrought significantly more severe than it would be without climate change…Scientists and policy experts widely agree that adapting to aridification driven by climate change in the western U.S. will require major changes in how limited water supplies are managed for farms, cities and the environment.

“Regardless of what happens in the next few years, which will be dictated mostly by the randomness of weather, as the atmosphere continues to warm we should expect it to continue to degrade our water supply,” Williams said. “A warmer atmosphere is a thirstier atmosphere, and without a compensating increase in precipitation, which has not occurred, humans and ecosystems will be left with less water.”

Atmospheric carbon dioxide concentrations (CO2) in parts per million (ppm) for the past 800,000 years. On the geologic time scale, the increase to today’s levels (orange dashed line) looks virtually instantaneous. Graph by NOAA Climate.gov based on data from Lüthi et al., 2008, via the NOAA NCEI Paleoclimatology Program.

Aspinall Unit operations update: Streamflow in Black Canyon will be around 600 cfs, August 31, 2024 #GunnisonRiver #ColoradoRiver #COriver #aridification

Sunrise Black Canyon via Bob Berwyn

From email from Reclamation (Erik Knight):

Releases from the Aspinall Unit will be decreased from 2100 cfs to 1650 cfs by Thursday, August 1st. Releases are being decreased as the baseflow target for the lower Gunnison River will change to 1050 cfs on August 1st.

Flows in the lower Gunnison River are currently above the baseflow target of 1500 cfs. River flows are expected to remain above the new baseflow target with this release reduction.

Pursuant to the Aspinall Unit Operations Record of Decision (ROD), the baseflow target in the lower Gunnison River, as measured at the Whitewater gage, is 1050 cfs for August through December.

Currently, Gunnison Tunnel diversions are 1050 cfs and flows in the Gunnison River through the Black Canyon are around 1050 cfs. After this release change Gunnison Tunnel diversions will still be 1050 cfs and flows in the Gunnison River through the Black Canyon will be around 600 cfs. Current flow information is obtained from provisional data that may undergo revision subsequent to review.

Can viruses help clean wastewater from fracking? It’s a “yes, but” from researchers — Fresh Water News #ActOnClimate

Click the link to read the article on the Water Education Colorado website (Shannon Mullane):

July 25, 2024

After four years of experimentation, a group of researchers in Texas have successfully used a type of virus — used to combat bacterial infections in medicine — to kill bacteria in wastewater from fracking.

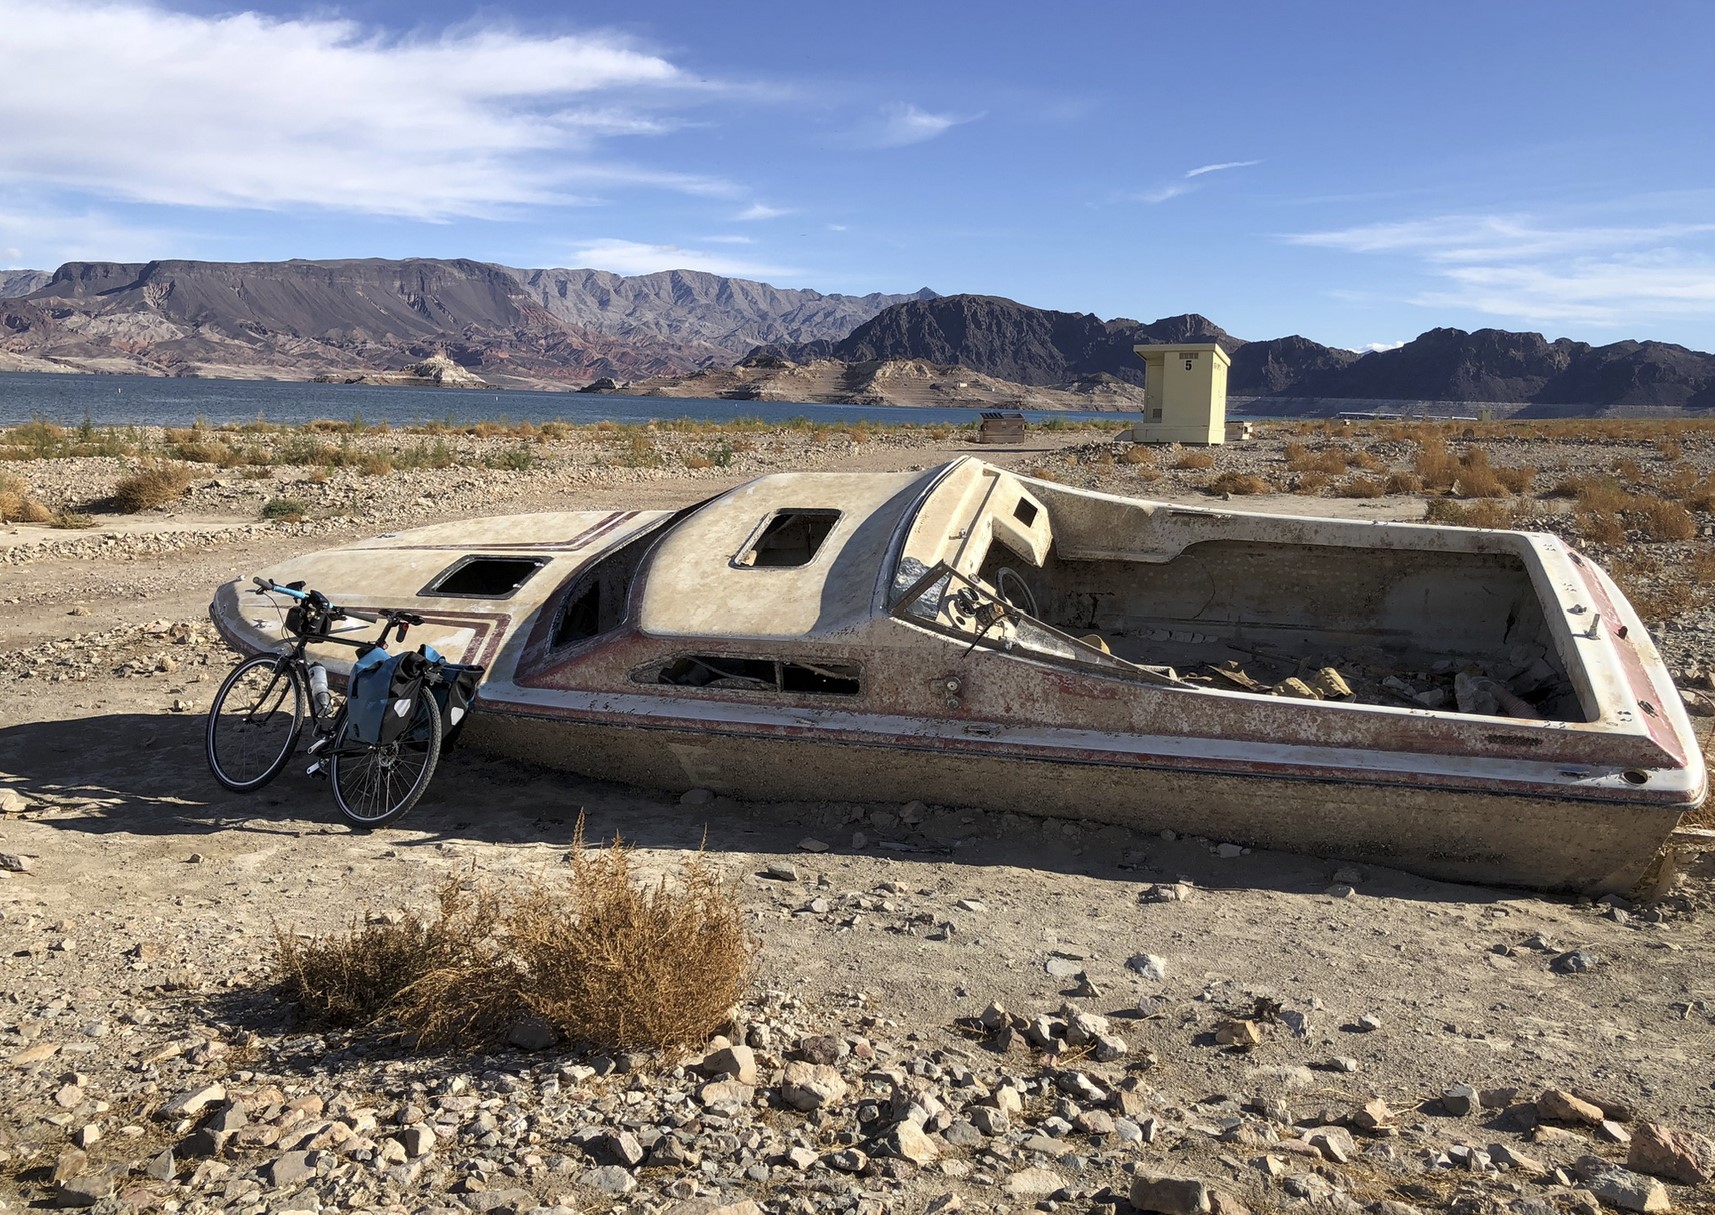
This wastewater, which can come with radioactive, cancer-causing materials, and yes, bacteria, often gets shoved back underground for storage. But increasingly, Colorado and other states are looking at ways to clean the wastewater enough that it can be used in other mining operations instead of fresh water. It’s an intriguing idea in Colorado, where fresh water supplies have been strained by a two-decade megadrought.

Could viruses really help? The potential is there — but so are big questions about practicality, researchers say.

“It’s outside-the-box science. We knew that,” said Zacariah Hildenbrand, part of the six-person University of Texas research team that published a study on the viruses in April. “But I mean, necessity is the mother of all innovation here, and we need to find some novel technologies.”

Wastewater, called produced water, is the major waste stream generated by oil and gas production, according to the group’s research published in the peer-reviewed journal Water. The research was funded by Biota Solutions, a Texas-based research company founded to develop viruses to kill bacteria in produced water.

Oil and natural gas can be thousands of feet below the ground’s surface, where it mixes with brackish water. At that depth, the water can include naturally occurring carcinogenic compounds and radioactive materials. It’s so salty that, if used for irrigation, it could kill plants.

During the fracking process, companies pump a mixture of fresh water, sand and chemicals [ed. including PFAS] underground where it mixes with oil, gas and the brackish water. It returns to the surface and is separated from the oil and gas. The result is produced water, which can not be used for drinking or irrigation, per state regulations.

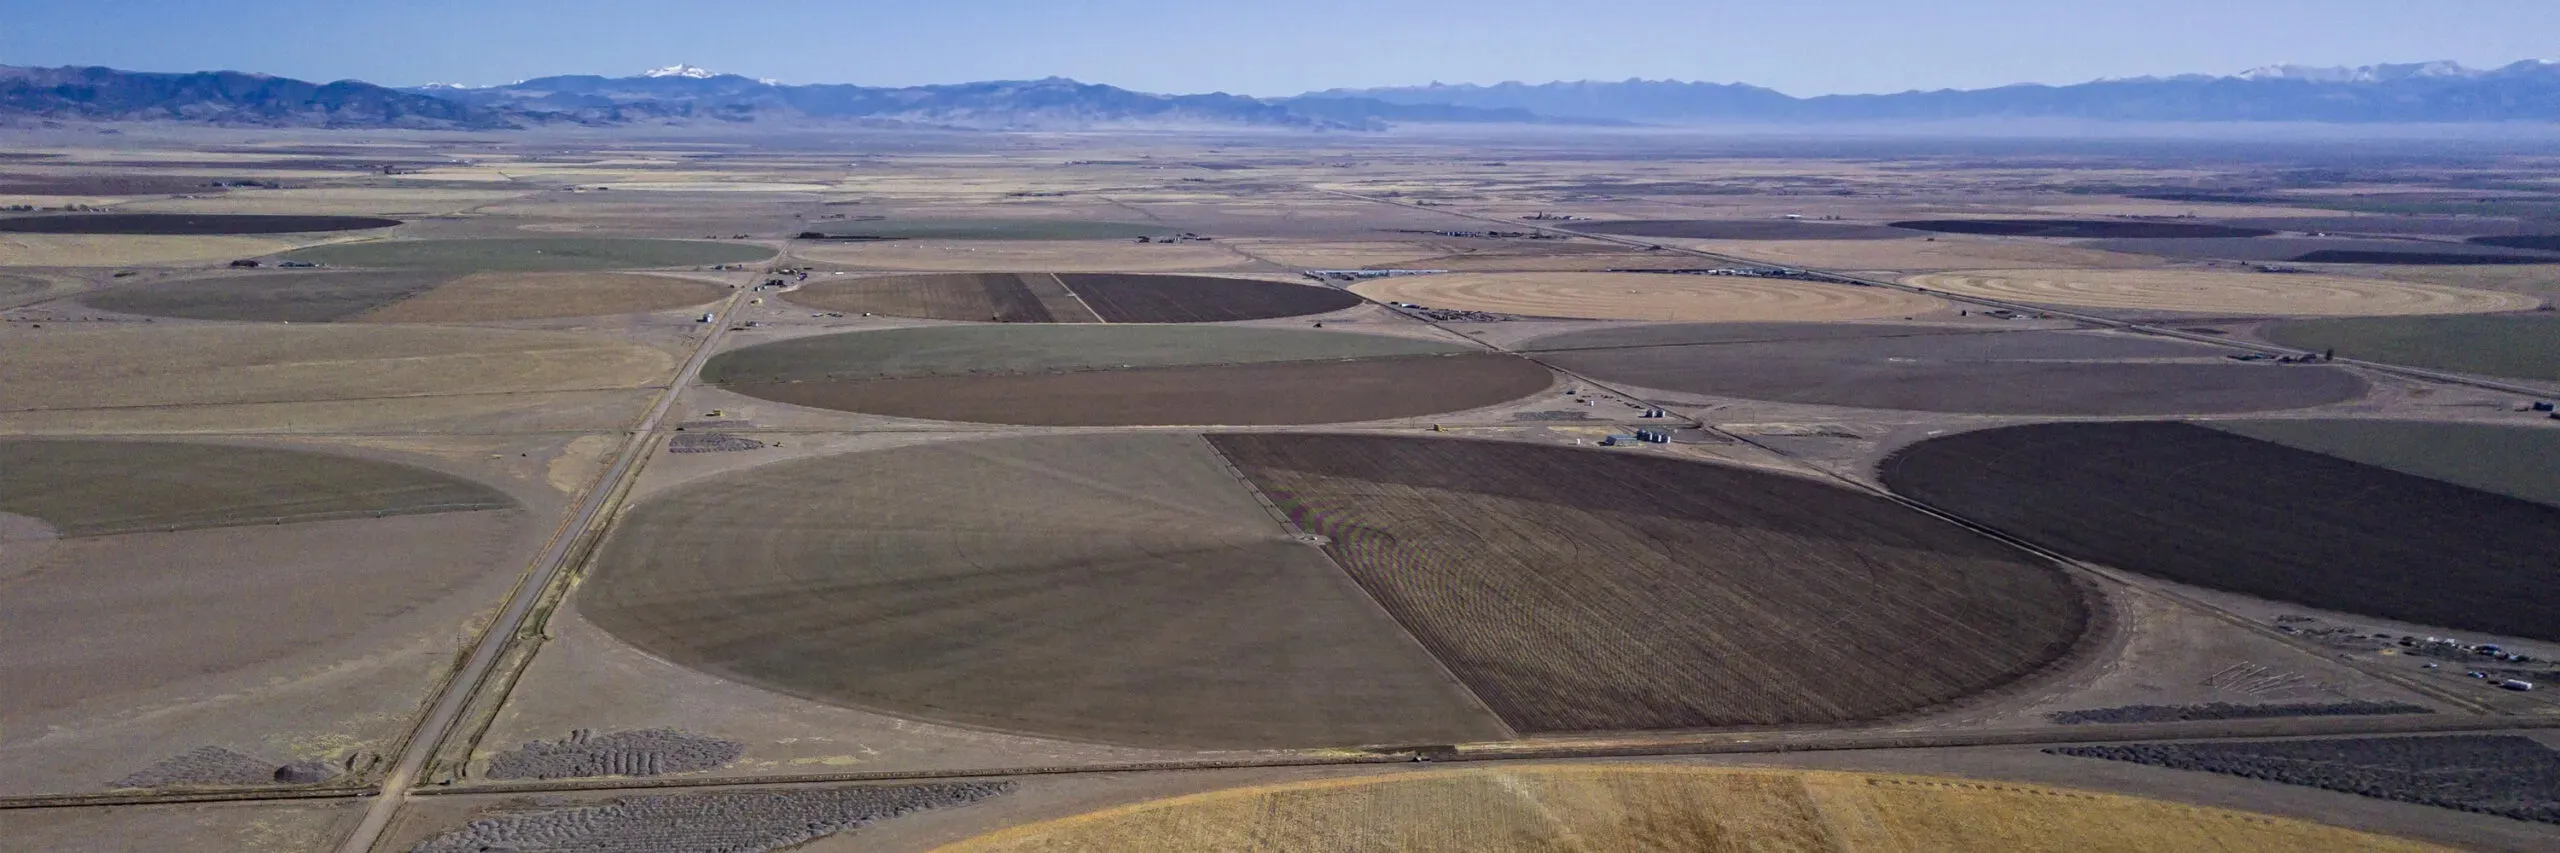
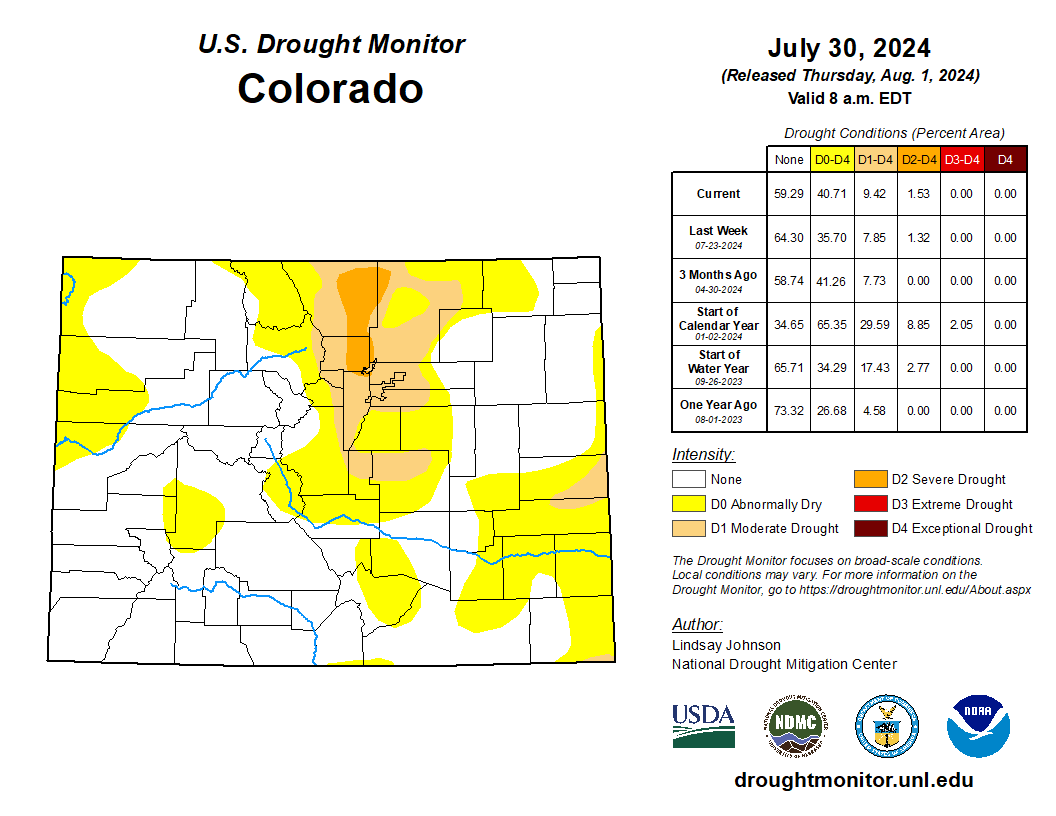
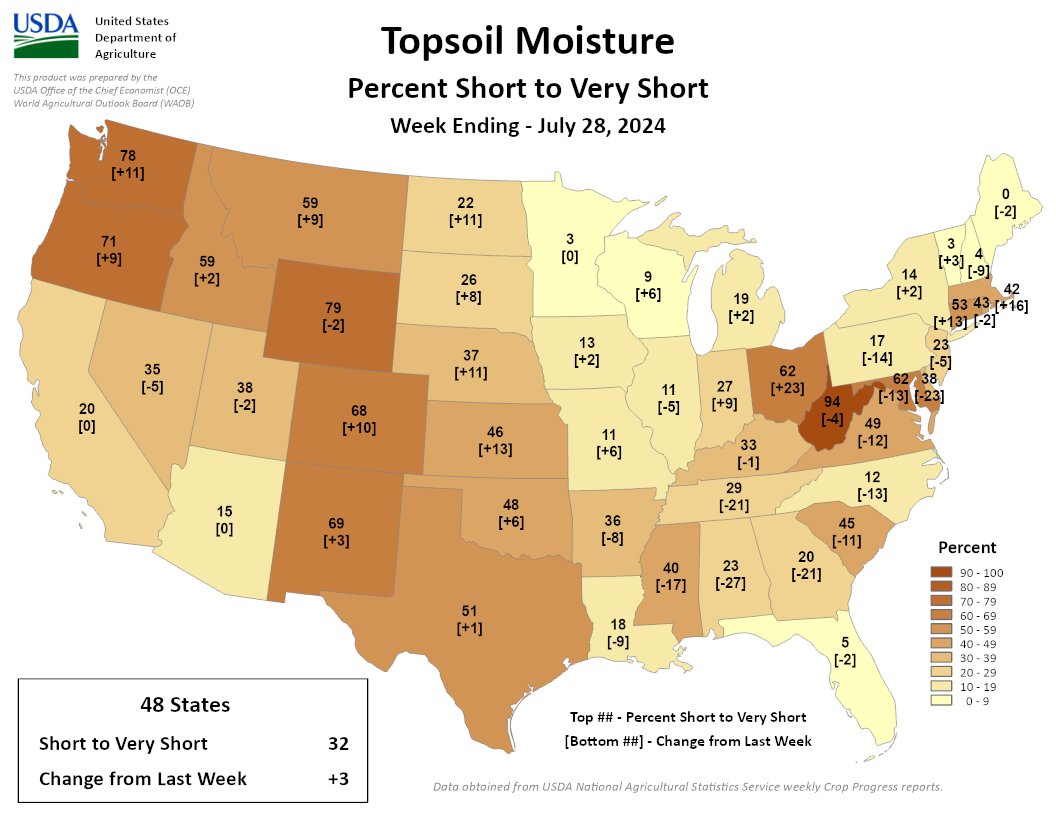
In Colorado, water used for fracking averaged about 26,000 acre-feet per year from 2011 to 2020, or about 0.17% of the water used in the state, according to the Colorado Division of Water Resources. One acre-foot roughly equals the annual water used by two to three households.

The highest volumes of water used for hydraulic fracturing are used within the counties along the Front Range in Denver-Julesburg Basin.

“In an arid state like Colorado, where we’re worried about how much water is getting down the Colorado River, that rubs a lot of people the wrong way. And it should,” said Joseph Ryan, an environmental engineering professor at the University of Colorado.

Attack of the viral “spiders”

The complex cocktail of produced water also comes with another ingredient: bacteria.

Some of the bacteria can corrode pipes while others sour the gas, which makes it stinkier and requires more processing. Both can cost oil and gas companies money, Hildebrand said.

Historically, companies have treated these bacteria with disinfectants, like chlorine and hydrogen peroxide. But over time, the bacteria can become more resistant. To protect themselves, they change their membrane structure to become less permeable — like putting on a raincoat in a storm, he said.

Some companies end up using twice as many chemicals to kill the same amount of bacteria, which is more costly and less environmentally sustainable, he said.

So the researchers set out to test another technology: The bacteriophage.

Bacteriophages are viruses that infect specific bacteria. They’re like the spiders in the “Starship Troopers” movie, Hildebrand said. Once the phage finds its host bacteria, it hooks into the surface of the cell, injects its DNA into the center of the bacteria, and hijacks the bacteria’s replication mechanisms.

Then it reproduces until the bacteria explodes.

The process allows the virus to multiply exponentially and infect more cells. But Hildebrand stressed the virus targets only its specific host bacteria, not any other type of cell.

Bacteriophages have been used for decades in medicine to treat issues like skin infections, indigestion and food poisoning caused by E. coli.

“Under the microscope, at the atomic scale, it’s scary. It’s an all-out civil war between bacteria and viruses,” he said. “But from the human perspective, it’s totally innocuous.”

Is the virus enough?

The researchers’ study showed that bacteriophages successfully deactivated two strains of bacteria found in produced water — but there are some key hurdles that would need to be addressed for the technique to be used by oil and gas operators.

Produced water could include tens of thousands of bacterial strains, which means researchers would need far more strains of viruses to disinfect the produced water. And right now, there aren’t enough commercially available bacteriophage strains to make it happen, Hildebrand said.

“The goal is, we just learn enough from all of the basins that ultimately I build a 200-phage cocktail that’s kind of a kill-all, if you will. It’s a belt-and-suspenders approach,” he said. “Once I build it initially, it will renew itself in the environment.”

After the up-front costs, the bacteriophage technique would cost less than a penny per barrel because the virus renews itself, Hildebrand said based on his economic estimates.

Ryan of CU Boulder has doubts, big ones.

When it comes to reusing produced water, corroding pipes are a small problem compared to the radioactivity, salinity and carcinogenic compounds, he said.

There are so many microorganisms in the water that it would be difficult to affordably find enough bacteriophages to completely disinfect it. There’s no way fixing the minor problems caused by bacteria would be worth the effort and cost, he said.

“It’s a questionable solution to a problem that just doesn’t seem at the top of the list of importance if you’re trying to do something with produced water,” Ryan said.

Hildebrand acknowledged that disinfection alone is not enough to clean produced water to a reusable level, but it would help, especially if the bacteria have become resistant to other disinfection methods.

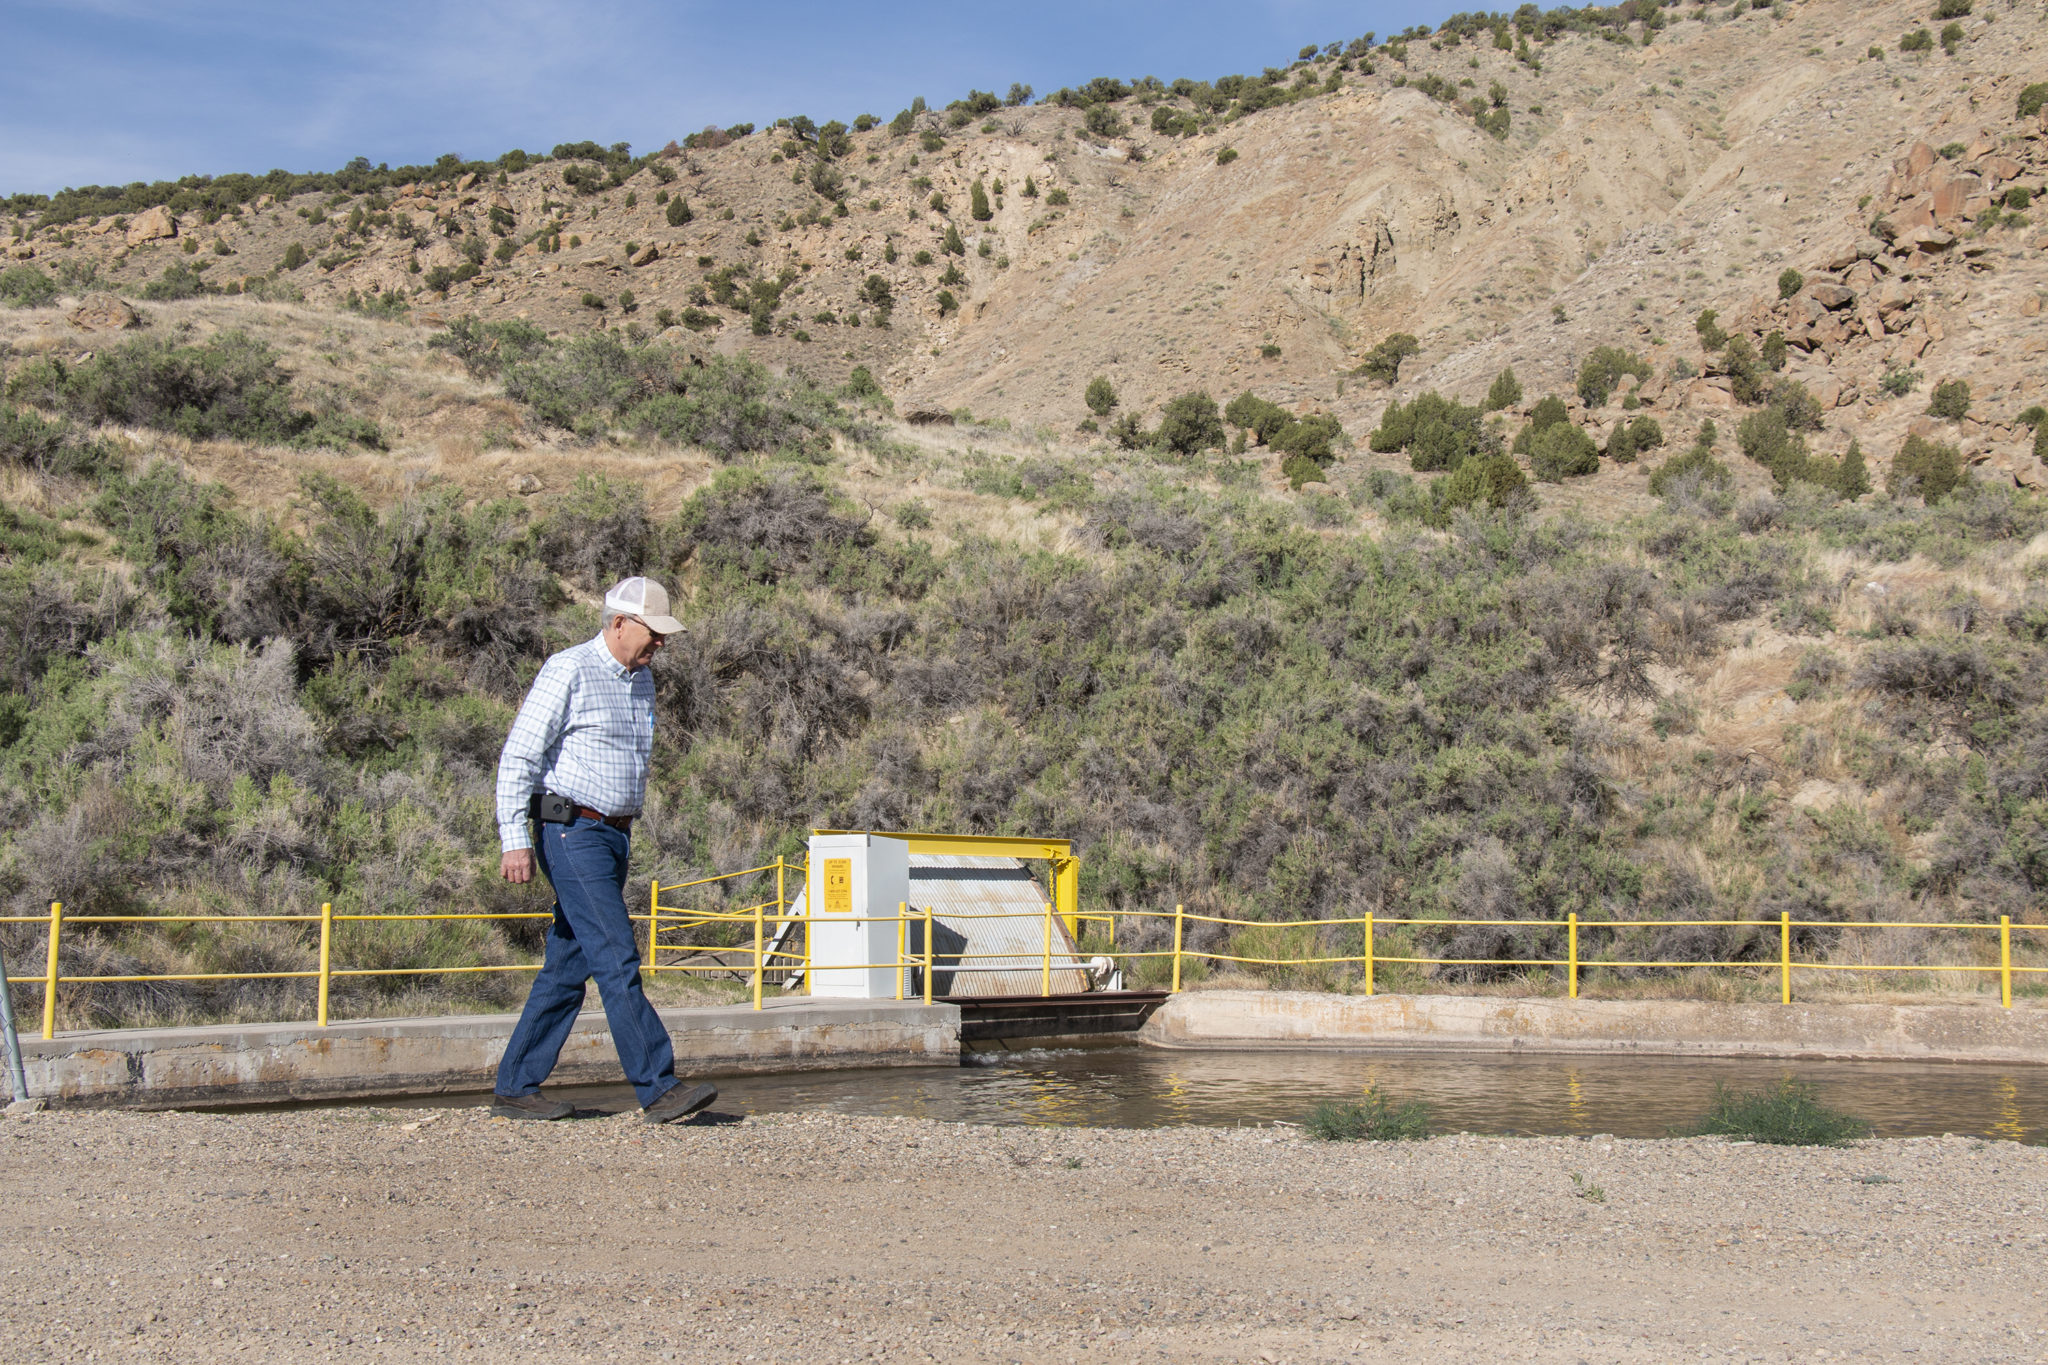
Ryan is one of 31 people on the Colorado Produced Water Consortium, which includes industry, state, federal and environmental representatives. (He emphasized he was not speaking for the group.)

In 2023, the Colorado legislature created the consortium to study how to reuse and recycle wastewater from fracking. The group is set to publish its fourth study on produced water Aug. 1 — one of nine that will be presented to legislators and state agencies.

Hope Dalton, the consortium’s director, declined to comment on the fresh-out-of-the-lab research.

“Generally speaking, bench-level research is innovative and new and hasn’t been tested,” she said. “Then you go out to industry and use it on the larger, pilot scale. Once it’s proven at the larger, pilot scale, then it can be implemented as practice.”

That’s the next step for the Texas researchers, Hildebrand said.

“Yes, it’s very early stages, but considering how effectively it works … how robust the phages are and how cheap they are to produce, I think it provides a really unique solution moving forward,” he said.

More by Shannon Mullane

#Colorado Parks & Wildlife provides update on the discovery of zebra mussel veligers in the #ColoradoRiver and Government Highline Canal #COriver

Mark Harris, General Manager of the Grand Valley Water Users Association, checks on the entrance to Tunnel 3, where water in the Government Highline Canal goes through the mountain to Palisade, continuing to Grand County. Photo credit: Bethany Blitz/Aspen Journalism

Click the link to read the release on the Colorado Parks & Wildlife website (Rachael Gonzales)

July 26, 2024

Colorado Parks and Wildlife (CPW) announces additional zebra mussel veligers found in the Colorado River and Government Highline Canal after increased testing. With these additional detections, both the Highline Government Canal and the Colorado River meet the criteria for being considered “positive” for zebra mussels.

After the discovery of zebra mussels in the Government Highline Canal and Colorado River, CPW initiated an Invasive Species Rapid Response Plan and increased sampling efforts in the Colorado River from Glenwood Springs down to the Colorado/Utah border and within the Highline Government Canal. 

Through these sampling efforts, one additional zebra mussel veliger was discovered and confirmed in the Government Highline Canal and two additional veligers were discovered and confirmed in the Colorado River at two separate locations between Deb Beque and Grand Junction. There have been no veligers found upstream of the Beavertail Mountain Tunnel in the De Beque Canyon nor have any adult mussels been found in the Colorado River or the Government Highline Canal.

“These results will help guide us on the next steps as we continue working closely with our partners to work on a plan to protect our natural resources and infrastructure crucial to the Grand Valley, including our goal of locating the source,” said CPW Director Jeff Davis.

CPW Aquatic Nuisance Species (ANS) and Northwest Region aquatics staff, along with our partners at the U.S. Fish and Wildlife Upper Colorado Native Fish Recovery Program and U.S. Bureau of Reclamation will continue sampling efforts in the Colorado River and Grand Valley canal systems over the next several weeks. The goal of these efforts is to locate the source of the zebra mussel veligers.

In addition to sampling, CPW continues the increased education efforts on the Colorado River, including voluntary watercraft inspections. From Friday, July, 19 through Sunday, July 21, CPW worked with our local government and the BLM partners to post signage and conduct education outreach at multiple water access points from the De Beque boat ramp to the Westwater boat ramp in Utah. During this three-day operation, ANS and Grand Junction area parks and wildlife staff talked to close to 600 people regarding the importance of cleaning, draining, and drying their watercraft and equipment. 

CPW is continuing to evaluate options for the future management of Highline Lake based on this new information. Updates regarding access, fishing regulations, and water management will be provided once those decisions have been made.

The #EagleRiver Water & Sanitation District and Upper Eagle Regional Water Authority decline to participate in another #PFAS settlement — The #Vail Daily

Eagle River Basin

Click the link to read the article on the Vail Daily website (Zoe Goldstein). Here’s an excerpt:

July 28, 2024

Little is known about the full impact of so-called ‘forever chemicals,’ and settlement would prevent participants from suing in the future

In the fall, the district and authority declined to participate in two PFAS-related settlements. Last month, district staff received information about a new settlement the district and authority could elect to participate in, with similar terms to those in the fall, and lower compensation. During their regular meetings on Thursday, July 25, the district and authority boards reviewed and declined the new settlement proposal, and authorized district staff to make decisions about similar settlements going forward…

The district and authority have conducted three studies to sample the water they provide for PFAS over the last five years. Data from the most recent study, conducted in 2023, shows that PFAS have been detected in five out of 11 of the two water providers’ sources, with four detections within the authority, and one in the district. All five detections were below the maximum contaminant level of four parts per trillion. For reference, one part per trillion is the equivalent of one drop of water in 20 Olympic-sized swimming pools…

Part of the challenge of sampling for PFAS is that technology has not caught up to the chemicals — though there are thousands of PFAS chemicals, only 29 can currently be detected. At the moment, not all labs in the United States can test for PFAS, and the testing is very expensive. The district and authority will next sample for PFAS in 2025.

San Miguel County Commissioners support preserving Shoshone water rights: #ColoradoRiver Water Conservation District working to ensure water stays in the river — The #Telluride Daily Planet #COriver #aridification

View of Shoshone Hydroelectric Plant construction in Glenwood Canyon (Garfield County) Colorado; shows the Colorado River, the dam, sheds, a footbridge, and the workmen’s camp. Creator: McClure, Louis Charles, 1867-1957. Credit: Denver Public Library Digital Collections

Click the link to read the article on the Telluride Daily Planet website (Sophie Stuber). Here’s an excerpt:

July 27, 2024

The San Miguel Board of County Commissioners (BOCC) voted on Wednesday, July 24, to sign onto the Western District (Colorado Counties) letter to preserve Shoshone water rights. The letter, addressed to Colorado Senators Michael Bennet and John Hickenlooper, is in support of the Colorado River Water Conservation District’s aim to acquire and permanently protect the Shoshone water rights. The Shoshone Power Plant, off Interstate 70 near Glenwood Springs, possesses the oldest senior water rights directly on the Colorado River in Colorado. The plant generates 15 megawatts of electricity. This flow from Shoshone is critical in helping avoid low water levels further down the river…

The Colorado River Water Conservation District has spent more than 20 years fighting to permanently preserve the Shoshone water flow along with a coalition of western Colorado governments and water entities.

At the end of 2023, the Colorado River Water Conservation District and Xcel Energy formalized an agreement for the district to buy water rights for the Shoshone Power Plant from Xcel if the group was able to secure $99 million in funding. The agreement is part of a decades-long effort to help establish stable water flows below the power plant and to the Utah border…With the agreement, Colorado River Water Conservation District will own the water rights and lease them back to Xcel to create hydroelectric power…Colorado River Water Conservation District is also working to ensure that Shoshone’s water stays in the river and is not diverted even when the power plant is not generating hydropower. The district is in negotiations with the Colorado Water Conservation Board. Even after reaching an agreement between the district, the board and Xcel Energy, the case will still have to go through court to legally update the water rights.

New data enters #ColoradoRiver negotiations — #Aspen Daily News #COriver #aridification

Water from the Roaring Fork River basin heading east out of the end of the Twin Lakes Tunnel (June 2016), which is operated by the Twin Lakes Reservoir and Canal Co., a member of the Front Range Water Council. Photo: Brent Gardner-Smith/Aspen Journalism

Click the link to read the article on the Aspen Daily News website (Austin Corona). Here’s an excerpt:

July 28, 2024

Two prominent water researchers and the state of Colorado disagree on the significance of new water use data published by the federal government in June. The state claims the data confirms its argument that headwaters states use less Colorado River water during dry years. Meanwhile, former Colorado River Water Conservation District general manager Eric Kuhn and Utah State University professor Jack Schmidt say the data paints a more complex picture.

“Reclamation has worked extremely hard to bring the best cutting-edge science they can to a better and more accurate estimate of agricultural water use,” Schmidt said. “It’s just that the relationships that arise from better data are just as murky.” 

The June data details the “consumptive” water use by “Upper Basin” states (Colorado, New Mexico, Utah and Wyoming) since 1971. It is meant to quantify all the water those four states have consumed in that period (see footnote * at story’s end). The Bureau of Reclamation, the federal agency that manages most of the large dams on the Colorado River, has updated the data in five-year reports since 1971, but June’s report is different. This time, the bureau collected the data using a new methodology.  The results are notable — past data seemed to indicate that Colorado and other Upper Basin states used more Colorado River water during dry years, directly contradicting Colorado’s arguments about its use. According to the state, the new data corrects that inconsistency. This conclusion could be vitally important for Upper Basin states. The relationship between the Upper Basin’s water use and the natural water supply is a central component of its position in interstate negotiations over the river…

Located at the river’s headwaters, Colorado and other Upper Basin states argue that they already take “natural” water cuts in dry years. Without a large upstream reservoir to fall back on, these states say they rely heavily on yearly precipitation for their water supply, meaning drought years are already tough…The argument foundered on the fact that the reclamation bureau’s consumptive use data didn’t support it. In 2022, three notable water researchers — Kuhn, Schmidt and University of New Mexico professor John Fleck — published a blog post laying out the disconnect between the federal government’s numbers and Colorado’s claims. In their piece, the three researchers wrote that while certain parts of the Upper Basin certainly cut their use in dry years, the basin’s overall use did not reflect that anecdotal reality…

*** One way for the Upper Basin states to make their case stronger is to change the way the Bureau of Reclamation accounts for consumptive use in transmountain diversions, or TMDs — the tunnels that carry water from inside the Colorado River Basin to cities and farms outside the basin (there are two that take water out of the Roaring Fork watershed and send it to the Front Range). There is a gray area in which the actual “consumption” takes place for TMDs that have storage reservoirs at their intakes. Colorado and Upper Basin states would like to say consumption occurs when they take water from the river system and put it in the reservoirs while the reclamation bureau currently sees consumption occurring when the water leaves the reservoir and enters the tunnel. Using the Upper Basin states’ preferred method, the basin’s consumptive use changes to 4.5 million acre-feet in wet years, 4.1 in average years and 3.9 in dry years, making a much stronger case for the argument that the basin uses less in dry years.

The Hottest (and Coolest) Neighborhoods in #Denver: All five of Denver’s hottest neighborhoods are located dowtown — Westword

Denver residents experience between 12.5 and 4.9 degrees of additional heat depending on their location in the city. Climate Central. Credit: Climate Central (https://www.climatecentral.org/graphic/urban-heat-islands-2024?graphicSet=Urban+Heat+Island+Map&location=Chicago&lang=en)

Click the link to read the article on the Westword website (Hannah Metzger). Here’s an excerpt:

July 26, 2024

In certain parts of the city, Denver residents face temperatures up to twelve degrees higher than they should be, according to the Urban Heat Island index released this month. The index from Climate Central estimates how much additional heat different areas experience based on their built environments. On average, Denver is 7.84 Fahrenheit degrees hotter than air temperatures just outside of the city, according to the index, with the temperature boosts ranging from as high as 12.5 degrees to as low as 4.9 degrees per census block group — more than a seven-degree difference. By neighborhood, the averages range from 10.95 to 5.50 degrees hotter. The index analyzes 65 major cities across the country, with Denver ranking 48th for overall average temperature increase. However, the Mile High City jumps to 17th place for most residents living in areas that are at least nine degrees warmer. Over 49,000 Denver residents live in such areas, according to the index…

All five of Denver’s hottest neighborhoods are located downtown and border one another. The top three coolest neighborhoods are all on the far northeastern edge of the city, nearing Aurora and Commerce City. The only centrally located neighborhood to crack the top-coolest list houses the 160-acre Washington Park. The Urban Heat Island index estimates that Denver’s temperature increases by census block groupsWestword combined the data for each of the city’s 78 neighborhoods, averaging the temperatures of the census block groups as they fall within neighborhood boundaries. Here are the top five hottest and coolest neighborhoods in Denver, so you know where to seek relief during the next heat wave:

Hottest Neighborhoods

5. Civic Center
9.13 degrees hotter
Bounded by West Colfax Avenue to the north, Broadway to the east, and Speer Boulevard to the southwest. Includes the Denver Art Museum and part of Civic Center Park featuring the City and County Building.

4. North Capitol Hill
9.66 degrees hotter
Bounded by East 20th Avenue to the north, Park Avenue and North Downing Street to the east, East Colfax Avenue to the south, and Broadway to the west. Includes the Fillmore Auditorium and the Cathedral Basilica of the Immaculate Conception.

3. Auraria
9.70 degrees hotter
Bounded by Cherry Creek to the northeast, West Colfax Avenue to the south, and the South Platte River to the northwest. Includes the Auraria campus, housing the University of Colorado Denver, Community College of Denver and Metropolitan State University.

2. Central Business District
10.85 degrees hotter
Bounded by 20th Street to the northeast, Broadway to the east, West Colfax Avenue to the south, Cherry Creek to the west, and Lawrence Street to the northwest. Includes the Colorado Convention Center and part of the 16th Street Mall.

1. Union Station
10.95 degrees hotter
Bounded by 20th Street to the northeast, Lawrence Street to the southeast, Cherry Creek to the southwest, and the South Platte River to the northwest. Includes Union Station, Commons Park and part of the 16th Street Mall.

Sunrise over Sloan’s Lake in Denver July 27, 2024. Wildfire smoke creating the colors.

Tribal access to water – filling a key gap — John Fleck (InkStain.net)

Bipartisan Infrastructure Law and Inflation Reduction Act Funding Handbook

Click the link to read the article on the InkStain website (John Fleck):

Congress set aside substantial sums of money in 2021 and ’22 in the Bipartisan Infrastructure Law and the Inflation Reduction Act to address needs for access to safe, clean drinking water. But, as John Echohawk puts it:

“While the appropriation of funding for infrastructure is a critical first step, it is only that – continuing and concerted efforts must be made to ensure that Tribal communities are able to access and deploy this funding and that meaningful gains are made in reducing the water access gap in Indian country.”

Echohawk makes those comments in the introduction to the new Handbook from the Universal Access to Clean Water for Tribal Communities project, out today. The challenge now is for Tribal communities to navigate the complexities of federal funding process which are, to see the least, a significant challenge.

We’ve written about this challenge before in this space – a staggering 48 percent of tribal homes, according to the Universal Access project’s analysis, lack access to reliable water sources, clean drinking water, or basic sanitation. Money helps, but getting the money to the communities that might benefit requires negotiating a maze of federal process.

The new handbook (link to the handbook and a summary document here) outlines the many different pathways and requirements to translate Congressional intent to water projects on the ground.

The report is crucial for helping move down the path. Also, bonus points to the team that put it together for the stunning Tara Kerzhner photos.

Navajo Unit operations update July 28, 2024 #SanJuanRiver #ColoradoRiver #aridification

From email from Reclamation (Susan Novak Behery):

July 26, 2024

Reclamation will be fulfilling a request to release the first block of the Jicarilla Apache Nation (JAN) subcontracted water that has been leased to the New Mexico Interstate Stream Commission (NMISC) and The Nature Conservancy (TNC) for calendar year 2024.

The subcontracted water released from the Navajo Unit will augment the current release of 700 cfs by 250 cfs (for a total of 10 days) and 500 cfs (for a total of 5 days) as requested by the NMISC and TNC. The table below shows the release schedule. Any changes to this schedule will be sent out in subsequent notices. The total volume of JAN subcontracted water for this release is 10,000 acre-feet. An additional 10,000 acre-feet will be released later this calendar year with the same augmentation pattern.

Date Day4:00 AM Release (cfs)
7/31/2024Wed950
8/1/2024Thu950
8/2/2024Fri950
8/3/2024Sat950
8/4/2024Sun950
8/5/2024Mon1200
8/6/2024Tue1200
8/7/2024Wed1200
8/8/2024Thu1200
8/9/2024Fri1200
8/10/2024Sat950
8/11/2024Sun950
8/12/2024Mon950
8/13/2024Tue950
8/14/2024Wed950

Following this operation, the release will return to 700 cfs, or whatever is required to maintain the target baseflow through the endangered fish critical habitat reach of the San Juan River (Farmington to Lake Powell).  The San Juan River Basin Recovery Implementation Program recommends a target base flow of between 500 cfs and 1,000 cfs through the critical habitat area.  The target base flow is calculated as the weekly average of gaged flows throughout the critical habitat area from Farmington to Lake Powell.

Mussel discovery complicates river recreation — The #GrandJunction Daily Sentinel #ColoradoRiver #COriver

Zebra and Quagga Mussels

Click the link to read the article on the Grand Junction Daily Sentinel website (Dan West). Here’s an excerpt:

July 26, 2024

Colorado Parks and Wildlife isn’t wasting any time since the detection of zebra mussel veligers (larva stage) in the Colorado River and Government Highline Canal in Mesa County in getting the word out to boaters to clean, drain and dry their boats after being in the river. A mobile waterless boat cleaning station made by the company CD3 is now parked in Palisade’s Riverbend Park near Harky’s Launch Boat Ramp. CPW also has a stationary cleaning station at the Loma Boat Ramp.

“We started rolling out our education plan for zebra mussels and this is on top of all the sampling and things we’re doing as well,” said Northwest Region Public Information Officer Rachael Gonzales. “We are, throughout the Grand Valley, taking out our CD3, which is our waterless (boat cleaning station).”

The waterless cleaning stations have compressed air and a vacuum to help people clean smaller watercraft like kayaks and paddleboards, Gonzales said. There is a more elaborate system at Highline Lake State Park that uses hot water, but is intended for larger craft with motors. This year, Highline Lake is only allowing non-motorized craft. CPW shut down Highline to boaters after the decision was made to drain down the lake to attempt to eradicate its mussels infestation. Previous efforts using chemicals were unsuccessful after mussels were first discovered in Highline Lake in the fall of 2022. In addition to the new watercraft cleaning stations, Gonzales said CPW will have people out around the valley talking one-on-one with boaters and people using the river to explain the importance of cleaning everything from boats to fishing gear that go into the Colorado River.

Upper Arkansas Water Conservancy District Announces next General Manager — Heart of the Rockies Radio #ArkansasRiver

Greg Felt via his Facebook page February 2020.

Click the link to read the article on the Heart of the Rockies website (Joe Stone). Here’s an excerpt:

Jul 18, 2024

At the July 11 meeting of the Upper Arkansas Water Conservancy District, the board of directors selected Gregory W. Felt to become the District’s next general manager. Felt will assume this position on January 1, 2025. He will be replacing long-time manager Ralph “Terry” Scanga, who is retiring at the end of 2024, and will be only the third general manager of the UAWCD in its 45-year history.  Founded in 1979, the District serves the Upper Arkansas Basin by protecting water rights and working to maintain and increase the beneficial use of water in the basin.

Felt, an 18-year member of the Board of Directors, arrived in Chaffee County in 1985 to work as a guide on the Arkansas River. He earned a bachelor’s degree from Yale University while guiding rafting and fishing trips each summer. Felt and his wife Susan went on to start their own rafting company, Canyon Marine, and to co-found ArkAnglers with Rod and Connie Patch. His early years in business led Felt to take a strong interest in the hydrology and water management of the river.

R.I.P. John Mayall: “So many roads, yeah. So many trains to ride.”

John Mayal in 1968. This is an image from the Nationaal Archief, the Dutch National Archives, donated in the context of a partnership program

Click the link to go to the Wikipedia entry:

John Brumwell Mayall OBE (29 November 1933 – 22 July 2024) was an English blues and rock musician, songwriter and producer. In the 1960s, he formed John Mayall & the Bluesbreakers, a band that has counted among its members some of the most famous blues and blues rock musicians. A singer, guitarist, harmonica player, and keyboardist, he had a career that spanned nearly seven decades, remaining an active musician until his death aged 90. Mayall has often been referred to as the “godfather of the British blues“, and was inducted into the Rock and Roll Hall of Fame in the musical influence category in 2024…

Mayall died at his home in California on 22 July 2024, at the age of 90.

Happy belated #ColoradoRiver Day #COriverDay #COriver #aridification

Moose heading down to the wetlands and the Colorado River in Rocky Mountain National Park May 19, 2023.

What causes lightning and how to stay safe when you’re caught in a storm – a meteorologist explains — The Conversation

Baseball fans clear the stands as lightning strikes near the Colorado Rockies’ stadium in 2019. Julio Aguilar/Getty Images

Chris Vagasky, University of Wisconsin-Madison

As the weather warms, people spend more time outdoors, going to barbecues, beaches and ballgames. But summer isn’t just the season of baseball and outdoor festivals – it’s also lightning season.

Each year in the United States, lightning strikes around 37 million times. It kills 21 people a year in the U.S. on average.

For as often as lightning occurs – there are only a few days each year nationwide without lightning – there are still a lot of misunderstandings about nature’s largest spark. Because of this, a lot of people take unnecessary risks when thunderstorms are nearby.

I am a meteorologist who studies lightning and lightning safety, and a member of the National Lightning Safety Council. Here are some fast facts to keep your family and friends safe this summer.

What is lightning, and where does it come from?

Lightning is a giant electric spark in the atmosphere and is classified based on whether it hits the ground or not.

In-cloud lightning is any lightning that doesn’t hit ground, while cloud-to-ground – or, less commonly, ground-to-cloud – is any lightning that hits an object on the ground. Cloud-to-ground lightning accounts for only 10% to 50% of the lightning in a thunderstorm, but it can cause damage, including fires, injuries and fatalities, so it is important to know where it is striking.

A vibrant display of lightning striking the tall tower and zigzagging through the sky.
Lightning strikes One World Trade Center in New York City and carries through clouds over the Hudson River in April 2023. Gary Hershorn/Getty Images

Lightning occurs when rain, ice crystals and a type of hail called graupel collide in a thunderstorm cloud.

When these precipitation particles collide, they exchange electrons, which creates an electric charge in the cloud. Because most of the electric charge exists in the clouds, most lightning happens in the clouds. When the electric charge in the cloud is strong, it can cause an opposite charge to build up on the ground, making cloud-to-ground lightning possible. Exactly what initiates a strike is still an open question.

When and where does lightning happen?

Lightning can happen any time the conditions for thunderstorms – moisture, atmospheric instability, and a way for air to rise – are present.

There is a seasonality to lightning: Most lightning in the United States strikes in June, July or August. In just those three months, more than 60% of the year’s lightning typically occurs. Lightning is least common in winter, but it can still happen. About 2% of yearly lightning occurs during winter.

No state is immune from lightning, but it is more common in some states than others.

Texas, Florida, Oklahoma, Louisiana and Mississippi are often among the leaders in total lightning strikes, but more than 30 states regularly see at least 1 million in-cloud and cloud-to-ground lightning events each year.

How to stay safe from lightning

Almost three-quarters of U.S. lightning fatalities occur between June and August. Luckily, staying safe from lightning is easy.

Keep an eye on the forecast and reconsider outdoor plans if thunderstorms are expected, especially if those plans take you near the water. Beaches are dangerous because lightning tends to strike the highest object, and water is a good conductor of electricity, so you don’t want to be in it.

Remember: No place outside is safe during a thunderstorm, so when thunder roars – go indoors. When you see the clouds building up, hear thunder or see a flash of lightning, it’s time to dash inside to a lightning-safe place.

What is a lightning-safe place?

There are two safe places to be during a thunderstorm: a substantial building or a fully enclosed metal vehicle.

A substantial building is a house, store, office building or other structure that has four walls and a roof, and where the electrical wiring and plumbing are protected inside the walls. If lightning strikes the building or near it, the electricity from the lightning travels through the walls and not through you. Dugouts, picnic shelters and gazebos are not safe places.

If you’re in a fully enclosed metal vehicle during a thunderstorm and lightning strikes, the electricity travels through the metal shell, which keeps you safe. It’s not the rubber tires that protect you – that’s a common myth. So, golf carts and convertibles won’t keep you safe if lightning strikes.

When you’re outdoors and lightning approaches, head to a lightning-safe place, even if it’s a distance away. Stay away from trees, especially tall and isolated ones, and don’t crouch in place – it doesn’t make you safer and just keeps you in the storm for longer.

Stay safe this summer

While you’re enjoying your summer plans, keep lightning safety in mind.

If someone nearby does get hit by lightning, lightning victims don’t hold the electric charge, so call 911 and begin first aid right away. About 90% of lightning victims survive, but they need immediate medical attention.

Chris Vagasky, Meteorologist, University of Wisconsin-Madison

This article is republished from The Conversation under a Creative Commons license. Read the original article.

#Colorado’s mid-July 2024 heat wave: where did it rank? — @ColoradoClimate Center #ActOnClimate

Click the link to read the blog post on the Colorado Climate Center website (Russ Schumacher):

July 23, 2024

Leading up to the weekend of July 12-14, weather forecasts were indicating the potential for extreme heat in parts of Colorado. I was getting messages from people saying that their weather apps were showing that all-time records would be broken by multiple degrees (which mostly warranted an eye-roll.) On both Saturday the 13th and Sunday the 14th, there were just enough afternoon clouds and showers to keep the temperatures from reaching historic highs. But it was still a noteworthy heat wave, especially along the Front Range. Fort Collins reached a high of 102°F on Friday the 12th, one degree shy of the all-time record, and only the 7th time in over 130 years of records it had been that warm. That same day, Colorado Springs reached 100°F for only the 12th time, also one degree shy of the all-time record.

Below are maps of the average temperature for the four-day period from the morning of Friday the 12th through the morning of Tuesday the 16th, and how it compares to the 30-year “normal” for those four days.

Average temperature from NOAA’s nClimGrid dataset, for 13-16 July 2024. nClimGrid defines days as ending in the early morning, so this includes the period from the morning of the 12th through the morning of the 16th. Credit: Russ Schumacher/Colorado Climate Center
Temperature departure from average from NOAA’s nClimGrid dataset, for 13-16 July 2024. nClimGrid defines days as ending in the early morning, so this includes the period from the morning of the 12th through the morning of the 16th. Credit: Russ Schumacher/Colorado Climate Center

The very highest temperatures over this period were in some of the usual places at lower elevations, like the Arkansas Valley in southeast Colorado, and the Grand Valley on the western slope. But because these are Colorado’s usual hot spots, the heat wave wasn’t as extreme compared to average in those areas. The mountains provided their usual respite from the heat. (The long-term station at Dillon made it up to 84°F, which is pretty warm for a location that has never recorded a 90-degree day.) The temperature anomaly map shows that the Urban Corridor saw the most unusually hot conditions. From the Palmer Divide down through Pueblo County, most locations were more than 8°F above average over these four days.

How does this compare to past heat waves?

To address this question, we will build upon the analysis in the Climate Change in Colorado report, which looked at trends in four-day heat waves using NOAA’s nClimGrid-daily dataset, which goes back to 1951. In that analysis, we divided up Colorado into 11 alternate climate divisions, which better represent climate variability than the official divisions that are defined by river basins. (Interested in the details on this? We just had a paper published describing the method and results.) The map below shows where this heat wave ranked in those alternate climate divisions.

Map showing the ranking of the mid-July 2024 heat wave in different regions of Colorado, based on the nClimGrid-daily dataset going back to 1951. Overlapping time periods have been removed. If no ranking is shown in a region, the mid-July 2024 heat wave did not rank in the top 15. Credit: Colorado Climate Center

It wasn’t a record-breaker in any of the regions, but in the Northern Front Range and Pikes Peak regions, it was a top-10 four-day heat wave. Averaged across the entire state, it ranked as the 14th hottest 4-day heat wave since 1951. So, perhaps not one for the history books, but still worthy of the attention it received. You might then wonder, when were the heat waves that ranked at the top?

Rankings of the top 15 four-day heat waves for Colorado statewide, and for the Pikes Peak and Northern Front Range climate divisions. Based on NOAA nClimGrid-Daily, with overlapping periods removed. Credit: Colorado Climate Center

Pretty much everywhere in the state, the top-ranked four-day heat wave was from June 24-27, 2012. During this time period, multiple intense wildfires were raging across the state, including the Waldo Canyon fire that devastated neighborhoods on the west side of Colorado Springs. In second place statewide and in both the Pikes Peak and Northern Front Range climate divisions was in July 2005. Fort Collins set its all-time record high of 103°F during this heat wave. Mid-July of 1954 also shows up on these lists: many Front Range stations had their longest streaks of 100-degree days during that heat wave, although the nighttime lows were a bit cooler than the others so it doesn’t rank at the top overall.

What about the 1930s? What about climate change?

The nClimGrid-daily dataset, which features consistent data processing to allow for analysis of long-term changes, only goes back to 1951, which means it does not include the “dust bowl” era of the 1930s, during which intense heat and drought afflicted the Great Plains. At some individual long-term stations on Colorado’s eastern plains, heat waves in July of 1934 and 1936 still rank as hotter than those in more recent years (although at other stations, those records were surpassed by the June 2012 heat wave.) Grand Junction’s hottest 4-day period came in late July of 1931. Bob Henson and Jeff Masters at Yale Climate Connections recently published an insightful article on why the 1930s were so hot in North America, which includes the effects of poor soil management practices in the Great Plains.

We also know that the climate is warming, and that the frequency of heat waves is increasing in the western US. Most regions of Colorado saw significant increases in the number of heat waves from 1951-2020 (the exceptions being the central mountains, and the northeastern and southeastern plains). And these trends continue: the right panel below shows an updated graph for the Pikes Peak region through the present. The first 3+ years of the 2020s already had 12 heat waves in this region, which is more than than any full decade between the 1950s and 1990s. Future climate projections show that the frequency of heat waves is expected to increase much more, even in a moderate-emissions scenario.

Figure 4.2 of Climate Change in Colorado. Time series of the number of 4-day heat waves per decade from 1951-2020 for each climate division. Heat waves are defined as a 4-day period in which the daily mean temperature (the sum of the daily maximum and minimum temperatures divided by two), averaged over the four days, exceeds the 4-day average temperature that was exceeded on average once per year during 1971-2000. Credit: Colorado Climate Center
Updated version for the Pikes Peak region through the mid-July 2024 heat wave. Note that the rightmost bar represents less than 4 years (2021-present) while the other bars are full decades. Credit: Colorado Climate Center

Overall, what we’ve seen in Colorado isn’t that the most-extreme heat waves are getting more extreme. Record-smashing events are very rare even in a warming climate, and when air masses are hot enough aloft to have the potential for record-breaking heat, they often have just enough moisture to produce clouds and storms that reduce the surface temperature by a degree or two. Instead, what we’re seeing is a steady increase of heat: heat waves that would have been few and far between in the 20th century are now becoming commonplace. (I was able to do an extended interview on this topic on Colorado Public Radio’s Colorado Matters program that you can listen to here.)

A concluding note is that even with this heat wave in the middle of the month, July as a whole has not actually been especially warm across Colorado. Many stations are near to even a little below normal for temperature for the month, with the refreshing weather around the 4th of July and the cooler, wetter conditions this past weekend. However, the last week of the month looks like it will bring more hot, dry weather. This may end up putting July above average for temperature when the month concludes, and could add to the tally of heat waves in Colorado as well.

Know who else reads the #ENSO Blog? Investors! — NOAA

Click the link to read the article on the NOAA website (Derek Lemoine):

July 26, 2024

This is a guest post by Dr. Derek Lemoine, who is APS Professor of Economics at the University of Arizona’s Eller College of Management and a Research Associate of the National Bureau of Economic Research. Dr. Sarah Kapnick, currently the NOAA Chief Scientist, collaborated with Dr. Lemoine on NOAA CPO-funded research while at the NOAA Geophysical Fluid Dynamics Laboratory.

As regular readers of the ENSO blog know, the National Oceanic and Atmospheric Administration (NOAA) issues forecasts of the large-scale climate patterns that we may see many months later. But they may not know that the El Niño Southern Oscillation (ENSO) Outlook is but one of the seasonal climate outlooks that NOAA produces. Creating and disseminating these outlooks requires a large investment in monitoring and forecasting systems, scientists, forecasters, and, of course, climate.gov bloggers. Do these outlooks matter in the financial world?

In a new paper published in Nature Communications, Dr. Sarah Kapnick and I (an atmospheric scientist and economist odd couple, in work done before she became NOAA Chief Scientist) show that they matter to investors in financial markets. And, importantly, some matter more than others.

But first…options!

To test whether seasonal outlooks influence the market, we examined how the prices of options on stocks changed when a seasonal outlook was released. Why test option prices rather than stock prices? We have a clear prediction for how option prices should move on average when an outlook is released, whereas we lack this clear prediction for stock prices (footnote #1).

An option gives you the right—but not the obligation—to either buy or sell a particular company’s stock at a predefined “strike” price by a predefined “expiration” date. Let’s imagine that you’ve bought an option to buy stock and the expiration date is upon you. Should you exercise the option? If the stock’s price is now above the strike price, then yes: you get to buy the stock cheaply and can, if you want, immediately sell it at the market price for a profit. If the stock’s price is below the strike price, then no: just buy the stock on the open market if you want it, since you would pay more than necessary by exercising the option.

Earlier on, before the expiration date draws nigh, you have a lot of upside from holding the option because the actual stock price could end up way above your strike. And you have no corresponding downside because you can always walk away and let your option expire unexercised if the stock price ends up below your strike. Who doesn’t like upside risk when it’s not contaminated with downside risk?

So, you like holding an option. Now consider how much you would pay to acquire it. You tend to be willing to pay more to buy an option when you are more uncertain about what the stock’s price on the expiration date will be, because you get more of that sweet upside risk still without bitter downside risk. Conversely, the more certain you are about the future price of the stock, the less you are willing to pay for the option. So, the current price of an option tells us how uncertain investors must be about the future stock price. This measure of uncertainty is called “implied volatility,” as it is implied by market data. All else equal, higher prices for options imply more expected volatility; lower prices imply less.

This cartoon shows a case where the investor made a profit, but a different pathway is plausible as well. It is possible when the expiration date arrives, it turns out the investor paid too much for the option and the strike price is larger than the price of the fishing stock. In which case the investor may decide to not exercise the option. Cartoon Credit: Anna Eshelman, climate.gov.


You too can bet on outlooks

Our work shows that, on average, the implied volatility will fall when a seasonal outlook is released, but ONLY IF investors think that the seasonal outlook might say something relevant to the firm’s stock price (footnote #2). If investors think the seasonal outlook is either worthless as a forecast or irrelevant to a particular firm, then the firm’s stock and option prices will not be affected by the outlook. If they instead believe the outlook is both skillful and potentially relevant to that firm, then, before the outlook is released, the firm’s stock and option prices should reflect investors’ expectations of what the outlook will say.

Once a relevant outlook is released, the firm’s stock and option prices change to reflect the new information in the outlook. A particular outlook could increase uncertainty about the company’s future stock price by forecasting an especially unpredictable climate. However, once we average over many outlook releases, uncertainty about the company’s future stock price (in the form of implied volatility) falls upon the release of outlooks, simply because investors are no longer uncertain about what an outlook will say once they have the outlook in hand.

An example

Imagine that you are investing in a fishing company whose profits are affected by the state of ENSO. Its stock price should already incorporate investors’ expectations about what NOAA’s upcoming ENSO Outlook will say. For instance, they may already think an El Niño is coming, based on past months’ outlooks. If you think that an upcoming monthly update is unlikely to have much new to say, then that upcoming monthly update does not make you willing to pay much more for an option on the firm’s stock. But what if, instead, you think that an upcoming monthly update could offer additional news about how strong that El Niño will be? The greater the potential for news that is relevant to the value of the fishing company, the more uncertain you are about what its stock price will be once the monthly update is released. You are then willing to pay more for an option to take advantage of uncertainty about the firm’s stock price induced by the ENSO Outlook.

Once the seasonal outlook is released, uncertainty about the outlook’s contents vanishes. You may still be uncertain about what the seasonal climate will be, but you are no longer uncertain about what the outlook will say about it or how the outlook will affect the company’s stock price. If the outlook did not contain much new information about the coming El Niño, then you are now not willing to pay as much as before for the option on the fishing company. If other investors make similar assessments, the price of the option will fall.

Our study tested whether the degree of uncertainty implied by option prices (“implied volatility” again!) did indeed fall on average when seasonal outlooks were released from 2010–2019. If implied volatility did tend to decline, then some fraction of investors must have judged these climate outlooks to be skillful at forecasting patterns that are relevant to firms’ valuations—and thus to their stock prices.

June ENSO Outlook affects option prices throughout the economy

We find that, across approximately three thousand firms traded in U.S. markets, implied volatility does fall when NOAA releases the ENSO Outlook in June and the Winter Outlook in October. Investors do not know what the ENSO and Winter Outlooks will say ahead of the release, but they apparently believe they could say something relevant to firms’ stock prices. We do not detect a response to NOAA’s May Hurricane Outlook or to two less skillful outlooks: Colorado State University’s April Hurricane Outlook or the Farmers’ Almanac’s August Winter Outlook (footnote #3).

Because options are tied to particular companies, we can drill down on how broadly outlooks matter to different parts of the economy. When finely classifying firms into “industry groups”, we find that around 90% of industry groups see their implied volatility fall when NOAA releases the June ENSO Outlook. When we aggregate these industry groups into 21 broader “sectors”, we find significant effects of the June ENSO Outlook in an amazing 20 of them.

How much the June ENSO outlook matters to different sectors of the economy. Purple lines indicate a statistically significant change. Credit: Climate.gov, adapted from original by Lemoine and Kapnick.


Whether these economy-wide effects represent broad impacts of ENSO or instead represent impacts to particular firms rippling through trade networks, investors apparently believe ENSO has broad reach (footnote #4).

Overall, the June ENSO Outlook affects firms worth $13 trillion. An upcoming June ENSO Outlook incentivizes traders to pay an extra $12 million [95% confidence interval: $3.6–$20 million] to hold options. Traders seem to find this spending worth it in order to hedge the risk of what the outlook may say.

But what about other months’ ENSO Outlooks? The June ENSO Outlook was of most interest to us because it is the month when we’re most sure to be past the spring barrier and the accuracy of the ENSO Outlook increases. When we test each month’s ENSO Outlook, we indeed find that implied volatility falls by the largest amount upon the release of the June ENSO Outlook. In fact, that is the only month’s outlook for which the change in implied volatility is statistically significant.

Showing the change in implied volatility (%) by calendar month as a response to the ENSO outlook. The range shown in purple is statistically significant because all values of the 95% confidence interval (from top whisker to bottom whisker) are less than zero. The other months have ranges that overlap into positive values and, therefore, positive or zero change cannot be ruled out. Credit: Climate.gov, adapted from original by Lemoine and Kapnick.

We calculate how much traders value the increase in skill from the May to June Outlooks. We find that the more skillful June outlook carries an option market premium that is $9.4 million [95% confidence interval: -$1.6–$20.5 million] larger than the May outlook. Combining this additional premium with the difference in skill from this paper, we infer that a 1% improvement in ENSO prediction skill induces traders to spend an additional $1.8 million [95% confidence interval: -$0.31–$3.9 million] annually hedging news about seasonal climate.

Adaptation must not be a silver bullet

In practice, seasonal outlooks are even more valuable than what we estimate here. Traders have access to earlier forecasts of seasonal climate from forecasters besides NOAA and also from prior ENSO outlooks. This pre-existing information waters down the value of any specific month. Moreover, any value we do estimate remains only that from the financial sector (footnote #3 again).

It is important to understand what our estimates mean. We do not measure the impact of exposure to seasonal climate. We instead capture exposure to the forecasted portion of seasonal climate. If firms could costlessly and perfectly adjust to seasonal outlooks, then their stock and option prices would not be affected by the outlook’s contents. But this is not what we see. Therefore, adaptation based on these outlooks must be incomplete and/or costly: firms are exposed to the seasonal climate despite the early warning (perhaps because the information in the outlook is not actionable), and/or firms do adjust their exposure but only at some nontrivial cost that affects their value on the stock market. Seasonal outlooks are valuable, but they transform risk rather than eliminate it.

Lead Editor: Michelle L’Heureux (NOAA CPC)

Footnotes:

  1. To test whether the outlooks influence the market, you might think about looking at stock prices and seeing whether they move when a seasonal outlook is released. However, if you look at only one year’s outlooks this way, then you couldn’t be sure that stock prices did or didn’t move due to some other news released that day. If you instead look at the average movement over many years’ releases, then (in theory) you should not find any average change in stock prices, even if the market did respond to the outlooks. Sometimes an outlook’s news goes in one direction, and sometimes it goes in the opposite direction. If investors form proper expectations of what the outlook will say, then these two types of news should cancel each other over time, leaving no net effect on average.
  2. Technical point: Options’ prices and their implied volatilities are closely linked, but there is a subtle difference when talking about average changes in prices or implied volatilities. Ignoring one wrinkle that reflects aversion to risk, investors should never expect the price of an asset to move on average. Otherwise, they could make money on average by buying or selling it just before that movement, and such free opportunities to make money should not persist in a liquid market. It is possible for an option’s implied volatility to decline on average without its price changing on average because the level of the price reflects other factors that change over time, such as the price of the underlying stock and the time to expiration. This logic is why we test for changes in implied volatility, not in raw option prices.
  3. This is not to say that these other outlooks do not matter or are worthless. We estimate only the value broadly reflected in financial markets. These outlooks may matter to smaller sets of firms, may matter to firms not traded in financial markets, and may matter for people in all sorts of ways that do not show up in stock prices.
  4. Interestingly, the only sector for which we find no effect is agriculture, which is the sector one might have expected to be most exposed to weather. This exception may reflect ENSO being primarily linked to winter weather in the Northern Hemisphere and thus maybe not strongly linked to growing season weather (but see this post for a finer discussion) for the firms we study, which are listed in U.S. markets.

#Drought news July 25, 2024: The heaviest rainfall amounts fell across much of E. #Colorado, reporting rainfall totals up to 400% of normal

Click on a thumbnail graphic to view a gallery of drought data from the US Drought Monitor website.

Click the link to go to the US Drought Monitor website. Here’s an excerpt:

This Week’s Drought Summary

Over the past week, a major heatwave brought warmer-than-normal temperatures to much of the West, with departures ranging between 3 to 12 degrees F above normal across much of the region. Near-normal to cooler-than-normal temperatures were observed from the central Rockies to the Great Lakes, with departures ranging between 3 to 9 degrees F below normal. Precipitation varied across the contiguous U.S. this week. Monsoonal moisture brought heavy precipitation and flash flooding to parts of the Southwest, while a lingering frontal boundary brought daily thunderstorms, heavy rainfall and flash flooding across much of the Southeast and Mid-Atlantic. The most widespread improvements were made in the Southeast, as well as eastern portions of the Southwest and across much of western Texas, where above-normal precipitation amounts were observed this past week. Conversely, dry conditions resulted in degradations across much of Hawaii and the Pacific Northwest, as well as southern portions of the Northeast and in parts of the central Plains, and other parts of the West. Drought and abnormal dryness also expanded or intensified in the Ohio Valley, western High Plains, and in New England. In Hawaii, dry conditions coupled with warmer temperatures resulted in the expansion and intensification of drought across the state this week…

High Plains

Precipitation fell across much of the region this week, which was enough to prevent large areas of degradation but not enough to warrant large improvements. The heaviest rainfall amounts fell across much of eastern Colorado, reporting rainfall totals up to 400% of normal, resulting in the improvements of abnormal dryness and the removal of moderate drought from the region. Heavy precipitation amounts were also reported in central Nebraska and central South Dakota but were already free of drought and abnormal dryness this week. Precipitation was below-normal across the western portions of the region, resulting in the expansion and intensification of drought. Severe drought was added western South Dakota and Nebraska, and expanded in eastern Wyoming. Moderate drought also introduced in southwest Nebraska this week, while abnormal dryness was expanded in the area. Much of the region remains free of drought and abnormal dryness this week…

Colorado Drought Monitor one week change map ending July 23, 2024.

West

Average temperatures were well above normal across much of the West this week. Temperatures ranged between 3 to 9 degrees F above normal across much of the region, while northern portions of the region observed temperatures up to 12 degrees F above normal this week. Precipitation fell across much of the region but amounts were mostly below-normal for the region. The heaviest precipitation amounts were measured over parts of New Mexico. Above-normal precipitation (up to 6 inches), along with cooler temperatures, resulted in the removal of exceptional drought from southeast New Mexico and improvements to extreme drought, severe drought, moderate drought and abnormal dryness across eastern and southern portions of the state. Conversely, warmer-temperatures and below-normal precipitation resulted in the introduction of exceptional drought in western Montana, as well as the expansion of drought in other parts of Montana, across much of Oregon into northern California, while moderate drought was introduced in northwest Utah. The expansion of abnormal dryness occurred in parts of Nevada, which missed out on some of the beneficial rains resulting in the expansion of moderate drought in the area. Conditions remained dry in the interior parts of Washington, resulting in expansion of moderate drought and abnormal dryness based on short-term SPI/SPEI data, as well as low soil moisture and streamflow…

South

Dry conditions continued across much of the northern portions of the South this week, while heavy precipitation fell across much of central Texas and in parts of northern Arkansas, with areas reporting rainfall totals greater than 600% of normal. Abnormal dryness was removed from northern Arkansas, while moderate to extreme drought were improved across much of central Texas. Improvements were also made to parts of northern and eastern Tennessee where spotty showers brought much needed relief, returning areas back to their 30-day precipitation normals. Conversely, conditions continued to deteriorate in parts of northern Kansas and parts of western Texas, where precipitation totals were 5% to 25% of normal for the past month. Moderate to severe drought were expanded into central Kansas, while extreme drought was expanded and exceptional drought was introduced into the Trans-Pecos region of Texas this week. Temperatures were below-normal across much of the South, while departures of 1 to 6 degrees F above normal were observed across parts of western Texas. The expansion and intensification of drought categories were based on short-term SPI/SPEI, reservoir levels, streamflow and soil moisture data…

Looking Ahead

During the next five days (July 23–27, 2024), dangerous heat is expected to continue through the midweek across much of the West, with high temperatures reaching the 90s and 100s and ranging between 5-15 degrees above normal. The strong ridge, extending from the Southwest U.S. into west-central Canada, which produced hazardous heat from the West into the northern High Plains, should begin to weaken and begin to push eastward ahead of a Pacific upper low tracking into western Canada and trailing trough that will settle near the West Coast. Monsoonal conditions will promote daily episodes of showers and storms over the Four Corners states and into the Great Basin under and near upper ridging over that part of the country. Meanwhile, one or more wavy fronts will be on the leading side of Great Lakes into southern Plains mean troughing aloft, leading to multiple days of rain and thunderstorms with areas of heavy rainfall from the southern Plains into the Mid-Atlantic and parts of New England. The Great Lakes and Northeast should eventually trend drier late week as the northern part of the trough moves eastward. Consensus still shows the Atlantic upper ridge building into the Southeast for a time, peaking in strength around Wednesday-Thursday.

The Climate Prediction Center’s 6-10 day outlook (valid July 28–August 1, 2024) favors above-normal precipitation along much of the eastern contiguous U.S. and Alaska, as well as parts of Northwest, with below-normal precipitation across most of the interior West and in parts of New England. Increased probabilities for above-normal temperatures are forecast for much of the contiguous U.S., while below-normal temperatures are likely across the state of Alaska and in southern parts of California and Texas.

US Drought Monitor one week change map ending July 23, 2024.

Bureau of Reclamation to host Ruedi Reservoir water operations public meeting #FryingPanRiver

Sunrise at Ruedi Reservoir October 20, 2015. Photo via USBR.

From email from Reclamation (Anna Perea):

July 24, 2024

The Bureau of Reclamation has scheduled the annual public meeting to discuss the Ruedi Reservoir Water Operations for the 2024 water year. The meeting will be held on Wednesday August 7, 2024, from 6:00 p.m. – 8:00 p.m. at the following location:

Roaring Fork Conservancy River Center
22800 Two Rivers Road
Basalt, CO 81621

Topics will include: 

  • Reservoir operations update (Reclamation)
  • Colorado River 15-Mile Reach endangered fish update (U.S. Fish and Wildlife)
  • Fryingpan River projects (Roaring Fork Conservancy)
  • Updates on Ruedi water leases (Colorado Water Conservation Board) 
  • Overview of East Slope Fryingpan-Arkansas Project (Reclamation)  
  • Public question and answer session 

For more information, please contact Tim Miller, Hydrologist, Eastern Colorado Area Office, by phone or e-mail: (970) 461-5494, or tmiller@usbr.gov.

Media inquiries or general questions about Reclamation should be directed to Anna Perea, Public Affairs Specialist, at 970-290-1185 or aperea@usbr.gov. If you are deaf, hard of hearing or have a speech disability, please dial 7-1-1 to access telecommunications relay services.

Biden-Harris Administration Announces Nearly $66M for #Conservation Work with States, Tribes, Private Landowners as Part of Investing in America Agenda — NRCS

Photo credit: NRCS

Click the link to read the release on the NRCS website:

June 11, 2024

USDA also signs agreement with Western Governors to strengthen shared efforts to protect communities and resources

During a meeting of the Western Governors Association today, Deputy Secretary of Agriculture Xochitl Torres Small announced that USDA is investing nearly $66 million for projects to reduce wildfire risk, protect water quality and improve forest health across the nation as part of President Biden’s Investing in America agenda.

Deputy Secretary Torres Small also signed a Memorandum of Understanding (MOU) with the Western Governors’ Association, reestablishing the framework for cooperatively responding to the many challenges faced across western landscapes. The MOU, signed on behalf of the USDA alongside Governors Brad Little of Idaho, Joe Lombardo of Nevada, Michelle Lujan Grisham of New Mexico, Doug Burgum of North Dakota, and Mark Gordon of Wyoming, amplifies the scale of shared stewardship work between participating states and the USDA. It also fosters better integration of forest and rangeland health and wildfire risk reduction projects across different land ownerships.

“People across rural America face growing wildfire threats to their homes, business, infrastructure, and resources,” said Deputy Secretary Torres Small. “Through the investments announced today, President Biden is investing in state and local governments, Tribal partners, and private landowners to ensure our landscapes are healthy, our infrastructure is strong, and our communities stay safe.”

Of the total investment announced, $12 million is being provided through the USDA Forest Service’s Good Neighbor Authority,  allowing the agency to collaborate with state forestry agencies, Tribes and counties to mitigate wildfire risk and enhance forest, rangeland and watershed health. This funding will support 22 projects across 13 states, thanks to funding from President Biden’s Bipartisan Infrastructure Law. Nearly $9 million of the total funding will be allocated to support projects in several states that are part of the Western Governors Association member states, including Arizona, California, Idaho, Montana, Oregon, Utah, Washington and Wyoming.

The Department is also investing nearly $55 million of the total funding to reduce wildfire risk, and improve water quality and forest health through the Joint Chiefs’ Landscape Restoration Partnership. This collaborative effort between USDA’s Natural Resources Conservation Service (NRCS) and Forest Service aims to work with private, state, and Tribal landowners to conserve forests and agricultural lands alongside federally managed lands while safeguarding communities. The $55 million investment will support 41 projects — including 10 new projects — across 11 states. 

This program advances President Biden’s Justice40 Initiative, which sets a goal that 40% of the overall benefits of certain federal climate, clean energy, and other investments flow to disadvantaged communities that are marginalized by underinvestment and overburdened by pollution.

The NRCS and Forest Service are also now accepting proposals for Joint Chiefs’ Landscape Restoration Partnership projects for fiscal year 2025 projects. Applications are due on September 13, 2024.  

“These projects are indicative of a growing movement of cooperation around natural resource issues for the betterment of us all,” said Forest Service Chief Randy Moore. “A keystone of the Joint Chiefs’ projects is the people and the understanding that the healthier our forests, the healthier our nation.” 

“The Joint Chiefs’ Landscape Restoration Partnership enables NRCS and the Forest Service to collaborate with agricultural producers and forest landowners to invest in conservation and restoration at a big enough scale to make a difference in their communities,” said NRCS Chief Terry Cosby. “Working with federal, state and local agencies at this scale, helps reduce wildfire threats, protect water quality and supply, improve wildlife habitat for at-risk species, and ultimately combat climate change.” 

Today’s announcements also build on Agriculture Secretary Tom Vilsack’s announcement last week of $18 million for 23 new Tribal Forest Protection Act projects.

Background

Joint Chiefs’ Restoration Partnership

Since 2014, USDA has invested more than $423 million in 134 projects in 42 states as well as Guam and Puerto Rico through the Joint Chiefs’ Landscape Restoration Partnership. This program focuses on areas where national forests and grasslands intersect with privately-owned lands.

Good Neighbor Authority

Established by Congress in 2014, Good Neighbor Authority provides the Forest Service a straightforward way to enter into management agreements with states, Tribes and counties. The Good Neighbor Authority pools federal, state, Tribal, and county resources to complete more forest, rangeland, and watershed restoration work on national forests and grasslands. President Biden’s Bipartisan Infrastructure Law authorizes $160 million over five years for states and Tribes to implement restoration projects on federally managed lands through the Good Neighbor Authority and the Tribal Forest Protection Act
 

USDA touches the lives of all Americans each day in so many positive ways. In the Biden-Harris administration, USDA is transforming America’s food system with a greater focus on more resilient local and regional food production, fairer markets for all producers, ensuring access to safe, healthy and nutritious food in all communities, building new markets and streams of income for farmers and producers using climate smart food and forestry practices, making historic investments in infrastructure and clean energy capabilities in rural America and committing to equity across the department by removing systemic barriers and building a workforce more representative of America. To learn more, visit usda.gov

The timing of rainfall could help predict floods: New CIRES-led study measures the time between storms to better understand soil moisture — Western Water Assessment

Photo credit: CIRES

Click the link to read the release on the CIRES website (Ben Livneh, Nels Bjarke, Parthakumar A. Modi, Alex Furman, Darren Ficklin, Justin M Pflug, and Kris Karnauskas):

June 25, 2024

With record rainfall projected to continue into the future, many worry extreme flooding will follow suit. But a new CIRES-led study published today in Science of the Total Environment found an increase in precipitation alone won’t necessarily increase disastrous flooding — instead, flood risk depends on how many days have passed between storms.

Credit: CIRES

In the study, CIRES Fellow and Western Water Assessment director Ben Livneh and his colleagues, including CIRES Fellow Kris Karnauskas, looked for a new way to understand soil moisture and how it impacts flooding. The research team knew soil moisture is important when understanding floods, but measuring soils effectively is challenging. 

So they found a proxy for soil moisture: precipitation intermittency, the length of a dry spell between precipitation events. Simply put: after a prolonged time since the last rain, it takes a larger storm to generate flooding; with fewer days between storms, a wider range of conditions can lead to flooding.

“We can actually understand changes in flood risk based on the number of days since the last rain event,” Livneh said. “We wanted to make it straightforward because soil water is hard to predict.”

The research focused on semi-arid and arid regions and looked at rain as a form of precipitation rather than snow. To create a value for precipitation intermittency, researchers looked at historical observations of 108 watersheds around the U.S. from 1950-2022. Through analysis of these observations, the goal was to understand whether wet or dry soils preceded heavy rain events — and how that influenced floods.

Soil moisture is notoriously difficult to estimate or simulate, results can vary from one person’s backyard to their front yard, and understanding how soil moisture influences flood events is even harder. Nels Bjarke, a Western Water Assessment postdoctoral researcher, ran the analysis for the study. 

“We don’t have comprehensive observations of soil moisture that are continuous over space or continuous through time,” said Bjarke. “Therefore, it can be difficult to apply some sort of predictive framework for flooding using just soil moisture because the data are sparse.” 

Yet, precipitation is widely measured, so the team tested precipitation as a proxy for soil moisture by looking at the timing of rain, rather than the amount. 

Through analysis, the team created a timescale as a meaningful value for precipitation intermittency. They categorized intermittency into segments of five days. Ten days or less indicated low intermittency, when a high range of storms could produce floods. Drier periods with 20 days or more between storms defined high intermittency, and only serious storms could produce floods. Overall, flood probabilities are 30 percent lower following long periods of dry spells. 

Planet Bluegrass during the September 2013 flood. The Wildflower Pavilion is the building at center. (Courtesy of town of Lyons)

The 2013 floods in Boulder are a real-life example of how precipitation intermittency is applied to flood projections. Seven days of heavy rain nearly doubled the previous record for rainfall. The event displaced hundreds and caused $2 billion in property damage, according to NOAA.

Forecasters and emergency managers could use the paper’s findings to anticipate very real flooding risks. Since wide-ranging observations of precipitation exist, forecasters can take the findings of this paper and use intermittency to help predict the likelihood of a flood.

“As we enter the era of big data, we can benefit from simple proxies like the dry-spell length as a way to more intuitively understand extreme events,” said Livneh.

Authors of the paper “Can precipitation intermittency predict flooding” in Science of the Total Environment are: Ben Livneh, Nels Bjarke, Parthakumar A. Modi, Alex Furman, Darren Ficklin, Justin M Pflug, and Kris Karnauskas (CIRES Fellow). 

Extreme heat is breaking global records: Why this isn’t ‘just summer,’ and what #ClimateChange has to do with it — The Conservation #ActOnClimate

Visitors walk past a sign reading ‘Stop: Extreme Heat Danger’ in Death Valley National Park during a heat wave on July 7, 2024. Etienne Laurent/AFP via Getty Images

Mathew Barlow, UMass Lowell and Jeffrey Basara, UMass Lowell

A month into summer 2024, the vast majority of the U.S. population had already experienced at least one extreme heat wave, and millions of people were under heat alerts, with forecasts warning of more ahead.

Death Valley hit 125 degrees Fahrenheit (51.7 Celsius) or higher for nine consecutive days in early July. Las Vegas broke its all-time heat record at 120 F (48.9 C). Days of 100-degree heat dried out the California landscapes, fueling wildfires there and in the Northwest. Oregon reported several suspected heat deaths.

Globally, the planet had its hottest day in at least eight decades of recordkeeping on July 21 – and then broke the record again on July 22, according to the European Union’s Copernicus Climate Change Service.

The extreme heat is part of a longer trend: Each of the past 13 months has been the hottest on record for that month globally, including the hottest June, the EU service reported in early July. It also found that the average temperature for the previous 12 months had been at least 1.5 C (2.7 F) warmer than the 1850-1900 pre-industrial average.

A chart shows yearly averages and the trend line going out 10 more years before it crosses 1.5 C for the 30-year average.
Global temperatures showing the trend line averaged over 30 years. Copernicus Climate Change and Atmosphere Monitoring Services

The 1.5 C warming threshold can be confusing, so let’s take a closer look at what that means. In the Paris climate agreement, countries worldwide agreed to work to keep global warming under 1.5 C, however that refers to the temperature change averaged over a 30-year period. A 30-year average is used to limit the influence of natural year-to-year fluctuations.

So far, the Earth has only crossed that threshold for a single year. However, it is still extremely concerning. We study weather patterns involving heat. The world appears to be on track to cross the 30-year average threshold of 1.5 C within 10 years.

Heat is becoming a global problem

Several countries have experienced record heat across the Americas, Africa, Europe and Asia in 2024. In Mexico and Central America, weeks of persistent heat starting in spring 2024 combined with prolonged drought led to severe water shortages and dozens of deaths.

Extreme heat turned into tragedy in Saudi Arabia, as over 1,000 people on the Hajj, a Muslim pilgrimage to Mecca, collapsed and died. Temperatures reached 125 F (51.8 C) at the Grand Mosque in Mecca on June 17.

A large number of people in traditional clothing covering them from their necks to their wrists and ankles walk on wide pathway, some carrying umbrellas for shade.
Muslim pilgrims spent hours in extreme temperatures and humidity during the Hajj in June 2024 in Saudi Arabia. Over 1,000 people died in the heat. AP Photo/Rafiq Maqbool

Hospitals in Karachi, Pakistan, were overwhelmed amid weeks of high heat, frequent power outages, and water shortages in some areas. Neighboring India faced temperatures around 120 F (48.9 C) for several days in April and May that affected millions of people, many of them without air conditioning.

Japan issued heatstroke alerts in Tokyo and more than half of its prefectures as temperatures rose to record highs in early July.

Large parts of Europe were suffering through a long-running heat wave as the 2024 Summer Olympics prepared to open in Paris in late July.

The climate connection: This isn’t ‘just summer’

Although heat waves are a natural part of the climate, the severity and extent of the heat waves so far in 2024 are not “just summer.”

A scientific assessment of the fierce heat wave in the eastern U.S. in June 2024 estimates that heat so severe and long-lasting was two to four times more likely to occur today because of human-caused climate change than it would have been without it. This conclusion is consistent with the rapid increase over the past several decades in the number of U.S. heat waves and their occurrence outside the peak of summer.

These record heat waves are happening in a climate that’s globally more than 2.2 F (1.2 C) warmer – when looking at the 30-year average – than it was before the industrial revolution, when humans began releasing large amounts of greenhouse gas emissions that warm the climate.

Two global maps show much faster warming per decade over the past 30 years than in the past 120 years.
Global surface temperatures have risen faster per decade in the past 30 years than over the past 120. NOAA NCEI

While a temperature difference of a degree or two when you walk into a different room might not even be noticeable, even fractions of a degree make a large difference in the global climate.

At the peak of the last ice age, some 20,000 years ago, when the Northeast U.S. was under thousands of feet of ice, the globally averaged temperature was only about 11 F (6 C) cooler than now. So, it is not surprising that 2.2 F (1.2 C) of warming so far is already rapidly changing the climate.

If you thought this was hot

While this summer is likely be one of the hottest on record, it is important to realize that it may also be one of the coldest summers of the future.

For populations that are especially vulnerable to heat, including young children, older adults and outdoor workers, the risks are even higher. People in lower-income neighborhoods where air conditioning may be unaffordable and renters who often don’t have the same protections for cooling as heating will face increasingly dangerous conditions.

Extreme heat can also affect economies. It can buckle railroad tracks and cause wires to sag, leading to transit delays and disruptions. It can also overload electric systems with high demand and lead to blackouts just when people have the greatest need for cooling.

The good news: There are solutions

Yes, the future in a warming world is daunting. However, while countries aren’t on pace to meet their Paris Agreement goals, they have made progress.

In the U.S., the 2022 Inflation Reduction Act has the potential to reduce U.S. greenhouse gas emissions by nearly half by 2035.

Switching from air conditioners to heat pumps and network geothermal systems can not only reduce fossil fuel emissions but also provide cooling at a lower cost. The cost of renewable energy continues to plummet, and many countries are increasing policy support and incentives.

A chart shows the number of heat waves is likely to be four times higher in a world 2.7 F (1.5 C) warmer and nearly five times higher in a world 6.3 F (3.5 C) warmer. Both scenarios are possible as global emissions rise.
Actions to reduce warming can limit a wide range of hazards and create numerous near-term benefits and opportunities. National Climate Assessment 2023

There is much that humanity can do to limit future warming if countries, companies and people everywhere act with urgency. Rapidly reducing fossil fuel emissions can help avoid a warmer future with even worse heat waves and droughts, while also providing other benefits, including improving public health, creating jobs and reducing risks to ecosystems.

This is an update to an article originally published on June 26, 2024.

Mathew Barlow, Professor of Climate Science, UMass Lowell and Jeffrey Basara, Professor of Meteorology, UMass Lowell

This article is republished from The Conversation under a Creative Commons license. Read the original article.

July 21st (Sunday) was the hottest day ever on record on planet Earth — Jeff Berardelli (@WeatherProf) #ActOnClimate

The most anomalously warm places were Antarctica and Western Canada where several hundred wildfires blaze, many out of control. July 20th pictured on the map (21st not available yet via Copernicus)

Click the link to read “Sunday was the hottest day ever recorded on Earth, scientists say” on The Washington Post website (Sarah Kaplan). Here’s an excerpt:

July 23, 2024

The historic day comes on the heels of 13 straight months of unprecedented temperatures and the hottest year scientists have ever seen.

Global temperatures hit the highest levels in recorded history on Sunday, according to preliminary data from Europe’s top climate monitor — another worrying sign of how human-caused climate change is pushing the planet into dangerous new territory. The results from the Copernicus Climate Change Service show the planet’s average temperature on July 21 was 17.09 degrees Celsius (62.76 degrees Fahrenheit) — breaking a record set only last year. The historic day comes on the heels of 13 straight months of unprecedented temperatures and the hottest year scientists have ever seen.

“We are in truly uncharted territory,” Copernicus director Carlo Buontempo said in a statement. “And as the climate keeps warming, we are bound to see records being broken in future months and years.”

[…]

Though Sunday was only slightly warmer than the world’s previous hottest day, Copernicus researchers noted, it was extraordinarily hotter than anything that came before. Before July 2023, Earth’s daily average temperature record  set in August 2016 — was 16.8 degrees Celsius (62.24 degrees Fahrenheit). But in the past year, the global has exceeded that old record on 57 days.

“What is truly staggering is how large the difference is between the temperature of the last 13 months and the previous temperature records,” Buontempo said.

Getches-Wilkinson Center (@CUBoulderGWC) is thrilled to host Bob Anderson, Solicitor of the Department of the Interior, for the 2024 Ruth Wright Distinguished Lecture.

Thurs, Sept 26th 6:00-7:30pm

@ColoLaw FREE and open to the public, registration is required. Registration: https://colorado.edu/center/gwc/2024/07/17/2024-ruth-wright-distinguished-lecture-natural-resources

R.I.P. Dr. Wallace J. Nichols: “I wish you water”

Click the link to read the blog post on the Wallace J. Nichols website (Dana Nichols):

July 2024

Dr. Wallace J. Nichols Memorial Foundation Update

Hello everyone,

By now, you’ve likely heard the news of J’s passing. We want to thank you for your outpouring of love and support over the past few weeks.

I also want to thank Outside Magazine for its tribute to my husband, which was published earlier this month. And Plastic Pollution Coalition, who published this blog to honor him and his work.

J dedicated his life to understanding how our connection to water and wildlife has the power to change our health and well-being. He worked tirelessly to share his findings with the world – from his best-selling book Blue Mind, to countless environmental organizations and movements that he founded and supported.

We are currently in the process of turning the Dr. Wallace J. Nichols Memorial Fund into a foundation. Our goal is to continue J’s important work, complete unfinished projects, and support causes he was passionate about, including:

  • The Blue Mind Movement reconnects people to water by linking ocean and waterway exploration, restoration, and conservation with neuroscience, psychology, public health, and well-being. This involves an annual summit, workshops, research collaborations and a small grants program through The Ocean Foundation.
  • Billion Baby Turtles Project was founded by J and Brad Nahill to increase the number of baby sea turtles in oceans around the world. To date, we have saved nearly 1 million hatchlings at nesting beaches in El Salvador, Mexico, Nicaragua, Costa Rica, and elsewhere.
  • Blue Marbles Project has a goal of passing a marble through every person’s hand on earth, with a simple message of gratitude. Since our launch in 2009, millions around the world have joined hands to create a blue global community.
  • Force Blue unites the community of Special Operations veterans with the world of marine conservation, for the betterment of both. J was deeply passionate about Force Blue’s mission and loved supporting the project with his time and energy.
  • Plastic Pollution Coalition is a non-profit communications and advocacy organization that collaborates with an expansive global alliance of organizations, businesses, and individuals to create a more just, equitable, regenerative world free of plastic pollution and its toxic impacts. J was a longtime friend and founding advisor to the Plastic Pollution Coalition.

Thank you to everyone who has contributed to the fund thus far. We are grateful for your generosity and deeply moved by your stories of J’s impact on all our lives.

If you’re interested in helping with the foundation and preserving J’s legacy, please contact me directly at legacy@wallacejnichols.org.

We wish you water,

Dana Nichols

Blue Mind can be a life-changing read, wholeheartedly recommended by Coyote Gulch.

Report: Sacket v. EPA The State of Our Waters One Year Later — ProtectCleanWater.org

Click the link to access the report on the ProtectCleanWater.org website. Here’s an excerpt:

July 2024

Introduction

One year ago, the Supreme Court issued its sweeping decision in the case Sackett v. EPA, which invalidated federal Clean Water Act protections for most streams and wetlands in the United States. Since then, the fight for clean water protections has been at the state level. This report outlines the state of clean water protections one year out from the Sackett decision and why federal protections for our critical waters is vital in the face of worsening climate change and other threats.

In the year since the Supreme Court ruling, two states passed or introduced legislation to create new permitting programs to fill the gap in federal protections and eight states passed or introduced stronger laws and policies to strengthen state protections. Two states passed legislation weakening state-level protections, while efforts to weaken state protections failed in four other states.

The Importance of Wetlands and Streams

Wetlands and streams are the livers and heart of our ecosystems. These critical waters prevent flooding, filter pollution, store carbon, and provide critical habitat for wildlife. According to the Environmental Protection Agency (EPA), ”Wetlands are among the most productive ecosystems in the world, comparable to rain forests and coral reefs.”

Similarly, streams that flow only part of the year play a critical role in maintaining the quality and supply of our drinking water and aid water conservation.

Our lakes and rivers depend on these critical waters, which in turn depend on the Clean Water Act (CWA or the Act) for protections to keep them healthy for fishing and swimming, agriculture and other business uses, and as a source for drinking water. In many cultures, particularly Indigenous cultures, water has a deep religious and spiritual element, and water is seen as life — waters are considered sacred places to cherish and protect. To limit their protection under the CWA could degrade the quality of water in waterways that people and wildlife depend on.

Healthy mountain meadows and wetlands are characteristic of healthy headwater systems and provide a variety of ecosystem services, or benefits that humans, wildlife, rivers and surrounding ecosystems rely on. The complex of wetlands and connected floodplains found in intact headwater systems can slow runoff and attenuate flood flows, creating better downstream conditions, trapping sediment to improve downstream water quality, and allowing groundwater recharge. These systems can also serve as a fire break and refuge during wildfire, can sequester carbon in the floodplain, and provide essential habitat for wildlife. Graphic by Restoration Design Group, courtesy of American Rivers

A look at the total Tornado Warnings issued by NWS office so far this year across the United States! #Tornado — @mark_tarello

$48.4M for Collaborative Efforts to Conserve America’s Most Imperiled Species: Funding will support projects under the Endangered Species Act and leverage an additional $27.75 million in partner funds — U.S. Fish and Wildlife Service #ActOnClimate

Oregon silverspot butterfly (Argynnis zerene hippolyta). Photo credit: Oregon Department of Fish & Wildlife

Click the link to read the release on the USFWS website (Marylin Kitchell):

The U.S. Fish and Wildlife Service today announced $48.4 million in grants to 19 states and Guam to support land acquisition and conservation planning projects on over 23,000 acres of habitat for 80 listed and at-risk species through the Cooperative Endangered Species Conservation Fund (CESCF). The grants will be matched by more than $27.75 million in partner funds.

“Thanks to the Endangered Species Act, this critical funding will help in conserving our nation’s most imperiled wildlife and vital habitat while fostering partnerships between federal, state and local governments, private landowners and communities,” said Service Director Martha Williams. “These grants support the Biden-Harris administration’s America the Beautiful initiative goal to conserve, connect and restore 30 percent of the Nation’s lands and waters by protecting biodiversity, slowing extinction rates and facilitating collaborative restoration efforts.”

Authorized by Section 6 of the Endangered Species Act and partly funded through the Land and Water Conservation Fund, CESCF grants contribute millions annually to support the implementation of state and territorial programs that conserve and recover federally listed and at-risk species on non-federal lands. This approach to conservation, done in cooperation with states, territories, willing landowners and local partners, furthers species conservation and facilitates compatible economic development.

CESCF land acquisition funding to states is awarded through two nationally competitive grant programs: the Recovery Land Acquisition Grant Program, which provides funds for the acquisition of habitat in support of Service-approved recovery plans, and the Habitat Conservation Plan Land Acquisition Grant Program, which provides funds to acquire habitat for listed and at-risk species to complement conservation strategies of approved HCPs. This year’s awards, totaling more than $41.4 million, will fund the acquisition and permanent protection for 21 projects over 23,000 acres of habitat across 16 states for the benefit of 40 listed and at-risk species, including the Indiana bat, wood stork, gopher tortoise, Oregon silverspot butterfly and speckled pocketbook mussel.

The Service also approved more than $6.9 million in grant awards to five states and Guam under the Conservation Planning Assistance Grant Program. Funding awarded through this program may be used to support the development, renewal or amendment of voluntary landowner agreements, i.e., HCPs and conservation benefit agreements. Eligible activities include document preparation, public outreach, baseline species surveys, habitat assessments, inventories and environmental compliance. This year’s awards will support nine conservation planning efforts covering 51 listed, candidate and at-risk species, such as the western snowy plover, Mariana fruit bat, San Joaquin kit fox and Everglade snail kite. 

For a full list of awards and to learn more about the CESCF grant programs, please visit the Service’s program page.

The ESA provides a critical safety net for North America’s native fish, wildlife and plants. The Service is working to actively engage conservation partners and the public in the search for improved and innovative ways to conserve and recover imperiled species. Learn more online about our endangered species efforts.

Snowy plover (Charadrius nivosus) at Bon Secour National Wildlife Refuge. By U.S. Fish and Wildlife Service Southeast Region – Snowy Plover (Charadrius nivosus)Uploaded by AlbertHerring, Public Domain, https://commons.wikimedia.org/w/index.php?curid=29813304

Technical Report: Regulatory and Environmental Considerations for Floating Photovoltaic Projects Located on Federally Controlled Reservoirs in the United States — NREL

FPV system sited on a non-powered reservoir Illustration by Besiki Kazaishvili, NREL

Click the link to access the report on the NREL website (Aaron Levine, Taylor L. Curtis, Ligia E.P. Smith, and Katie DeRose). Here’s the executive summary:

June 2024

Executive Summary

To meet the nation’s decarbonization goals, the U.S. Department of Energy’s Solar Futures study forecasts that installed solar photovoltaic (PV) capacity must increase nearly tenfold, from 80 gigawatts (GW) in 2020 to approximately 760 GW cumulative installed capacity by 2035 (DOE 2021). Ground-mounted PV is expected to dominate future solar deployment and will require more than 3.5 million acres of land to meet annual demand projections (of nearly 45 GW) by 2030 (DOE 2021). However, various competing demands for land (e.g., agricultural production, conservation) and high land acquisition costs in specific locations could be challenges to meeting future PV demand solely with ground-mounted PV deployment (Wood MacKenzie 2023; DOE 2021; Oliveira-Pinto and Stokkermans 2020). Floating photovoltaics (FPV) may be an alternative in locations where ground-mounted PV is not feasible and aid in reaching the nation’s PV deployment and decarbonization goals (DOE 2021; Oliveira-Pinto and Stokkermans 2020; Hooper, Armstrong, and Vlaswinkel 2020; Gallucci 2019).

FPV is a newer siting approach in which a PV array is affixed to a floating apparatus and sited on a water body like a reservoir behind a dam. FPV systems may be stand-alone or co-located a new or existing hydroelectric facilities or pumped storage hydropower (PSH) facility reservoirs. Co-located FPV systems may or may not be operationally paired and work in tandem with the hydroelectric or PSH facility (Gadzanku and Lee 2022; Gadzanku et al. 2021a, 2021b; Lee et al. 2020; Oliveira-Pinto and Stokkermans 2020; Spencer et al. 2018).

Although FPV deployment in the United States is nascent with less than 30 projects installed, significant potential has been identified at existing U.S. reservoirs (Chopra and Garasa Sagardoy 2022). A 2018 National Renewable Energy Laboratory (NREL) study identified more than 24,000 manmade reservoirs (with a total surface area of more than 2 million hectares) in the United States with technical FPV potential; the largest opportunities were found at reservoirs owned by the U.S. Army Corps of Engineers (USACE) and the Bureau of Reclamation (Reclamation). The NREL study estimated that, if fully realized, FPV systems on U.S. water bodies could have produce almost 10% of the nation’s electricity generation in 2018 (approximately 786 terawatt-hours) (Spencer et al. 2018). A follow-on study completed by NREL in 2024 identified between 861 GW and 1,042 GW (corresponding to 1,221 terawatt- hours and 1,476 terawatt-hours) of technical resource potential across USACE, Reclamation, and Federal Energy Regulatory Commission (FERC)-licensed reservoirs.

Current U.S. domestic FPV development is mostly limited to small-scale projects of less than 1 megawatt (MW) sited on closed-loop water bodies such as wastewater treatment plants, drinking water ponds, and irrigation water storage ponds (Chopra and Garasa Sagardoy 2022). Nevertheless, the versatility, potential benefits, and resource potential of FPV have led to growing investment in recent years, which is expected to continue as PV developers look to alternatives like FPV to meet growing demand (Wood MacKenzie 2023; Chopra and Garasa Sagardoy 2022).

This report provides novel analysis to understand the opportunities and challenges associated with developing stand-alone and co-located FPV projects on Reclamation reservoirs, USACE reservoirs, and FERC-licensed reservoirs in the United States. Specifically, the report explores potential environmental and energy benefits and environmental impacts associated with the siting, construction, and operation of FPV projects. The report also identifies and analyzes U.S. federal- and state-issued permits and authorizations required by federal laws to understand the licensing pathways and regulatory requirements for FPV projects sited on FERC-licensed reservoirs, Reclamation-powered and non-powered reservoirs, and USACE powered and non- powered reservoirs.

Of note, this report only analyzes the addition of FPV to reservoirs and does not consider FPV development on or above canal systems.

In #NewMexico’s Middle #RioGrande, the wheels are coming off — John Fleck (InkStain.net)

Construction crews attempt to repair the El Vado dam along the Rio Grande in New Mexico. The federal government has been unable to find a way to stop seepage behind the steel faceplate dam. U.S. Bureau of Reclamation

Click the link to read the article on the InkStain website (John Fleck):

July 15, 2024

Talking to Jake Bittle for his Grist piece on the trials and tribulations of El Vado Dam, he asked me a question I loved: “What does this mean in the larger scheme of things?”

My answer:

We seem to be living through a grand convergence of aging water infrastructure failure on New Mexico’s Middle Rio Grande this year.

We’ve talked in this space before about El Vado – built in the 1930s, unusable today. But it is only one example among many right now. If we are frank in recognizing that the main Rio Grande channel is a human artifact, dug in its current place and form in the 1950s, the list right now is long. The Flood Control Acts of 1948 (Public Law 80-858) and 1950 (Public Law 81-516) established the Middle Rio Grande Project and assigned the Bureau of Reclamation the job of performing Rio Grande channel maintenance.

Side channels were excavated by the Bureau of Reclamation along the Rio Grande where it passes through the Rhodes’ property to provide habitat for the endangered silvery minnow. (Dustin Armstrong/U.S. Bureau Of Reclamation)

The channel is infrastructure.

And it’s not just human water use that has optimized around the infrastructure. I was very careful in my comment to Jake – “entire human and natural communities” have optimized around the temporal and spatial flow of a century of altered river systems. When we taught together in the UNM Water Resources Program, my friend and collaborator Benjamin Jones spent significant time on the concept of “coupled human and natural systems”. This is that.

Here’s my current list, feel free to add your favorites in the comments.

The Rio Chama viewed from US highway 84 between Abiquiú, New Mexico, and Abiquiu Dam. By Dicklyon – Own work, CC BY-SA 4.0, https://commons.wikimedia.org/w/index.php?curid=110189310

RIO CHAMA DOWNSTREAM FROM ABIQUIU

The Army Corps of Engineers has had to curtail releases out of Abiquiu Dam on the Rio Chama because sediment has plugged the river. That means decreased flows downstream. They’re working like crazy to dig a pilot channel. It is not yet working.

CORRALES SIPHON

The Corrales Siphon, built (like El Vado) in the 1930s as part of the early Middle Rio Grande Conservancy District works is (like El Vado) broken. The district has installed temporary pumps, but with the reduced flows out of the Chama, there’s not enough water in the Rio Grande to feed the pumps, which means irrigators in Corrales have no water.

LOWER SAN ACACIA REACH

The Rio Grande’s Lower San Acacia reach, heavily altered by channel reconstruction and management from the 1950s onward, is – I believe the technical term is “a fucking mess”. It’s increasingly difficult to get water through this reach to users downstream who depend on it. Lots more on this situation here.

LOW FLOW LEAK

The Low Flow Conveyance Channel (Yay 1950s engineering!) sprang a kinda big leak the early 1990s. It’s still leaking, much to the delight of endangered willow flycatchers – to the human water users not so much.

Southwestern Willow flycatcher

What a Kamala Harris presidency could mean for the West: Harris has prioritized protecting public lands and pursued accountability for polluters, but her track record on tribal affairs is more complex — High Country News

Kamala Harris. By United States Senate – This file has been extracted from another file: Kamala Harris official photo.jpg, Public Domain, https://commons.wikimedia.org/w/index.php?curid=64332043

Click the link to read the article on the High Country News website (Anna V. Smith and Erin X. Wong):

July 22, 2024

On July 21, President Joe Biden withdrew from the 2024 presidential race and endorsed Vice President Kamala Harris to run in his place, launching her to the forefront of potential Democratic nominees. Harris’ term as VP hasn’t produced many significant policy outcomes of her own, but her experience as a California senator and attorney general, as well as her 2020 presidential campaign, point to a consistent record of pro-climate, pro-environmental policies and an evolved understanding of tribal land issues. Should she eventually assume the Oval Office, her career to date signals a likely continuation of the West’s Biden-era gains in the protection of public lands, water and wildlife as well as support for tribal sovereignty.  

“We couldn’t be more excited,” said Athan Manuel, director of the Sierra Club’s lands-protection program. Harris worked with the organization on bills to expand California’s public lands, increase access to nature and develop community incentives for wildfire prevention. “She understood the totality of these issues, and that gives us great confidence.”

Over the past four years, the Biden administration reinstated protections for Alaska’s Tongass National Forest and conserved more than 41 million acres of public land. It passed the climate-forward Inflation Reduction Act, which was hailed as a windfall for domestic clean energy jobs and a once-in-a-generation wealth transfer to historically marginalized communities. The record bears a striking resemblance to Harris’ own platform for president, which also pursued environmental justice and sought an end to fossil fuels on public lands.

“This was the most impactful one-term presidency on public lands, climate change and environmental justice,” Manuel said. Harris, who was born in Oakland and spent much of her career in California, was also able to provide the Biden administration with insight into regional issues. “A Westerner leading on all these issues is very significant.”  [ed. emphasis mine]

Prior to joining Biden’s ticket, Harris was best known as a Golden State prosecutor. As California’s attorney general, Harris won multiple settlements against corporate polluters, including a $44 million settlement from the owners of a container ship that spilled 53,000 gallons of oil into the San Francisco Bay. She secured multimillion-dollar deals with oil companies BP, ARCO and ConocoPhillips for negligent monitoring of hazardous materials in gas station storage tanks, and she was part of the team that held Volkswagen accountable for bypassing air pollution regulations, eventually earning more than $86 billion in penalties for the state. However, her claim that she pursued polluters while working in the San Francisco DA office has come under scrutiny.

A map shows the movements of 12 radio-collared lynx in and around Kanuti National Wildlife Refuge in Alaska in spring 2018. Some lynx traveled many hundreds of miles. Credit: USFWS

In the Senate, she co-sponsored bills to develop national wildlife corridorsdivert revenue from energy development to national parks and further climate equity by calculating policy impacts on frontline communities. She voted to protect the Antiquities Act and the Great American Outdoors Act, as well as to halt drilling in the Arctic and pass a public-lands package that conserved 2 million acres of land and water. Over the course of four years, she earned multiple perfect scores from the League of Conservation Voters.

Harris’ track record with Indigenous affairs over her decades working in politics is more varied. As state attorney general, she created the first Indian Child Welfare Act Compliance Task Force to protect Native children. But she also opposed multiple tribal applications to put land into “trust” and thereby grow a tribe’s land base. During her time as attorney general, Harris’ office also pursued a legal argument that could have had negative, precedent-setting impacts for tribes that have acquired land in trust. She argued that the Big Lagoon Rancheria, a tribe that was seeking to build a casino on 11 acres of trust land, improperly received that land from the federal government. The case had the potential to open past land-to-trust transfers across Indian Country to litigation, but the 9th Circuit Court of Appeals ultimately ruled against California.

Since then, Harris has distanced herself from that position. When then-Cheyenne River Sioux Tribal Chairman Harold Frazier asked her about this publicly in 2019, Harris said that as California’s attorney general it was her duty to represent the state’s interests, which did not necessarily reflect her own. “As California’s attorney general she was perceived as being more focused on states than tribes,” wrote Mark Trahant (Shoshone-Bannock) in an analysis for ICT. “But that has largely shifted.”

During her 2020 campaign for president, for example, Harris promised to assist tribes in restoring their lands and to make it easier for them to do so in the future. Her campaign also detailed specific policies and initiatives to advance Native voting rights, increase funding for the federal agencies serving tribal communities, and protect Native women and children, building on some of the legislation that she co-sponsored during her time in the Senate. Those bills largely focused on supporting Native health care and addressing the crisis of Missing and Murdered Indigenous Peoples, along with the Native Voting Rights Act of 2019 and other legislation concerning tribal wildlife corridors and food sovereignty. 

As vice president, she’s been a part of an administration that has made considerable strides in integrating Indigenous knowledge and tribal priorities into public-lands management, as well as in providing funding for Native-led climate resilience projects and appointing multiple Indigenous people to leadership positions. She was the first sitting vice president to visit the Gila Indian River Community and do an interview with the Native news organization ICTAsked by reporter Aliyah Chavez (Kewa Pueblo) about the administration’s goals and the decision to appoint Native leaders like Interior Secretary Deb Haaland (Laguna Pueblo), Harris said, “I do believe that we are setting a new model for what the interaction and what the partnership should be [with tribes], always grounded in full appreciation and respect for tribal sovereignty.” 

The Democratic Party has less than a month to introduce any alternative candidates before the Democratic National Convention on Aug. 19. Other potential frontrunners, including California Gov. Gavin Newsom, appear to be rallying behind Harris as the primary candidate who could win the race against former President Donald Trump. 

‘We have a state plan’: RGWCD works to limit any federal study of #RioGrande: #NewMexico congresswoman renewing push for legislation — @AlamosaCitizen

Rio Grande. Photo credit: Big River Collective

Click the link to read the article on the Alamosa Citizen website:

July 19, 2024

New Mexico Congresswoman Melanie Stansbury and the Rio Grande Water Conservation District are working together on federal legislation that would call for a limited study of the Rio Grande Basin.

The involvement of the Rio Grande Water Conservation District and its attorneys comes after Stansbury attempted a similar push in 2022 when she introduced the Rio Grande Water Security Act. That effort was ultimately doomed after pushback from Colorado and the Rio Grande Water Conservation District.

Now the Rio Grande Water Conservation District is trying to steer Stansbury to focus on New Mexico’s portion of the Rio Grande only and not draw in Colorado as part of any federal study.

“She is very determined to introduce federal legislation to call for a study of the Rio Grande. I understand that her real impetus is that she does not feel that enough is being done in New Mexico to aggressively and innovatively manage the water resources within New Mexico,” attorney David Robbins said in remarks this week to board members of Rio Grande Water Conservation District.

“On behalf of the district and the Valley and the state we have been pursuing an effort to convince the congresswoman and her staff that Colorado doesn’t need federal agencies studying its water resources,” Robbins said.

David Robbins and J.C. Ulrich (Greg Hobbs) at the 2013 Colorado Water Congress Annual Convention

“Colorado has already studied its water resources. We have a state water plan, we have all of the plans you could ever want in the form of subdistrict replacement plans, plans of water management in our Valley. We have water court processes and decrees that specifically designate what federal authority exists through the water court system and over water in the Valley, and we don’t intend to compromise one thing if it would have any impact on our obligations.”

Stansbury’s office has not responded to calls and emails seeking comment.

Colorado delivers water at the Lobatos Bridge in Conejos County to send downstream into New Mexico to comply with the Rio Grande Compact. New Mexico, in turn, is obligated to deliver water from the Rio Grande to the Texas state line at El Paso.

Stansbury has been successful in securing federal funding to support New Mexico’s efforts along the middle Rio Grande. She was elected to represent New Mexico’s 1st Congressional District through a special election in 2021 to replace Deb Haaland, who was confirmed as U.S. interior secretary under President Biden.

Haaland in May announced $60 million in funding for New Mexico and West Texas to address how climate change is affecting the middle Rio Grande. The money was the first disbursement from the Inflation Reduction Act for a basin other than the Colorado River Basin, a fact not lost on conservationists working on Upper Rio Grande Basin projects in Colorado.

The Theodore Roosevelt Conservation Partnership and Colorado Open Lands have identified $400 million in total funding needed to improve water resilience and security on the Upper Rio Grande. The organizations made a funding request of $50 million to the U.S. Bureau of Reclamation through the Inflation Reduction Act but were never given a response to their request.

Alex Funk, director of water resources with the Theodore Roosevelt Conservation Partnership, said the Rio Grande needs its own dedicated federal funding source so that it’s not pitted against the better-known Colorado River Basin to address drought and less water.

“The Rio Grande, like the Colorado River Basin, has been experiencing long-term drought conditions. It’s seen huge reduction in its water availability. Everything shows that those flows will continue to get lower and lower where we have several compounding water challenges,” said Funk.

Funk and Sally Weir were recent guests on The Valley Pod and discussed the funding needs for the Rio Grande and their pitch for money to the U.S. Bureau of Reclamation. The Bureau of Reclamation had earmarked $4 billion to address drought mitigation in the Colorado River Basin and other watersheds like the Rio Grande facing comparable levels of drought.

Here’s a link to the podcast.

Robbins, the attorney for the Rio Grande Water Conservation District, said it’s important that any federal legislation introduced by Stansbury steers clear of involving Colorado and its management of the Rio Grande.

“We don’t intend to compromise one thing if it would have any impact at all on our obligations at Lobatos. That is what we are going to work by. We’re not going to change the timing (of water delivery), we’re not going to change the quantity, we are simply going to say ‘You got what you got, so you don’t need to study it.’ 

“That’s very important to me that we take that position because one of the things that the states retained (under the Rio Grande Compact) was the right, which has been recognized for more than a century, to manage the water resources within their boundaries. So I think it is foolishness to get ourselves into a situation where federal agencies are meeting and studying and making recommendations about what is actually your collective responsibility and right to manage.

“If that’s what they want to do in New Mexico, fine. We’re going to work hard to try to be sure that Congress doesn’t provide authority to a separate or new federal agency or commission or committee or whatever it is to come into Colorado and make recommendations about what you have all sweated and argued and arm wrestled over for the past 100 years.”‘We have a state plan’: RGWCD works to limit any federal study of Rio Grande.

Rio Grande and Pecos River basins. Map credit: By Kmusser – Own work, Elevation data from SRTM, drainage basin from GTOPO [1], U.S. stream from the National Atlas [2], all other features from Vector Map., CC BY-SA 3.0, https://commons.wikimedia.org/w/index.php?curid=11218868

A reminder to be careful how you think about “wasted” water — John Fleck (InkStain.net)

Little Snake River agricultural lands along the Colorado-Wyoming border. (Angus M. Thuermer, Jr./WyoFile)

Click the link to read the article on the InkStain website (John Fleck):

July 15, 2024

A team out of Wyoming, including my Colorado River Research Group colleague Kristiana Hansen, has a new paper that reminds us that we need to be careful about how we thinking about conserving water that is being “wasted.”

Their case study is an area on the New Fork in Wyoming, a tributary of the Green, which is a tributary of the Colorado, where producers use flood irrigation on timothy grass to grow livestock forage.

Flood irrigation is often seen as “wasteful.” One approach is to install “more efficient” irrigation technology. But – and this is one of my repetitive talking points with students in the graduate water policy course I teach every fall – you need to flag the word “waste” when you see it in a water policy discussion and think carefully about how you’re using it.

That water is going somewhere, and doing something. You have to include this in your analysis. Maybe it’s really being “wasted”. But you may find that the place the water is going, and the thing that it’s doing, is valuable!

That’s what the Wyoming team found. Flood irrigation recharges the shallow aquifer – reducing the spring peak in the area’s streams, and slowly releasing that water back into those same streams in late summer. Which is crucial, in this case, for economically valuable fisheries – recreational brown trout fishing, to cite their analysis.

This is at the heart Bruce Lankford’s oddly named work on the “paracommons,” which has provided an enormously helpful analytical framework for my thinking about this stuff.

Cleaning up our urban sewage for reuse is super popular right now, and can in some cases be an enormously powerful water policy response to scarcity. But we’ve got to be mindful about where that “wasted” water is going and what positive benefits it is providing. Lots of inland urban cities in the southwestern United States treat their wastewater and return it to rivers, where it feeds ecosystems and downstream users.

We always have to consider the tradeoffs.

Green River Basin

Topsoil Moisture % short/very short: 28% of the Lower 48 is short/very short, 3% more than last week — @NIDISDrought

Spots of both improvement and drying in the East and Southeast, while much of the West and Plains dried out. Greatest drying this week was in RI, CT & WA.