“New plot using the nClimGrid data, which is a better source than PRISM for long-term trends. Of course, the combined reservoir contents increase from last year, but the increase is less than 2011 and looks puny compared to the ‘hole’ in the reservoirs. The blue Loess lines subtly change. Last year those lines ended pointing downwards. This year they end flat-ish. 2023 temps were still above the 20th century average, although close. Another interesting aspect is that the 20C Mean and 21C Mean lines on the individual plots really don’t change much. Finally, the 2023 Natural Flows are almost exactly equal to 2019. (17.678 maf vs 17.672 maf). For all the hoopla about how this was record-setting year, the fact is that this year was significantly less than 2011 (20.159 maf) and no different than 2019” — Brad Udall
What do you call a situation that remains a crisis, but has ever so slightly improved?
I’m asking myself this as I look at the latest water level data for Lake Powell, the reservoir in Arizona and Utah that feeds the Glen Canyon hydropower plant and is a conduit for drinking water for parts of several states.
The level on Monday was 3,568 feet above sea level, according to the Bureau of Reclamation, the federal agency that manages the reservoir and the power plant.
On the same day last year, the water was at 3,525 feet—a difference of 43 feet. That was close to the reservoir’s lowest level since it was initially being filled in the 1960s.
Both the current level and last year’s are much lower than is optimal, following years of drought and overallocation of the reservoir’s water. But officials have some breathing room thanks to last year’s wet winter, which led to an above average, and in some areas, record snowpack that helped replenish some of what had been lost.
“We’ve kind of been digging ourselves out of a hole,” said Bart Miller, the healthy rivers director at Western Resource Advocates, a conservation nonprofit based in Boulder, Colorado. “The one wet year that we had is only getting a part of the way there … We still have a lot of work to do to put our demands for water back into balance with what the river provides.”
He’s talking about the Colorado River, which passes through Lake Powell. The Colorado River Basin is a source of water and hydropower for about 40 million Americans.
The lake and its 1,320-megawatt power plant get a lot of attention because of their importance to millions of water and electricity consumers, and because the water level has gotten perilously close to shutting off the flow to the power plant.
Lake Powell key elevations. Credit: Reclamation
If the level falls to 3,490 feet—78 feet below this week’s reading—water will be too low to spin the turbines that generate electricity.
If the level falls to 3,370 feet—198 feet below this week’s reading—it would reach “dead pool” status, when the water is too low to flow downstream from the dam. The results would be catastrophic for communities south of the dam, as David Dudley explained last year in Sierra magazine.
The Bureau of Reclamation does regular forecasts to have an idea of these risks. A report issued in August projects that there is essentially a zero percent chance that the power plant will be forced offline this year, but a 3 percent chance the water level will drop enough to force a shutoff in 2028.
Lake Powell is one several prominent examples of water resources that are at risk because of drought that climate change has exacerbated and the overallocation of the Colorado River. Downriver is another example, Lake Mead, whose low water levels have led to heightened concerns about the Hoover Dam power plant, as Rhiannon Saegert wrote for the Las Vegas Sun in August.
The Biden administration is working with states that rely on the Colorado River to find ways to conserve water and maintain adequate flow through Lake Powell and Lake Mead. The administration revised the operating guidelines for the lakes in April, including measures to better give notice to operators of irrigation systems and water utilities about water delivery reductions, and giving the Bureau of Reclamation more flexibility to conserve and store water.
“Failure is not an option,” said Tommy Beaudreau, who was then deputy secretary of the Interior, in an April statement.
Hydroelectric Dam
Let’s take a few steps back. Hydropower plants have long been some of the most reliable sources of carbon-free electricity. The country gets 6 percent of its electricity from hydropower, which is more than any other utility-scale renewable source except for wind.
But drought and other extreme weather events are making hydropower increasingly volatile. The ups and downs show up in national figures; 2021 and 2022 were two of the three lowest years for hydropower generation since 2010, according to the Energy Information Administration. (This doesn’t include 2023, for which full-year records are not yet available.)
The shifts look ever more drastic at the state level.
From October 2022 to September 2023, hydropower generation in Washington State—the national leader in hydropower—was down 23 percent compared to the previous 12-month period.
In that same timeframe, California increased its hydropower generation by 72 percent.
Credit: Inside Climate News
The “why” comes down to local factors such as drought or recovery from drought. For grid operators, the takeaway is that hydropower isn’t as steady as it used to be.
There also is a growing view among environmental and justice advocates that hydropower has harmful effects on plants and animals, and can lead to an increase in methane emissions. And, construction of reservoirs has often displaced Indigenous communities.
Some of those advocates, with support from farmers, are saying the Colorado River should be allowed to flow freely through the area where the Glen Canyon Dam now stands in order to improve the availability of water south of the dam, among other benefits. Ian James of the Los Angeles Times wrote about this in September.
While the idea doesn’t have widespread support, it’s not being dismissed in the way it might have been a decade ago, when the problems with the dam were less apparent.
Federal officials have resources to prepare for declining water levels on Lake Powell, but they are dealing with symptoms of larger problems: climate change and a demand for water that exceeds a shrinking supply.
For now, the news is better than it was last year at this time, but Miller isn’t treating this like a victory.
“We haven’t solved the problem,” he said. “We’re still in this place where we need to do a lot of work.”
Sites in Archuleta County received more than a foot of snow from the weekend’s storm. As of Thursday, Jan. 4, Archuleta County had received around 2 inches of snow and Wolf Creek Ski Area had received 3 inches. Saturday night and Sunday brought the biggest snowstorm of the season, accumulating between 7 and 14 inches in areas of Archuleta County, according to the Community Collaborative Rain, Hail and Snow Network (CoCoRaHS) website. Wolf Creek Ski Area reported 29 inches in a report on Jan. 8…
According to snoflo.org, the Wolf Creek summit, at an elevation of 11,000 feet, had a 48-inch snowpack (84 percent of normal), up from 56 percent of normal on Jan. 3. The website reports that it is low for this time of year. According to the Natural Resources Conservation Service, on Jan. 4, the Wolf Creek summit had 28 inches of snow and 7.8 inches of snow water equivalent. As of Jan. 9, the agency reports 51 inches of snow and a snow water equivalent of 9.6 inches.
According to the myriad press releases I receive from the industrial self-care complex, we are in the thick of January Blues season — the downtime that follows the month of consumerism, er, the holidays. I don’t know about that, but I do know that ol’ Mother Snow must be feeling a little blue about the news these days.
Sure, it finally snowed a fair amount in the Four Corners region, blanketing high and even lowlands with white, slicking up the roads, and freshening up the slopes.
In Durango, enough snow accumulated to allow nordic skiing at the Hillcrest golf course, my favorite winter health indicator. And, because the new snow fell on a weak, faceted base layer, it elevated avalanche hazard in some areas, including at the Palisades Tahoe ski resort in eastern California.
Placer County Sheriff’s Office on Instagram: “OLYMPIC VALLEY, Calif. — At approximately 9:30 a.m. today at Palisades Tahoe, an avalanche occurred on the Palisades side of the ski resort, specifically above the GS bowl area of KT-22.
Olympic Valley Fire Department responded to Palisades Tahoe for word of an avalanche in the ski area. OVFD contacted ski patrol, who confirmed an avalanche in the GS Bowl of KT 22. OVFD began recruiting allied agencies and pooling resources in support of Palisades Ski Patrol efforts: OVFD, PCSO, and Palisades Tahoe.
Placer County Sheriff’s Office assisted Olympic Valley Fire and Palisades Tahoe with the search and rescue operation. Tahoe Nordic Search and Rescue was activated along with allied agency partners and assets from the west side. PCSO is investigating the coroner’s case.
The avalanche caused one fatality and one injury. Our thoughts and prayers are with their family members at this difficult time.
No further missing persons have been reported. More than 100 Palisades personnel participated in a beacon search, and two probe lines have been completed. The mountain is closed for the remainder of the day.
The avalanche debris field is approximately 150 feet wide, 450 feet long and 10 feet deep.
We will update with more information as it becomes available. A press conference will be scheduled at 2:30 p.m. at Basecamp at Palisades Tahoe.
WHAT: Palisades Tahoe avalanche incident press conference WHO: Olympic Valley Fire Department Chief Brad Chisholm, Placer County Sheriff’s Office Sgt. Dave Smith, Placer County Sheriff’s Office Lt. Don Nevins, Placer County District 5 Supervisor Cindy Gustafson
WHERE: Palisades Tahoe, Basecamp Conference Room, 1960 Olympic Vly Rd, Olympic Valley, CA 96146
WHEN: Wednesday, Jan. 10, 2:30 p.m. #palisadestahoe #olympicvalley”
JANUARY 12, 2024
And yet, it will take a constant barrage of such storms to pull much of the West out of the snow drought. Even if that does happen (and it’s still possible), the science is indicating that the winters we once knew are a thing of the past, and the snowpack — and water supplies — will keep getting thinner, on average, with each passing decade. So here are the hot takes on the hot world:
It’s now official: 2023 was the planet’s hottest year on record (going back to 1850). That’s according to the Copernicus Climate Change Service, which keeps tracks of this sort of thing. It was also the “first time on record that every day within a year has exceeded 1°C above the 1850-1900 pre-industrial level.” Some days in November were even 2 °C above the pre-industrial level. Yikes.
Earth was record warm in 2023.
The U.S. didn’t experience its hottest year ever, but it was warmer than average(especially from July onward). The Western side of the country actually had it a bit better than Texas and the East; we were merely “above average” for the year. Balancing it out, much of the West also got above average precipitation. Unfortunately the Four Corners, after a bountiful winter, got robbed of the big monsoon come summer, bringing levels down to average and even below that in New Mexico, where the drought persists. December was especially warm and dry across most of the West and was even the hottest December ever in the Upper Midwest and Northern Rockies.
Overnight, minimum temperatures keep getting warmer, even more so than the maximum daytime highs. Source: NOAA
And a warm and dry December brings the January snowpack blues to the mountains that feed the Colorado River. The 130 SNOTEL stations in the Upper Colorado River Basin are recording a snowpack on a par with the dismally dry 2021 winter, which brought Lake Powell down to crisis levels. The snowpack is even thinner than it was on this date in 2002. Ack! Still, check out the trajectory for 2023: After an average beginning, winter really took off from January into about mid-April. So there’s still time for a recovery. Really.
Overnight, minimum temperatures keep getting warmer, even more so than the maximum daytime highs. Source: NOAA
That aligns with the findings of a new peer-reviewed study recently published in Nature, showing that human-caused warming has been shrinking mountain snowpacks globally since at least 1981. The findings are nuanced: The shrinkage isn’t happening everywhere (colder areas are less vulnerable to the rising temperatures, so far), it’s happening at different rates in different places, and it isn’t always attributable to human-caused global warming. In fact, while the Rio Grande has “suffered large historical snowpack declines of over 10% per decade … there is little agreement that forced temperature and precipitation changes have caused those declines, reinforcing the notion that low-frequency variability can overwhelm forced signals in snow and hydroclimate, even on multidecadal timescales.” The Colorado River Basin’s snowpack has also shrunk at a rapid rate, and in that case the authors did find a link to anthropogenic global warming. And because of the nonlinear sensitivity of snow to warming, the future may be even less snowy. I’ll let the authors explain:
“Under Shared Socioeconomic Pathway (SSP) 2–4.5, a ‘middle-of-the-road’ emissions scenario, the most highly populated basins are expected to see strong declines in spring runoff as a result of nonlinear snow loss, even in the face of relatively modest warming projected in those regions. The western USA, for example, is poised to see particularly sharp spring runoff declines in the upper Mississippi (84 million people, 30.2% spring runoff decline), Colorado (14 million, 42.2%), Columbia (8.8 million, 32.7%) and San Joaquin (6.8 million, 40.9%) river basins.“
And, yes, Colorado’s snows and streamflows will be a victim of this same phenomenon, according to the latest climate change report for the Colorado Water Conservation Board. The report finds:
Statewide annual average temperatures warmed by 2.3°F from 1980-2022 — with a strong link to human influence on climate — with the greatest warming occurring in the south-central and southwestern parts of the state, and during the fall.
By 2050 statewide temperatures are projected to warm by 2.5°F to 5.5°F compared to the 1971 baseline, making the average year in the 2050s and beyond warmer than the hottest years on record now.
Precipitation has decreased 22% in southwestern Colorado and 20% in northwestern Colorado since the 1951-2000 period, but the future trends are less clear than temperatures — precipitation may even increase by as much as 7%, with the largest gains during winter, though more of it is likely to fall as rain.
Snowpack has also decreased and future warming likely will lead to further reductions, even if precipitation increases, and the seasonal snowpack peak is projected to shift earlier by as much as several weeks by 2050, which could be accelerated by increased dust-on-snow events.
April 1st snowpack by major river basin. Credit: The Land Desk
A shrinking snowpack and earlier runoff will further diminish streamflows.
Soil moisture has generally been on the decline in high-elevations since 1980 and future warming is expected to lead to future decreases in summer soil moisture, which can, in turn, exacerbate warming.
Warming has driven greater evaporative demand — or atmospheric thirst — over the last four decades, this means crops will need more irrigation to thrive, increasing water consumption even as water supplies dwindle.
Potentail Evapotraspiration (PET) 1980-2022. Credit: The Land Desk
Well, if you didn’t already have the January Blues (or didn’t even know such a malady existed), you just might have them now. I’m sorry, but it will help to go up to the golf course and do some nordic skiing, I promise. And for more on the Colorado climate report read Heather Sackett’s excellent piece for Aspen Journalism.
NASA announced that 2023 was the hottest year on record, according to an analysis of annual global average temperatures by the Goddard Institute for Space Studies. Scientists who maintain the temperature record, which begins in 1880, calculate a global temperature anomaly each year to determine how much temperatures have changed compared to temperatures from 1951–1980.
Every month from June through December 2023 came in as the hottest month on record. July ranked as the hottest month ever recorded.
But what caused 2023, especially the second half of it, to be so hot? Scientists asked themselves this same question. Here is a breakdown of primary factors that scientists considered to explain the record-breaking heat.
The long-term rise in greenhouse gases is the primary driver.
For more than 100 years, humans have been burning fossil fuels such as coal, gas, and oil to power everything from lightbulbs and cars to factories and cities. These actions, along with changes in land use, have led to a rise in greenhouse gases in the atmosphere. Greenhouse gases act like a blanket trapping heat around the planet. The more of them you add, the thicker that blanket becomes, further heating Earth.
Carbon Dioxide swirling around the Earth. Credit: NASA Earth Observatory
In May 2023, carbon dioxide concentrations in the atmosphere peaked at 424 parts per million at NOAA’s Mauna Loa Observatory, Hawaii. The annual peak has been steadily rising since measurements began in 1958. (Other global carbon measurement projects showed similarly high numbers.) Extending the record back even further with ice cores, carbon dioxide concentrations are the highest they have been in at least 800,000 years.
“We’re going to continue to have records be broken because the baseline temperature is moving up all the time,” said Gavin Schmidt, director of NASA’s Goddard Institute for Space Studies in New York City. “The cause of that warming trend over the last 50 to 60 years is dominated by our changes to greenhouse gases, particularly carbon dioxide and methane.”
The return of El Niño added to the heat.
On top of the long-term global warming trend are natural variations in the climate. One of the largest sources of such year-to-year variability is the El Niño Southern Oscillation (ENSO), which occurs in the tropical Pacific.
June 1 – 10, 2023. Credit: NASA Earth Observatory
ENSO transitions between three phases: El Niño, La Niña, and neutral, or average. During El Niño, trade winds weaken; that is, winds that normally blow from east to west in the tropical Pacific weaken. The sea surface around the equator in the central and eastern Pacific near South America also becomes warmer (and higher) than normal. El Niño often coincides with the warmest years in the global average.
During La Niña, the opposite happens: the trade winds strengthen and the sea surface temperatures in the eastern Pacific are cooler than normal. This can help offset some of the rising temperatures from long-term global warming.
From 2020–2022, the Pacific saw three years of La Niña conditions. Then El Niño returnedbeginning in May 2023. This El Niño has not yet been as strong as those in 2015–2016 or 1997–1998, both of which caused large global average temperature spikes. However, when you add this ocean warming to the long-term warming trend from greenhouse gases, the start of El Niño helped temperatures jump enough to create a new record for heat.
“For the most part, it’s us and El Niño,” said Josh Willis, a climate scientist at NASA’s Jet Propulsion Laboratory. “At the end of the day, humans are heating the planet, and El Niño is dancing on our heads.”
Globally, long-term ocean warming and hotter-than-normal sea surface temperatures played a part.
Looking more broadly, the tropical Pacific wasn’t the only part of the ocean that was hotter than normal this year. The global sea surface temperature set new records in 2023, with the North Atlantic and other parts of the ocean experiencing several marine heat waves.
August 21, 2023. Credit: NASA Earth Observatory
“Just like global temperatures, ocean temperatures are on the rise,” said Willis. “They have been rising for the last century or more, and they are not slowing down. If anything, they are speeding up.”
What’s behind the rise in ocean temperatures? Greenhouse gases warming the planet. Around 90 percent of the heat trapped by rising greenhouse gases is absorbed by the ocean. That means that as greenhouse gases continue to increase, so will ocean temperatures, which raises temperatures across the globe.
Aerosols are decreasing, so they are no longer slowing the rise in temperatures.
Another global trend that scientists are monitoring is a change in aerosols in the atmosphere. Aerosols are small particles in the air—such as smoke, dust, volcanic gases, sea spray, air pollution or soot—that can impact the climate. Airborne particles can either reflect sunlight, causing a slight cooling of the air, or absorb sunlight, causing a slight warming of it.
June 26, 2023. Credit: NASA Earth Observatory
As governments have passed regulations to reduce air pollution and improve air quality, the abundance of aerosols has been decreasing in most areas. Many of these human-produced particles are the type that cool the climate slightly, so with less of them in the air, the result is a slight warming effect. But this contribution is quite small in comparison to the much greater warming from rising greenhouse gases.
Scientists at NASA and around the world are investigating how a reduction in aerosols from new shipping regulations potentially change how much solar energy is reflected back into space. While these changes can be notable on regional scales, the global impact is likely small, Schmidt said.
Scientists found that the Hunga Tonga-Hunga Ha‘apai volcanic eruption did not substantially add to the record heat.
In January 2022, the eruption of the Hunga Tonga-Hunga Ha‘apai undersea volcano blasted an unprecedented amount of water vapor and fine particles, or aerosols, into the stratosphere. Water vapor, a greenhouse gas, can produce a warming effect on the atmosphere, so scientists investigated the impact of the eruption on the global temperature. Sulfate aerosols from eruptions, on the other hand, have sometimes led to some global cooling events.
Hunga Tonga-Hunga Ha‘apai volcanic eruption. Credit: NASA Earth Observatory
A recent study found that the volcanic sulfate aerosols reflected some sunlight away from Earth’s surface, leading to a slight cooling of less than 0.1 degrees in the southern hemisphere following the eruption. Essentially, the warming that occurred from the increase in water vapor in the stratosphere was offset by the cooling caused by volcanic sulfate aerosols leading to a slight cooling lower in the atmosphere. This means the eruption likely did not add to the record heat in 2023.
“We are very interested in the weather and extremes of any particular year because those are the things that impact us,” said Schmidt. “But the key difference between this decade and the ones before is that the temperatures keep rising because of our activities, principally the burning of fossil fuels.”
The current water level of Lake Mead behind the Hoover Dam July 2023. Photo credit: Reclamation
Click the link to read the article on the NOAA website (Peter Goble, Russ Schumacher):
January 9, 2024
The Colorado River is perhaps the most critical resource to the southwestern United States, providing water to over 40 million people. In an average year, over half of this water comes from western Colorado, primarily in the form of snowmelt when high-elevation seasonal snowpack dissipates in the spring.
The Colorado River has been managed with a large series of reservoirs. Seasonal water supply forecasts made by agencies like the Colorado Basin River Forecast Center (CBRFC) and the National Resources Conservation Service (NRCS) using data from high-elevation Snowpack Telemetry (SNOTEL) stations offer water managers insight into how much water to expect each year. These forecasts allow for less uncertainty and better management of these important reservoirs.
However, 2020 and 2021 were low water supply years, much lower than one would expect based on snowpack values alone. Researchers from the Colorado Climate Center questioned whether very low, if not record low, soil moisture levels at high elevation were causing a smaller fraction of snowmelt to runoff than in a normal year, and further, whether these conditions are likely to occur more frequently in a warmer climate. “On the Sources of Water Supply Forecast Error in Western Colorado” is the result of a research project funded by NOAA’s National Integrated Drought Information System (NIDIS) to explore this question.
The research team created hindcasts of April–August streamflows using SNOTEL snowpack and precipitation data from 1981–2021, inputting modeled soil moisture and groundwater data to predict streamflow. In this case, “hindcast” refers to a prediction of streamflow in a previous subset of years using a statistical model that was trained based on a separate subset of years. In this way, the researchers mimicked an actual water supply forecasting environment without including the known answer into the model (See the AMS article for a more detailed explanation of the methods).
The researchers paid special attention to hindcasts using the data available on April 1. April 1 is near peak snowpack season, and these numbers have historically been used as a benchmark for how much water to expect in the coming spring. In 2021, for instance, adding soil moisture data from the Western Land Data Assimilation System’s km resolution land surface model reduced April 1 streamflow hindcast in all four major basins, and lowered hindcast error across the board.
Results indicate that a much larger fraction of the error in the hindcast is attributable to the weather that occurs after April 1 and 2021 was no exception. While antecedent soil moisture conditions were record-low in western Colorado, 2021 also had a much drier-than-normal spring for western Colorado with a record dry April. This was not well predicted or incorporated in operational streamflow forecasts. April 1 numbers do not tell the whole story, because what happens before the snowpack season, and what happens from April 1 through early June, also have a marked impact on the year’s water supply.
The findings from this study are important because they establish a ceiling for how skillful we can expect water supply forecasts to be without significant, successful investments in sub-seasonal to seasonal forecasting over the Intermountain West. Soil moisture data can be implemented more effectively in the future and incrementally lower water supply forecast error for this crucial region. However, with time, larger-scale errors in sub-seasonal to seasonal prediction will need to be addressed to create a consistently accurate forecast of water supplies.
Documenting the rate, magnitude and causes of snow loss is essential to benchmark the pace of climate change and to manage the differential water security risks of snowpack declines. So far, however, observational uncertainties in snow mass have made the detection and attribution of human-forced snow losses elusive, undermining societal preparedness. Here we show that human-caused warming has caused declines in Northern Hemisphere-scale March snowpack over the 1981–2020 period. Using an ensemble of snowpack reconstructions, we identify robust snow trends in 82 out of 169 major Northern Hemisphere river basins, 31 of which we can confidently attribute to human influence. Most crucially, we show a generalizable and highly nonlinear temperature sensitivity of snowpack, in which snow becomes marginally more sensitive to one degree Celsius of warming as climatological winter temperatures exceed minus eight degrees Celsius. Such nonlinearity explains the lack of widespread snow loss so far and augurs much sharper declines and water security risks in the most populous basins. Together, our results emphasize that human-forced snow losses and their water consequences are attributable—even absent their clear detection in individual snow products—and will accelerate and homogenize with near-term warming, posing risks to water resources in the absence of substantial climate mitigation.
Black Canyon July 2020. Photo credit: Cari Bischoff
From email from Reclamation (Erik Knight):
The next coordination meeting for the operation of the Aspinall Unit is scheduled for Thursday, January 18th2024, at 1:00 pm.
This meeting will be held at the Holiday Inn Express in Montrose, CO. There will also be an option for virtual attendance via Microsoft Teams. A link to the Teams meeting will be emailed next week along with the meeting handouts.
The meeting agenda will include a review of operations and hydrology since August, current soil and snowpack conditions, a discussion of hydrologic forecasts, the weather outlook, and planned operations for this water year. There will also be a presentation by American Whitewater on the development of the Environmental & Recreational Flow Tool.
It was a stormy week across much of the eastern lower 48 states leading to widespread drought improvements east of the Rockies. A winter storm pummeled the Mid-Atlantic and Northeast over the weekend (January 6-7). Then a second system in its wake was ramping up across the Mississippi Valley toward the end of this week (Tuesday, January 9), bringing heavy rainfall to the Lower Mississippi and the Deep South. More than 2 inches of rain fell in many areas, with localized amounts upwards of 5 inches. Heavy snow also fell across parts of the Central Plains and Midwest as it moved slowly eastward, with snowfall still ongoing across parts of the Midwest and Great Lakes by the end of this week. Across the Intermountain West, it was a wet and snowy week mainly for parts of the Pacific Northwest and isolated locations in the Great Basin and Four Corners region, leading to some targeted improvements. However, several areas experiencing antecedent dryness and drought missed out on the precipitation, leading to further degradations, particularly across the northern Rockies, Front Range, and across parts of the western Colorado Plateau in Arizona. In Alaska, no changes to the drought depiction are warranted this week. In Hawaii, a Kona low spinning off to the north brought heavy bands of precipitation to western portions of the island chain, warranting some improvements to drought conditions. Conversely, another week of warm temperatures and below normal rainfall in Puerto Rico resulted in widespread deterioration of the drought depiction…
Storminess in recent weeks has resulted in widespread improvements across the Central Plains. Additional improvements were again warranted this week in the Central Plains, where a couple of storm systems brought wintry precipitation, with weekly snowfall totals of over 5 inches for many areas (locally more than 10 inches), further increasing short-term precipitation surpluses. Unfortunately, the storm track has predominantly been displaced southward across the southern half of the U.S. over the past couple of months, which has led to slow deterioration of drought conditions across portions of the western High Plains and along the Front Range of the Rockies. With another week of below normal precipitation, degradation was again warranted this week. Seasonal snowfall remains below average for many locations and daytime temperatures have been running above normal (and above freezing), exposing soils to evaporation, predominantly from high winds…
Colorado Drought Monitor one week change map ending January 9, 2024.
Targeted improvements are warranted across parts of the Pacific Northwest and New Mexico, where 7-day precipitation totals, in combination with storminess in recent weeks, have improved some of the long-term drought indicators, even improving seasonal snowpack to be closer to normal for several locations. However, some degradation was also warranted in locations that missed out on heavier precipitation amounts this week, and who have experienced below normal precipitation and above normal temperatures over the past few months. Seasonal snowpack is running below normal throughout much of the Intermountain West, although interior portions of the Great Basin are faring a little better. So much of the recent improvements can be attributed to rainfall and improving soil moisture and stream flows…
Much needed rain fell this week across much of the South, with many locations across the Lower Mississippi and Tennessee Valleys picking up well over 2 inches of rainfall. However, long-term drought conditions still very much remain in place across much of the Lower Mississippi Valley, with several areas across Louisiana and Mississippi experiencing upwards of 20-inch rainfall deficits over the past year. There are marked improvements in the upper layers of the soils and in some of the short-term drought indices in recent weeks, as the storm track has been active across the Gulf Coast states. However, more rainfall will be needed to dig into the long-term precipitation deficits and recharge groundwater. Improvements to drought conditions are also warranted across parts of the Southern Plains this week, where widespread precipitation totals in excess of 1 inch were received…
Looking Ahead
During the next five days (January 11-15), a storm system is forecast to develop and intensify east of the Rockies, bringing potentially heavy rain and snow to parts of the eastern U.S. In the wake of this storm system bitterly cold temperatures are forecast to spill southward from Canada, leading to dangerously cold temperatures and wind chills across portions of the central and northern U.S.
The Climate Prediction Center’s 6-10 day outlook (valid January 16-20), favors enhanced chances of below normal temperatures across much of the lower 48 states, with the highest chances (greater the 90%) centered over the Middle Mississippi Valley. Conversely, above normal temperatures are favored in the southwest U.S., underneath a mid-level ridge of high pressure that is forecast. Below normal precipitation is favored across many areas east of the Rockies during the next 6-10 days, as dry air moves in behind a departing storm system. However, a frontal boundary is forecast to remain draped across the Gulf of Mexico, bringing increased above normal precipitation chances to southern Texas and the Florida Peninsula. Above normal precipitation is also favored across parts of the West Coast, northern Rockies, and northern High Plains, associated with moist southwesterly flow into the northwestern U.S.
US Drought Monitor one week change map ending January 9, 2024.
Perhaps you’ve seen the latest viral Facebook meme about the ungodly amount of mined material needed to manufacture an electric vehicle. If not, you’ve probably seen one like it, maybe bashing EVs, maybe solar panels or wind turbines or some other clean energy technology (often accompanied by a gory image of a purported lithium mine). The implication is always the same: That “green” technology you’re so fired up about isn’t green at all — in fact, it’s destroying the earth.
Normally I wouldn’t give these things a second thought. After all, they are memes, which by their very nature are simplistic and aimed at triggering the most primal emotional response, usually some flavor of fear.
But this particular one — an inventory of the many tons of ore that must be mined to produce the materials in a Tesla model Y battery — has been especially infectious, it seems, and has made its way onto many of my social media pals’ feeds. Some of my friends have used it to argue against purchasing an EV, others have rightly questioned its veracity, while still others have posted counter-memes debunking it.
Since the Land Desk covers lithium mining and other impacts of the clean energy transition, I figured I’d use this meme — circulated by someone named Jackie — as an opportunity to add some context. That’s because, regardless of whether the meme is accurate or not, it does bring up an important question: Are electric vehicles merely an instance of problem shifting, or transferring the equivalent environmental impacts from one technology to another?
The post in question, let’s call it Jackie’s Meme, claims that 250 tons of earth must be moved to obtain the lithium, nickel, manganese, and cobalt in a typical EV battery, and a Caterpillar 994A used for this purpose would burn about 264 gallons of diesel in 12 hours, offsetting the carbon emissions reductions you’d get from driving the car.
These are certainly eye-opening numbers, even if they are a bit off (I came up with a figure of 69 tons of material moved, not 250, but more on that later). But they are also irrelevant in isolation, since the only thing we can conclude is that manufacturing an EV requires mining, just like mining was required to produce the laptop I’m writing this on, the desk it’s sitting atop, and the data center responsible for delivering the information to you. In other words, building an EV has an impact on the environment, maybe even a big one.
Coyote Gulch’s shiny new Leaf May 13, 2023
But you don’t buy an EV because it’s good for the environment. You buy it because it’s less bad for the environment than a conventional vehicle (and for other reasons, such as performance, fuel savings, and so forth). Without including a comparison of how much material and mining is needed for a conventional vehicle vs. an electric one, the meme is useless, meant only to scare people away from doing anything.
And that may have been the intent. But another reason for the omission is that accurate apples to apples comparisons of the total amount of mined material needed for an average ICE vehicle vs. an average EV are hard to find. That said, we do know that EVs generally are heavier than their gas-powered counterparts due to the large, dense batteries (although they have far fewer moving parts). And we do know that EVs require far more of certain minerals, such as lithium, cobalt, nickel, and copper.
This IEA graphic is a good one for those particular minerals:
Source: International Energy Agency
Manufacturing an electric vehicle, then, requires about six times as much of the listed materials as a conventional car. I suspect this disparity might shrink somewhat if steel (iron), aluminum, and molybdenum were also included, but it wouldn’t change the basic fact: EVs are more mineral intensive than ICE cars.
And whether the mineral is steel or nickel, cobalt or platinum, extracting it requires moving, hauling, milling, and smelting huge amounts of rock to get a relatively minuscule amount of target mineral. That’s why the Bingham Copper Mine near Salt Lake City is 2.5 miles wide and nearly 4,000 feet deep. And the more rock and ore you mine, the larger the volume of waste, or tailings and waste rock and, generally speaking, the greater the environmental impact1. Here’s a great graphic showing the ratio of total material moved to ore mined to commodity produced:
From the Energy Transitions Commission. Hat-tip to Hannah Ritchie’s excellent Sustainability by the Numbers newsletter for pointing me to this resource.
Jackie apparently used this sort of math to get to the 250-tons figure. I think she’s off: using the IEA figures and the above graphic, I find that an EV would actually require moving about 69 tons of earth. But when you’re talking dozens of tons, it doesn’t really matter that much. Jackie’s point still stands: You’ve gotta mine a lot of stuff to make an EV.
So, go ahead, buy that gasoline guzzler and feel good about it. You’re doing the planet a favor!
Just kidding.
Sure, maybe when they come out the factory door, a new EV has a larger environmental footprint than its gasoline-powered counterpart. But once you start driving the things, the gasoline car’s impact grows at a much faster rate than the EV’s because of, well, gasoline.
Let’s say you live in New Mexico, and drive your car about 14,400 miles per year (the average for the state per registered vehicle), and you have an average car that gets about 22 miles per gallon. You’ll burn through 654 gallons of gasoline and your tailpipe will spew out about 6.4 tons of climate-warming carbon dioxide each year, along with a nasty cocktail of health-harming and smog-forming pollutants such as sulfur dioxide, carbon monoxide, nitrogen oxides, benzene, and particulates.
That’s on top of the impacts of drilling for the oil from which the gasoline is derived. Drilling and hydraulic fracturing a single well can use 10 million gallons or more of fresh water. The 1,300 gallons of crude oil needed to produce your car’s annual gasoline use will be accompanied by as much as 7,800 gallons of briney, contaminated wastewater that must be disposed of — often in deep injection wells that can trigger earthquakes. Planet-warming methane, along with harmful volatile organic compounds, can spew from oil wells, pipelines, and refineries. Pipelines rupture regularly, spilling wastewater, oil, or diesel — sometimes they even explode. And petroleum refineries are major pollution sources as well.
Electric vehicles don’t have tailpipes, so you’re not polluting the neighborhood by driving one around2. Yes, electric vehicles must be charged, and yes, some of that electricity is likely to be generated by burning fossil fuels, which requires extraction and creates pollution and other environmental impacts. But EVs generally are more efficient than gasoline powered cars, especially the gargantuan SUVs Americans are so enamored with, so even if you charge on a natural gas-generation-dominated grid you’re likely emitting less carbon per mile. Study after cradle-to-grave study has found that EVs have lower emissions over their lifecycle than their gasoline-powered counterparts, even when battery production3 and raw material mining is accounted for.
This is a Euro-centric graph from Carbon Brief, but it gets the point across. And believe me, an average “Euro car” is likely far more efficient than an average U.S. conventional car. Source: Carbon Brief.
EVs’ environmental advantages will continue to build as the electricity grid is further decarbonized and fossil fuel generation is displaced by solar, wind, geothermal, small hydropower, and nuclear. Large-scale battery recycling efforts are ramping up, which will reduce the amount of mining needed to build the things, and battery technology is advancing: They are becoming more energy dense and new lithium-, cobalt-, and nickel-free batteries are being developed. Researchers and startups are working to extract lithium from geothermal brine, allowing them to generate electricity and produce battery materials in one shot. And some hardrock mining operations are electrifying their haul trucks and other equipment and building solar arrays to power operations.
The upshot: If you need to purchase a new vehicle, and you’re trying to choose between an electric one or a gasoline-powered one, the EV probably would be a better choice for the environment over the long haul — regardless of the scare-memes.
Still, even that meme serves a purpose: It reminds us that we won’t get out of this mess by producing and consuming more stuff, no matter how “green” it may be. [ed. emphasis mine] Simply clogging up the roads with electric vehicles, blanketing the deserts with solar panels, building new dams, or filling our homes with “sustainable” goods won’t solve the problems created in the first place by overconsumption and waste. Economic and cultural systems must be overhauled or even overthrown. And the incessant hunger for more, more, more must be tempered at last.
Most of us have a slate of hope for the New Year. Denver Water does too!
We’re hoping for a bump in the snowpack as winter unfolds.
A half-frozen North Saint Vrain creek gurgles through Wild Basin in Rocky Mountain National Park, where warm temperatures and spotty snowpack in early January signaled a slow start to the snow season. Photo credit: Denver Water.
We entered January with ho-hum conditions, with snowpack in the mid-60s in terms of percentage of normal in Denver Water’s two water supply river basins — the South Platte and the Colorado.
That is not a banner start to the 2024 snowpack.
The last time the Colorado River snowpack started off near the current level was in 2013. For the South Platte however, snowpack is close to where it was last year.
“I’d rather be ahead than behind, but there’s still plenty of time for improvement,” noted Nathan Elder, Denver Water’s manager of supply. “The deficits we see currently can still be made up with one big storm.”
In the mountain watersheds where Denver Water collects its water supply, the percentage of water held in the snowpack (called the snow water equivalent or SWE), was far below normal as of Jan. 7, 2024, but additional mountain snow is in this week’s forecast. Image credit: USDA National Resources Conservation Service.
Another way to look at the snowpack so far this season is by plotting current snow water equivalent percentages against the normal trajectory through the winter and spring. This graphic looks at Colorado’s snow water equivalent percentages in early January 2024 compared to normal.
This image shows the natural rhythm of Colorado’s snowpack, the state’s frozen water reservoir, as it builds from winter to spring and then melts in the spring runoff. The black line shows Colorado’s snow water equivalent, or SWE, on Jan. 3, 2024, as compared to normal (the green line), and the historical minimum and maximum of snowpack peaks in the spring. Image credit: USDA Natural Resources Conservation Service.
There’s another point that can be made to push back on any early pessimism: Reservoir storage levels are the best since 2019 for Denver Water, at 86% of average versus the 83% that is typical this time of year. Statewide, too, reservoirs are in good shape following a good snow (and rain!) year in 2023.
Last year’s boost in reservoir levels is critical, as the extra water could help nurse water providers through a tough year should conditions remain underwhelming during the next four months of 2024.
Notably, reservoir conditions on the Eastern Plains are strong, too, boosted by a snowstorm that hit northeast Colorado the day after Christmas. Having high water storage levels for farmers and ranchers is always important because that reduces the potential that Denver Water might need to send more water downstream to meet the demands of older, more senior water rights holders.
“Below-normal snowpack is always concerning. Recent storms brought a little improvement and we continue to watch the weather and plan for this year’s spring runoff — while hoping for more snow,” Elder said.
Now is a good time to check for water leaks inside your home, because indoor use in the wintertime matters. Every bit we save in these colder months is water available to us when the warm months arrive.”
Colorado lawmakers will be asked to weigh in on more than a half-dozen proposed water bills this year that will likely include support for improving the water quality in Grand Lake, significant new funding for replacing thirsty lawns, a pilot program to test using natural systems — such as plants and soils, rather than water treatment plants, to clean up water — and new state-level protection for wetlands.
A resolution asking lawmakers to support work to improve the clarity of water in Grand Lake, under consideration for months, is receiving broad-based support from powerful water interests, including Northern Water, said Mike Cassio, president of Grand Lake’s Three Lakes Watershed Association. Cassio is among a group of advocates who have been trying to improve the lake’s once-clear waters for decades.
“Nothing official until it makes it to the floor, and it is passed. However, we are further than ever,” Cassio said.
Forget bluegrass lawns
Ambitious plans are also on the table to boost to $5 million the amount of money the state is putting into an existing turf replacement program. Gov. Jared Polis as well as members of a special Colorado River Drought Task Force have asked that the program be expanded. It was approved by lawmakers in 2022 and given $2 million in funding.
“I would love to see the project continue,” said state Sen. Cleave Simpson, a Republican from Alamosa, “and $5 million seems appropriate,” at least initially.
Simpson, who is general manager of the Rio Grande Water Conservation District, is a sponsor of a bill that would provide at least $1 million to launch a pilot program testing so-called “green” infrastructure, a term that refers to using such things as plants, wetlands and soils to clean up water, helping offset the use of more expensive tools, such as water treatment plants.
That’s only part of what could be another record-breaking year for funding Colorado water projects, according to Sen. Dylan Roberts, a Democrat from Frisco.
Last year, lawmakers approved $92 million in water funding, Roberts said, money that helps pay for water conservation, planning, dams and irrigation projects, and new technology, among other things.
“Last year’s projects bill (the legislative tool through which funding is approved) was the largest amount of funding on record,” he said. “I am hopeful we can break that record this year.”
Roberts said he also hopes to introduce legislation expanding the amount of water available to protect streams and to add more protection for farmers and ranchers who agree to place their water into conservation programs benefiting the Colorado River and potentially other waterways.
Replacing federal wetland protections
Another major initiative likely to surface is a plan to create a state-level program to protect streams and wetlands affected by road-building and construction. Last year, the U.S. Supreme Court, in its Sackett v. EPA decision, drastically narrowed the definition of what constitutes a protected stream or wetland under rules known as waters of the United States. The decision left vast swaths of streams and wetlands in the American West and elsewhere unprotected.
Colorado is among a handful of states seeking to set up its own program to ensure its streams and wetlands are safe even without federal oversight. Last year, the Colorado Department of Public Health and Environment (CDPHE) took temporary, emergency action to protect streams, but state lawmakers must approve any new, permanent program.
The CDPHE has been working with a large group of people on the issue, including farm and water interests, environmentalists, and construction and development firms. But what the new program might contain and how it will fare in the legislature is not clear.
“I think there is a lot of desire to get something like this done,” said John Kolanz, a Loveland-based attorney and water quality expert who represents construction interests. “The Sackett opinion really changed things. Some people estimate that it has reduced coverage of streams by 50% or more.”
As a result, Kolanz said, “The new state program is going to have to be quite large and it will have significant land-use implications. We’ve got to get it right on the front end.”
Fresh Water News was launched in 2018 as an independent, nonpartisan news initiative of Water Education Colorado. Our editorial policy and donor list can be viewed at wateredco.org.
More by Jerd SmithJerd Smith is editor of Fresh Water News. She can be reached at 720-398-6474, via email at jerd@wateredco.org or @jerd_smith.
Monthly global surface air temperature [1] anomalies (°C) relative to 1991–2020 from January 1940 to December 2023, plotted as time series for each year. 2023 is shown with a thick red line while other years are shown with thin lines and shaded according to the decade, from blue (1940s) to brick red (2020s). Data source: ERA5. Credit: C3S/ECMWF.
An astonishing seven consecutive months of record-breaking warmth have culminated in a grim milestone for humanity: 2023 was, officially, Earth’s hottest year on record.
That assessment, announced Tuesday by the European Union’s Copernicus Climate Change Service, follows a year in which extreme heat smothered multiple continents simultaneously, pushed ocean temperatures to alarming highs and spurred dire warnings about the worsening effects of climate change.
“2023 was an exceptional year with climate records tumbling like dominoes,” read a statement from Samantha Burgess, deputy director of Copernicus. “Not only is 2023 the warmest year on record, it is also the first year with all days over 1 degree Celsius warmer than the preindustrial period. Temperatures during 2023 likely exceed those of any period in at least the last 100,000 years.”
Westwide SNOTEL basin filled map January 11, 2024 via the NRCS.
Click the link to read the article on the InkStain website (John Fleck):
Three months into the 2023-24 water year, we have our first early look at what sort of runoff to expect on the Rio Grande in the coming year, and it doesn’t look great. The January NRCS median forecast for March-July runoff is 42 percent of “normal” at Otowi, the critical forecast point where the Rio Grande enters New Mexico’s Middle Rio Grande. It’s still early in the snow season, with a wide range of possible outcomes depending on the storm patterns over the next few months. But the best possible outcome (statistically a one chance in 20 of this much water) is still below the 30-year median.
In other words, we’re pretty clearly on track for a below-average runoff year.
The biggest uncertainty is always the weather, but I’m excited to see the new, improved statistical models shifting from the research world to operations.
Click the link to read the release on the NRCS website:
Dry conditions have dominated the water year until recently, and the below median precipitation and snowpack has led to below median streamflow forecasts for all major basins. The water year is still young and with recient storms there is still time for conditions to improve.
Denver, CO – January 9th, 2024 – The New Year brings a cautious yet hopeful outlook, following early January storms that have begun to pivot the state from a dry start to a more promising winter season. Recent climatic fluctuations, characteristic of the current El Niño phase, have led to a below-average snowpack statewide. NRCS Hydrologist Nagam Gill offers a hopeful perspective: “The early January storms have served as a pivotal juncture for our state’s snowpack levels, which initially raised concerns. We’re now witnessing signs of improvement, indicative of the dynamic and responsive nature of our watershed to meteorological influences.” As of January 1st, snowpack was at 68 percent of normal, reflecting the need for consistent snowfall to reach average winter accumulations. Yet, the data signals an upward trend, with statewide snow water equivalent improving from 68 to 71 percent of normal in the first week of January. The San Miguel-Dolores-Animas-San Juan River basin showed significant improvement, rising from 62 to 71 percent of normal in just a week. “While the Upper Rio Grande River basin remains low, there has been improvement with the most recent storm cycle from 55 to 63 percent of normal. This is a testament to the rapidity with which conditions can evolve,” Gill comments on the potential for swift changes in the wake of each new storm.
Colorado snowpack basin-filled map December 31, 2024 via the NRCS.
Streamflow forecasts for January 1st reflect a mixed picture, with some basins like the Arkansas reaching 85 percent of normal and the San Miguel-Dolores-Animas-San Juan at 68 percent of normal. Late summer precipitation trends offer a glimpse into soil conditions, with July’s drier spell particularly evident in the southern basins, ranging from 22 to 42 percent of median. However, a shift in the late season brought about above-normal rainfall in the northern regions and significantly improved moisture in the south from 63 to 112 percent of median, setting a favorable stage for runoff. Gill remarks, “A late summer uptick in soil moisture, lays the groundwork for priming basins for efficient hydrological response come spring.”
Contrasting with the snowpack’s slow start, reservoir storage offers a silver lining and is faring better than the previous year, thanks to last season’s generous snowpack. As the year concluded, reservoirs across the state have reported healthy storage levels at 99 percent of median. The Upper Rio Grande and Arkansas basins report reservoir storages at 121 and 112 percent of median, respectively. Gill mentions the broader implications: “These reservoir levels are more than just numbers; they’re a buffer – This increased capacity provides a much-needed buffer against the variability of snowpack accumulation and positions Colorado to better handle the ebb and flow of seasonal precipitation.”
Existing green growth policies are leading nowhere fast, so scientists say it’s worth exploring alternatives like degrowth to stay within planetary boundaries.
With Earth’s average annual temperature speeding toward 1.5 degrees Celsius faster than expected and global climate policy on a treadmill, an increasing number of researchers say it’s time to consider a “restorative pathway” to avoid the worst ecological and social outcomes of global warming.
In a study published today in Environmental Research Letters, an international team of scientists wrote that reaching global goals could require focusing on ways to drive rapid changes in the way people live, move, work and eat; on making sure that global wealth is distributed more equitably; and on restoring and protecting biodiversity and ecosystems like forests, oceans, fields and rivers that are critical to removing carbon dioxide from the atmosphere.
The restorative approach should be considered soon because the pace of climate impacts to ecosystems and communities is speeding up, the authors said. Climate extremes are outpacing decades of efforts to cap global warming with tools like carbon trading and offsets. Those are hallmarks of the green growth path mapped out by various United Nations-sponsored climate pacts like the Kyoto Protocol and the Paris Agreement, as well other ancillary agreements. They all aim to keep growing the global economy while reducing greenhouse gas emissions to net zero by 2050—partly based on assuming that large quantities of carbon dioxide will be directly removed from the air and stored by giant machines by then.
Many countries, like France, Sweden and the United States, have reduced emissions while continuing to grow their economies—called decoupling—over the last few decades, but research shows it’s not happening nearly fast enough to cap global warming.
Total global emissions, atmospheric greenhouse gas concentrations and the global average temperature all climbed to record highs during the past 30 years, amounting to about half the total greenhouse gas accumulations in the atmosphere since the start of the industrial age.
“It’s almost too late. We need to get cracking with this,” said Manfred Lenzen, a sustainability researcher at the University of Sydney and co-author of the new paper. “A lot of people think 1.5 is dead already, that we have to realistically aim for staying below 2C,” he said, adding that green growth—decoupling emissions from economic expansion—might have worked if the world had taken it seriously in 2000.
Starting then, it would have taken only a 2 percent annual reduction of greenhouse gas emissions to reach net zero by 2050; starting now means cutting global emissions by 7 percent a year, but the green growth approach is not cutting emissions by anywhere near the required rate, he said. And, particularly as outlined in the policy guiding reports from International Panel on Climate Change, it relies on deployment of unproven technologies.
A future of carbon removal? Credit: Inside Climate News
Carbon-removal technology, for example, is still decades away from deployment at a scale that would match the IPCC’s pathways to cap global warming at 1.5 degrees Celsius, as per the Paris Climate Agreement, said Lenzen.
Lenzen also co-authored a 2021 paper describing a “degrowth” alternative to the existing IPCC options, based on the idea of shrinking economies in rich countries in a controlled way by reducing production and consumption, in order to protect natural resources and reduce environmental damage while improving well-being.
Degrowth Research is Going Mainstream
A 2023 study in The Lancet Planetary Health journal showed that, even in countries with falling emissions and growing economies, emissions are not declining at rates compliant with the Paris Agreement. At the current rates, it would take those countries on average more than 220 years to reduce their emissions by 95 percent, the goal targeted for 2050.
The authors of that study wrote that those decoupling rates in high-income countries “cannot legitimately be considered green … To achieve Paris-compliant emission reductions, high-income countries will need to pursue post-growth demand-reduction strategies, reorienting the economy towards sufficiency, equity, and human wellbeing, while also accelerating technological change and efficiency improvements.”
Another 2023 paper in Nature described widespread scientific skepticism, especially in high-income countries, about the existing strain of tech-driven green growth, and also called for exploring “post-growth perspectives, including [growth-neutral] and degrowth strategies, to cultivate a more comprehensive discourse on sustainable development strategies.”
In any case, Lenzen added, “We’re not giving technology the chance to catch up with consumption, and that has been the dynamics over the past decade,” he said, describing a decades-long trend that is now leading researchers to look at alternative economics built on ecological sustainability and social justice.
The new paper doesn’t specifically use the term “degrowth,” but shares common themes, like focusing on human wellbeing and reduction of inequality. That “opens the possibility of talking about alternative sustainability scenarios without being too provocative about it,” said Lorenz Keyßer, a degrowth researcher at the University of Lausanne. That could make it more palatable to a wider audience, he added, including to the community of scientists who build the complex climate models that integrate human behavior with climate physics.
“Compared to their pathway, I think degrowth thinking is more explicit in terms of the proposed changes,” he said. “And it’s more openly ‘radical’ in the sense of being more pessimistic about green growth and decoupling, and in favor of a more transformative approach, which also includes ruptures and conflict.”
But research on degrowth, and similar related concepts like circular economies, or donut economics, is growing, and the European Parliament last year tasked its research service to study “beyond growth” alternatives, including a hard look to determine whether the European Union Green Deal is really sustainable.
Developing country leaders also recently spelled out steps that could have a huge cumulative impact and help protect vulnerable countries from climate impacts.
Speaking at COP28 in the context of global equity in climate financing, Barbados Prime Minister Mia Mottley said a global financial services tax of 0.1 percent could raise $420 billion, and a 5 percent tax on oil and gas profits would raise another $200 billion, while a 1 percent tax on the value of shipping would raise $70 billion.
And there would have to be some new global compact that “allows countries to recognize that they cannot only act in their own deliberate interest, but they have to also act in the interest of the preservation of global public goods,” Mottley said.
“We happen to be talking about climate,” she added. “But we could easily be talking about pandemics and big pharma. We could easily be talking about the digital divide and big tech.”
“Radical Incrementalism”
Oregon State University ecologist William Ripple, co-author of the new paper, said the findings show that their restorative pathway should be included in climate models along with the five “shared socioeconomic pathways,” or SSPs, that are used by the U.N.’s Intergovernmental Panel on Climate Change.
Current emissions trends, societal denial and lack of political will make their scenario a tough sell, but he said its merits can’t be honestly debated if it’s not included as an option for policy makers.
Their findings suggest a path of “radical incrementalism,” with small short-term steps to achieve big changes, like reducing the need to mine for metals or log forests to levels that don’t threaten biodiversity and ecosystem integrity, with per capita GDP stabilizing over time.
Oil and gas infrastructure is seen on the Roan Plateau in far western Colorado. (Courtesy of EcoFlight)
“Ending fossil fuel subsidies and public lands fossil fuel extraction projects would be great first steps for the U.S. and other developed countries, where applicable,” he said. “These actions would be low-hanging fruit and a good start in the process of radical incrementalism.”
Directly phasing out fossil fuel use is also critical, Ripple added. “An important step in this direction would be the adoption of a global coal elimination treaty since the coal industry has extremely harmful impacts on the climate and human health.”
For the paper, the team compiled a 500-year dataset for several key global climate indicators to measure humanity’s consumption of resources over the period.
“The results show a great acceleration of resource use and impacts since about 1850,” he said. “This illustrates that climate change is a symptom of the broader problem of ecological overshoot, the overexploitation of the Earth, which is driving several environmental crises.” The restorative pathway was designed to tackle this underlying issue, he added.
*As our current predicament makes clear, business-as-usual isn’t working and continued economic growth in wealthy countries isn’t sustainable,” Ripple said. “This motivated us to call for a shift toward post-growth economics where quality of life and societal wellbeing are the main priority.”
The key to curbing ecological overshoot means greatly reducing overconsumption and waste, especially by the wealthy, and implementing ecological economics that would focus on social justice rather than continued growth, he said.
One of the global measures they used dating back to 1820 shows the top 10 percent of the world’s wealthiest have consistently received at least 50 percent of all income, illustrating global economic inequality over the long term.
“The magnitude of this inequality,” he said, “provides further evidence that we need a dramatic change. We face multiple serious and interrelated social and environmental crises. We need economic policies that guide humanity toward more equitable resource use patterns.”
Screen shot from episode of “Tom Talks” April 2020.
Click the link to read the editorial on the AZCentral.com website. Here’s an excerpt:
December 29, 2023
The Colorado River Indian Tribes and Gila River Indian Community began irrigating farmlandthousands of years ago using water from the rivers that are now their namesake. Water stewardship is an inextricable part of their community fabric and identity, and its leaders carry a deep obligation to care for what the Creator has provided. The rest of us are relatively new to the water management debate, not the other way around…
Lewis and Colorado River Indian Tribes Chairwoman Amelia Flores have become influential water caretakers in Arizona and across the Colorado River basin. And their leadership comes at a crucial time for us all, as sustained drought and ever-increasing temperatures slash the amount of water flowing through the river on which 40 million people rely. That makes them The Arizona Republic’s 2023 Arizonans of the Year…
Lewis and Flores were born and raised on their reservations — Lewis just south of metro Phoenix and Flores about 150 miles west of the city. Lewis grew up with a front-row seat to history as his father, the late Rod Lewis, fought to secure the community’s water rights after upstream dams had decades earlier dried up many of its farms, leading to one of the nation’s largest water settlements…
Flores, meanwhile, spent nearly three decades as the tribes’ archivist, where elders mentored her on the community’s history and traditions, many of which revolve around water. She was elected the community’s first chairwoman in 2020. Her community holds one of Arizona’s largest and oldest Colorado River water allocations, laying claim to roughly 720,000 acre-feet of first-priority water.
Both have a clear vision for their communities and a relentless drive to achieve it.
Gila River Indian Community (GRIC) Gov. Stephen Roe Lewis advocates early engagement of tribes in the decision-making process. (Source: Water Education Foundation)
Amelia Flores, chairwoman of the Colorado River Indian Tribes. (Source: CRIT)
There was not much loss in reservoir storage in the Colorado River basin in December 2023. Total storage in the basin’s reservoirs only declined by 17,000 acre feet during the month, and the combined contents of Lake Mead and Lake Powell increased by 68,000 acre feet. At year’s end, the basin’s water users have only consumed 21% of the gain in storage caused by the large snowmelt of 2023.
Here are a few graphs depicting where we stand at the start of the new year.
1. The amount of water stored in the basin’s reservoirs remains at an unprecedented low condition. On 31 December 2023, total basin storage was 28.0 million acre feet (af), of which 17.5 million af was in Lake Mead and Lake Powell (Fig. 1). The total amount of water stored in the basin is the same as it was in early May 2021. At that time, storage was less than at any other time in the 21st century, but we drained the reservoirs much more in the summer and fall of 2021 and 2022. The recovery of storage caused by the large runoff in 2023 provided some relief to the ongoing water-supply crisis, but water storage remains critically low.
Figure 1. Graph showing active water storage in 42 reservoirs in different parts of the Colorado River basin. Conditions at the end of December 2023 are comparable to conditions in early May 2021, indicated by the black arrows. Data downloaded at https://www.usbr.gov/
2. Most of the basin’s water storage is in Lake Mead and Lake Powell (Fig. 2). Releases from Lake Powell and reductions in Lower Basin water use were sufficiently large that there was significant recovery of storage in Lake Mead. At the end of December, storage in Lake Mead (9.05 million acre feet) exceeded storage in Lake Powell (8.44 million acre feet) by approximately 600,000 acre feet. The difference in storage between the two reservoirs is much less than during the previous two years when more water was stored in Lake Mead.
Figure 2. Graph showing water storage since January 2021. Note that storage in Lake Mead was significantly greater than in Lake Powell in 2021 and 2022. Large spring runoff in 2023 was captured in Lake Powell, and some of that accumulated inflow was subsequently released to Lake Mead. The rate of reduction in storage in reservoirs upstream from Lake Powell significantly slowed after mid-fall 2023. The category “other Upper Basin reservoirs” includes Strawberry, Granby, McPhee, Dillon, Starvation, Nighthorse, and smaller reservoirs. Water storage in Lake Mohave and Lake Havasu remains nearly constant. Note that the vertical axis is an arithmetic scale that has a break. Data downloaded at https://www.usbr.gov/
3. The rate of loss in reservoir storage this year remains low relative to the rate of loss in previous years (Fig. 3), especially the rate of decline of the combined storage in Lake Mead and Lake Powell. (Fig. 4) The basin’s water managers are doing a good job of reducing use and conserving water in reservoirs. Reclamation’s estimate of probable consumptive water use in the Lower Basin in 2023, issued 31 December 2023, is 5.78 million acre feet, nearly 900,000 acre feet less than Lower Basin consumptive use in 2022. Will that degree of water conservation be enough? That depends on how much snowmelt occurs this spring.
Figure 3. Graph showing the rate of reduction in basin-wide reservoir storage in each of the past ten years. The reduction in storage has been at a much slower rate than in other years. Each year that plots lower than 2023 on this graph reflects a higher rate of loss in storage than this year.
Figure 4. Graph showing the rate of reduction in the combined storage in Lake Mead and Lake Powell in each of the past ten years. The reduction in storage has been slower than in any other recent year. Each year plotting lower than 2023 on this graph reflects a higher rate of loss in storage than in this year.
Acknowledgement: Eric Kuhn and John Fleck provided helpful suggestions that improved this posting.
The new Climate Change in Colorado report combines and synthesizes relevant climate science information to help inform future management of the state’s water resources. Photo credit: Colorado State University
Previous editions of the report in 2008 and 2014 were among the first state-level climate change assessments ever conducted in the U.S. The new report was created by researchers at CSU in the Department of Atmospheric Science within in the Walter Scott, Jr. College of Engineering. Funding and support came from the Colorado Water Conservation Board and Denver Water.
CSU Research Scientist Becky Bolinger served as the lead author for the report and is the assistant state climatologist for Colorado. She said the report describes trends in Colorado’s climate and hydrology, interprets model-based projections for the future, and considers potential hazards stemming from changes in climate. It also verifies projections found in earlier reports and updates them to extend out through 2050 and beyond.
What does the report say about future temperatures in Colorado?
The report notes that temperatures in Colorado have been warmer than average in the last few years and that the models are confident in predicting that trend to continue around the state well into the future. In general, statewide annual average temperatures warmed by 2.3 degrees Fahrenheit from 1980 to 2022 with the greatest amount of warming happening during the fall season.
Bolinger noted that the observed warming trend is strongly linked to the overall human influence on climate and that further and significant warming is expected in all parts of Colorado – in all seasons – over the next several decades.
“Southwestern and south-central Colorado have experienced the largest magnitude of warming and will continue to see hotter temperatures than the rest of the state in the future,” she said. “By 2050 Colorado statewide annual temperatures are projected to warm by 2.5 to 5.0 degrees Fahrenheit compared to the late 20th century and 1 to 4 degrees compared to what we see today.”
CSU Research Scientist Becky Bolinger served as the lead author for the report and is the assistant state climatologist. Credit: Colorado State University Photography
What does the report say about future changes in Colorado’s water resources?
Colorado has seen persistent dry conditions in the 21st century with four of the five driest years in the total 128-year record occurring since 2000, but future trends in precipitation remain uncertain. Despite the uncertainty, the report notes that warmer temperatures will likely reduce water supply. Models predict a 5-30 percent reduction in both stream flow volume and snow-water equivalent – the amount of liquid water that would result if the snowpack were melted down – by 2050 due to future warming.
“Snow-water equivalent during the twenty-first century has already been 3 to 23 percent lower than the 1951-2000 average across Colorado’s major river basins,” Bolinger said. “Future warming will continue that trend and the seasonal peak snowpack date is actually projected to occur earlier in the spring than it does now by 2050. We would need a large overall increase in precipitation to offset the effects of warming there – an outcome that appears unlikely.”
What does the report say about future climate extremes and hazards in Colorado?
For the first time the report deals directly with climate extremes and hazards – noting that warming temperatures have and will continue to increase the frequency and severity of heat waves, drought and wildfires in the state. The report touches on multiple hazard categories but specifically predicts that future warming will lead to an increase in wildfire events with a greater chance for them to occur in the fall, winter and spring months than we are seeing now.
In the last seven days, snowpack gains at the Upper Colorado sites and the South Platte sites were well below normal. Luckily, the pattern looks to be changing as stormier weather is in the forecast.
Westwide SNOTEL basin-filled map January 9, 2024 via the NRCS.
Under skies made hazy by wildfire smoke, flows in the Crystal River near Carbondale dipped to around 8 cfs in 2018. A new report on climate change in Colorado projects more frequent and intense wildfires and reduced streamflows in the future. CREDIT: HEATHER SACKETT/ASPEN JOURNALISM
Scientists predict with high confidence that Colorado’s future spring runoff will come earlier; soil moisture will be lower; heat waves, droughts and wildfires will be more frequent and intense; and a thirstier atmosphere will continue to rob rivers of their flows — changes that are all driven by higher temperatures caused by humans burning fossil fuels.
These findings are according to the third Climate Change in Colorado Assessment report, produced by scientists at the Colorado Climate Center at Colorado State University and released Monday. Commissioned by the Colorado Water Conservation Board, the report’s findings have implications for the state’s water managers. Borrowing a phrase from climate scientist Brad Udall, climate change is water change — which has become a common maxim for those water managers.
The report focuses on 2050 as a planning horizon and projects what conditions will be like at that time. According to the report, by 2050, the statewide annual temperatures are projected to warm by 2.5 to 5.5 degrees Fahrenheit compared with a late-20th-century baseline and 1 to 4 degrees compared with today. Colorado temperatures have already risen by 2.3 degrees since 1980. By 2050, the average year is likely to be as warm as the hottest years on record through 2022.
This warming, which scientists are very confident will come to pass, will drive the other water system changes that Colorado can expect to see. As temperatures rise and streamflows decline, water supply will decrease.
According to the report, by 2050 there will be an annual reduction of 5-30% in streamflow volume; a 5-30% reduction of April 1 snow-water equivalent (a measure of how much water is in the snowpack) and an 8-17% increase in evaporative demand (a measure of how “thirsty” the atmosphere is). A hotter, drier atmosphere can fuel dry soils and wildfire risk. Peak snowpack, which usually occurs in April, is also predicted to shift earlier by a few days to several weeks.
“Streamflows are primarily driven by snowpack that melts in the spring,” said Becky Bolinger, CSU research scientist, assistant state climatologist and lead author of the report. “When you are warming your temperatures, you are first changing the timing of when that snowpack will melt. And because we’re losing more to the atmosphere, that means we have less to run off in our rivers and be available for us later.”
Scientists are less certain about whether precipitation will increase or decrease in the future. Dry conditions have persisted across the state over the past two decades, with four of the five driest years occurring since 2000. Most climate models project an increase in winter precipitation, but they suggest the potential for large decreases in summer precipitation. But even if precipitation stays the same, streamflows will dwindle because of increased temperatures.
This graph shows the projected monthly streamflows for the Colorado River at Dotsero for 2050. A report on climate change in Colorado projects a 5-30% reduction in annual streamflow volume by 2050.
Planning for less water
CWCB officials hope water managers across the state will use the report to help plan for a future with less water. Many entities have already shifted to developing programs that support climate adaptation and resilience.
“I think we can say with confidence that it is more likely that we will have water shortages in the future,” said Emily Adid, CWCB senior climate adaptation specialist. “I think this report is evidence of that and can help local planners and people on the ground plan for those reductions in streamflow.”
Denver Water is one of those water providers that will use the report’s findings in its planning. The utility, which is the oldest and largest in the state, provides water to 1.5 million people and helped to fund the report. Denver Water has been preparing for a future with a less-reliable water supply through conservation and efficiency measures, reservoir expansion projects and wildfire mitigation.
“Projected future streamflows is a huge challenge for the water resources industry,” said Taylor Winchell, Denver Water’s senior planner and climate adaptation specialist. “The same amount of precipitation in the future means less steamflow because temperatures will continue to warm. … All this leads to this concept of uncertainty. We really need to plan for a variety of ways the future can happen essentially.”
Another finding of the report is that temperatures have warmed more in the fall than other seasons, with a 3.1 degrees Fahrenheit increase statewide since 1980, a trend that is expected to continue. Although it’s hard to pinpoint the exact cause of fall warming, Bolinger said it may have to do with the summer monsoons pattern, which can bring moisture with near-daily thunderstorms, but which have been weaker in recent years. That precipitation is critical, she said.
“First, you’re keeping the temperatures from getting too hot because you’re clouding over and getting storms,” Bolinger said. “And generally, with higher humidity, you’re going to have less evaporative loss from the soil. What we’ve been seeing in recent years is that we’re not getting that moisture in the late summer and into the fall.”
Less moisture and higher temperatures in the fall also leads to lower soil moisture and kicks off a vicious cycle of decreased water supplies. The dry soil gets locked in under the winter’s snowpack, and when spring melting begins, the water must first replenish the soils before feeding rivers and streams. This is what occurred in the upper Colorado River basin in 2021 when a near-normal snowpack translated to just 31% of normal runoff and the second-worst inflow ever into Lake Powell.
Some water-use sectors already experience shortages, especially those with junior water rights. Initiatives set up to support the environment and recreation are also at risk with shortages. And those shortages are likely to get worse in the future. In addition to grant programs, one of the ways CWCB aims to help these water users adapt is with a future avoided cost explorer (FACE) tool, which is outlined in the 2023 Water Plan. This modeling tool can help water managers figure out the costs of addressing — or failing to address — hazards such as wildfires, droughts and floods.
According to the report, extreme climate-driven events such as heat waves, droughts and wildfires are expected to be more frequent and intense.
“That gives you a little bit of perspective to say, ‘Well, what if I invest to mitigate this now, how can I lessen the potential impact in the future?,’” said Russ Sands, chief of CWCB’s water supply planning section. “I’m not trying to scare people; what we’re trying to do is motivate change and help them invest early.”
Despite the near-certainty of continued warming and resulting changes to the water system, Bolinger said there is a bright spot. Since the last time that a Climate Change in Colorado report was issued, in 2014, the world has begun to take action on reducing fossil fuel use and has shifted away from the worst-case scenario. Earlier projections were based on a “business as usual” assumption, with no climate mitigation.
“We do have things that have been put into place internationally like the Paris Accord,” Bolinger said. “We are more along the lines of a middle-case scenario. As long as we continue to take the actions that have been planned out, we are going to follow that middle scenario, which does show warming, but it’s not as bad.”
The next coordination meeting for the operation of the Navajo Unit is scheduled for Tuesday, January 16th 2024, at 1:00 pm. This meeting is open to the public and will be held as a hybrid meeting with the following attendance options:
In-person: Farmington Civic Center, 200 West Arrington, in Farmington, New Mexico.
Virtual attendance: For those who wish to remain remote, there is a Teams video option below. This link should open in any smartphone, tablet, or computer browser, and does not require a Microsoft account You will be able to view and hear the presentation as it is presented.
We hope the options provided make it possible for all interested parties to participate as they are able and comfortable. If you are using a virtual option, please try to log on at least 5-10 minutes before the meeting start time. For technical issues, feel free to call the number below.
A copy of the presentation and meeting summary will be distributed to this email list and posted to our website following the meeting. If you are unable to connect to the video meeting, feel free to contact me (information below) following the meeting for any comments or questions.
The meeting agenda will include a review of operations and hydrology since August, current soil and snowpack conditions, a discussion of hydrologic forecasts and planned operations for remainder of this water year, updates on maintenance activities, drought operations, and the Recovery Program on the San Juan River.
If you have any suggestions for the agenda or have questions about the meeting, please call Susan Behery at 970-385-6560, or email sbehery@usbr.gov. Visit the Navajo Dam website at https://www.usbr.gov/uc/water/crsp/cs/nvd.html for operational updates.
Click the link to read the release on the USGS website:
Measuring streamflow is critical for assessing the health and status of river systems. One of the longest continuous records of streamflow is just north of Yellowstone National Park, at Corwin Springs!
Sources/Usage: Public Domain.
Map of SNOTEL snowpack telemetry sites (blue dots) and streamgages (red dots) in and around Yellowstone National Park.
Yellowstone Caldera Chronicles is a weekly column written by scientists and collaborators of the Yellowstone Volcano Observatory. This week’s contribution is from Blaine McCleskey, research chemist with the U.S. Geological Survey.
John Wesley Powell, the second Director of the U.S. Geological Survey (USGS) from 1881 to 1894 and explorer of the Colorado River and Grand Canyon, recognized that water availability was a significant challenge in the western United States. During Powell’s USGS tenure, systematic inventorying of streams and their flows in the USA began in earnest.
In January 1889, the first USGS streamgage was established along the Rio Grande near Embudo, New Mexico. Streamgages typically contain equipment to continuously measure the rate and volume of streamflow. Streamgages in the western USA are particularly challenging to install and maintain because the river stage (or height) and flow can vary greatly between the dry months (late summer-winter) and periods of snowmelt, and in many cases the riverbeds are soft and unstable. The equipment and techniques developed at the Embudo gage site became the foundation of USGS streamgaging methods. Since the establishment of the Embudo gage site, there has been a consistent increase in the number of established gages in the United States.
Currently, the U.S. Geological Survey measures discharge at approximately 8,500 sites across the United States. Most of the streamflow data are delivered in near real-time via the USGS National Water Dashboard(https://dashboard.waterdata.usgs.gov/app/nwd/en/?region=lower48&aoi=default). These flow data are used for planning, forecasting, and warning about floods and droughts; managing water rights and transboundary water issues; operating waterways for power production and navigation; monitoring environmental conditions to protect aquatic habitats; describing impacts to streamflow from changing land and water uses; assessing water quality and regulating pollutant discharges; determining if streams are safe for recreational activities; designing reservoirs, roads, bridges, drinking water and wastewater facilities; and many scientific investigations. Users of these data include water, utility, environmental, and transportation managers. More than 880 million requests for streamflow or water level information were fulfilled during the 2020 water year (which runs from October 1 to September 30 of the following year)!
There are currently 15 streamgages in and around Yellowstone that are used to monitor hydrothermal activityfrom the more than 10,000 thermal features, manage water supplies, and that are used to prepare for and investigate the impacts of floods.
Hydrograph showing discharge in cubic feet per second for Corwin Springs streamgage site on the Yellowstone River, MT, spanning 1889-2023. The spike in 2022 is from the June floods of that year. Sources/Usage: Public Domain.
While the Embudo streamgage site in New Mexico was the first USGS gage site, the gage on the Yellowstone River at Corwin Springs, just north of the national park boundary, is nearly as old! Daily average discharge at the site was first reported on August 1, 1889 and continued through October 31, 1893. Discharge measurements started again in 1910 and continue today. The discharge record at Yellowstone River at Corwin Springs is one of the longest in the United States! The hydrograph, which plots the level of stream flow over time, from the site appears to be saw-toothed, with the peaks generally representing higher flows in the spring as a result of snowmelt.
Sources/Usage: Public Domain.
Plot of specific conductance, discharge, and temperature measured at the Yellowstone River at Corwin Springs, Montana, during early-mid 2023. The anomalous spikes in temperature and specific conductance on May 23, 2023, are thought to be when a large sand and bar was deposited at the site. May 23 is also the peak flow in 2023.
The highest instantaneous discharge measured at the Corwin Springs’ gage was during the June 2022 flood, when the maximum discharge was determined to be 54,700 cubic feet per second (CFS) (1,549 cubic meters per second), compared to a median peak during snowmelt of 12,000 CFS (340 cubic meters per second). The June 2022 flood is estimated to be a 500-year flood event, meaning that an event like this is likely to occur only once in 500 years.
The gage house at Corwin Springs narrowly escaped serious damage from the 2022 flood, as the streambank about 164 feet (50 meters) downstream eroded away. However, the gage did not emerge completely unscathed. During the flood, monitoring equipment was washed away and the streambed changed its shape. In addition, the site continues to see changes to the bank and stream bed after the flood. During the 2023 spring high-flow runoff, a large unconsolidated sand and gravel bar migrated downstream and was deposited on top of the newly installed monitoring equipment at the gage! Approximately 2–3 feet (60–90 centimeters) of debris was deposited along the bank covering the piping that housed scientific monitoring equipment. The new gravel bar was probably deposited at the site on May 23, 2023, which corresponds to the highest flow in 2023, based on anomalous temperature and specific conductance measurements.
Streamgage site and profiling tool on the Yellowstone River at Corwin Springs, Montana. The gage house narrowly avoided damage during the June 2022 flood, which eroded the downstream bank. The river profiling instrument helps to map the river bottom to assess streamflow rates and conditions. USGS photo by Mike Poland, July 31, 2023. Sources/Usage: Public Domain.
Clearly the riverbeds and banks are still unstable as a result of the June 2022 flood! But the Corwin Spring gage keeps on measuring, continuing one of the longest continuous records of stream flow in the United States!
Although recent storms have thrashed the California coastline and boosted reservoir levels, the downpours have so far failed to deposit significant snowpack in the Sierra Nevada, which experts say is in the grips of a severe, early season “snow drought.”
[…]
“In some cases there is literally no measurable snow on the ground at all,” Swain said during a briefing Tuesday. “What this means is that right now, as of today, snowpack is at or below all-time record-low numbers for the beginning of January, and I know that’s pretty alarming.”
[…]
On Tuesday, state officials conducted their first snow survey of the season at Phillips Station, near South Lake Tahoe, where the ground was a patchy mixture of grass and powder. The monthly surveys in winter and spring are key to forecasting how the state’s resources will be allocated each year. Snowpack at the location measured 7.5 inches, with a snow water content of 3 inches, said Sean de Guzman, manager of the California Department of Water Resources’ snow surveys and water supply forecasting unit. That amounts to just 30% of average for the date, and 12% of the average for April 1, when snowpack is typically at its deepest…Electronic readings from 130 stations across California indicate the snow water content statewide is just 2.5 inches, or 25% of average for the date, compared with 185% at the same time last year…
“Snow drought conditions will continue to evolve throughout the winter,” the NIDIS said on its website. “Early in the season, snow drought recovery can happen quickly. Recovery from snow drought in late winter and early spring, when snowpack is typically near peak, can be more difficult.”
Unlike a typical drought, which refers to a total lack of moisture, a snow drought refers to a deficit in the expected amount of snow, Swain said.
As the West pushes toward its ambitious climate goals, the delicate balance between clean energy development and land conservation has become paramount. While WRA and environmental advocates have passed legislation and won commitments that put electric utilities on track to reduce emissions, advance clean cars and trucks, electrify buildings, and decarbonize gas utilities, this requires more clean energy than ever before. To be successful in meeting these goals, we must focus on the next step in this process — where to place clean energy infrastructure through smart energy siting.
As WRA’s energy siting policy advisor, I work at the critical nexus of the climate and biodiversity crises in the Interior West. I bring a unique perspective and experience to this role, too. I joined WRA as a clean energy policy fellow, working with our Clean Energy team to identify federal funding opportunities to advance climate change solutions. Now, as a part of the Western Lands team, I pull from that experience to help craft balanced policy solutions that advance WRA’s clean energy goals while ensuring the build-out of new clean energy projects does not exacerbate habitat loss or place development on important natural and working lands.
Right now, the major focus of my work is on Colorado. Building the clean energy projects necessary to meet the state of Colorado’s ambitious climate goals will require a significant amount of land for wind and solar energy production, the largest driver of new land use change in the coming decades. To meet this need in a manner that does not exacerbate habitat loss and accelerate further loss of biodiversity requires a new approach to development planning.
WRA advocates for a smart energy siting approach that not only looks at the climate benefits of new clean energy projects but also accounts for the carbon impacts of land use change, ensures that conservation values are incorporated in the location and design of a project, and directly benefits host communities.
When done thoughtfully, new clean energy projects can provide the energy we need for a prosperous economy while minimizing the impact of these large projects on wildlife and ecosystems and provide direct economic benefits, from increased tax revenue to good paying jobs, in host communities. A smart energy siting approach assesses all these factors to maximize the benefits of new development and minimize conflicts that can often slow or stall projects.
.GIF credit: Western Resource Advocates.
WRA, as part of the Colorado Energy Siting Coalition, has been working over the last year to develop, advocate for, and implement a siting policy framework that ensures new clean energy projects in the state follow a smart siting approach to meet the states climate and conservation goals. WRA is a founding member and has been helping to coordinate the Coalition’s efforts to understand the perspectives of stakeholders across the state that are driving, or will be impacted by, the clean energy transition. We are also providing policy research and analysis to develop a policy framework that meets Colorado’s diverse needs and considerations.
Given the state’s abundant clean energy resources, ambitious climate goals, and natural heritage, WRA believes Colorado can be a national leader in smart energy siting policy that minimizes conflicts with wildlife and accelerates the clean energy transition to address climate change. And this transition to a clean energy economy will touch all parts of the state.
To better understand the various perspectives across the state, the Coalition held several rounds of stakeholder meetings to understand and address disparate needs. This outreach and engagement process culminated in October with a Clean Energy Siting Summit that brought together over 80 stakeholders from across the state to learn from one another and co-develop policy solutions to promote smart energy siting for Colorado.
Participants included local and state government officials (county commissioners, state legislators, state agency directors and their staff, and the Governor’s policy advisors), renewable energy developers, electric utilities and co-ops, clean energy trade alliances, and environmental justice, conservation, agricultural, and wildlife organizations. This broad group, working altogether and in small groups, assessed policy options focused on:
Balancing state and local authority;
Providing resources to local governments;
Integrating environmental protections;
Facilitating public engagement and establishing and defining community benefits;
Streamlining and expediting the permitting process.
Building on the momentum of the summit and the ideas and perspectives shared, the Coalition is working to synthesize this information and incorporate the various considerations of stakeholders into a policy framework proposal that WRA and the Coalition will advocate for during the 2024 legislative session.
Photo credit: Western Resource Advocates
Photo credit: Western Resource AdvocatesPhoto credit: Western Resource Advocates
The amount of wind and solar energy needed to meet Colorado’s energy needs and reduce greenhouse gas emissions in line with science-based targets will require a significant amount of land. According to recent modeling by the Colorado Energy Office, the state will need to build approximately 12.5 gigawatts of wind and 12.5 gigawatts of solar capacity over the next two decades to meet this goal. If not properly planned for, this will cause irreparable harm to Colorado’s wildlife, natural habitats, and important agricultural lands. The good news is, according to the best available science, we can achieve both our clean energy goals andprotect important natural and working lands.
Accomplishing a just and equitable transition that occurs fast enough to address climate change is no small task. WRA and the Coalition recognize that to meet the moment – and this challenge – will require a thoughtful, smart approach to siting clean energy projects that incorporates conservation and community priorities. To do this we must ensure that all those driving or being impacted by the clean energy transition – including communities that have been previously left out of the decision-making process – are able to shape the transition and that the rights of nature and wildlife are protected.
Addressing the climate and biodiversity crises requires new, thoughtful approaches to meeting our energy needs, reducing emissions, and conserving and protecting the natural landscapes that make Colorado unique. During the upcoming legislative session, WRA will be challenging legislators to institute this critical balance into law.
In February 2020, Dave Herrero drove into the canyon country here in southeastern Utah to visit a slice of land that was up for sale — a 320-acre ranch that stretched deep into the red-rock canyon near the small town of Bluff…In July, his California-based employer, the nonprofit Wildlands Conservancy, purchased the ranch for $2.5 million from the family that owned it and began writing a deed that it hopes will become a model for working with tribes to protect wilderness in the American West from real estate developers, mining companies and oil drillers. In what would be a novel arrangement, the deed is expected to include a coalition of five tribes as co-owners and managers with Wildlands — an effort to acknowledge the history of the land, which the conservation group named Cottonwood Wash.
“There are once tribes that lived in these areas that were forcibly removed,” said Davina Smith, a member of the Diné, or Navajo, who has worked with different organizations to protect land in the Four Corners region. “We have to recognize that.”
[…]
The traditional model of conservation in the West has long followed the lead of environmentalists such as John Muir— the “father of the national parks” — who saw untracked wilderness as a sort of Eden that would fall to corruption under man’s influence. His model of conservation was simple: Keep people out…That school of thought feels foreign to Natives such as [Davina] Smith, 49.
“You have all these prominent writers writing about the West, but they focus on the landscape,” she said. “They don’t think about the Native tribes who have always actually been living in this landscape.”
[…]
In 2015, a coalition of five tribes — Hopi, Navajo, Uintah and Ouray Ute, Ute Mountain Ute and Zuni — sent a letter to then-President Obama proposing the creation of the Bears Ears National Monument in Utah on land known as the Colorado Plateau. Under a novel co-management scheme, the tribes would have direct say in ecological stewardship and how to regulate economic activity and recreation…Less than a year after Obama issued a presidential proclamation creating the monument on Dec. 28, 2016, then-President Trump undid it at the urging of the Utah state government, which wanted to leave the land open to uranium mining, oil drilling and cattle grazing. When President Biden took office in 2021, one of his first acts was reestablishing Bears Ears…The Cottonwood Wash lies within the boundaries of the Bears Ears Monument, but because it’s private property, it wasn’t included as part of the monument. That gave Wildlands a playbook. In 2022, its leaders approached the Bears Ears Inter-Tribal Coalition, the official alliance of the five tribes, to say they were considering buying the Cottonwood Wash and were interested in joint ownership and management. As part of their push, Herrero and Haney drove to four reservations to meet with tribal leaders. Some were suspicious at first. Anthony Sanchez, the head councilman for the Pueblo of Zuni, explained that non-Native groups will sometimes use supposed ties to tribes to boost their own PR.
Fort Collins had a very dry and warm December 2023
The city received no measurable snowfall in December, which is the first time that happened since 2002. Before 2002, it happened only three other times, the last of which was in 1935.
The city received 0.14 inches of precipitation, which fell as rain. It was the driest December since 2018.
The average temperature was 37.3 degrees, which was the warmest for December since 1980.
December reached above 60 degrees five times, including the high of 65 degrees on Dec. 6 and the last balmy day of 62 degrees on Dec. 21.
It never got colder than 15 degrees. That happened on Christmas night and was the highest minimum temperature for the month since the beginning of city weather record-keeping in 1889. Compare that to December 2022, when we dropped to minus 17 degrees, the coldest temperature recorded of any month since the 1990s.
Despite a dry December, 2023 was a wet one for Fort Collins
2023 was the fourth-wettest year on record, ending with 24.36 inches of precipitation, which was 153% of our 1991-2020 normal of 15.88 inches.
The last wetter year was in 1997, the year of the Spring Creek Flood, when we received 25.23 inches.
The city’s record for precipitation in a calendar year is 28.28 inches in 1961.
Following the U.S. Supreme Court’s decision narrowing the reach of the Clean Water Act, states including Colorado must now pick up the slack to protect water the federal government no longer will.
The new definition of “waters of the United States,” or WOTUS, excludes a large number of wetlands that now require state regulation if they are to be protected. Brett Hartl, government affairs director at the Center for Biological Diversity, said the clear impact of the 2023 Sackett v. Environmental Protection Agency case is that many small streams and wetlands are no longer protected by the Clean Water Act.
Hartl said the sooner Colorado acts to create regulations around wetlands the better, because right now it would be legal if someone wanted to dredge and fill a wetland for development. He said the state should start by simply looking at what used to be protected by the Clean Water Act and create a similar regulation system where people need to apply for a permit and mitigate damage.
Millions of acres of wetlands recently lost federal protection under the Clean Water Act after a U.S. Supreme Court ruling. Some states are attempting to fill the void, but permitting programs — and the staff needed to enforce them — have proven costly. Flickr/USDA NRCS TX
“My guess is that the state has a fairly good idea of what areas within the state face the most development pressure at any given time — a wetland high up in the mountains inside a park or wilderness area or state forest or whatever is probably not at as great a threat as something maybe on the outskirts of Boulder or Denver where there’s intense pressure to develop,” Hartl said.
Katherine Jones, a spokesperson for Colorado Gov. Jared Polis, said up to 50% of state waters are at risk of no longer being protected by the Clean Water Act following the Sackett decision. Colorado’s Department of Public Health and Environment’s Water Quality Control Division said the Sackett ruling “will likely result in all ephemeral and many intermittent waters, which constitute the majority of Colorado’s stream miles, being outside the scope of federal Clean Water Act jurisdiction.”
Polis’ proposed 2024 budget included “a placeholder of $600,000” to serve as an initial investment toward a clean water program, Jones said. CDPHE requested supplemental funding from the Colorado Legislature so it can prepare for development of a program to protect vulnerable waters and has engaged with interested stakeholders since the Trump administration’s efforts to change the Clean Water Act in 2020.
“One of Governor Polis’ top priorities is protecting Colorado’s environment and our precious, clean water resources for the health and safety of Coloradans, as well as industries like agriculture and recreation,” Jones said in a statement.
As the state gets started, Hartl said it could quickly establish an interim standard to maintain the status quo and to prevent anyone from “cynically taking advantage of the situation” as it takes the time to determine the best course of action.
‘Enforcement actions’
The Water Quality Control Division approved an enforcement policy in July so the state can track unpermitted discharges of dredge and fill material into state waters. The new policy encourages entities to notify the state when they plan to dredge and fill in state waters, and it also leaves room for unspecified “enforcement actions” in cases when an entity pursues dredge and fill activity in waters that would have been protected before the Sackett ruling. It does not apply to larger projects that would require significant mitigation and previously would have required a federal 404 permit.
Kelly Hunter Foster, senior attorney for Waterkeeper Alliance, said it’s good how quickly CDPHE took action after the Sackett decision, but that action is not a long-term solution. Creating a permanent system can be complex, she said, as the state must develop a permitting system, standards and mitigation requirements.
“There is a need to figure out what can be added to existing regulations and what statutory changes are necessary in order for the state to step in,” Foster said. “In particular, a permitting program will have to be set up for dredging and filling of wetlands and other waters that lost federal protections, and I think that the state agency needs additional resources to fill the major hole in clean water protections that was left as a result of the Sackett decision.”
Colorado Parks and Wildlife has a Wetland Wildlife Conservation Program that offers funding for projects that will protect wetland habitats, with over $1.1 million available. Joey Livingston, spokesperson for Parks and Wildlife, said the program has been around since 1997.
“The level of federal protection for wetlands has fluctuated over the years, so the importance of voluntary, incentive-based wetland conservation programs (like ours) is highlighted during times like these,” Livingston said of the Sackett decision.
Hartl said the loss of any one wetland won’t have drastic consequences, but more cumulative impacts arise as more and more wetlands are destroyed. In particular, he said wetlands help with flood mitigation as they soak up excess water, and floods have continuously gotten worse the more wetlands are lost. Hartl said it’s well documented how the U.S. has seen evidence of this with wetlands being dredged and filled since colonization, and “the court just ignored it.”
“Wetlands store pollution, they address flooding and runoff, they are very much part of what helps maintain clean water and drinking water as well as healthy ecosystems that support wildlife,” Hartl said. “If you get rid of all of those natural functioning systems and you pour concrete over them, when rain happens and when there is a wet year or floods, this is why oftentimes floods get worse, because we’ve eliminated all the natural ability to slow those floods.”
Healthy mountain meadows and wetlands are characteristic of healthy headwater systems and provide a variety of ecosystem services, or benefits that humans, wildlife, rivers and surrounding ecosystems rely on. The complex of wetlands and connected floodplains found in intact headwater systems can slow runoff and attenuate flood flows, creating better downstream conditions, trapping sediment to improve downstream water quality, and allowing groundwater recharge. These systems can also serve as a fire break and refuge during wildfire, can sequester carbon in the floodplain, and provide essential habitat for wildlife. Graphic by Restoration Design Group, courtesy of American Rivers
There is an ongoing debate in the Pacific Northwest around whether hydropower as a whole is “good” or “bad”. But this conversation misses important details and nuance.
There are thousands of dams blocking rivers across the Northwest. Many dams provide energy, transportation, flood control, and irrigation. But many are causing more harm than good – and they are falling apart. As a society, we are making choices about the costs and benefits of dams: Which ones can be operated in a more environmentally friendly and economically viable way? And which dams need to be removed?
Dams harm rivers. They can destroy fish and wildlife habitat, degrade water quality, and turn free-flowing rivers into slow moving reservoirs that emit methane, a potent greenhouse gas that causes climate change. Dams in the Pacific Northwest have been a main cause of salmon extinction and a source of painful injustice for the region’s Tribal Nations.
American Rivers has always taken a pragmatic, solutions-oriented approach to dams and hydropower. While we lead the movement to remove outdated dams, we are also a founding member of the Hydropower Reform Coalition, working to improve the operations of dams whose continued operation is important for our energy supply and economy. For the past several years, we’ve also been working with the hydropower industry in the “Uncommon Dialogue on Hydropower, River Restoration, and Public Safety” – finding common ground on plans to retrofit and rehabilitate dams that still serve an important purpose and remove dams that pose a safety risk.
Simply put: American Rivers is ensuring our nation prioritizes healthy rivers, whether that’s by making hydro dams more river- and fish-friendly, maximizing the performance and efficiency of dams, and removing dams whose costs outweigh their benefits.
So, what does this look like in the Pacific Northwest where 50 percent of our annual energy generation comes from hydro? Major dams, including those on the Columbia River, helped build our world-class economy and will continue to support our vibrant region. But we must take a hard look at dams that are causing far more harm than good.
The lower four Snake River dams, which stretch between Tri-Cities, WA and Lewiston, ID, were constructed between 1957 and 1972. These dams provide around 900 average megawatts of power — around 4% of the Northwest’s energy generation. They also provide irrigation for crops grown around the Tri-Cities, as well as transportation for barge traffic between the Tri-Cities and Lewiston. While the services the lower four Snake River dams provide are valuable to surrounding communities, those services can be replaced with alternative technologies. Breaching the earthen portion of the dams is the best solution we have to solve the significant impacts the dams are having on salmon, steelhead, killer whales, Tribal Nations, and economies that rely on these species.
Unlike the mainstem Columbia dams, the lower four Snake River dams are “run of the river” projects that do not provide flood control and store relatively little water in the reservoirs behind each dam. In summer months, those reservoirs bake in the hot sun, raising water temperatures and creating harmful conditions for cold water-dependent salmon and steelhead. In 2015, warm water in the lower Snake was responsible for killing over 95% of the year’s adult sockeye salmon run. Impacts on juvenile salmon are harder to measure, but conservative estimates are that upwards of 50% of juvenile salmon die between Lower Granite Dam on the Snake and Bonneville Dam on the Columbia during their journey to the ocean, and that figure is likely much greater in years when water temperatures rise above 70 degrees.
As we mentioned before, the lower four Snake River dams combined produce an average of around 900 megawatts. Compare that with John Day Dam on the mainstem Columbia 50 miles east of Hood River, which by itself produces around 1,200 average megawatts, and you begin to see why these four dams are the target of so much attention. Four times the negative impacts from dams and their harmful slackwater reservoirs, for less power than John Day Dam alone just doesn’t make sense as we envision a new clean energy future.
Granite Dam on the Snake River | Photo: Army Corps of Engineers
Finally, no form of energy can be considered clean if it leads to the extirpation of as many species as the lower four Snake River dams continue to cause, particularly when you consider the value those species have for Tribal Nations that have lived in the Columbia Basin since time immemorial. The American Fisheries Society, the National Oceanic and Atmospheric Administration, Trout Unlimited, and many other science-based organizations all recognize that breaching the lower four Snake River dams must be the centerpiece action for restoring salmon populations in the Columbia Basin.
Tribal Nations across the Northwest are leading this initiative to breach the lower four Snake River dams because of these negative impacts. The largest impact being to the salmon populations; their dwindling numbers directly impact the culture and traditions of tribal members and their future generations. In addition, with the harm placed on salmon by these dams, treaties made between the U.S. Government and the Tribes are being violated. We have a moral and ethical obligation to uphold our treaty promises and to save Snake Basin salmon and steelhead from extinction.
As we work to develop a bold new clean energy future for the Pacific Northwest, hydropower will continue to be an important part of our generation portfolio. When measured on the whole, it becomes clear that the lower four Snake River dams cannot be a part of that vision. We must build a system that is reliable, resilient, and equitable. We must continue working together to achieve a future of healthy rivers, abundant salmon, and affordable, reliable clean energy.
Map of the Snake River watershed, USA. Intended to replace older File:SnakeRiverNicerMap.jpg. Created using public domain USGS National Map data. By Shannon1 – Own work, CC BY-SA 4.0, https://commons.wikimedia.org/w/index.php?curid=62294242
Negotiators are seeking an agreement that would prepare for extraordinary cuts in the amount of river water that can be tapped.
“New plot using the nClimGrid data, which is a better source than PRISM for long-term trends. Of course, the combined reservoir contents increase from last year, but the increase is less than 2011 and looks puny compared to the ‘hole’ in the reservoirs. The blue Loess lines subtly change. Last year those lines ended pointing downwards. This year they end flat-ish. 2023 temps were still above the 20th century average, although close. Another interesting aspect is that the 20C Mean and 21C Mean lines on the individual plots really don’t change much. Finally, the 2023 Natural Flows are almost exactly equal to 2019. (17.678 maf vs 17.672 maf). For all the hoopla about how this was record-setting year, the fact is that this year was significantly less than 2011 (20.159 maf) and no different than 2019” — Brad Udall
“How do we live with the river that we have, not the river that we hope and dream for?” said Becky Mitchell, the lead negotiator for the state of Colorado…
The rules that govern the distribution of Colorado River water expire at the end of 2026. Negotiators are trying to reach a deal quickly, in case the White House changes hands. It’s not the prospect of a Republican administration that is particularly concerning, negotiators said, but rather a change in personnel and the time required to build new relationships between state and federal officials…
“Whenever there’s an administration change, that significantly disrupts things,” said JB Hamby, chairman of the Colorado River Board of California and that state’s lead negotiator. “If we can get a draft ready and in place by the end of the year, that will ensure that we get the hard work done.”
From left, J.B. Hamby, chair of the Colorado River Board of California, Tom Buschatzke, Arizona Department of Water Resources; Becky Mitchell, Colorado representative to the Upper Colorado River Commission. Hamby and Buschatzke acknowledged during this panel at the Colorado River Water Users Association annual conference that the lower basin must own the structural deficit, something the upper basin has been pushing for for years. CREDIT: TOM YULSMAN/WATER DESK, UNIVERSITY OF COLORADO, BOULDER
The San Juan National Forest installed a new breakwater near the boat ramp at McPhee Reservoir to protect those using the ramp from dangerous waves. (Courtesy of the San Juan National Forest)
The structure installed to prevent waves from interfering with operations at the boat ramp consisted of roughly 200 oversize tires strung together with cables. The remnants of a previous breakwater – also a pile of car tires – lay stuck in the lake bed, exposed by dropping water levels. But after years of waiting, the trash was removed and an 800-foot shiny new wave attenuator was installed in 2023, thanks to a federal grant and the work of the San Juan National Forest, which manages recreation at the site.
The new breakwater near the boat ramp at McPhee Reservoir cost nearly $600,000 by the time the work and removal of the previous system was completed. (Courtesy of the San Juan National Forest)
The new breakwater, like the one at Lake Nighthorse, is a Wave Eater system composed of floating cylindrical drums that cause surface waves to break and dissipate. The total cost of the installation and removal of trash exceeded $600,000. In 2015, Montezuma County spent over $150,000 of a Colorado Parks and Wildlife grant to build a new breakwater. But the design was lacking, said Tom Rice, recreation staff officer of the Dolores Ranger District…The new breakwater is made of durable yellow and orange polypropylene drums, which, when combined with new, lighted no wake buoys, greatly improve visibility in all weather conditions, day or night, a SJNF spokeswoman said in an email.
Guided by resident input, the award-winning 39th Avenue Greenway project at the edge of Denver’s RiverNorth neighborhood is an example of One Water in action. The project restored a discontinued rail corridor to improve the aesthetic, create an accessible recreational amenity, and provide stormwater conveyance and filtration as well as 100-year flood protection for the area. (Blake Gordon, Courtesy DHM Design)
Chemically, the water that nature creates is always H2O, regardless of whether it’s suspended in clouds, falling as droplets of rain, or coursing across the land in streams. It’s all one water that cycles through earth and atmosphere. People, however, tend to form water teams that focus on singular aspects of water’s role in our environment and communities.
Some managers oversee dams and reservoirs, while others treat water for drinking. Stormwater, flood control, distribution and piping, wastewater, watersheds and the environment, agricultural ditches and canals—all of these water sectors developed as specialties that don’t, necessarily, join forces or even communicate about overlapping projects and goals. That’s largely because each specialty has had to negotiate separate regulations and policies dictating the how’s and why’s of their water niche. Over time, siloes developed that hindered communities’ and water managers’ ability to take a holistic approach to water use and planning.
But by the early 2000s, a number of water professionals across the globe started to envision a new paradigm. “What if these systems could be collaborating and together break down the divides?” asks Scott Berry, director of policy and government affairs for the US Water Alliance, established in 2008 to facilitate communication and development of what have been coined “One Water” principles. The One Water movement was initiated with a utility-centric focus that sought to create dialogue between stormwater, wastewater and drinking water divisions. But the notion of One Water has since evolved to include a broader, more diverse tapestry of stakeholders, says Berry.
The goals of One Water often vary by site, but in most places, One Water initiatives link water and land planning. Whereas integrated water resource plans usually focus on water alone, a One Water ethic recognizes water’s integration with broader landscapes. Communities can then put that ethic into action by developing a formal One Water plan, which aims to have all of a watershed’s major players at the table in order to craft more sustainable water systems. This means that local governments; private businesses; developers; farmers and agricultural industries; transit authorities; nonprofit organizations; drinking water, wastewater, stormwater, flood and watershed managers; land use planners; environmentalists; and others can all collaborate to share needs and solutions that help finite water resources go farther and achieve multiple benefits for communities and environments.
This country’s largest cities have led the movement to attempt One Water frameworks, with Los Angeles creating its influential One Water plan in 2018. Other cities, such as New York, Seattle, Honolulu and Denver have followed. And now, surveys conducted by the US Water Alliance indicate that about 80 communities across the country are currently pursuing One Water plan development. Most, including Denver, are managing the interrelated aspects of their water systems in a more collaborative way to improve resiliency in the face of climate change and to stretch water resources to serve growing human populations.
“Collaboration can be unwieldy,” acknowledges Berry. But it can also avoid costly and wasteful inefficiencies in spending, and it may even help tackle social injustice. “One Water approaches can address the ways that different neighborhoods have historically received different treatment, and can propose durable solutions that are integrated and equitable,” says Berry.
It’s up to each community to identify a set of objectives that address local priorities: One city might emphasize stormwater reuse, while another might elevate water quality higher on its list.
Sunrise Denver skyline from Sloan’s Lake September 2, 2022.
Colorado Plans and Visions
In September 2021, Denver became the first Colorado entity to pursue integrated One Water strategies through the publication of its One Water plan.
Denver collaborators include those involved in water and land use on many levels: the city’s water and wastewater providers, urban drainage and flood control, various representatives from different departments within the city and county governments, the state, and those who are looking out for the river itself. And they prioritized action items that include promoting water reuse, encouraging overlap between land use and water planning, and developing water policies that support sustainable practices.
Work implementing Denver’s plan is just getting off the ground with monthly meetings among the plan’s collaborators who share ideas, outreach opportunities, and areas where their work overlaps.
For example, the 39th Avenue Greenway project in the Cole and Clayton neighborhoods of north Denver predates the city’s One Water plan (it was completed in 2020) but exemplifies the kind of multi-benefit project that the plan will prioritize. Flood control was the development’s marquee goal, but the design also installed pollutant-filtering green spaces to improve environmental health and playgrounds for families that had historically been underserved by city parks and recreational facilities.
Of course, One Water approaches don’t have to be all-encompassing, as Denver’s is. “You don’t have to do everything, everywhere, all at once,” explains Berry.
Colorado’s leaders are calling for sweeping visions at the state level but not necessarily looking to blanket the state with full-on One Water plans. In the 2023 update to the Colorado Water Plan, the authors urge communities across the state to follow in Denver’s footsteps by including water in “every city and county’s comprehensive plan in ways that embrace the One Water ethic and support inclusion in water and land use planning at the local level.”
“The local level is where the important planning decisions are made for a more sustainable and water-conscious future,” says Kevin Reidy, senior state water efficiency specialist for the Colorado Water Conservation Board (CWCB), the agency that led the development and update to the state water plan and supports water plan goals with project funding and direction. The new 2023 water plan specifically calls out the “One Water ethic” for all communities across the state – going beyond a goal in the initial 2015 Colorado Water Plan, which said that 75% of Coloradans would live in communities that had incorporated water-saving actions into land use planning. The state hasn’t yet conducted a formal survey to measure communities’ progress.
“With more One Water planning happening there can be a growing awareness, cataloging of best practices and tools that make adoption easier as well as documenting case studies that can help achieve a larger vision,” says Reidy. “Ultimately, that vision is strongest when it can integrate water conservation, land use and community values around water.”
One community that’s begun to yoke synergies is Fort Collins.
This northern Colorado city is unusual in that, in contrast to how things work in Denver, it owns and operates all three traditional water utilities: drinking water, stormwater and wastewater. But each had become siloed, to the point that various arms of the system often competed for funding and purpose. Two years ago, the city hired a consultant to conduct an assessment of the water system, and the resulting recommendation was to align the utilities under a One Water framework.
Jason Graham was hired a year and a half ago to oversee the transformation, and although his job title, executive director of water, doesn’t reference One Water, that movement nevertheless guides his efforts with Fort Collins’ water services at the management level and regionally. That means achieving more overlap between planning, engineering and operations—sectors that had been working in a vacuum, without awareness of what one another was doing. It also requires a landscape-level view of Fort Collins’ water system, upstream to downstream. “The goal is to develop One Water from Cameron Pass through Fort Collins to the South Platte,” says Graham.
The effort is still in its early stages. The leadership team and group structures are established, and now, those teams are about to start defining the city’s strategic principles and priorities for integration. “Given what we have planned, we’re leading the One Water movement certainly within Colorado, and we’re one of the national leaders that people haven’t yet heard about,” says Graham.
The potential overlaps extend far beyond the utilities, to include businesses, developers, neighborhoods, parks, golf courses, citizens, elected leaders and their equivalents in the adjacent county. “Promoting that engagement is a big part of One Water, because that’s what creates a balanced approach to addressing water issues,” says Graham, who has already begun dialogues with area agricultural providers and neighboring water providers.
Surrounding Fort Collins’ urban boundary is an area served by about 20 different water utilities that respond independently to their communities’ widely varying attitudes toward growth—and Graham plans to have conversations in order to explore potential collaborations with all of them.
“Whether our development code and our policies on xeriscaping can be supported by those other water providers, that’s very tricky,” Graham explains. Some citizens support growth while others oppose it—and that struggle links in topics such as affordable housing and social equity, Graham notes, because if you stifle housing creation in a locale that already experiences rising property values, you price out lower-income residents. So while limiting growth may look good from a water-use standpoint, it can also heighten social inequities.
“It can be daunting,” Graham acknowledges. He doesn’t yet know what the limits will be for local collaboration, or how big is too big when it comes to the number of stakeholders involved. “But regardless of whether we can leverage all that, there is a need to have these conversations,” he concludes. And the future benefits of pursuing integration seem worth the present uncertainty, whether surrounding communities work with Fort Collins or not.
He also expects to enjoy cost savings for rate-payers once formerly separate budgets and projects are aligned. “One area would conduct a study that no one else knew about, but now, that one study can do more by serving all buckets,” he explains.
Integration also promises to make Fort Collins more resilient in the face of regional water pressures. “Looking at the Colorado River Compact and the future of northern Colorado, we want to be strategic about the resources that we have,” Graham says. The time for inefficiency has passed. Says Graham, “The community is ready for this conversation to happen. We’re the stewards of this conversation and the protection of this resource.”
Roadmaps for Future One Water Communities
On the campus of Colorado State University, just a few miles from Jason Graham’s office, Mazdak Arabi, PhD, is putting the final touches on a report that’s likely to help many communities across the country understand and embark on One Water integration. The research was performed at Arabi’s One Water Solutions Institute, established within CSU to develop science-driven, evidence-based pathways to water integration. Marrying pure science with practical application is “extremely rewarding for me and the other folks in the One Water Solutions Institute,” says Arabi.
Dr. Mazdak Arabi Photo credit: Colorado State University
The report cites a ladder that they can climb to approach One Water ideals. “It’s a self-assessment framework, not a competitive comparison,” Arabi emphasizes. But, like similar rubrics used by Leadership for Energy and Environmental Design (LEED) to recognize sustainable construction, the forthcoming self-assessment describes three levels of One Water involvement: Onboarding, Progressing and Advancing. Each level describes specific actions that municipalities can follow to identify where they’re at and how to progress.
There is no ultimate state of One Water perfection. Even the most accomplished “level three” municipalities, those who have made the most One Water advances, will continue to self-monitor and engage their communities in pursuit of ongoing innovation. That quest promises dividends for entire communities, says Arabi.
“At the core of our research, we’re looking at ways to make a community more livable, more resilient to changes in population or climate or other pressures,” Arabi explains.
Fresh Water News is an independent, nonpartisan news initiative of Water Education Colorado. WEco is funded by multiple donors. Our editorial policy and donor list can be viewed at wateredco.org.
Also on the agenda for Will, Velasco, and other Western Colorado lawmakers is water issues. Earlier this month, the lawmakers both attended the announcement of the Colorado River District’s purchase of the Shoshone water right at the Hotel Colorado in Glenwood Springs…
“Purchase of the Shoshone water rights keeps water in the river. That’s good for fish, that’s good for recreation, that’s good for agriculture, that’s good for West Slope Colorado,” Will said.
The River District will pay nearly $100 million for the water right, and is fundraising now to be able to complete the purchase. Velasco and Will were both confident the assembly would be able to help with the funding to see the deal to the finish line.
Westwide Snow Water Equivalent percent NRCS 1991-2020 Median January 6, 2024.
Click the link to read the article on the KUNC website (Alex Hager). Here’s an excerpt:
January 2, 2024
Across the West, the winter is off to a dry start. Wide swaths of the Rocky Mountains have lower-than-average snow totals for this time of year, but scientists say there’s still plenty of time to end the “snow drought” and close the gap. High-altitude snowpack has big implications for the region’s water supply. Two-thirds of the Colorado River’s water starts as snow in Colorado’s mountains before melting and flowing to about 40 million people across seven states. Nearly every part of Colorado, Utah and Wyoming has significantly less snow than usual for late December. The latest data from a region-wide network of snow sensors shows snow in many areas with snow totals around 60 or 70% of normal.
“It’s really going to be dependent on what we see in January and February,” said Becky Bolinger, Colorado’s assistant state climatologist. “We’re really going to need an active January and February to make up these deficits and be okay.”
“New plot using the nClimGrid data, which is a better source than PRISM for long-term trends. Of course, the combined reservoir contents increase from last year, but the increase is less than 2011 and looks puny compared to the ‘hole’ in the reservoirs. The blue Loess lines subtly change. Last year those lines ended pointing downwards. This year they end flat-ish. 2023 temps were still above the 20th century average, although close. Another interesting aspect is that the 20C Mean and 21C Mean lines on the individual plots really don’t change much. Finally, the 2023 Natural Flows are almost exactly equal to 2019. (17.678 maf vs 17.672 maf). For all the hoopla about how this was record-setting year, the fact is that this year was significantly less than 2011 (20.159 maf) and no different than 2019” — Brad Udall
Even a few consecutive wet winters aren’t enough to seriously fix the supply-demand imbalance that fuels the West’s water crisis. More than 20 years of dry conditions, fueled by climate change, have shrunk the Colorado River’s water supply, and policymakers have been unable to agree on significant, long-term cutbacks to water use. Experts say it would take five or six consecutive above-average winters to close that supply-demand gap, which is unlikely to happen as climate change makes the region warmer and drier. Dan McEvoy, regional climatologist at the Western Regional Climate Center and Desert Research Institute, said last year’s wet winter was an “anomaly.”
“Lots of data, lots of research, projections, modeling, all point to this continuing trend of warmer winters, less snow and in some cases, less precipitation,” he said.
U.S. winter (Dec-Feb) precipitation compared to the 1981-2010 average for the past 7 strong El Niño events. Details differ, but most show wetter-than-average conditions across some part of the South. NOAA Climate.gov image, based on data from NOAA Physical Science Lab online tool.
From the wettest three-month period along the Front Range to the state’s largest hailstone, 2023 was a year of climate extremes for Colorado — and the world. After three years of cool waters, the currents in the Pacific Ocean flipped to an El Niño cycle — an ocean climate pattern that can have a profound effect on landlocked, mountainous Colorado. Typically, a strong El Niño pattern increases the likelihood of increased snow across much of the state, said state climatologist Russ Schumacher. So far this winter, however, the state has received less snow than is typical for this time of year — a stark contrast to last winter, during which heavy snowfall and a wet spring refilled reservoirs and waterways, kicked off the growing season and tamped down on wildfires.
Historically, both the El Niño warming pattern and the related cooling pattern known as La Niña mean more predictable weather patterns for Colorado. With global temperatures soaring — 2023 was the world’s warmest ever recorded — Schumacher that predictability might not hold true for 2024 and beyond…While it has become increasingly more difficult to predict seasonal climate patterns, Schumacher said extreme weather events — from hailstorms and tornadoes to wildfires — are becoming the new [normal] for Colorado.
They find it was the warmest year on record by a large margin, at 1.48C above preindustrial levels, higher than the 1.43C that JRA-55 reported earlier this week
From left, J.B. Hamby, chair of the Colorado River Board of California, Tom Buschatzke, Arizona Department of Water Resources; Becky Mitchell, Colorado representative to the Upper Colorado River Commission. Hamby and Buschatzke acknowledged during this panel at the Colorado River Water Users Association annual conference that the lower basin must own the structural deficit, something the upper basin has been pushing for for years. CREDIT: TOM YULSMAN/WATER DESK, UNIVERSITY OF COLORADO, BOULDER
Click the link to read the article on the AZCentral.com website (Brandon Loomis). Here’s an excerpt:
December 14, 2023
The seven states that share the Colorado River’s water celebrated some conservation wins at their annual meeting here this week but quickly began sparring over who will bear the brunt of future pain that they agree a drying climate will dole out. Talk of cutbacks has long focused on the three states collectively known as the Lower Basin — Arizona, California and Nevada — and on Wednesday, representatives of California water districts and tribes signed federally funded deals to leave more water in the river’s largest reservoir over the next two years. On Thursday, interstate rivalries re-emerged as officials from the Upper Basin made clear they expect the Lower Basin to cut back much further before coming after their water. Farmers and other users in the headwaters states of Wyoming, Utah, Colorado and New Mexico already go without in dry years because they don’t have a giant storage pool like the Southwest’s Lake Mead to augment nature…
September 21, 1923, 9:00 a.m. — Colorado River at Lees Ferry. From right bank on line with Klohr’s house and gage house. Old “Dugway” or inclined gage shows to left of gage house. Gage height 11.05′, discharge 27,000 cfs. Lens 16, time =1/25, camera supported. Photo by G.C. Stevens of the USGS.
Source: 1921-1937 Surface Water Records File, Colorado R. @ Lees Ferry, Laguna Niguel Federal Records Center, Accession No. 57-78-0006, Box 2 of 2 , Location No. MB053635.
The upper and lower basins split just downstream of Lake Powell’s Glen Canyon Dam, at Lees Ferry in Arizona, though Lake Powell’s storage is primarily used to ensure the Upper Basin has enough water to fulfill its yearly obligations to the Lower Basin. The Upper Basin states use roughly half as much, and less in years when mountain streams dry up, and concerns over that disparity surfaced Thursday.
“We can’t accept something that continues to drain the system, that puts 40 million people at risk,” Colorado’s river commissioner, Becky Mitchell, told her interstate colleagues at the annual Colorado River Water Users Association conference…
“The one person that you cannot negotiate with is Mother Nature. She will win every time. She’s been telling us what to do,” Mitchell said. “I want an agreement that lessens the pain for all of us, not just some of us.”
“New plot using the nClimGrid data, which is a better source than PRISM for long-term trends. Of course, the combined reservoir contents increase from last year, but the increase is less than 2011 and looks puny compared to the ‘hole’ in the reservoirs. The blue Loess lines subtly change. Last year those lines ended pointing downwards. This year they end flat-ish. 2023 temps were still above the 20th century average, although close. Another interesting aspect is that the 20C Mean and 21C Mean lines on the individual plots really don’t change much. Finally, the 2023 Natural Flows are almost exactly equal to 2019. (17.678 maf vs 17.672 maf). For all the hoopla about how this was record-setting year, the fact is that this year was significantly less than 2011 (20.159 maf) and no different than 2019” — Brad Udall
Click the link to read the article on the NOAA website:
January 5, 2024
NOAA and its partners have released the latest Regional Climate Impacts and Outlooks, which recap fall conditions and provide insight into what might be expected this winter.
Fall Temperature Recap
The meteorological autumn (September–November) average temperature for the contiguous U.S. was 56.1°F, 2.5°F above average, ranking sixth warmest on record.
Temperatures were above average across most of the contiguous U.S., with record-warm temperatures observed in parts of New Mexico, western Texas and northern Maine. New Mexico and Texas each ranked third warmest on record, while Maine ranked fourth warmest for this autumn season. An additional 10 states ranked among their top-10 warmest on record for this period. The Alaska autumn temperature was 29.6°F, 3.7°F above the long-term average, ranking 13th warmest on record for the state. Temperatures were above average across most of the state of Alaska while some parts of south-central Alaska saw near-average autumn temperatures.
Fall Precipitation Recap
The contiguous U.S. autumn precipitation total was 5.66 inches, 1.22 inches below average, ranking 15th driest in the September–November record.
Precipitation was below average across much of the eastern half of the U.S., the Southwest, California, and in parts of the Northwest and central Plains. Tennessee ranked third driest on record with three additional states in the Mississippi and Ohio Valleys ranking among their top-10 driest autumn seasons on record.
Autumn precipitation was above average from the northern Rockies to the western Great Lakes and in parts of the Great Basin, southern Plains, Northeast and Southeast. No state ranked among their top-10 wettest autumn seasons on record. For autumn season precipitation, Alaska ranked in the wettest third of the record with wetter-than-average conditions observed across much of the state. Near-normal precipitation was observed in parts of the Interior and south Central Alaska, while below-normal precipitation occurred in parts of the Southwest and Aleutians during this season.
Winter Temperature Outlook
The January–March 2024 Temperature Outlook favors above-normal temperatures for Alaska, the west coast of the contiguous United States (CONUS), the Northern Plains, the Ohio and Tennessee Valley regions, and the Mid-Atlantic. Above-normal temperatures are more likely for western Alaska, parts of the west coast, and New England. Near normal temperatures are favored for the Central and Southern Rockies, and parts of the Central and Southern Plains.
Winter Precipitation Outlook
The January–March 2024 Precipitation Outlook depicts below-normal precipitation over southwestern Alaska and above-normal precipitation over northern Alaska. Below normal precipitation is favored from the Northern Rockies to the Great Lakes and into the Ohio Valley. Above-normal precipitation is favored over parts of the west coast, with a slight tilt toward above normal over parts of the central CONUS. The highest confidence for above-normal precipitation is over the Southeast CONUS where influences from El Niño are strongest.
Impacts and Outlooks for Your Region
Get more details for your region in the December climate impacts and outlooks summaries:
Click the link to read the article on the Sky-Hi News website (Ryan Spencer). Here’s an excerpt:
Throughout the state of Colorado, snowpack is generally about 60-70% percent of average, with no one region trending much better than the other, National Weather Service Forecaster David Barjenbruch said Tuesday, Dec. 2. That lands this snow year in the 8th percentile for the state’s historic records, according to historic weather data collected by the U.S. Department of Agriculture.
Westwide Snow Water Equivalent percent NRCS 1991-2020 Median January 6, 2024.
Meanwhile, snowpack conditions in California’s Sierra Nevada Mountains are only about 20-30% of normal, Barjenbruch said. That remains true almost all the way up the West Coast into the mountains of Oregon and Washington, he said. Landlocked states are faring a bit better than the coast, but snowpack conditions continue to trend further behind average than in Colorado. While some parts of Utah are doing slightly better, in Idaho and Nevada, snowpack lingers at about 50-60% of normal, Barjenbruch said…
Colorado Drought Monitor map December 26, 2023.
Throughout Colorado, precipitation remained at or below normal in 2023, Barjenbruch said. Though Colorado was briefly drought-free in July for the first time since 2019, drought has returned more than half the state. Southwest Colorado is experiencing the worst drought conditions, ranging from moderate to extreme drought, while abnormally dry conditions have crept into the northwest part of the state as well as Summit and Grand counties. About 63% of the state is experiencing some level of drought conditions, according to the U.S. Drought Monitor. National Weather Service hydrologist Aldis Strautins noted that in September, Dillon received just 0.65 inches of precipitation, less than half the average for the month. After coming just shy of average in October, the Colorado mountain town received ¾ of an inch of precipitation in November, a month that typically averages an inch of precipitation, and remained more than ¼ of an inch below average in December, Strautins said. Nearby, Breckenridge trended just above normal in September and October, but that was quickly undercut by a dry November that saw only a half inch of precipitation, more than ¾ of an inch shy of the month’s inch average…In Colorado’s prime ski country in and around Summit County, about 2-3 inches of precipitation — the equivalent of 2-4 feet of snow in places above 9,000 feet — would be necessary to get back to normal, Barjenbruch said.
Despite a slow start to the snowpack season “it’s not too late to catch up,” says Peter Goble, a climatologist from the Colorado Climate Institute. The El Niño year that we’re currently in could mean good spring precipitation.
“We do see sometimes that we make up early deficits in these El Niño years. So there’s a little bit of a reason to perhaps have some hope there,” he said.
Snow Water Equivalent in Upper Rio Grande January 5, 2024 via the NRCS
We’re really only in the first third of the snowfall season, but he said that snowpack values in the South San Juans and Sangre de Cristo ranges are in between the 10th and 30th percentile for snow, meaning that 70 to 90 percent of years on record we’ve had higher snowpack values at this point in the snow season than we do right now.
We have a little bit of hope on the horizon, he says, as the first and middle parts of January will be a “little on the wetter side.”
However, the snow we have now, measured through the SNOTEL sites, is the worst snow has looked since January 1, 2018. It’s not as bad as it was, but it’s the worst since then. “We definitely like to see fortunes reverse from here,” he said.
Compared to years like 2020 and 2021, “those were years where we ended up with bad drought conditions in summer in spite of pretty good snowpack numbers at this time of year.” The reason for that he said was that “we went into fall with much drier than normal soils and the spring in those years was quite dry, as well.”
We’re kind of seeing the opposite this year.
It’s been a poor performing snowpack season till this point, but “we’re a little bit shielded because our precipitation earlier this fall and our soil moisture levels are better than we’ve seen in some more recent years.”
It’s not at all a guarantee for El Niño to surprise us with good precipitation, but Goble said there’s reason to have “at least some” optimism that the spring may be on the wetter side of normal. The springs in 2020 and 2021 were on the drier side of normal. “So we may kind of see the reverse of one of those years…. Better moisture in the shoulder season could end up helping us out.”
“Some of the good that came out of conditions earlier this fall, like October,” he said, “those are benefiting us now. We’re in better shape given the snowpack than we could be if conditions last season and even this fall were different.”
Right now, the entire American West is struggling with snow drought. Snowpack for the Upper Colorado River Basin — which includes Colorado, New Mexico, Utah and Wyoming — stands at a dismal 57.7% of average as of Jan. 3…
“New plot using the nClimGrid data, which is a better source than PRISM for long-term trends. Of course, the combined reservoir contents increase from last year, but the increase is less than 2011 and looks puny compared to the ‘hole’ in the reservoirs. The blue Loess lines subtly change. Last year those lines ended pointing downwards. This year they end flat-ish. 2023 temps were still above the 20th century average, although close. Another interesting aspect is that the 20C Mean and 21C Mean lines on the individual plots really don’t change much. Finally, the 2023 Natural Flows are almost exactly equal to 2019. (17.678 maf vs 17.672 maf). For all the hoopla about how this was record-setting year, the fact is that this year was significantly less than 2011 (20.159 maf) and no different than 2019” — Brad Udall
“Because of last year and how beneficial it was, Lake Powell made a huge jump,” he said. “But we would need four-plus years like last year in a row to fill it back up.”
This year’s is an El Nino winter. That means that warmer surface temperatures in the Pacific Ocean pull the global jet stream further south, making for wetter winters in the Southwest and drier conditions in the Pacific Northwest. Latitude-wise, Utah sits in the middle. So far, northern Utah experienced one storm cycle in early December, and southern Utah has barely seen any snow. In better news, Utah’s reservoirs stand at 80% full — usually, they’re around 56% full this time of year — and good soil moisture means that this year’s runoff will head efficiently to reservoirs without soaking into the ground…
“One good year is one good year, and we can’t get complacent,” Amy Haas, executive director of the Colorado River Authority of Utah, told The Tribune. “We can’t count on good years. We have to be prepared for anything.”
Screenshot of the Colorado Basin River Forecast Center website snow conditions January 5, 2024.
From left, J.B. Hamby, chair of the Colorado River Board of California, Tom Buschatzke, Arizona Department of Water Resources; Becky Mitchell, Colorado representative to the Upper Colorado River Commission. Hamby and Buschatzke acknowledged during this panel at the Colorado River Water Users Association annual conference that the lower basin must own the structural deficit, something the upper basin has been pushing for for years. CREDIT: TOM YULSMAN/WATER DESK, UNIVERSITY OF COLORADO, BOULDER
LAS VEGAS — Around 8 a.m. Dec. 13, Becky Mitchell swapped flip-flops for heels, donned a blazer and headed out of her Las Vegas hotel room to fight for Colorado’s right to water in a drier future at the biggest water gathering of the year.
At the 2023 Colorado River Water Users Association meeting last month, Mitchell, 49, would glad-hand and spar with 1,700 of the Colorado River’s most powerful water users. As Colorado’s first full-time Colorado River commissioner, Mitchell’s job is to make sure Coloradans don’t lose out as the seven basin states vie for the critical, and limited, resource.
“There’s always some tension within the seven states whether we portray it or not,” Mitchell said. “It’s good for people to see that. We’re dealing with important issues.”
Mitchell, originally from Hawaii, is a Colorado School of Mines graduate who has worked on Colorado water issues for the state since 2009. In addition to serving as Colorado’s representative on the Upper Colorado River Commission, she has also been the director of the state’s top water agency, the Colorado Water Conservation Board.
Instability in the basin, which provides 40% of Colorado’s water, is just adding to the pressure. Cities, industries and farms could face more severe water shortages by 2050, according to the state’s water plan.
“If you’re not passionate about this, you’re not paying attention,” Mitchell said. “When you look at the science and the history, I don’t know how it doesn’t move you.”
For the federal government and the seven state commissioners the main task at hand is to plan how water is stored and released from the basin’s two largest water savings banks, lakes Mead and Powell, after 2026, when the current operating rules expire.
Based on their decisions and climate conditions, the river and its reservoirs could continue to dry up, as they nearly did in 2021 and 2022, or they could be brought back into balance, with demands for water reduced to match the river’s shrinking supplies.
“Everyone is intent on protecting the interests of their particular constituency,” said Estevan López, New Mexico’s Colorado River negotiator. “Things can get tense at times in these discussions. These are difficult issues for all of us.”
Becky Mitchell. Photo credit: Colorado Department of Natural Resources
Mitchell in action
A typical day for Mitchell involves a steady flow of meetings, either in Colorado or across the basin states, with the political leaders, experts, utility managers, water users and others in the water community. The conference represented all of that, on hyperspeed, crunched into one windowless, enormous conference hall.
“These things are overwhelming. I think people think I’m more of a people person than I am. I actually like to definitely recharge as much as I can,” Mitchell said, which mostly involved a U2 concert, karaoke and family time at the conference.
The annual gathering offers a chance to hammer home key points in a public forum with attendees from across the Upper Basin — Colorado, New Mexico, Utah and Wyoming — and the Lower Basin — Arizona, California and Nevada, Mitchell said.
Her main point: There’s only so much Upper Basin states can do when water users are already getting cut off each year, she said, while walking, coffee in hand, past slot machines and French-themed shops at Paris Las Vegas Hotel and Casino.
She headed into the first big conference meeting, where she and other state representatives on the Upper Colorado River Commission delivered prepared remarks and state updates to the audience. For Mitchell, that meant rehashing her “irrefutable truths,” a set of standards by which she’ll vet any agreement the basin states propose.
Occasionally, someone stopped her in the hallways or at meals for sidebar conversations. (“Xcel accepted!” one person shared, referencing a historic agreement to purchase some of the oldest water rights in Colorado from Xcel.)
The next morning, tensions flared at the panel as she spoke stridently about her concerns about the negotiations and limitations on the water supply in Colorado, where at least some farmers, ranchers and other water users see their water shut off early as supplies shrink.
Several Coloradans said they felt well-represented by Mitchell during the conference, including leaders of the two tribes with reservation land in Colorado, the Southern Ute and the Ute Mountain Ute.
“She’s strong in heart and mind to get the message out. Being blunt sometimes takes that,” Ute Mountain Ute Chairman Manuel Heart said. Mitchell has advocated for tribes on a whole new level, and without her, they’d be stuck in the status quo, Heart said.
“She’s letting everybody else know: She stands with the tribes, and Colorado stands with the tribes,” said Lorelei Cloud, acting chairwoman of the Southern Ute Indian Tribe. “That’s a big statement to make.”
Members of the Colorado River Commission, in Santa Fe in 1922, after signing the Colorado River Compact. From left, W. S. Norviel (Arizona), Delph E. Carpenter (Colorado), Herbert Hoover (Secretary of Commerce and Chairman of Commission), R. E. Caldwell (Utah), Clarence C. Stetson (Executive Secretary of Commission), Stephen B. Davis, Jr. (New Mexico), Frank C. Emerson (Wyoming), W. F. McClure (California), and James G. Scrugham (Nevada)
CREDIT: COLORADO STATE UNIVERSITY WATER RESOURCES ARCHIVE via Aspen Journalism
Working outside of the mold
Mitchell doesn’t fit the traditional mold of a water buffalo in Colorado. Some attendees privately groused that Mitchell’s approach at the panel was too aggressive or her tone too scolding.
Several Coloradans said they loved Mitchell’s spirited and fiery manner. Many Coloradans at the conference were proud of her, said Ken Curtis, general manager of the Dolores Water Conservancy District.
“She did have to earn some respect over some time, and I think she’s earned it,” Curtis said. “Anytime there’s somebody new appointed to a position like this, that pretty much the whole state water community is watching, it’s got to be rough.”
The slowly changing stereotype of a “water buffalo,” an insider term for negotiators of Colorado River agreements, is that of an older, white and male figurehead.
Mitchell is not those things. In her home life, she is the mother of five adult children, three of whom she adopted from Ethiopia where she frequently returns to work on water issues.
At the conference, her big laughs occasionally came with a slight snort, and once or twice, she broke out a Running Man-style dance move in the conference halls. She was frequently the most forceful speaker on the stage, and in past speaking events, she’s gotten choked up while talking about water issues.
“People really see her sincerity, speaking from the heart, and they’re willing to do the same,” said Robert Sakata, a Colorado farmer and member of the Colorado Water Conservation Board.
Mitchell said she has made a conscious decision to not shrink herself in the face of criticism. It is an example taught to her by her mother, she said, and one that she tries to teach to her daughters.
“There’s been a couple times when I’ve tried to be quieter or politer to make myself heard, and it hasn’t worked,” Mitchell said. “I’ve had to make a choice to be in a place that’s more uncomfortable for me. … What we’re fighting for is too important to make myself small to make myself feel comfortable.”
Fresh Water News was launched in 2018 as an independent, nonpartisan news initiative of Water Education Colorado.
“New plot using the nClimGrid data, which is a better source than PRISM for long-term trends. Of course, the combined reservoir contents increase from last year, but the increase is less than 2011 and looks puny compared to the ‘hole’ in the reservoirs. The blue Loess lines subtly change. Last year those lines ended pointing downwards. This year they end flat-ish. 2023 temps were still above the 20th century average, although close. Another interesting aspect is that the 20C Mean and 21C Mean lines on the individual plots really don’t change much. Finally, the 2023 Natural Flows are almost exactly equal to 2019. (17.678 maf vs 17.672 maf). For all the hoopla about how this was record-setting year, the fact is that this year was significantly less than 2011 (20.159 maf) and no different than 2019” — Brad Udall
2023’s above average snowpack gave a boost to Lake Powell’s dwindling water levels, and provided water managers more time to contemplate long-term policy changes. Photo: Alexander Heilner/The Water Desk with aerial support from LightHawk
After years of dry conditions throughout the West, 2023 gave the region’s water managers the greatest gift of all: a hefty snowpack.
This year’s winter snow eventually melted and boosted the Colorado River’s beleaguered reservoirs. The Hail Mary winter storms came just in time. Without the savior snows, the river’s second-largest reservoir, Lake Powell, was on a glide path toward losing the ability to produce hydropower at Glen Canyon Dam, not to mention the harm to the long-term ecological health of the river and its main tributaries.
But the more nightmarish scenarios of quiet turbines, empty reservoirs, and dry river beds were put on hold this past year, as more snow also means more time. When wet weather returned to the basin, the river’s top negotiators quickly turned their attention away from the short-term emergency in front of them, and toward a more long-term set of solutions. Talk of not “squandering” the gift of time became a standard talking point of decision-makers along the river that supplies more than 40 million people across seven U.S. states, 30 tribal nations and communities in northern Mexico.
One snowy year does not make for a lasting fix for the Colorado River’s fundamental gap between water supply and demand. A new year means new uncertainties over the river’s future. And as it looks now, 2024 promises to be more consequential than the last.
Here at The Water Desk, these are the top things we’re paying attention to in 2024:
Westwide SNOTEL basin-filled map January 13, 2023 via the NRCS.
1. Reimagining how we manage the Colorado River
The snowy respite in 2023 gave both federal and state-level water managers the brain space to think long-term. A set of 2007 guidelines for the river’s management expire in 2026. In October, the federal Bureau of Reclamation released its preliminary report on what should be included in the talks to renegotiate them. They’ve given the various users — states, tribes, environmental and recreation groups — until March 2024 to submit their preferred plans for analysis and eventual inclusion in a draft set of guidelines later next year.
The current guidelines have quite a few detractors across the river’s Upper and Lower Basins. And what should or shouldn’t be in the new rules has contributed to significant tension among river negotiators.
The various state leaders recently got the chance to publicly posture at the Colorado River Water Users Association conference, held annually in December in Las Vegas. All seven state-level negotiators, including representatives from California, Arizona, Nevada, Colorado, Utah, New Mexico and Wyoming, sat beside each other on stage and made clear there was still distance between their positions on the big-picture problems plaguing the river and how to deal with them. The Arizona Republic’s Brandon Loomis has this excellent recap of what went down.
Leaders from California water agencies and districts signed funding agreements with federal officials at the 2023 Colorado River Water Users Association conference in Las Vegas. Photo: Luke Runyon/The Water Desk
The panel’s biggest news was a public commitment from the Lower Basin states of California, Arizona and Nevada to address what’s known as the structural deficit. This is the well-documented supply and demand gap that would exist even without climate change sapping snowpack and runoff. The deficit is estimated to be between 1.2 and 1.5 million acre-feet annually, and it has contributed greatly to the dwindling water levels at Lakes Mead and Powell. Who has to take the necessary cuts to account for that amount of water has always been an open question. Now, we have an answer: the Lower Basin states.
The structural deficit refers to the consumption by Lower Basin states of more water than enters Lake Mead each year. The deficit, which includes losses from evaporation, is estimated at 1.2 million acre-feet a year. (Image: Central Arizona Project circa 2019)
“That makes sense. That’s our responsibility,” said J.B. Hamby, California’s river negotiator, at the Vegas gathering. “This is a historic thing coming. It’s on our shoulders to be able to resolve it.”
But in a basin that in recent months has grown increasingly reliant on injections of federal cash to incentivize temporary conservation deals, how state leaders plan to find the funds and the political will to permanently deal with the structural deficit will be something to watch. Any commitments made by those state-level negotiators will need to be sold to a broad range of constituents, who at this point will expect to be handsomely compensated for a permanent cut to their supplies, as POLITICO’s Annie Snider explained in this November piece.
An additional layer of basinwide tension can be summed up in one word: equity. It’s thrown around a lot in discussions of the Colorado River and the economic and social sacrifices needed to bring it onto a more sustainable path. Who should bear the greatest burden of the eventual cutbacks is still unclear. Upper Basin leaders, from Colorado, Utah, Wyoming and New Mexico, often point the finger toward the Lower Basin.
“We’re not interested in striking a deal that allows the continuation of depleting the storage and dragging the system into crisis,” said Becky Mitchell, Colorado’s top river negotiator. Mitchell made clear she felt users in her state were already feeling pain, while those downstream of the large reservoirs have mostly been made whole, even in the driest of years. But with Lower Basin users willing to take on big, intractable issues like the structural deficit, moving forward it will likely be more difficult for Upper Basin leaders to continue to cast all the blame downstream.
“New plot using the nClimGrid data, which is a better source than PRISM for long-term trends. Of course, the combined reservoir contents increase from last year, but the increase is less than 2011 and looks puny compared to the ‘hole’ in the reservoirs. The blue Loess lines subtly change. Last year those lines ended pointing downwards. This year they end flat-ish. 2023 temps were still above the 20th century average, although close. Another interesting aspect is that the 20C Mean and 21C Mean lines on the individual plots really don’t change much. Finally, the 2023 Natural Flows are almost exactly equal to 2019. (17.678 maf vs 17.672 maf). For all the hoopla about how this was record-setting year, the fact is that this year was significantly less than 2011 (20.159 maf) and no different than 2019” — Brad Udall
One more idea from the Las Vegas conference that’s still largely conceptual, but is gaining some interest from those in power, is to use annual measures of basic hydrology — like snowpack levels and streamflows — to determine how much water ends up being delivered to the basin’s varied users. It sounds simple: only use what nature provides.
But that idea flies in the face of the river’s foundational governing document, the Colorado River Compact, which put fixed volumes of water use on paper, regardless of whether it was a dry or wet year. For now, the idea seems to be more of a talking point than a specific policy proposal, and we will see if proponents can turn it into something Lower Basin users can get behind.
In recent years, the Colorado River’s 30 federally recognized tribes have grown their influence in the basin’s political landscape. Calls for a more formal tribal role in basinwide negotiations are being amplified by the tribes themselves, and by both state and federal leaders, such as Interior Secretary Deb Haaland.
2023 presented some significant tribal successes. The Gila River Indian Community became a key player in negotiations over the Lower Basin’s conservation plan to secure federal dollars last spring. Federal officials promised the tribe $150 million over three years to leave water they were legally entitled to in Lake Mead.
A canal delivers Colorado River water to the Gila River Indian Community south of Phoenix. Photo by Ted Wood/Water Desk
But in the long-term, deciding what that tribal role, or tribal seat at the negotiating table, could be and should be is unsettled. In June, at a Colorado River symposium at the University of Colorado Boulder’s Getches-Wilkinson Center, Gila River Indian Community Gov. Stephen Roe Lewis called for leaders from all 30 sovereign tribes to be included in talks between federal and state officials. That idea received immediate pushback from state leaders on the feasibility of expanding the table by 30 seats.
Creating a single representative seat for all of the tribes is another option. But that, too, presents challenges. Is it fair or feasible to reduce the varied economies, cultures, geographies and spiritual practices of 30 sovereign nations into a single seat?
While basinwide tribal inclusion still happens in an ad hoc rather than institutional way, a draft agreement to formalize a governing relationship among six tribes and the four Upper Basin states has taken shape. The Upper Colorado River Commission has started inviting representatives from six Upper Basin tribes to participate in regular meetings. Commissioners could formalize the new agreement this February, as The Colorado Sun’s Shannon Mullane recently reported.
There appears to be broad agreement that more formally including tribes in the river’s complex, multi-layered decision-making processes is the most just path to take. Deciding what type of basinwide governance structure will make tribal inclusion more than a talking point could make some progress in 2024 as the basin’s leaders say they finally have the brain space to take on longer-term issues, as KUNC’s Alex Hager reported in his piece from the Las Vegas conference.
Westwide SNOTEL basin-filled map January 5, 2024 via the NRCS.
3. Winter snowpack can make or break
Snowpack in the southern Rockies entered 2024 with a weak start. There is still a lot of winter left to go, but beginning a new year with a significant snowpack deficit always brings a certain amount of hand-wringing from skiers and water managers alike.
Upper Basin snowpack stands at just 64% of the long-term median. The snowiest months are still to come, but it’s much harder to get to an above-average snowpack after a slow start.
2023 was a stark example of what a wet winter can do. The sense of urgency among the river’s policymakers diminished as the snow piled high. Headlines turned from documenting record lows at the big Colorado River reservoirs, to cheering modest gains in water levels.
The past year’s heavy snows and subsequent rushing rivers came after three successive meager runoff seasons. The gains were significant, but not a total game-changer. As scientists often note, it takes multiple consecutive years of wet conditions to allow large reservoirs like Lakes Mead and Powell to fully recover.
The return of El Niño tipped the scales toward a warmer and wetter winter in the Colorado River basin’s headwaters states. So far, we’ve just been getting the warm, not the wet. No matter how you look at it, we’re having a dry start to winter, as my Water Desk colleague Mitch Tobin lays out in his latest Snow News post.
In 2023, Lower Colorado River leaders said their deal to conserve up to 3 million acre-feet between now and 2026 was enough to bring needed stability to the river’s reservoirs. But that same point was used to justify agreements like the Drought Contingency Plans in 2019 and the 500+ Plan in 2021, which did not provide the long-term stability and certainty that water managers crave.
Scientists, such as Colorado State University’s Brad Udall, say we haven’t been imaginative enoughin envisioning just how bad things could get along the river. Another series of dry winters, the likes of which we’ve seen in the past 25 years, is plausible.
2023 brought a reprieve. How the winter of 2024 will play out is still unclear. Its outcome will undoubtedly have ripple effects, and either amplify or ease the existing tensions playing out across the basin.
The Water Desk’s mission is to increase the volume, depth and power of journalism connected to Western water issues. We’re an initiative of the Center for Environmental Journalism at the University of Colorado Boulder.
A large storm system brought rain and snow to the Pacific and Atlantic coasts along with rain and snow in the eastern High Plains and Midwest. The Northeast remained largely unchanged from last week, with minor improvements in western New York, Pennsylvania and central Maryland where precipitation was 150% to 300% of normal. Further south along the Mid-Atlantic, 150% to 300% of normal precipitation fell, bringing improvements in Virgina, North Carolina and South Carolina. The southern part of the Southeast did not benefit from any of the precipitation that fell elsewhere along the Atlantic coast, bringing further degradations to an already very dry part of the country. The South remained the same as last week, with small areas of deterioration from northeast Texas into southwestern Arkansas, and north and central Louisiana.
A small part of southeastern Louisiana and southern Mississippi saw minor improvements. The High Plains benefited from a rain and snow weather system that moved through the area before the new year. Northeastern Colorado into eastern Nebraska had some improvement. Northern Colorado and Wyoming experienced deterioration without the benefit of the precipitation that fell further east and low snow water equivalent (SWE). The north-central Midwest had some improvements from the same storm that benefited the High Plains. Central, eastern and southern Midwest largely missed precipitation, causing deterioration in eastern Ohio, southern Indiana and Illinois, and eastern and northern Kentucky where groundwater and streamflow remain low. The West saw few improvements, except for New Mexico. Lack of precipitation and low SWE in higher elevations have left areas of Montana and Arizona worse off than last week…
A weather system bringing rain and snow moved through the High Plains midweek last week. Central and northern states experienced up to 400% of normal precipitation. Northeastern Colorado and eastern Colorado saw improvements in Exceptional (D4), Extreme (D3), and Severe (D2) drought conditions. These improvements are a continuation of improvements seen last week. The weather system that brought improvements to much of the High Plains largely missed north-central Colorado. Conditions worsened, introducing abnormal dryness and degrading from Abnormally Dry (D0) to Moderate Drought (D1). Northern Wyoming experienced similar conditions to Montana, leading to small Abnormally Dry (D0) and Moderate Drought (D1) expansions along the northern border with Montana…
Colorado Drought Monitor one week change map ending January 2, 2024.
Much of the West remains status quo for the week. Precipitation fell across much of the Pacific coast from Vancouver southward into central California. Montana has not benefitted from the recent precipitation, causing small degradations along its border with Idaho, Wyoming and North Dakota. Precipitation continues to miss Arizona, mainly the north. Over the past few months Abnormal Dry (D0) conditions expanded northward into southern Utah. New Mexico did see improvements in Extreme (D3), Severe (D2) and Moderate (D1) drought conditions in the interior northwest…
Little reprieve occurred across much of the South, with only 5% of normal precipitation falling. Western and central Texas remained unchanged, with a small improvement of Moderate Drought (D1) to Abnormally Dry (D0) conditions in the Panhandle. Parts of southeast Louisiana and Mississippi had small improvements with streamflows slightly improving. This is not the case for much of the South where short- and now long-term conditions continue to decline. Streamflow and groundwater continue to counteract what precipitation is received. Eastern Texas into western Louisiana and southwestern Arkansas saw 1-category degradations for all drought categories. Central Louisiana had Extreme drought (D4) conditions expand northward into Catahoula, Winn, Richland and Concordia parishes. Moderate Drought (D1) in northwest Louisiana extended west into eastern Texas and southwestern Arkansas. Mississippi stayed largely unchanged aside from the slight reduction of Moderate Drought (D1) in the far south. Tennessee saw improvements in the east, with improving soil moisture and benefits from the precipitation experienced in the Mid-Atlantic region. Central and eastern Tennessee, on the other hand, saw Severe Drought (D2) expand northward into Kentucky. Exceptional Drought (D4) was introduced in the South at the tri-boundary with Mississippi and Alabama due to the continued lack of precipitation for the past few months…
Looking Ahead
During the next five days (Jan. 2-7, 2024), more heavy precipitation is expected for the central and northern Pacific coast, with some areas of higher elevation also seeing some moisture. The Gulf Coast and southern Atlantic regions are expected to see heavy precipitation. This centers around southern Louisiana, Mississippi and Alabama.
The National Weather Service Climate Prediction Center’s 6-10 day outlook (valid Jan. 3-9, 2024) favors above-normal precipitation for most of the country, with high probabilities found in the intermountain West, east of the Ohio and Mississippi River Valleys, Alaska and Hawaii. Only southern Texas is expected to have below-normal precipitation. There is an increased probability of below-normal temperatures west of the Rockies, particularly in the southwest. Following the precipitation trend, areas of probable heavy precipitation in the east also have the probability of being warmer than normal. The Northeast has the largest probability of having above-normal temperatures.
US Drought Monitor one week change map ending January 2, 2024.
Just for grins here’s a slide show of early January US Drought Monitor maps for the past few years.
Greetings in 2024, which promises to be an interesting year, along the Colorado River and beyond it too. May we come out of it affirmed nationally in our commitment to democratic governance, and improved in our execution of it on our river.
Back in the earlier part of the last century, the great conservationist and ecologist Aldo Leopold advised us to ‘think like a mountain’ – a large entity occupied by many life forms working together, sometimes cooperatively, sometimes competitively, but keeping the whole system in a living, dynamic balance. Remove any part – the wolves, in his story – and something else would start to go out of balance (the deer) and a kind of disorder would spread through the whole system. When intruding on an ecosystem, he was saying, tread carefully and move incrementally, stop often to observe your unfolding consequences….
“New plot using the nClimGrid data, which is a better source than PRISM for long-term trends. Of course, the combined reservoir contents increase from last year, but the increase is less than 2011 and looks puny compared to the ‘hole’ in the reservoirs. The blue Loess lines subtly change. Last year those lines ended pointing downwards. This year they end flat-ish. 2023 temps were still above the 20th century average, although close. Another interesting aspect is that the 20C Mean and 21C Mean lines on the individual plots really don’t change much. Finally, the 2023 Natural Flows are almost exactly equal to 2019. (17.678 maf vs 17.672 maf). For all the hoopla about how this was record-setting year, the fact is that this year was significantly less than 2011 (20.159 maf) and no different than 2019” — Brad Udall
Were Leopold here today, as we undertake the sobering Anthropocene task of more effective management strategies for the Colorado River we’ve created from the river we found here, he might advise us to ‘think like a river’ – being careful first to be sure we are working with the river we actually have today, not the river we thought we had a century ago when we began to develop the management strategies that finally crashed at their century mark in 2022. [ed. emphasis mine]
Am I suggesting that the river actually ‘thinks,’ like we humans (supposedly) think? No. I don’t pretend to know if anything else in the universe thinks like we think (when we choose to). But it ought to be evident, here in the Anthropocene Epoch, when we are altering – consciously or unconsciously – a lot of the planet’s systems, that we could be better at thinking things through than we seem to be, and we ought to be able to learn something about thinking things through from looking closely at the systemic behavior of things that have been working much longer at the challenge of surviving, even thriving, with a measure of sustainable grace…. Like our rambunctious river, before we went to work on it.
Illustration of the Hyporheic Zone, from D. Tonina and J. M. Buffington, 2009, Hyporheic Exchange in Mountain Rivers I: Mechanics and Environmental Effects. Geography Compass 3 (2009): 10.1111/j.1749-8198.2009.00226.x
Watching a river (one of my favorite occupations), the first superficial observation might be: this is a stream of water that is leaving, flowing away from land that was not able to put it to use, so it is leaving the premises – usually carrying some of the land with it. This is an accurate perception of one of the river’s functions (without which, there would be no ‘downstream’), but that is not to say that the flowing stream is nothing but a drainage ditch. The flowing stream actually interacts with the land it is moving through as much as it can, through what hydrologists call ‘hyporheic exchange’ – either moving some of its water into the land it is flowing through, or picking up groundwater trickling into the stream. And it isn’t just purely water that gets exchanged both ways: the water is full of micro-organisms and dissolved and particulate minerals and gases, nutrients that also move into or out of the land.
A river’s boundary does not end at the channel margins. Even when not in flood, the river’s water reaches out laterally, beneath the riparian forest and floodplain, and vertically, into the substrate beneath the channel.
This underground world, where water originating in the river channel is percolating, in darkness, through the spaces between grains of gravel and sand, is called the hyporheic zone. The term Hyporheic means, literally, “beneath the river.” The distinguishing feature of this underground world is that surface water percolates down into it, moves through it for a while, and then reemerges from the streambed, becoming part of the surface water again further downstream.
This exchange of surface and subsurface water happens all along the river channel, giving the hyporheic water a character distinct from ordinary groundwater. And in the process, the surface water becomes changed as well.
One of the changes that happens when water enters the hyporheic zone is that it becomes cooler. We have all had the experience of going into the basement of an old house on a hot day, and noticing how cool the air can be down there. Temperatures below ground are cooler in the summer time, and more constant throughout the day. The streambed is no different.
The water flowing in the hyporheic zone becomes cooled, and when it reemerges, it cools the surface water as it mixes. This is one of the ways that a stream can remain cool in the sunlight, and cool off again in the shade after flowing through blistering sunlight.
Since the water flowing into the hyporheic zone carries dissolved substances from the surface water, including oxygen, carbon dioxide, and other nutrient substances that nurture growth of plants and fungi, there is life in this underground world. Each grain of gravel and sand becomes coated with a living film of microbes, a “biofilm,” that is nurtured by this flowing water and thrives in the absence of sunlight. Microscopic creatures, and even larger creatures, big enough to be seen by our eyes, such as copepods, tardigrades, insect larvae, tube worms, roundworms, and even juvenile fish enter, and live in, the hyporheic zone.
It is this biological activity that leads to another important function of the hyporheic zone: water filtration and purification. The streambed acts as a sand filter, physically straining out tiny particles of silt and organic matter, helping keep the surface water clear. The biofilm absorbs chemicals out of the water. Some of these chemicals nourish the microbes making up the biofilm. Other chemicals, including toxins from human pollution like road runoff, are absorbed by the biofilm, and in some cases broken down into harmless substances by the microbes.
Hydrologists call a stream picking up water from the land it’s moving through a gaining stream, and a stream that is giving some of its water to the land a losing stream. I think the latter ought to be called a ‘giving stream,’ but I guess we’ve got to go with the hydrologist terminology. (It’s Trumpthink to call the stream a ‘loser’ for trying to be generous with its water.) Whether a stream loses or gains water from the land it is passing through depends on the level of the water table in the groundwater in the vicinity of the stream: if the water table near the stream is higher than the surface level of water in the stream, the stream gains from groundwater that trickles in. If the stream level is higher than the water table near the stream, the stream ‘loses’ (gives) water to the surrounding land.
Another observation about how a river behaves comes from looking at the material a stream is carrying, material it has cut, ground or otherwise eroded from its mountains, and realize that a river is both a creative and destructive force creating the landscape like a sculptor. Some sculptor – maybe Michelangelo? – said that his task was to remove the excess stone from a block of marble to reveal the beautiful figure within; so does the river create our magnificent vistas of mountains, couloirs, bowls and valleys by cutting into and moving stone.
Healthy mountain meadows and wetlands are characteristic of healthy headwater systems and provide a variety of ecosystem services, or benefits that humans, wildlife, rivers and surrounding ecosystems rely on. The complex of wetlands and connected floodplains found in intact headwater systems can slow runoff and attenuate flood flows, creating better downstream conditions, trapping sediment to improve downstream water quality, and allowing groundwater recharge. These systems can also serve as a fire break and refuge during wildfire, can sequester carbon in the floodplain, and provide essential habitat for wildlife. Graphic by Restoration Design Group, courtesy of American Rivers
This reductively creative, creatively destructive process is enhanced in our river basin by the fact that most of the river’s water supply comes from a winter snowpack that melts out quickly over a couple months in what passes for spring in the mountains, and most of the river’s water goes ripping and tearing down the mountains, far too fast for more than a fraction of it to sink in as groundwater. But what does sink in is important to the river after that fast runoff; the groundwater moves at a leisurely pace through the ground – ranging from days and weeks to as much as a century – making its way down to the low places where the surface streams flow, and arriving in the post-runoff time, late summer and fall, when the stream needs the gain. The US Geological Survey has determined, through sophisticated studies of isotopes, that roughly half of the water in the Colorado River below its steeper tributaries entered the river as groundwater.
When the downhill slope gentles, even surface flows slow and the streams begin to drop the debris they have torn out and are carrying, and they move that debris around – or move around the debris themselves: so doing, they create meadows and floodplains through which they loop and meander, generating a lot of hyporheic exchange. Much of this exchange may be only into immediate riparian areas; but when streams roll into their own created floodplains, they spreads their excess bounty more broadly, raising a water table that might nurture grassy meadows, cottonwood forests – or lots of agricultural land. A good runoff makes a stream’s floodplains live up to their name, with shallow floods spreading new layers of silt and nutrients over them.
In trying to ‘think like a river,’ we do have to think about land-based life too, and the relationship of land-based life to water – which of course is existential: without water, there is no life as we know it on the planet. And land-based life depends absolutely on freshwater, which – remember from the last post here – is less than one percent of the water on the planet. And two-thirds of that modest percent is bound up in the ice sheets on Greenland and Antarctica.
All the life on the planet depends on access to the remaining tiny fraction of freshwater – which, by the time it has accumulated in streams and rivers is on its way back to the salty seas, despite their efforts to slow the process by meandering and offering their waters in hyporheic exchanges. More freshwater will come – or at least it always has – as the sun distills it again from the salty seas and precipitates it over the land, but still…. All that freshwater, essential to life, just running off to the seas where it disappears into the salt water, freshwater’s equivalent of dying….
If one wanted to let the imagination fly like an untethered kite for a moment – land-based life itself might be described as a freshwater strategy for confounding gravity’s pull back into the ocean. We – all of us, plants, animals, fungi, bacteria – are made up of highly specialized little vessels whose chief component when we are alive, is water. This is true of aquatic life that stays in the water, but it is also true of the rest of the planet’s life project that came out of the water to live on the land, a diversity of stacks and arrays and mobile units of tiny specialized cells full of a mix of minerals and gases dissolved in water. The watery cells that arrange themselves as molecular bucket brigades in trees lift water as much as three hundred feet into the atmosphere, against gravity, profligately venting most of that water back into the atmosphere to maintain that upward flow. We animals carry water everywhere, against gravity, far from the rivers. In this flight of imagination, humans, around 70 percent water, could be described as water that stood up to look around and think and dream.
Beaver ponds and meadows. Photo Credit: Sarah Marshall via American Rivers
Reeling that kite in – land-based life does interact with surface freshwater in many ways, some of which facilitate water’s willingness to carry out hyporheic exchanges with the land and the water-using organisms on the land, and some of which work against such exchanges. Beavers work to slow the flow of water through the land, pooling it up in ways that slow but don’t stop the flow, and so doing, nurture wetlands and wet-meadow ecosystems. And we humans move water out back out onto the land to irrigate it, again and again with the same water in the arid lands, using it to grow life that would never grow there at all unassisted.
Many river stretches in Colorado have been impacted by human use. In her book “Virtual Rivers,” Ellen Wohl describes how rivers and headwater systems have been degraded over time. “As land-use changes have resulted in changes to the water and sediment entering stream channels, these channels may become unsightly, pose a hazard to human life and property because of excessive scouring or sediment filling, or no longer provide some desired function, such as fishing.”
Here we see an unhealthy system with an incised stream channel that is disconnected from its floodplain, resulting in reduced water storage, less groundwater recharge, and degraded water quality. Unlike in a wetland system, runoff and flood water flow quickly out of a degraded meadow because they cannot spread out and seep in. Increased flows cause further erosion, cutting deeper and wider channels that are less meandering and sending more sediment downstream. Graphics by Restoration Design Group, courtesy of American Rivers
We are also guilty of occasionally conspiring with the vagaries of nature to destroy the hyporheic exchange between streams and the land they run through, as when we unconsciously overgraze a wet meadow in a dry year – then a summer afternoon storm drops an inch or two of cloudburst rain on the meadow, and a raging torrent rushes down through the vulnerable sun-baked meadow, creating in an hour or so a gully that deepens in subsequent years, and draws down the water table of the former meadow, causing an ecosystemic change from a wetland ecology to a dryland ecology. Or a dam is built across the river, drowning the aquatic and riparian ecosystems above the dam and altering the ecosystems below the dam. Some of these kinds of changes are unfortunate; others are just unavoidable as we try consciously to make the planet more ‘fitting’ for human survival in ever-increasing numbers.
There are two further observations about these processes that seem almost confoundingly contradictory: the slower the flow, the more the stream or river gets to interact with the land. But at the same time, the more the water is spread out in those interactions, the more vulnerable the water is to the sun’s power. Among ourselves we say ‘use it or lose it.’ But in the bigger picture, it is ‘use it and lose it’ through increased evaporation and transpiration, as we ‘spread it out to dry.’
So given all of that – what can we say about ‘thinking like a river’ today, as we start planning for the operation and maintenance of our Colorado River in the hotter and probably drier Anthropocene? Given that it is only two-thirds the river we thought it was a century ago when we started to ‘develop’ it?
The most obvious thing from observing the river at its own work is to do what can be done to ‘slow the flow’ of water back to the sea – but to do it in ways that don’t just ‘spread it out to dry’ under the sun whose power is enhanced by our atmospheric changes.
One way to do this is to get more of the water underground but retrievable. Back in the 1930s, there was discussion about how best to bring the on-again off-again firehose of the Colorado River mainstem under a measure of control. The Bureau of Reclamation and the Army Corps of Engineers wanted big bold mainstem dams, like Hoover’s dam (already under construction), but the brand-new Soil Conservation Service favored a lot of small reservoirs and erosion-restoration projects up in the headwaters of the western rivers, followed by better farming, logging and mining methods. The idea was to raise water tables and increase the quantity of groundwater making its slow way downhill underground and out of the sun, before joining the river in its hyporheic games.
We know who won that discussion. But today, there is a growing movement to restore degraded landscapes by repairing gullied valleys and raising water tables, getting more water underground and out of the increasingly brutal sun. City utilities are cautiously exploring aquifer recharge, where over-pumping hasn’t already collapsed the aquifers. And we are moving toward consent about the fact that bypassing Glen Canyon Dam would increase the amount of water available for use by a third to half a million acre-feet, with no realistic loss of storage (put it all in Mead Reservoir). Had we given fewer resources to the Bureau of Reclamation and more to the Soil Conservation Service in the ‘30s, we would probably have more water in the river today.
I am not one of those who laments the fact that ‘the Colorado River no longer flows to the ocean,’ and don’t find that fact inconsistent with ‘thinking like a river.’ The amount of active freshwater on the planet is so relatively miniscule in the big picture that I think it would be just fine if land-based life figured out ways to put all of it to work on the care and maintenance of land-based life. That will of course never happen with a vast watershed like the Mississippi – although, given the dead zone its runoff is creating in the Gulf of Mexico, it might be better if it was all used up before New Orleans. I do realize that the lack of Colorado River water flowing into the Gulf of California has impacts on sea life there, but everything seems to involve choices, and in this one, I am inclined by nature to come down on the side of land-based life….
I think it would be nice if we could dedicate one percent of the river’s water to restoration of the beautiful old Colorado River delta – but it would be even better if we could figure out how to make the vast ‘desert delta’ we have created instead (Phoenix on the east through all the Lower Colorado ag lands to Los Angeles on the west) something we could love rather than dislike so much as we seem to…. Can we not build beautiful cities, desert ‘arcologies’ that we’d like to live in rather than ‘auto-urbs’ under a carbon-gas smog spreading out like a cow pooping on a flat rock? Or agricultural lands that aren’t rural industrial slums plagued by inequity?
Thinking like a river – water driven back to sea level by gravity (‘It’s the law!’) but doing what it can to slow its flow in places where it can give water back to the land as well as carry water off the land…. The water has systematic processes going on that we can participate in – have to, being water vessels ourselves needing constant replenishment. We’ve presumed, both consciously and unconsciously, to take charge of those systems along with a lot of other planetary systems; that’s what the Anthropocene Epoch is, and either we rise to the challenges there we’ve imposed on ourselves, or we will preside over our own slow and tedious unraveling. And maybe the first big challenge is slowing our own flow enough to begin to really think through the systems we’ve often just overrun in enthusiastic arrogance.
This year was marked by incredible progress in terms of Audubon’s priorities for water conservation in the West, and yet, we have so much more to do for the birds and people who rely on clean and reliable water. In my lifetime, North America has lost more than 3 billion birds—a catastrophe reaching a tipping point. If we act now, we can reverse this trend and protect people and birds in the arid West. And while daunting, we are making an impact.
Sometimes we hesitate to celebrate or call an achievement a “win” because the work is so massive and ongoing, with climate change and drought still present, and the threats facing the rivers, lakes, and wetlands—and the essential habitats they provide to birds—are growing. Adding more water into the Colorado River, Rio Grande or Great Salt Lake can feel tiny compared to what they need, or what they once were, or could be. But we are seeing birds respond. These victories add up and show decision-makers that new solutions can work, especially when scaled up. Thanks to our supporters and partners, we’ve directed and secured more conservation funding from federal and state governments to these iconic watersheds, we’ve changed public policies and water management where it was outdated and no longer serving today’s needs, and we continue to push for better outcomes for precious water resources in the West.
Much of the work we do is often behind the scenes because of complex technical and legal requirements (such as water transactions to benefit Great Salt Lake or modeling to determine optimal timing for bird surveys). Because of this, it can be challenging to capture the impact we’re making. On top of that, this work can be politically messy—even while we maintain great relationships with many legislators, government officials, and partners.
Despite the challenges, the momentum continues to build in our work around the West and in Washington, D.C.
Championed birds and basin-wide environmental resources in regular dialogue with Colorado River decision-makers in ongoing negotiations.
The range of Audubon’s work is vast: from implementing innovation and market-based solutions, to mobilizing science partners that address knowledge gaps for priority birds, and to thought leadership in water policies and management decisions. Here’s a high-level view of that work:
Great Salt Lake Watershed Enhancement Trust in its first year
At Great Salt Lake, Audubon, along with The Nature Conservancy, has been co-leading the Great Salt Lake Watershed Enhancement Trust (aka the Trust)—a key effort among many solutions needed in protecting and enhancing the water quantity and water quality for the lake and its wetlands. These are some of the most critical habitats for birds in North America. The Trust, working with the State of Utah’s Divisions of Forestry, Fire and State Lands and Wildlife Resources, have facilitated, provided transaction costs, and contributed funding to water transactions for more than 50,000acre-feet of water for Great Salt Lake. The bulk of this water was donated or partially donated, including what is believed to be the largest-ever permanent water donation of water to Great Salt Lakefrom the Church of Jesus Christ of Latter-day Saints.
The wetlands surrounding Great Salt Lake provide crucial habitat for millions of migratory birds, recreational opportunities, and many other public benefits including protecting water quality.
This year is just the beginning, as we’ll secure more water for Great Salt Lake in 2024 and beyond. In the face of climate change, unpredictable drought, and increasing water demands, the Trust, and many other interested parties will need to work collaboratively to bring more water to the lake.
Intermountain West Shorebird Surveys after a 30-year hiatus
Understanding how migrating shorebirds are responding to habitat changes as saline lakes face the threat of desiccation due to climate change and water diversions has been an essential driver for our work with partners in the regional Intermountain West Shorebird Surveys. Now with three seasons under our belt (Fall 2022, Spring 2023, and Fall 2023), Audubon and Point Blue Conservation Science aim to fill data gaps for at least 30 species of shorebirds and their vulnerable habitats in an area bounded on the West by the Sierra Nevada Mountains and on the East by the Rocky Mountains. Conditions have dramatically changed since the last major effort like this was undertaken over 30 years ago, and the need for updated information is more important than ever. We teamed up with the U.S. Fish and Wildlife Service, several Tribes, 11 state wildlife agencies, 35 Audubon chapters, hundreds of volunteers, private landowners, and many other non-profit organizations to count shorebirds in their peak migration windows at 200 sites across the West—and we will do so through 2025—to inform shorebird conservation.
In the time since we’ve kicked off this enormous survey effort, extremes of “weather whiplash” have made for interesting results. For instance, August 2022 was the peak of this mega-drought; Spring 2023 had record-breaking runoff; August 2023 had the West Coast’s Tropical Storm Hilary. We’ve also seen surprising statistics so far, including a record-breaking maximum count of shorebirds at the Salton Sea. The previous max count was 105,000 and the most recent survey counted over 250,000 shorebirds.
We aim to fill more data gaps, but more resources and collaborations are needed to ensure a robust understanding of these species needs. From American Avocet to Wilson’s Phalarope to Snowy Plovers, many species that rely on saline lakes throughout their lifecycle are benefitting from capable partnerships like this, increasing our shared knowledge and allowing for more focused management and protection of their unique habitat needs.
Colorado River “Beginnings”. Photo: Brent Gardner-Smith/Aspen Journalism
Colorado River at a pivotal moment to reduce water use while including the needs of birds
The lifeblood of the American West received a lifeline this year with an above average winter—but the decades-long overuse problems remain. We know that it may take a decade or more of above average winters to restore the main Colorado River reservoirs to pre-2000 levels. The overall trend is that the available water in the Colorado River is declining, even while the United States and Mexico, Tribes, state governments, cities within the basin, and farmers are doing more than ever to ensure available water supply for subsequent years.
We know that to save the Colorado River, we need to use less water. And as the U.S. Bureau of Reclamation continues long-term and short-term planning on the Colorado River, it’s important to remember that while the Colorado River is unpredictable, planning for that future can help all of us in the long run. These plans need to also consider the enormous third-party impacts of reducing water uses in the Colorado River. Thank you to the Audubon network members who sent more than 31,000 comments to the Bureau of Reclamation in 2023 in favor of better outcomes for people, birds, and the environment.
Western yellow-billed cuckoo at Montezuma Well, Arizona.
Photo Courtesy of Gary Botello via the National Park Service
Wrapping up 2023 and looking ahead to next year
We remind ourselves that birds are not only essential components to a healthy ecosystem, birds are daily reminders of our interconnections. This year, a tagged Western Yellow-billed Cuckoo, a federally threatened bird, taught us a little bit of humility and awe when it passed through at least six protected areas on its international journey south. For these riparian-dependent birds, overuse and over-allocation of water in a drought and climate stressed region has led to a precipitous decline in their population. This one migrating bird had the power to remind us that the water work we’ve prioritized and progress we are making matters.
As we move in to 2024, Audubon will continue to advocate for a more secure future for water in the West. Our livelihoods, our environment, and the well-being of future generations require that we continue this hard work now in hopes of preventing catastrophes later. And for migrating birds, keeping the water needed for the network of conserved, restored, and undeveloped habitat across the Southwest adds up today and towards long-lasting solutions. While the work is important, vast, and sometimes uncertain, we remain dedicated and even hopeful that our work and the work of our partners will result in better outcomes for people and birds.
Created by Imgur user Fejetlenfej , a geographer and GIS analyst with a ‘lifelong passion for beautiful maps,’ it highlights the massive expanse of river basins across the country – in particular, those which feed the Mississippi River, in pink.
In a rather predictable — but still maddening — move, the off-road-vehicle lobby is suing the Bureau of Land Management over the agency’s Labyrinth Canyon and Gemini Bridges travel plan for off-highway vehicle use.
The BlueRibbon Coaltion, Colorado Off-Road Trail Defenders, and Patrick McKay are challenging the “illegal and arbitrary” closure of 317 miles of motorized routes on about 468 square miles of public land north and west of Moab between the Green River and Highway 191. The off-road coalition was already shot down once by the Interior Board of Land Appeals; now they’re taking their gripes to federal court, using the same spurious arguments.
Of course, these groups have every right to challenge federal agencies’ decisions; environmentalists do it all the time. But what’s maddening about these motorized-access groups is their intransigence — even arrogance — and stubborn unwillingness to compromise. They promise to “Fight for Every Inch” of motorized access to public lands, not for any real reason but as an end in itself, damn the consequences to the environment, the public, and wildlife.
The kerfuffle over the Labyrinth/Gemini plan is a perfect example.
Over the last couple of decades, vehicle traffic — and the impacts — have burgeoned on some 1,100 miles of motorized routes in the management plan’s area. The type of traffic has changed, too, shifting from the relatively slow-going and quiet jeeps and SUVs to the dune-buggyesque side-by-sides that have become increasingly popular in recent years. They go faster, are noisier, and kick up more dust than other vehicles. They also carry more people into the backcountry than a motorcycle or old-school ATV, thus multiplying the adverse effects.
For years, river runners, public lands advocates, and local residents and elected officials have been pushing the agency to get a handle on the traffic on the 300,000-acre slickrock expanse. Last year, the BLM came up with four alternatives, ranging from keeping the status quo to closing up to 437 miles of trails. Yes, the strictest alternative would have closed less than half of the routes to vehicles, leaving almost 700 miles open to some form of motorized travel. In other words it was a compromise that favored the motorized crowd.
But even that went too far for the BLM, which ultimately shut down just 317 miles of motorized routes, while limiting motorized travel (to motorcycles or smaller ATVs, for example) on 98 miles. In other words, you can still burn gasoline and spew exhaust on more than 800 miles of routes on this one relatively small swath of public land. Meanwhile motorized travel remains mostly unrestricted on more than 10,000 miles of roads, two-tracks, and old trails in southeastern Utah.
There are still a lot of roads open under the new travel plan. Credit: The Land Desk
That’s not enough for the BlueRibbon Coalition and friends, however; it’s never enough for them. They are ideologically opposed to decommissioning even the most insignificant road spur, and they and their allies in local and state government will squander millions of taxpayer dollars to fight the closures. Their reasoning? Because OHV recreation is, in the words of the lawsuit, “a way of life in the American West.”
Really? I mean, it’s the same trope rolled out whenever someone tries to get a coal plant to stop belching pollution all over folks or a mine to stop defiling the streams. In those instances it may have some validity: The move could affect the miners’ or the coal plant workers’ livelihoods, and therefore their way of life. But these folks will still be able to ride their noisy machines around on hundreds of miles of roads. Believe me: Nothing about this plan will affect their way of life.
I highly doubt the motorized coalition will prevail; even the most conservative judges are unlikely to fall for their faulty legal reasoning. And so, the plan likely will remain in place, as it should. It’s a compromise, and an admittedly crappy one for those of us who would like to see a lot fewer vehicles — and people — trampling the landscape. After all, it still leaves the sprawling road network mostly intact. But maybe it’s the best we can expect, and at least it does something. And it will make it just a little easier for the quiet users, the bighorn sheep, the coyotes, and the silence to find a bit of refuge from the incessant whirr of combustible engines and the humans driving them.
Bighorns, along the Colorado River. Photo: Brent Gardner-Smith/Aspen Journalism
I hate to start out the New Year with kind of grim news, but it’s sure not looking good out there as far as snow goes. In fact, many parts of the West are experiencing one of their thinnest Jan. 1 snowpacks in the last two decades. And the last two decades, as you probably now, were generally lousy.
A dearth of precipitation is the main problem, of course, but abnormally warm temperatures aren’t helping matters. And remember, “normal” is based on the three decades between 1991 and 2020, which was a heck of a lot warmer than the previous three decades, which in turn was balmier than all the decades before that back to 1901. Seems like something’s going on here, eh? I wonder what?
Take the Great Falls, Montana, area, where the average temperature for the month of December was 37.6 degrees Fahrenheit, nearly 12 degrees above normal. On one day, the high reached a whopping 64 F (a daily record) and the low dropped only to a balmy 51 F, for a daily average that was almost 30 degrees above normal. Meanwhile, the region received just .08 inches of precipitation for the month. Some more stats to ponder:
31: Number of monthly high maximum temperature records tied or broken across the West in Dec. 2023.
100: Number of monthly high minimum temperature records tied or broken across the West in Dec. 2023, including a 57 degree overnight low in Troutdale, Oregon, on Dec. 5 and 46 degrees in Benchmark, Montana, a whopping 5 degrees higher than the previous record low set in 2020.
0: Number of lowest minimum temperature records set across the West during December.
Wyoming seems to be bearing the brunt of the aridification this year. Statewide, the snowpack is now lower than ever recorded for the first of January. Ack.
And check out these stats from the National Weather Service’s Riverton, Wyoming, office:
Colorado is generally dry, as well, especially in the southwestern corner.
And Oregon? Blargh.
The only kind of bright spot seems to be in the Gila River Basin in southern New Mexico, where a good storm brought things up to the median for the period of record:


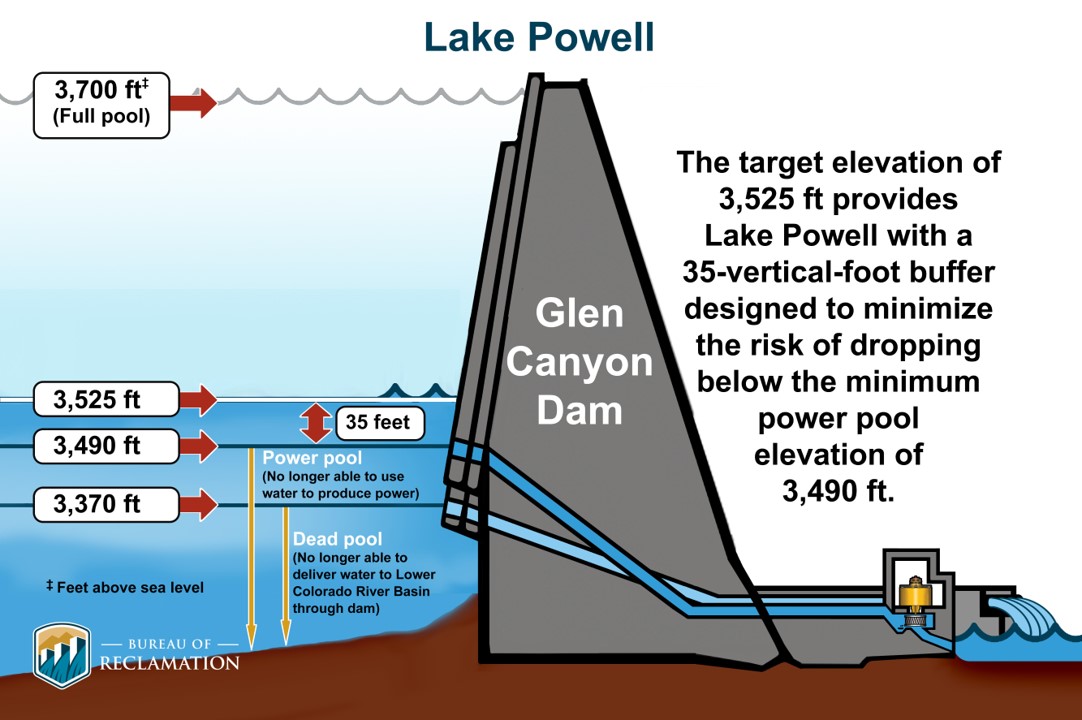

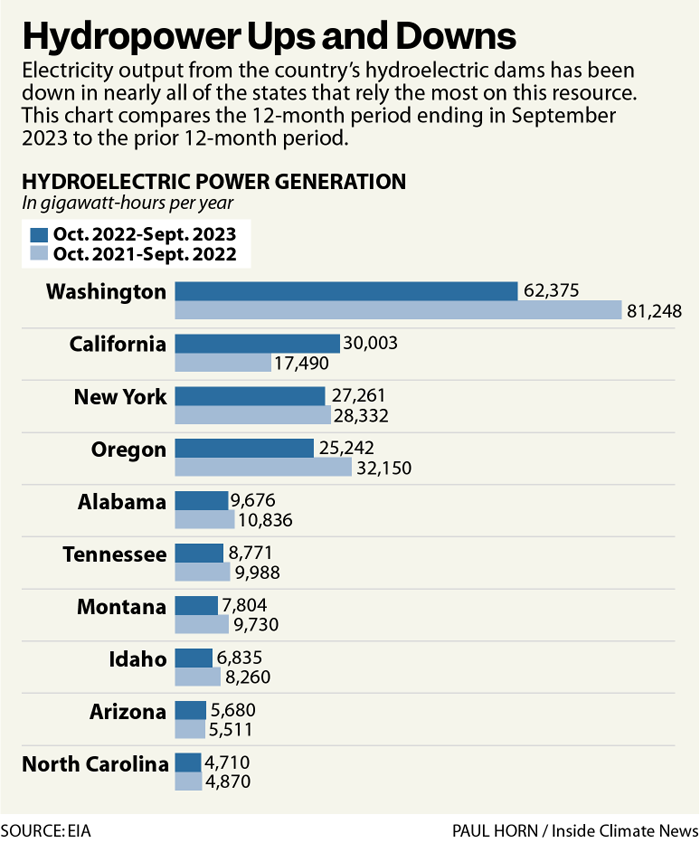
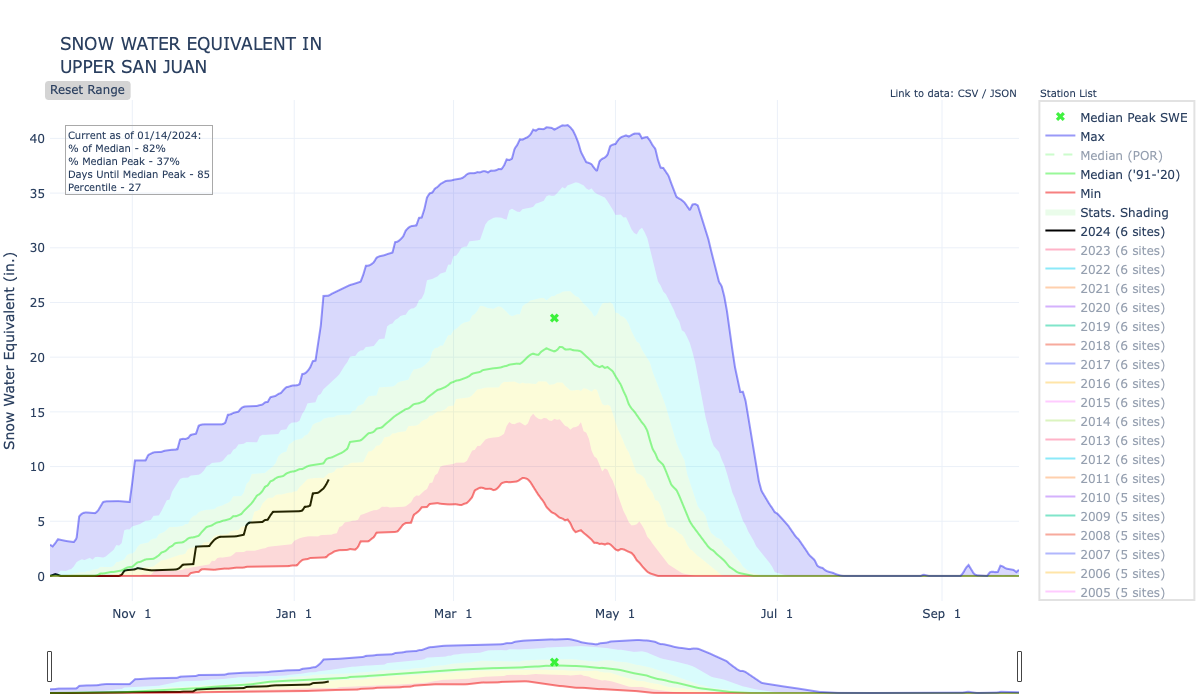


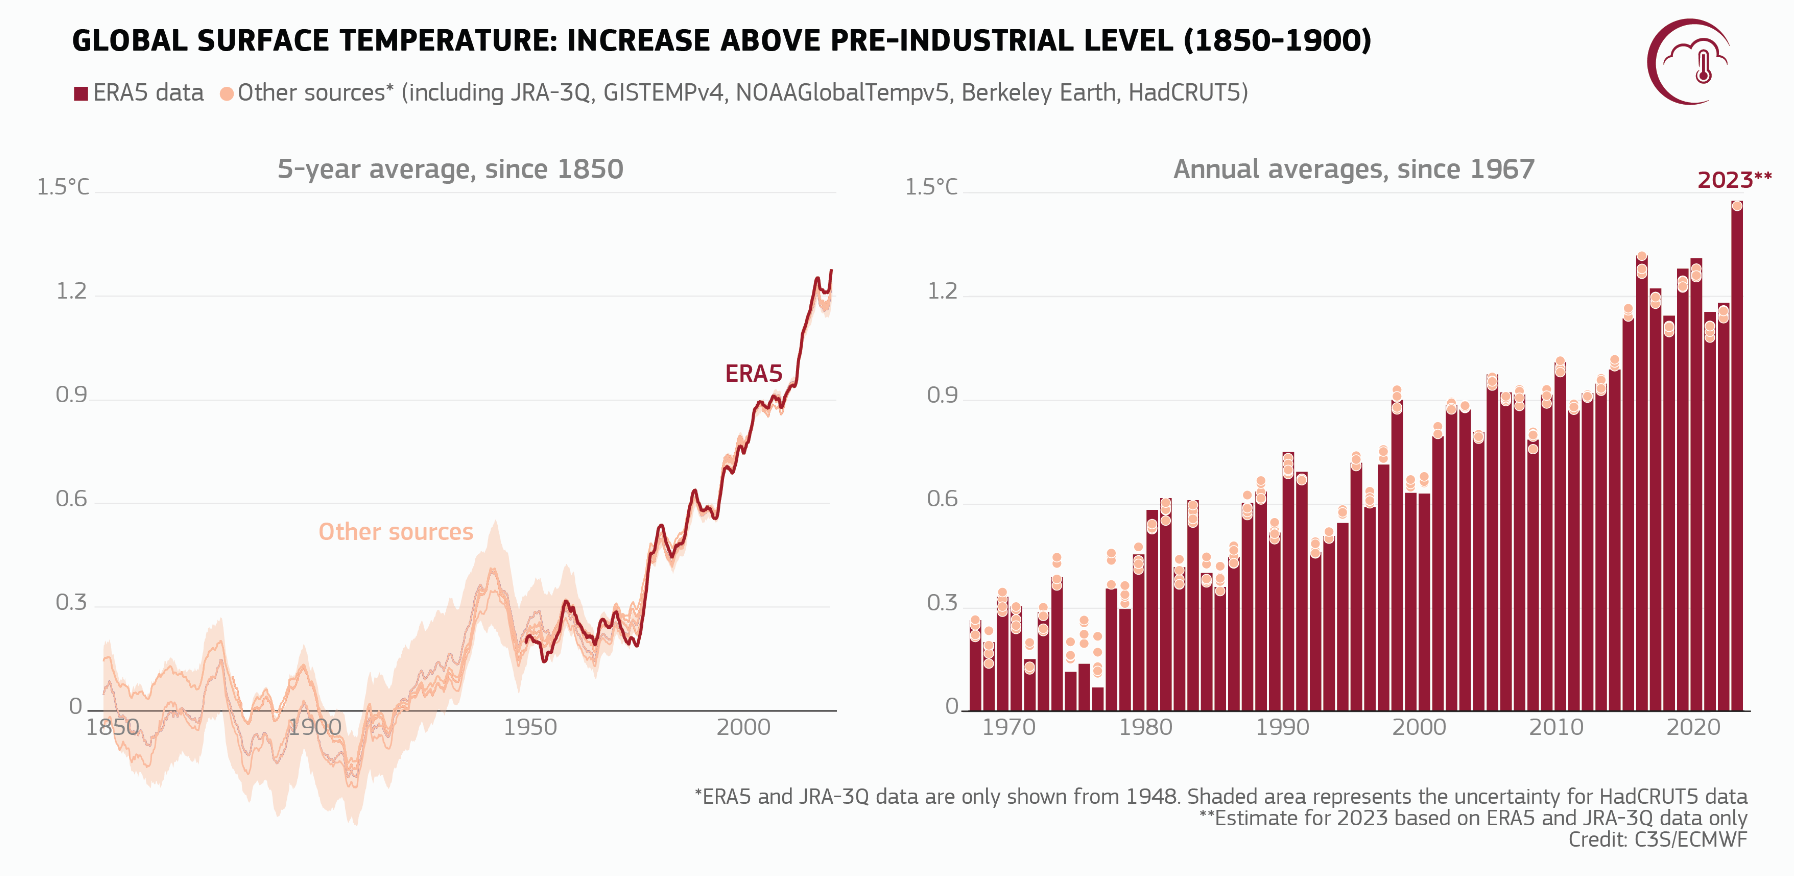
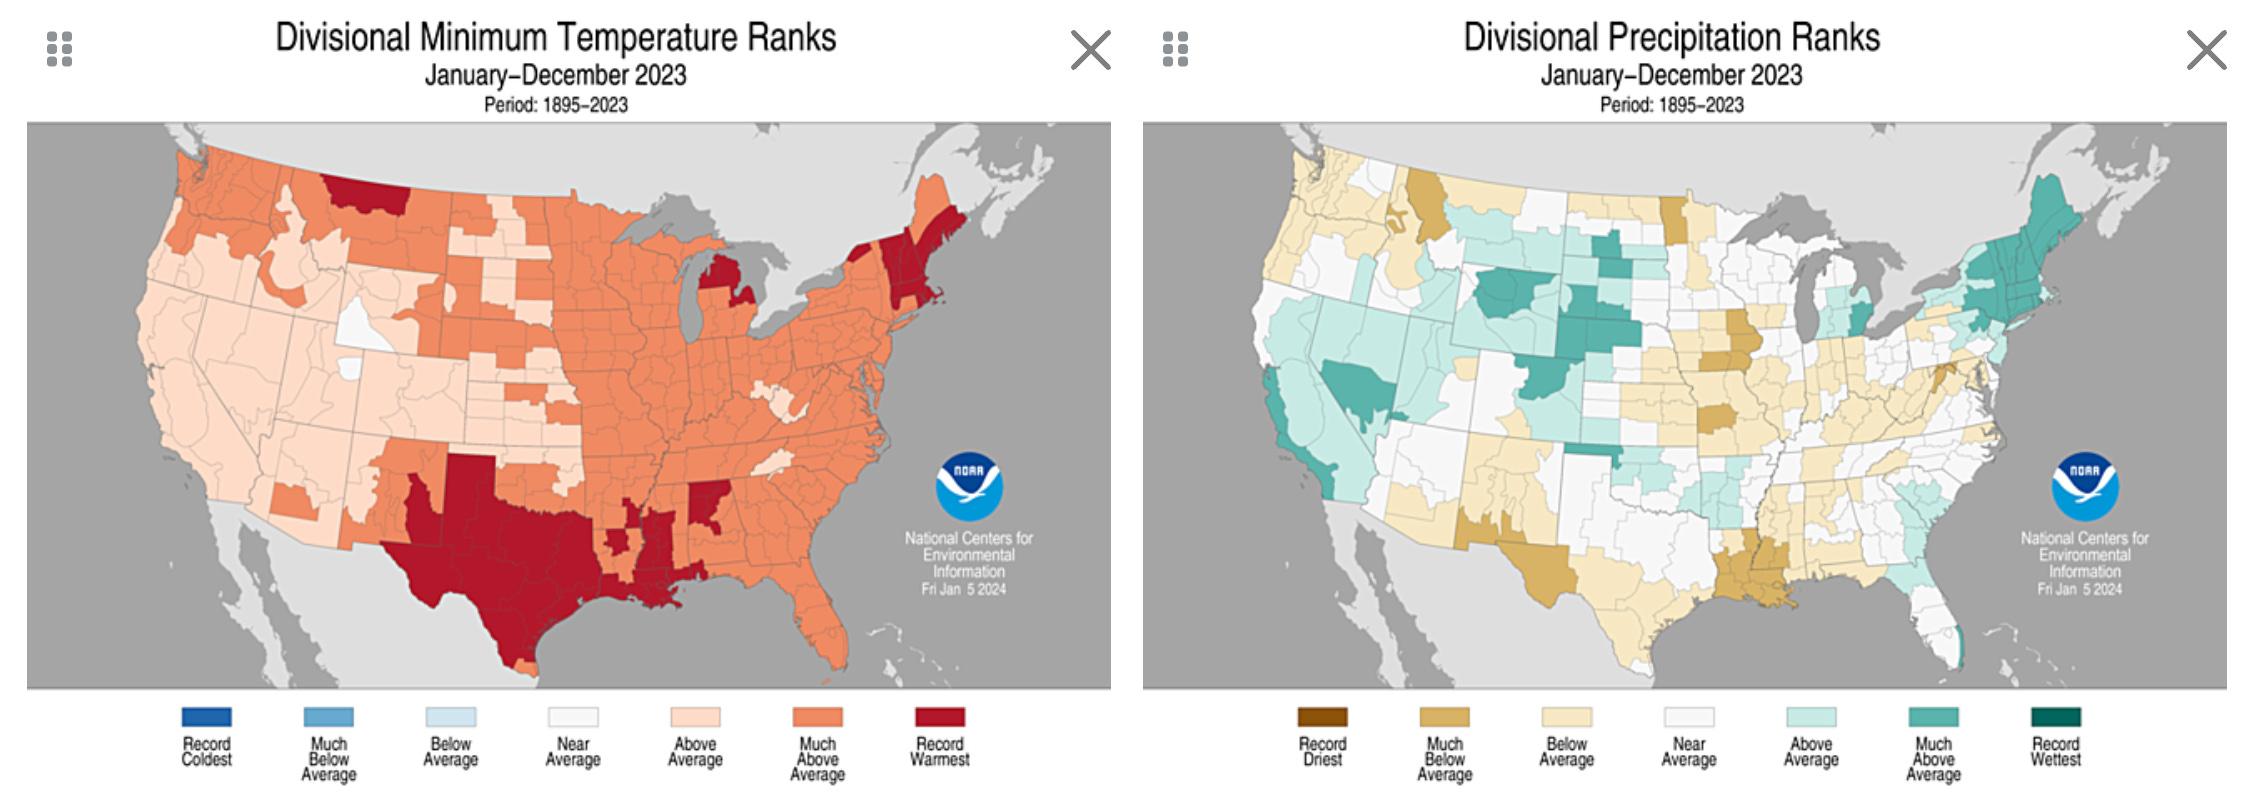
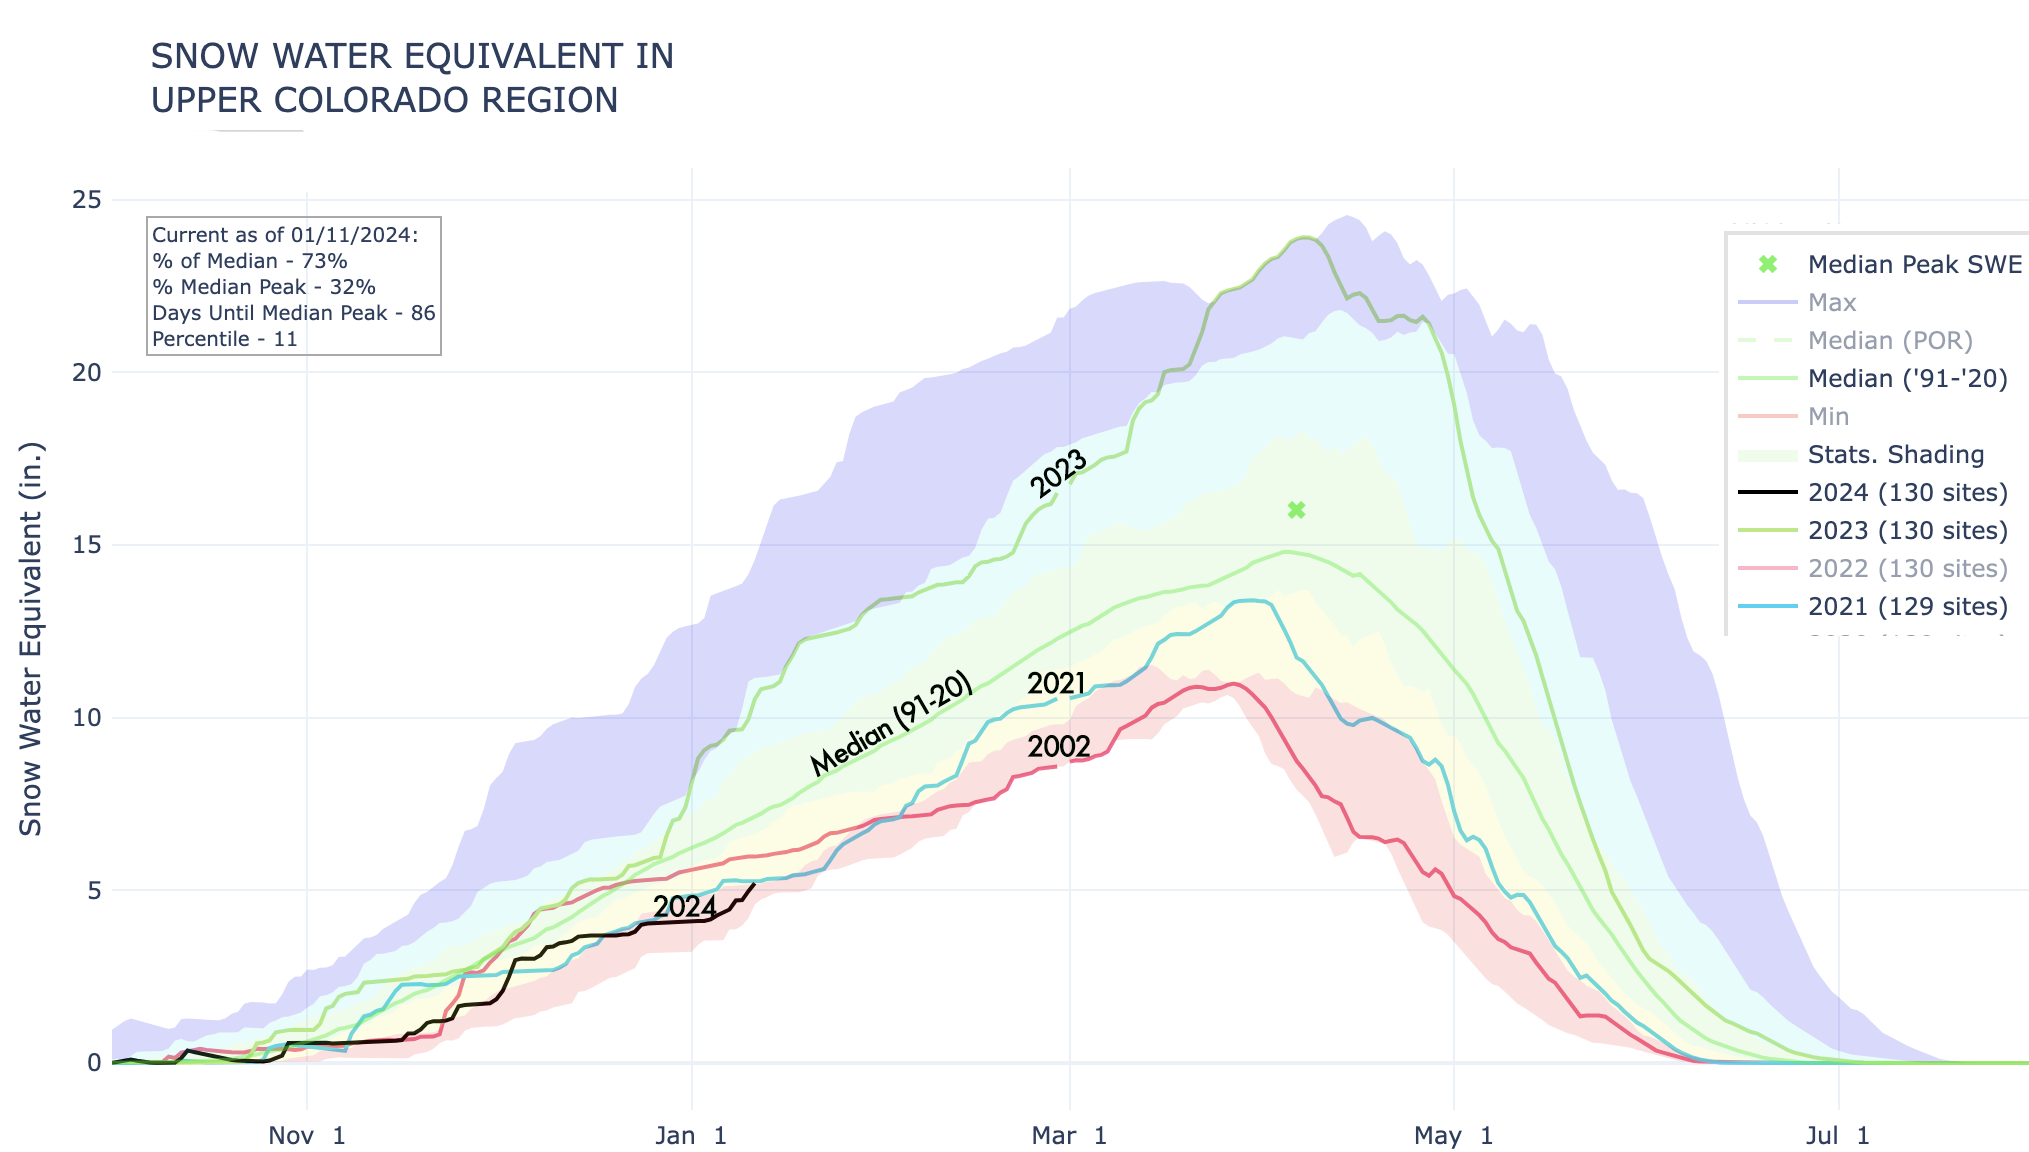
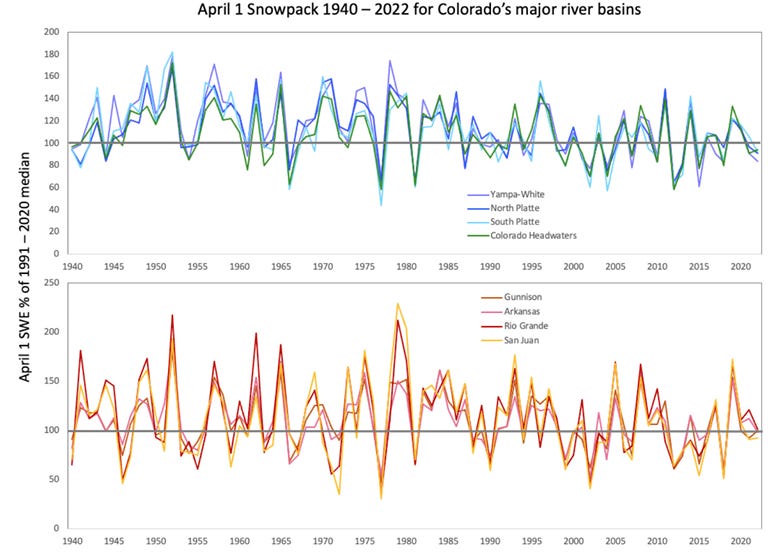
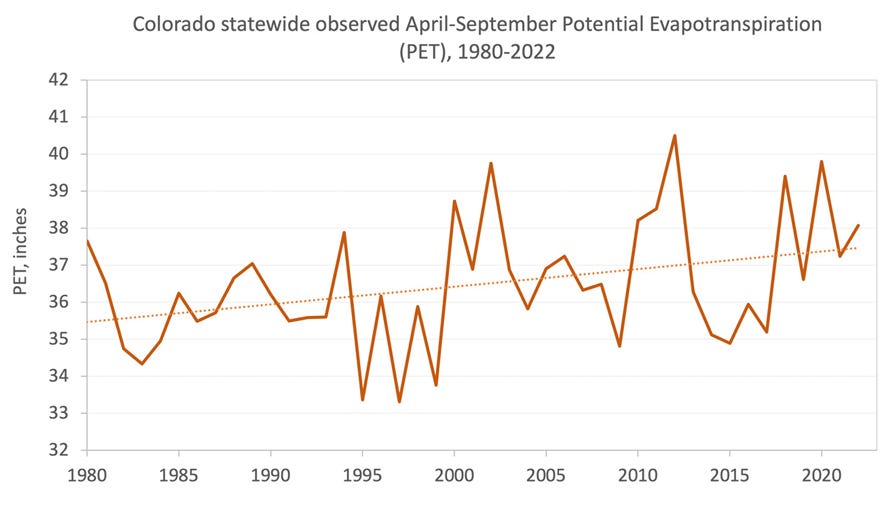
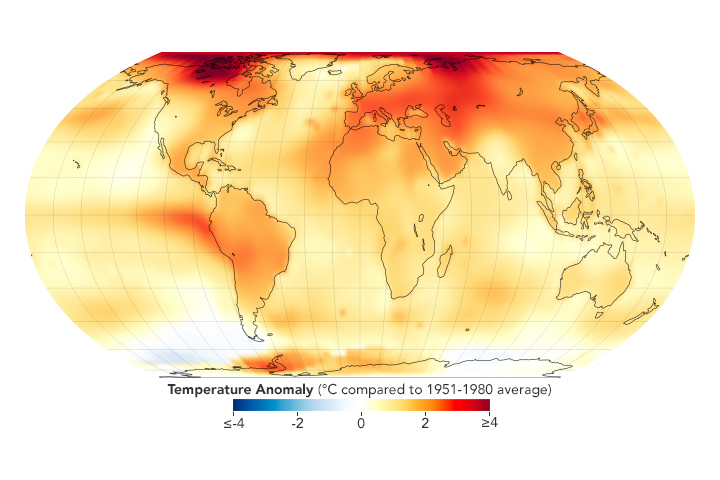
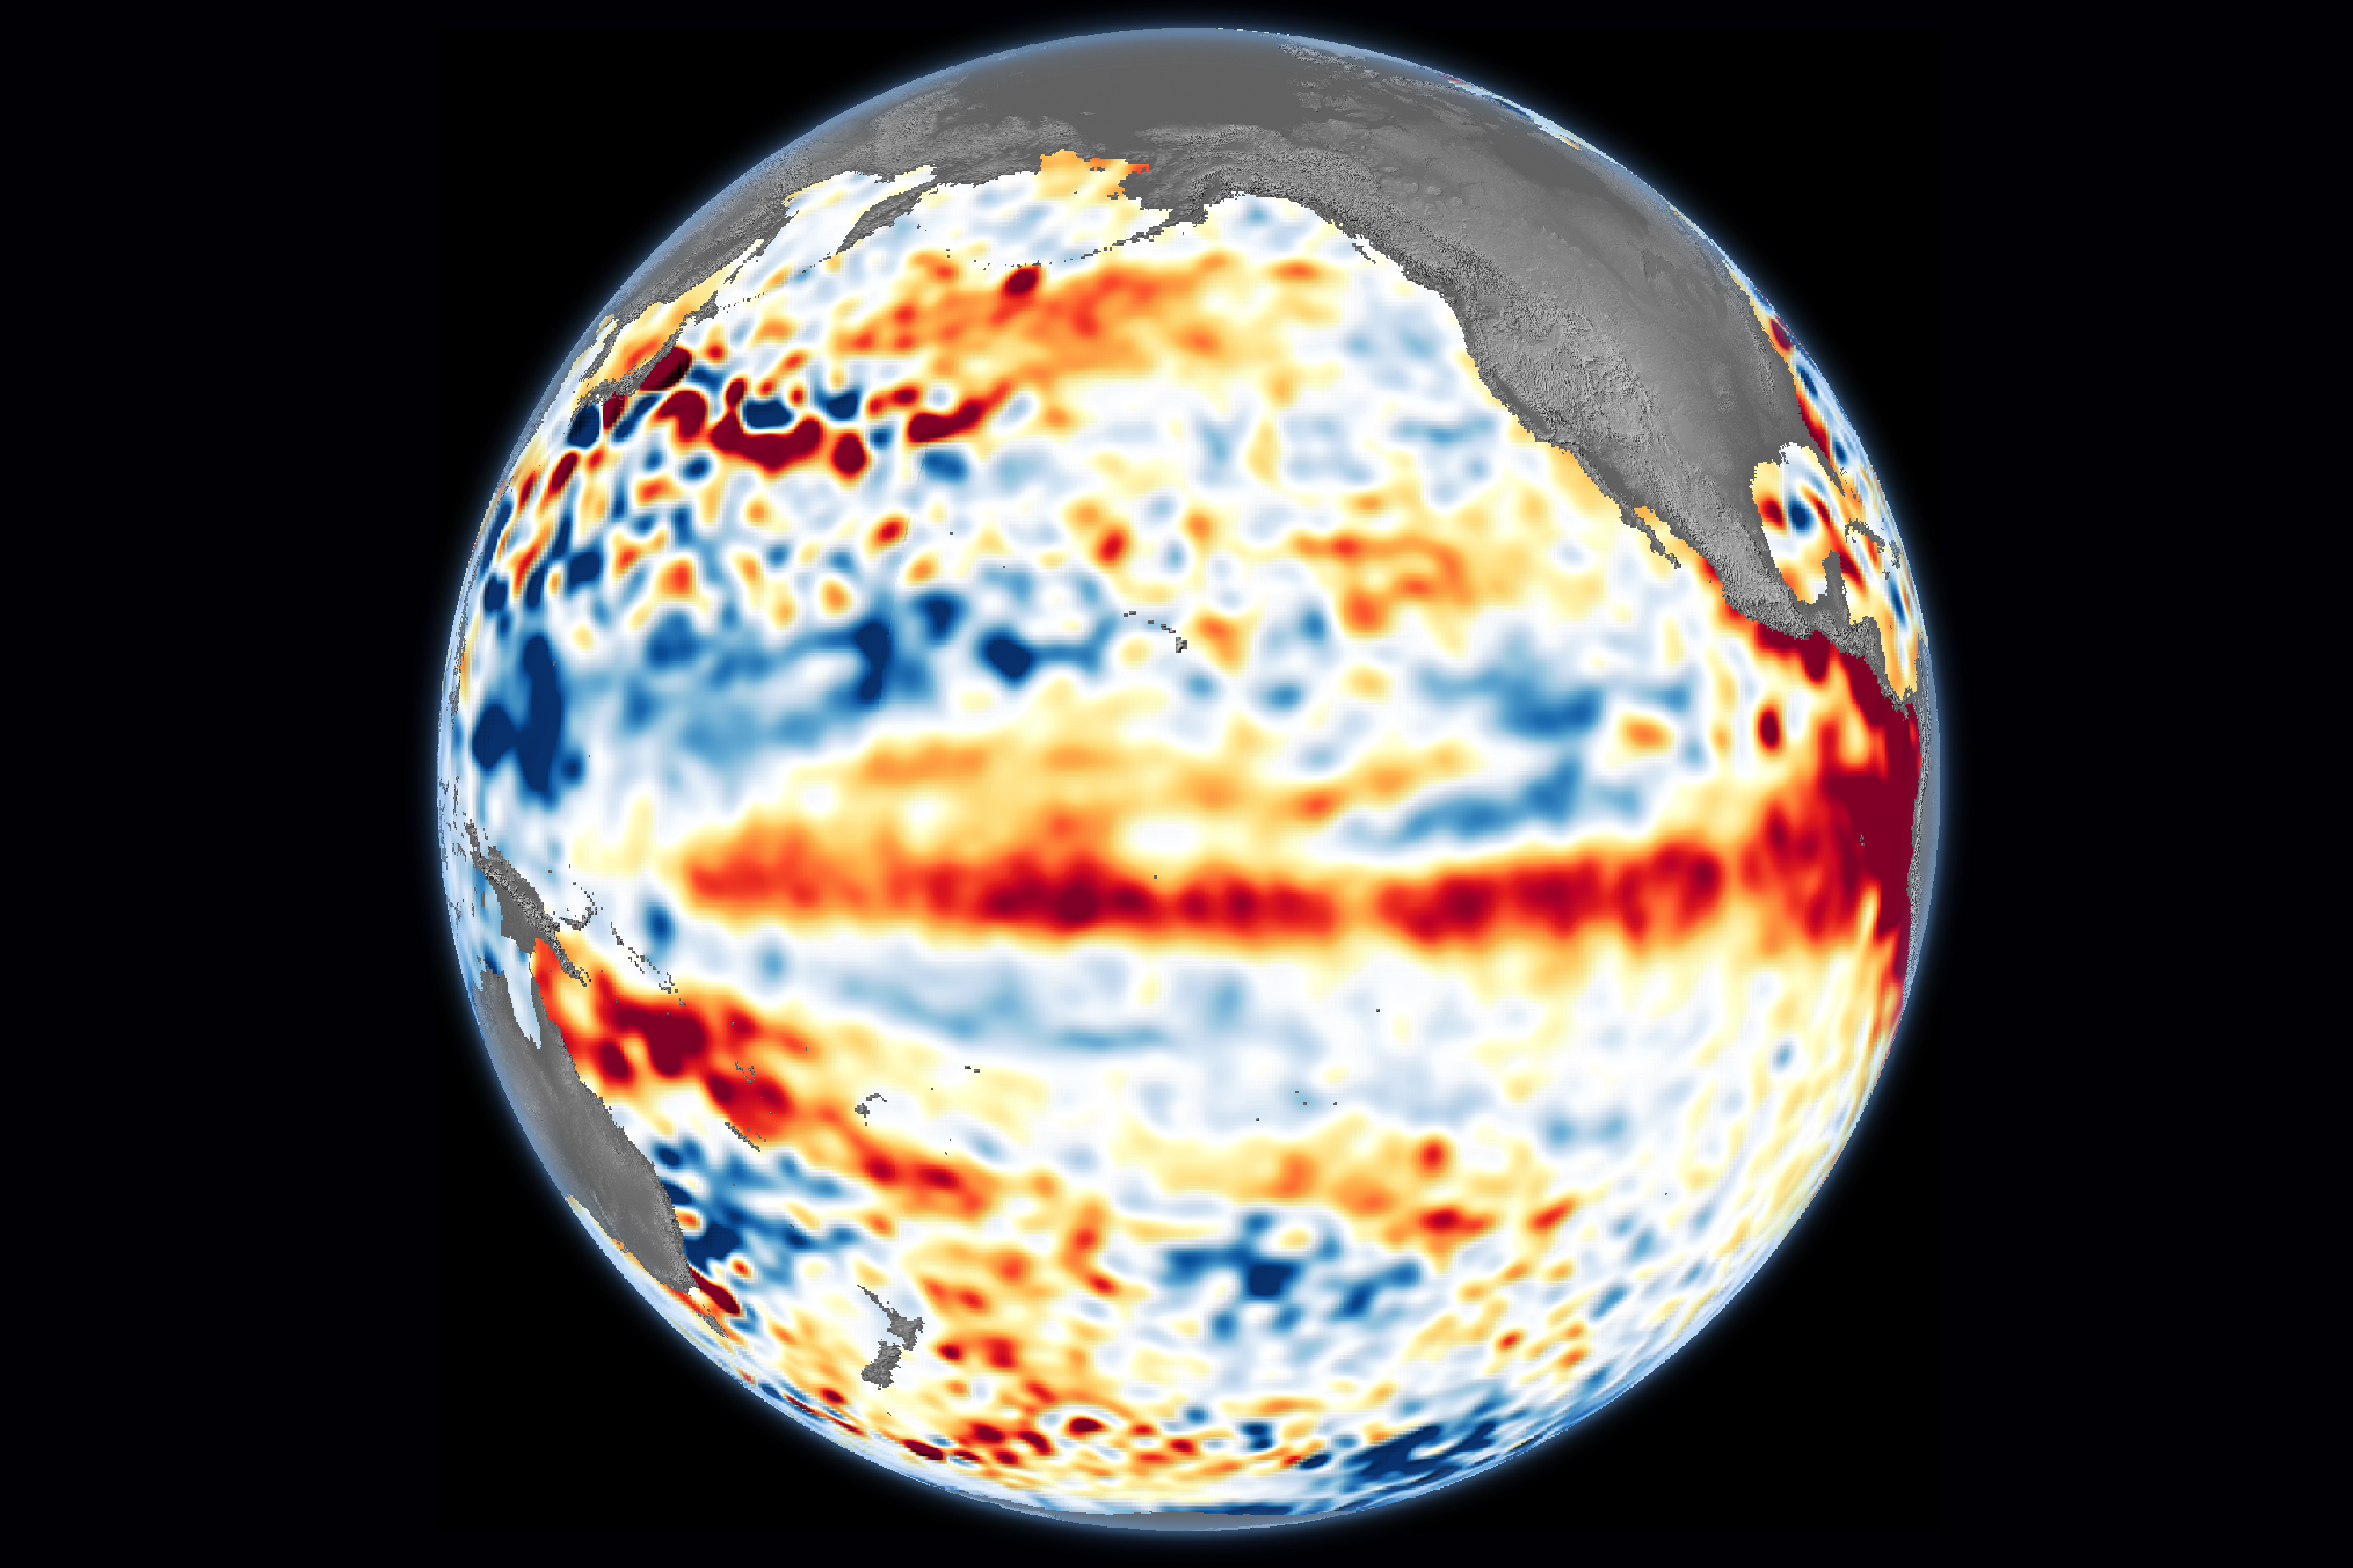
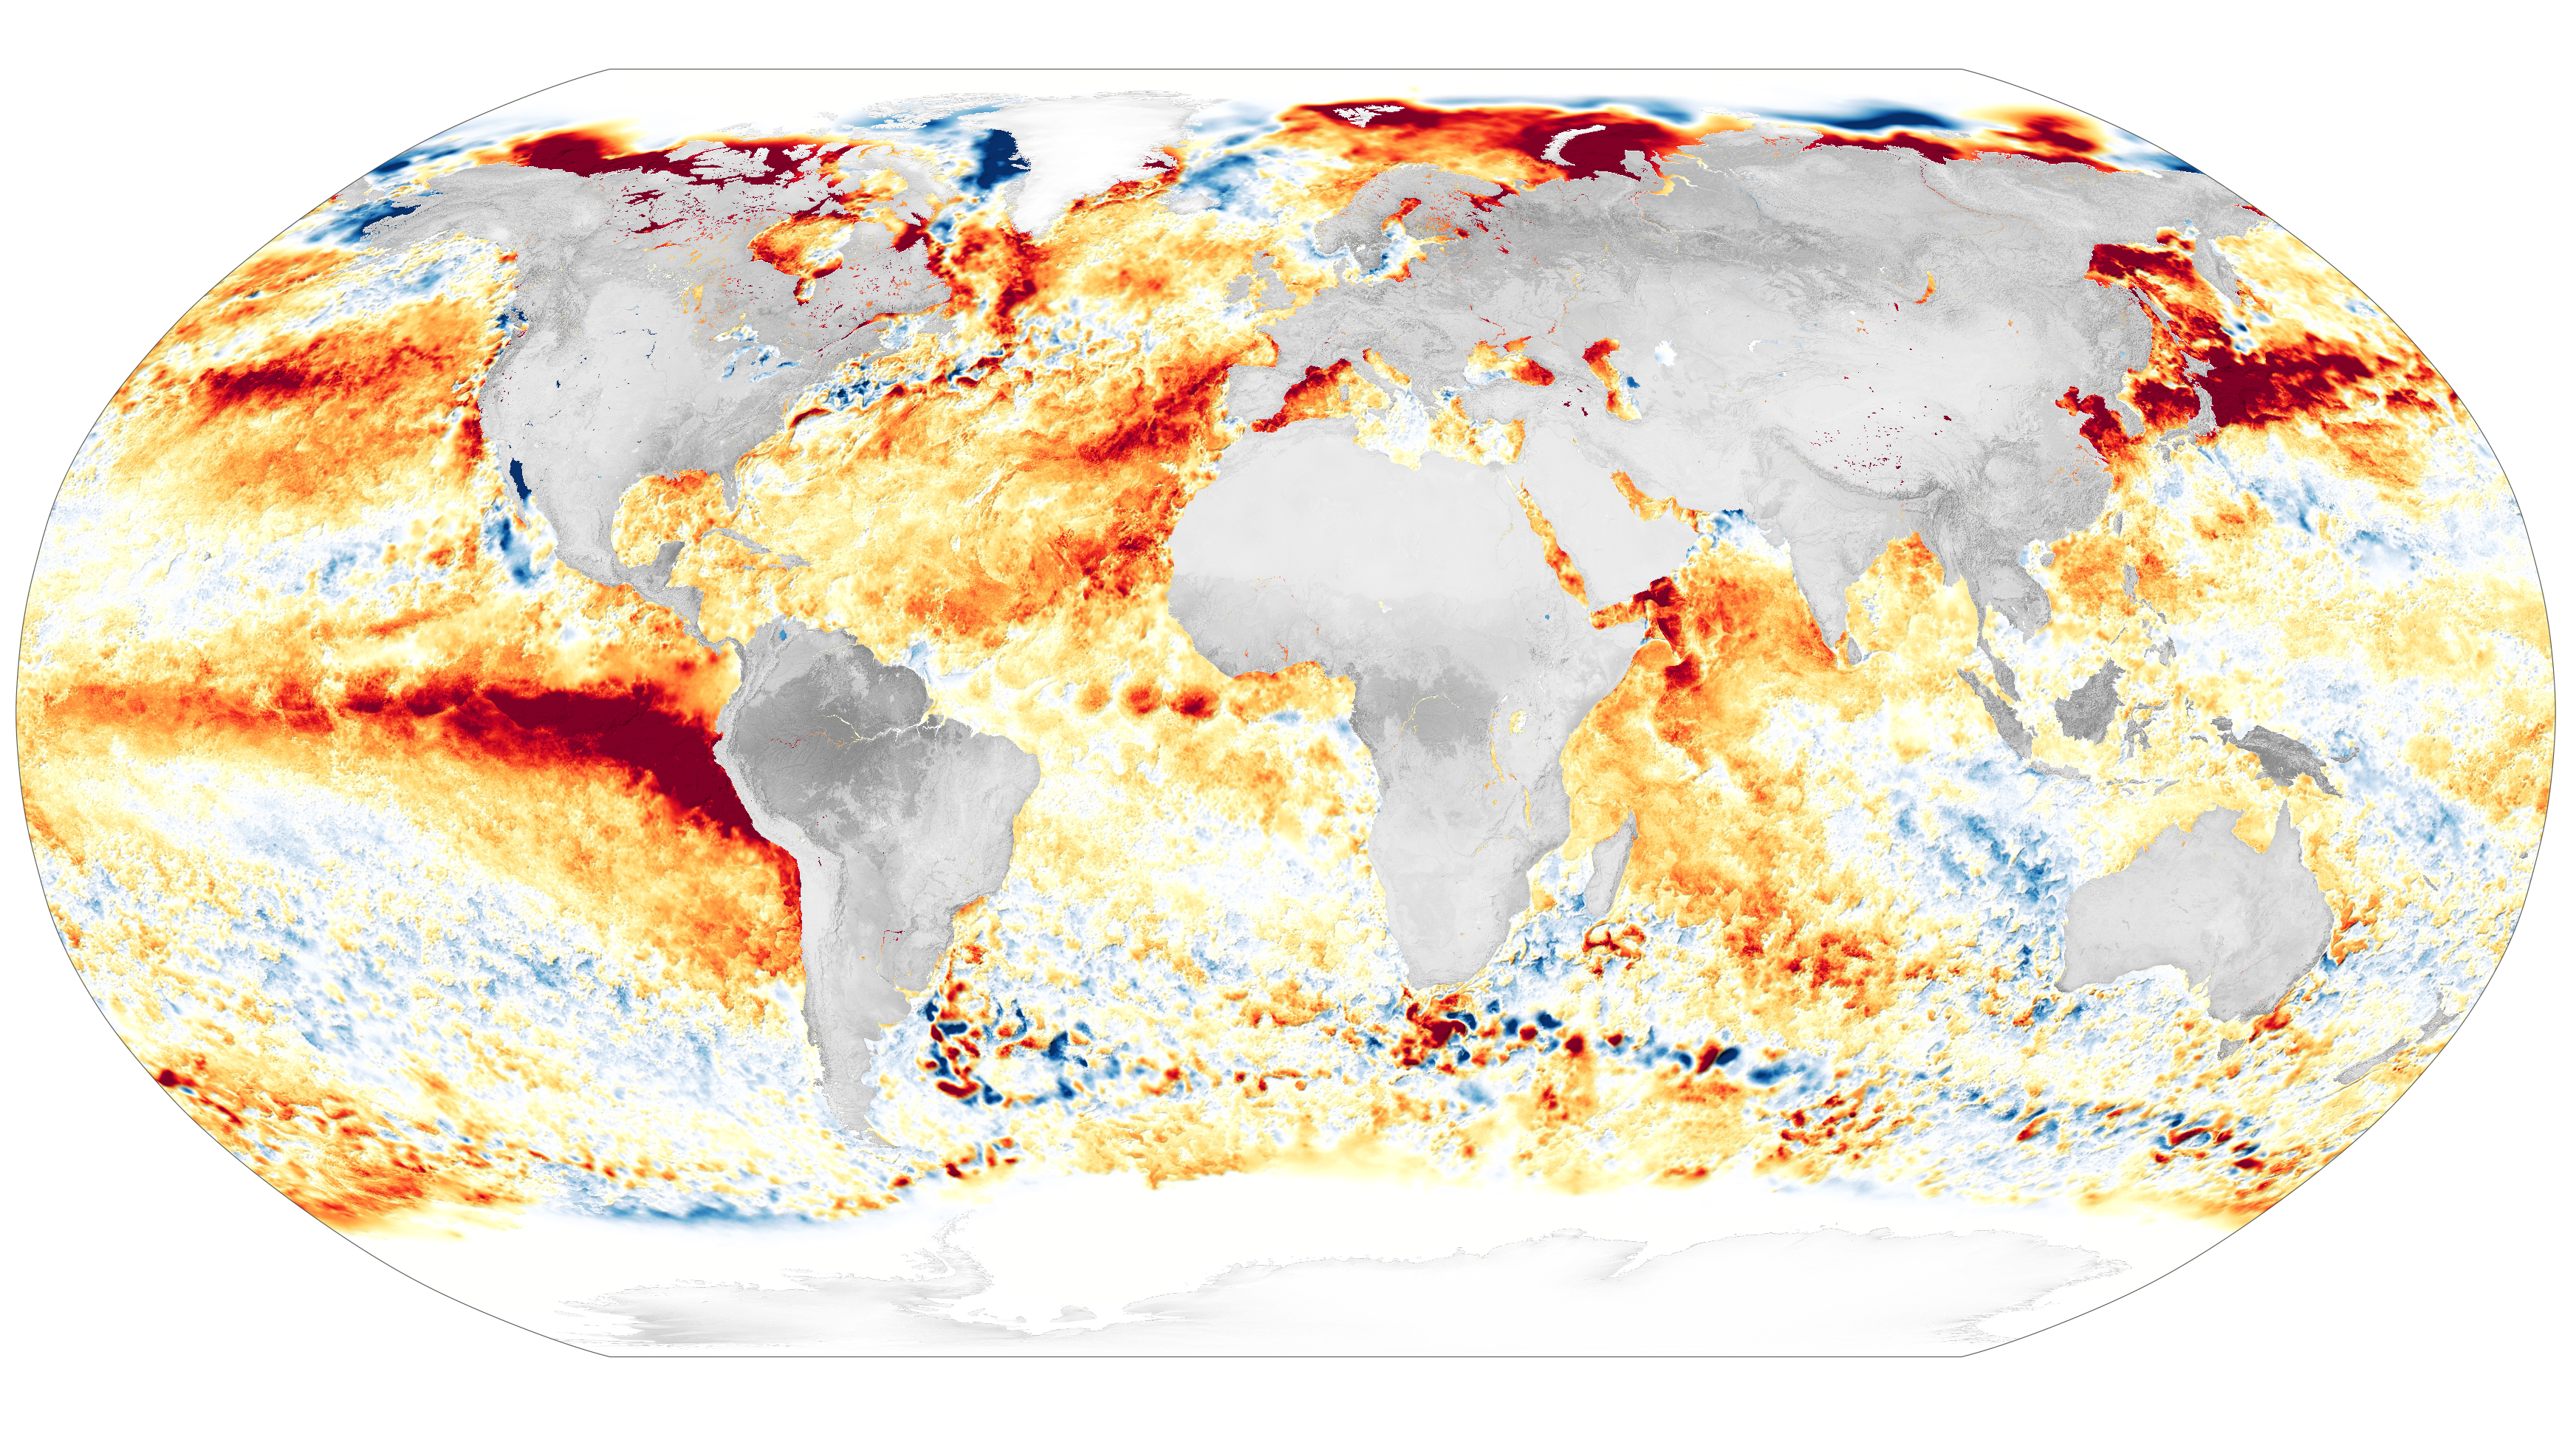
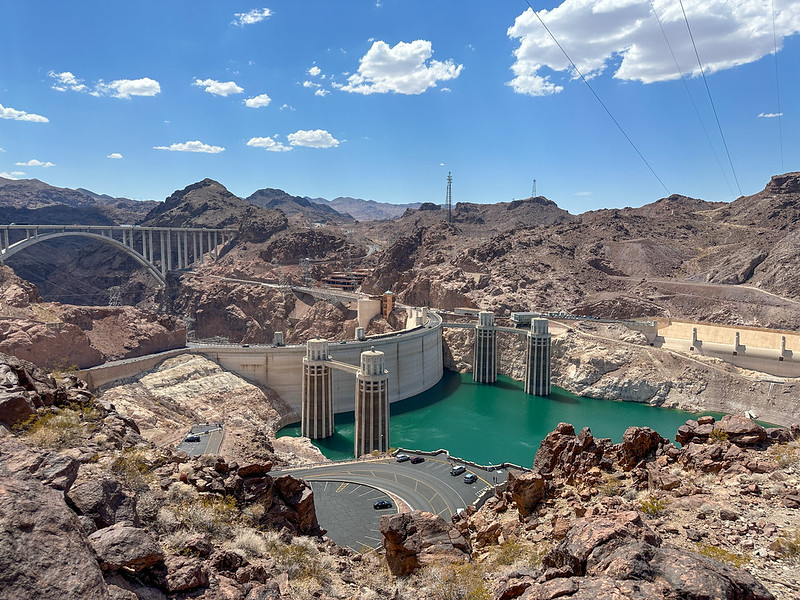


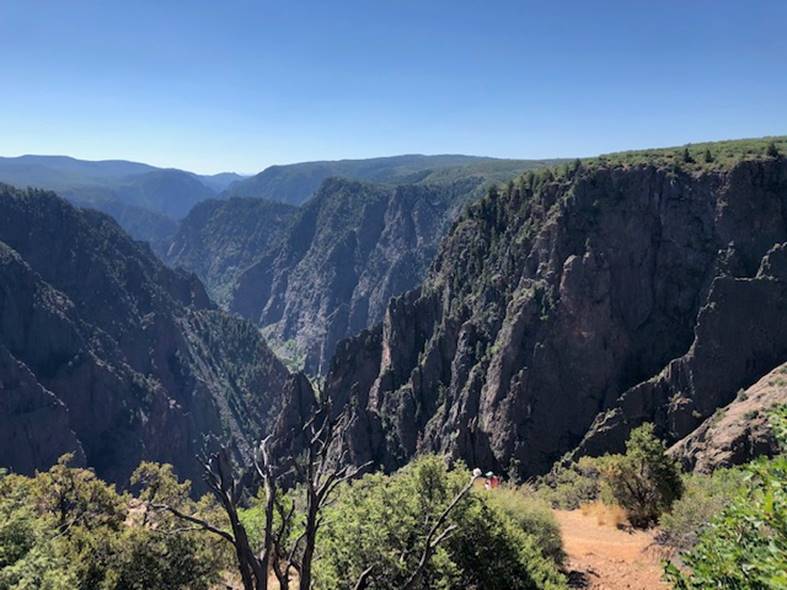


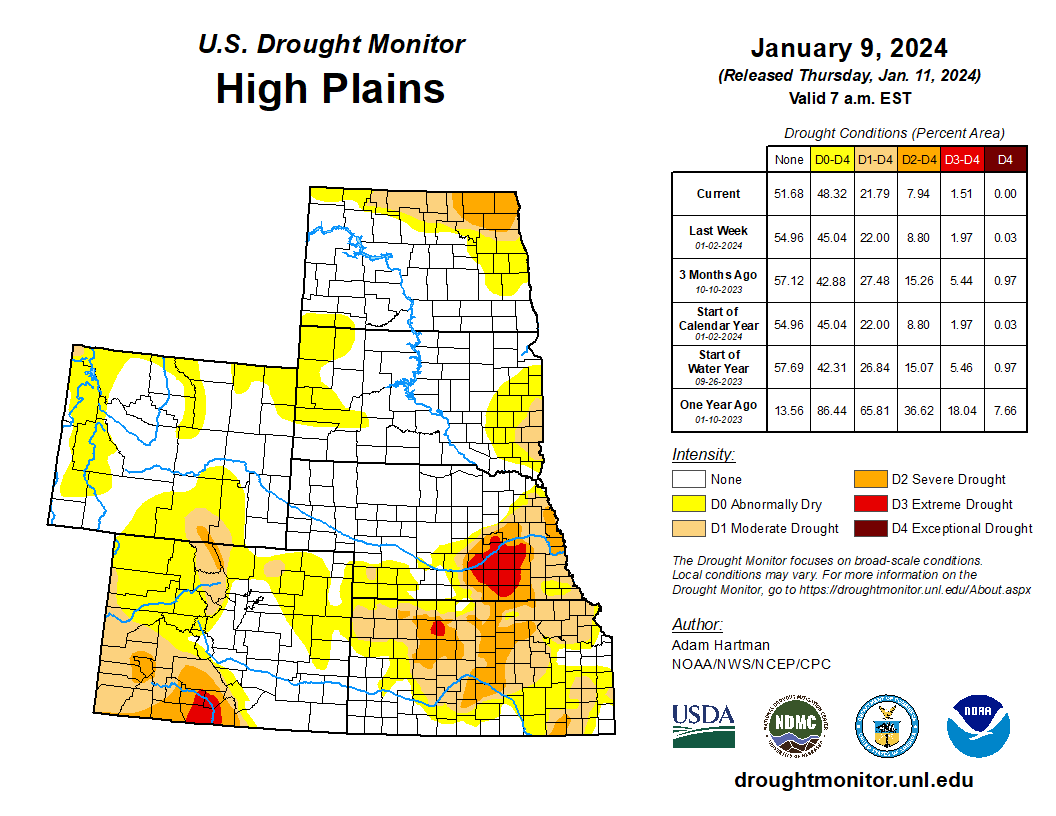
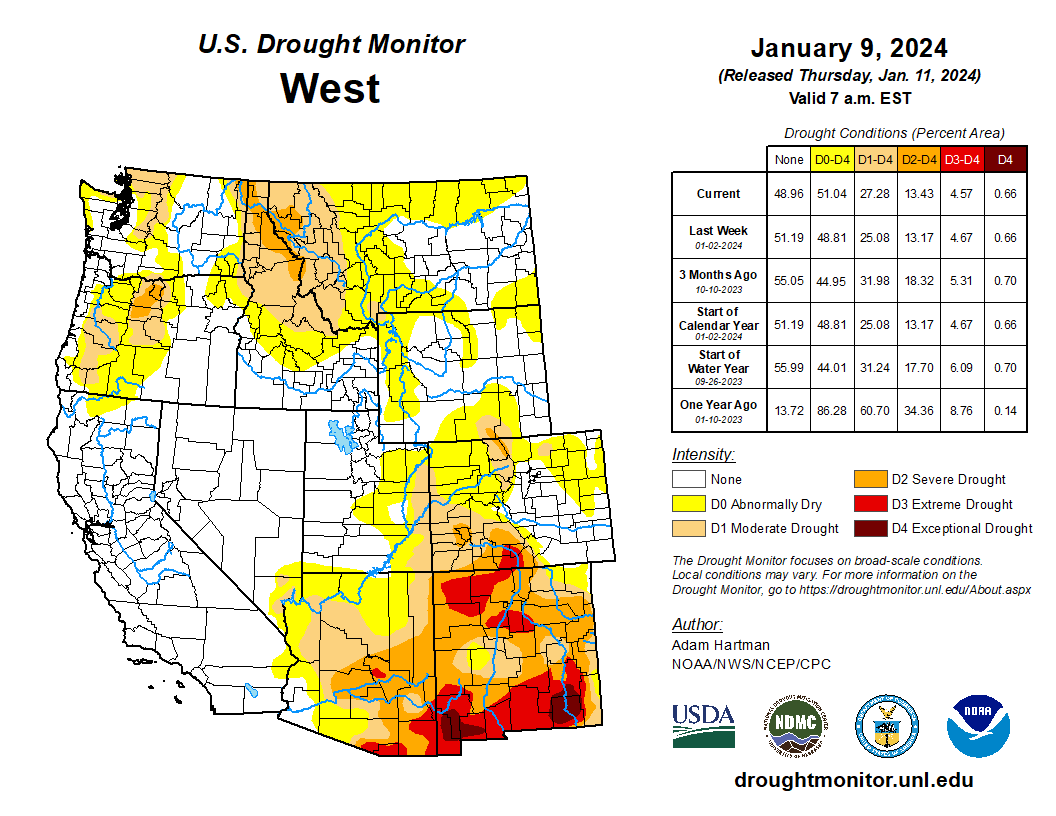
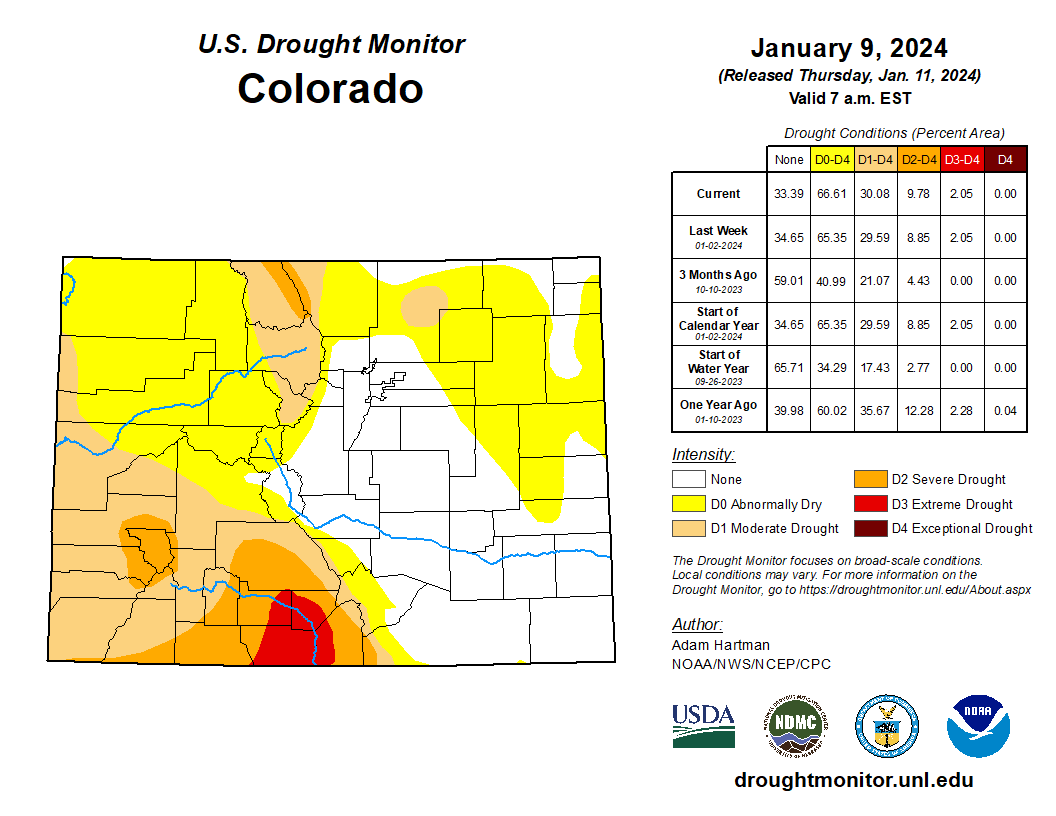
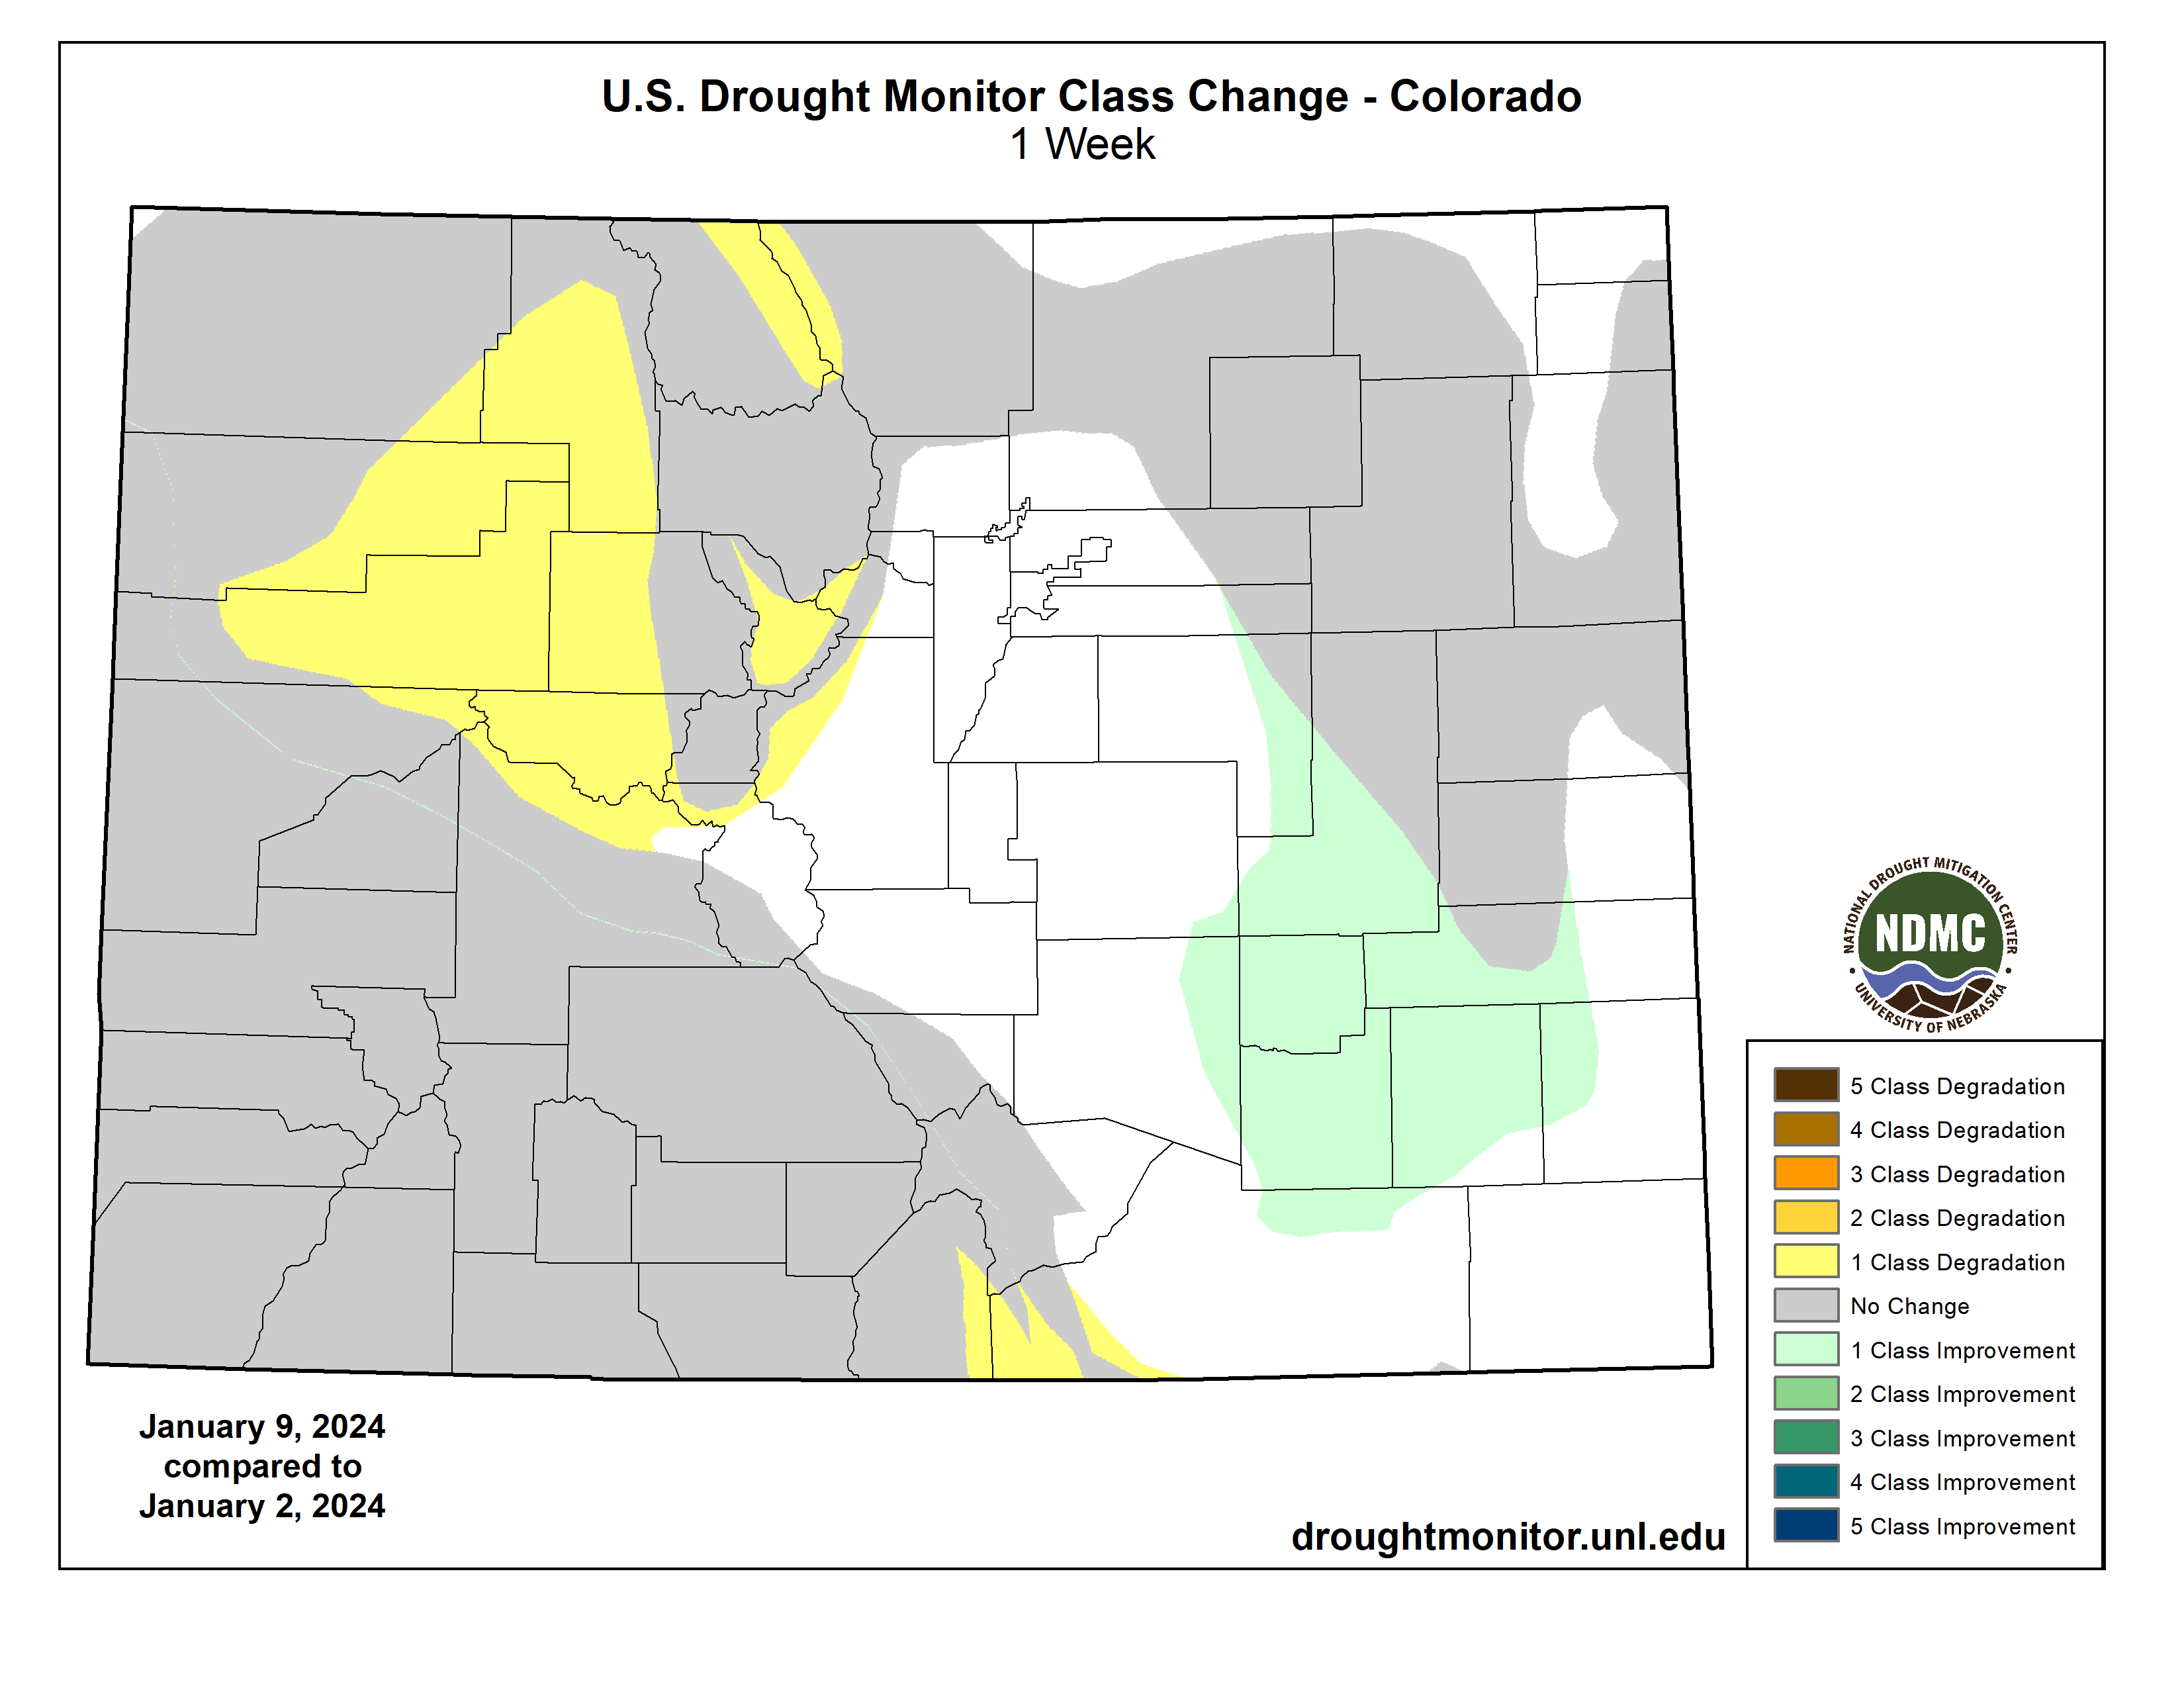
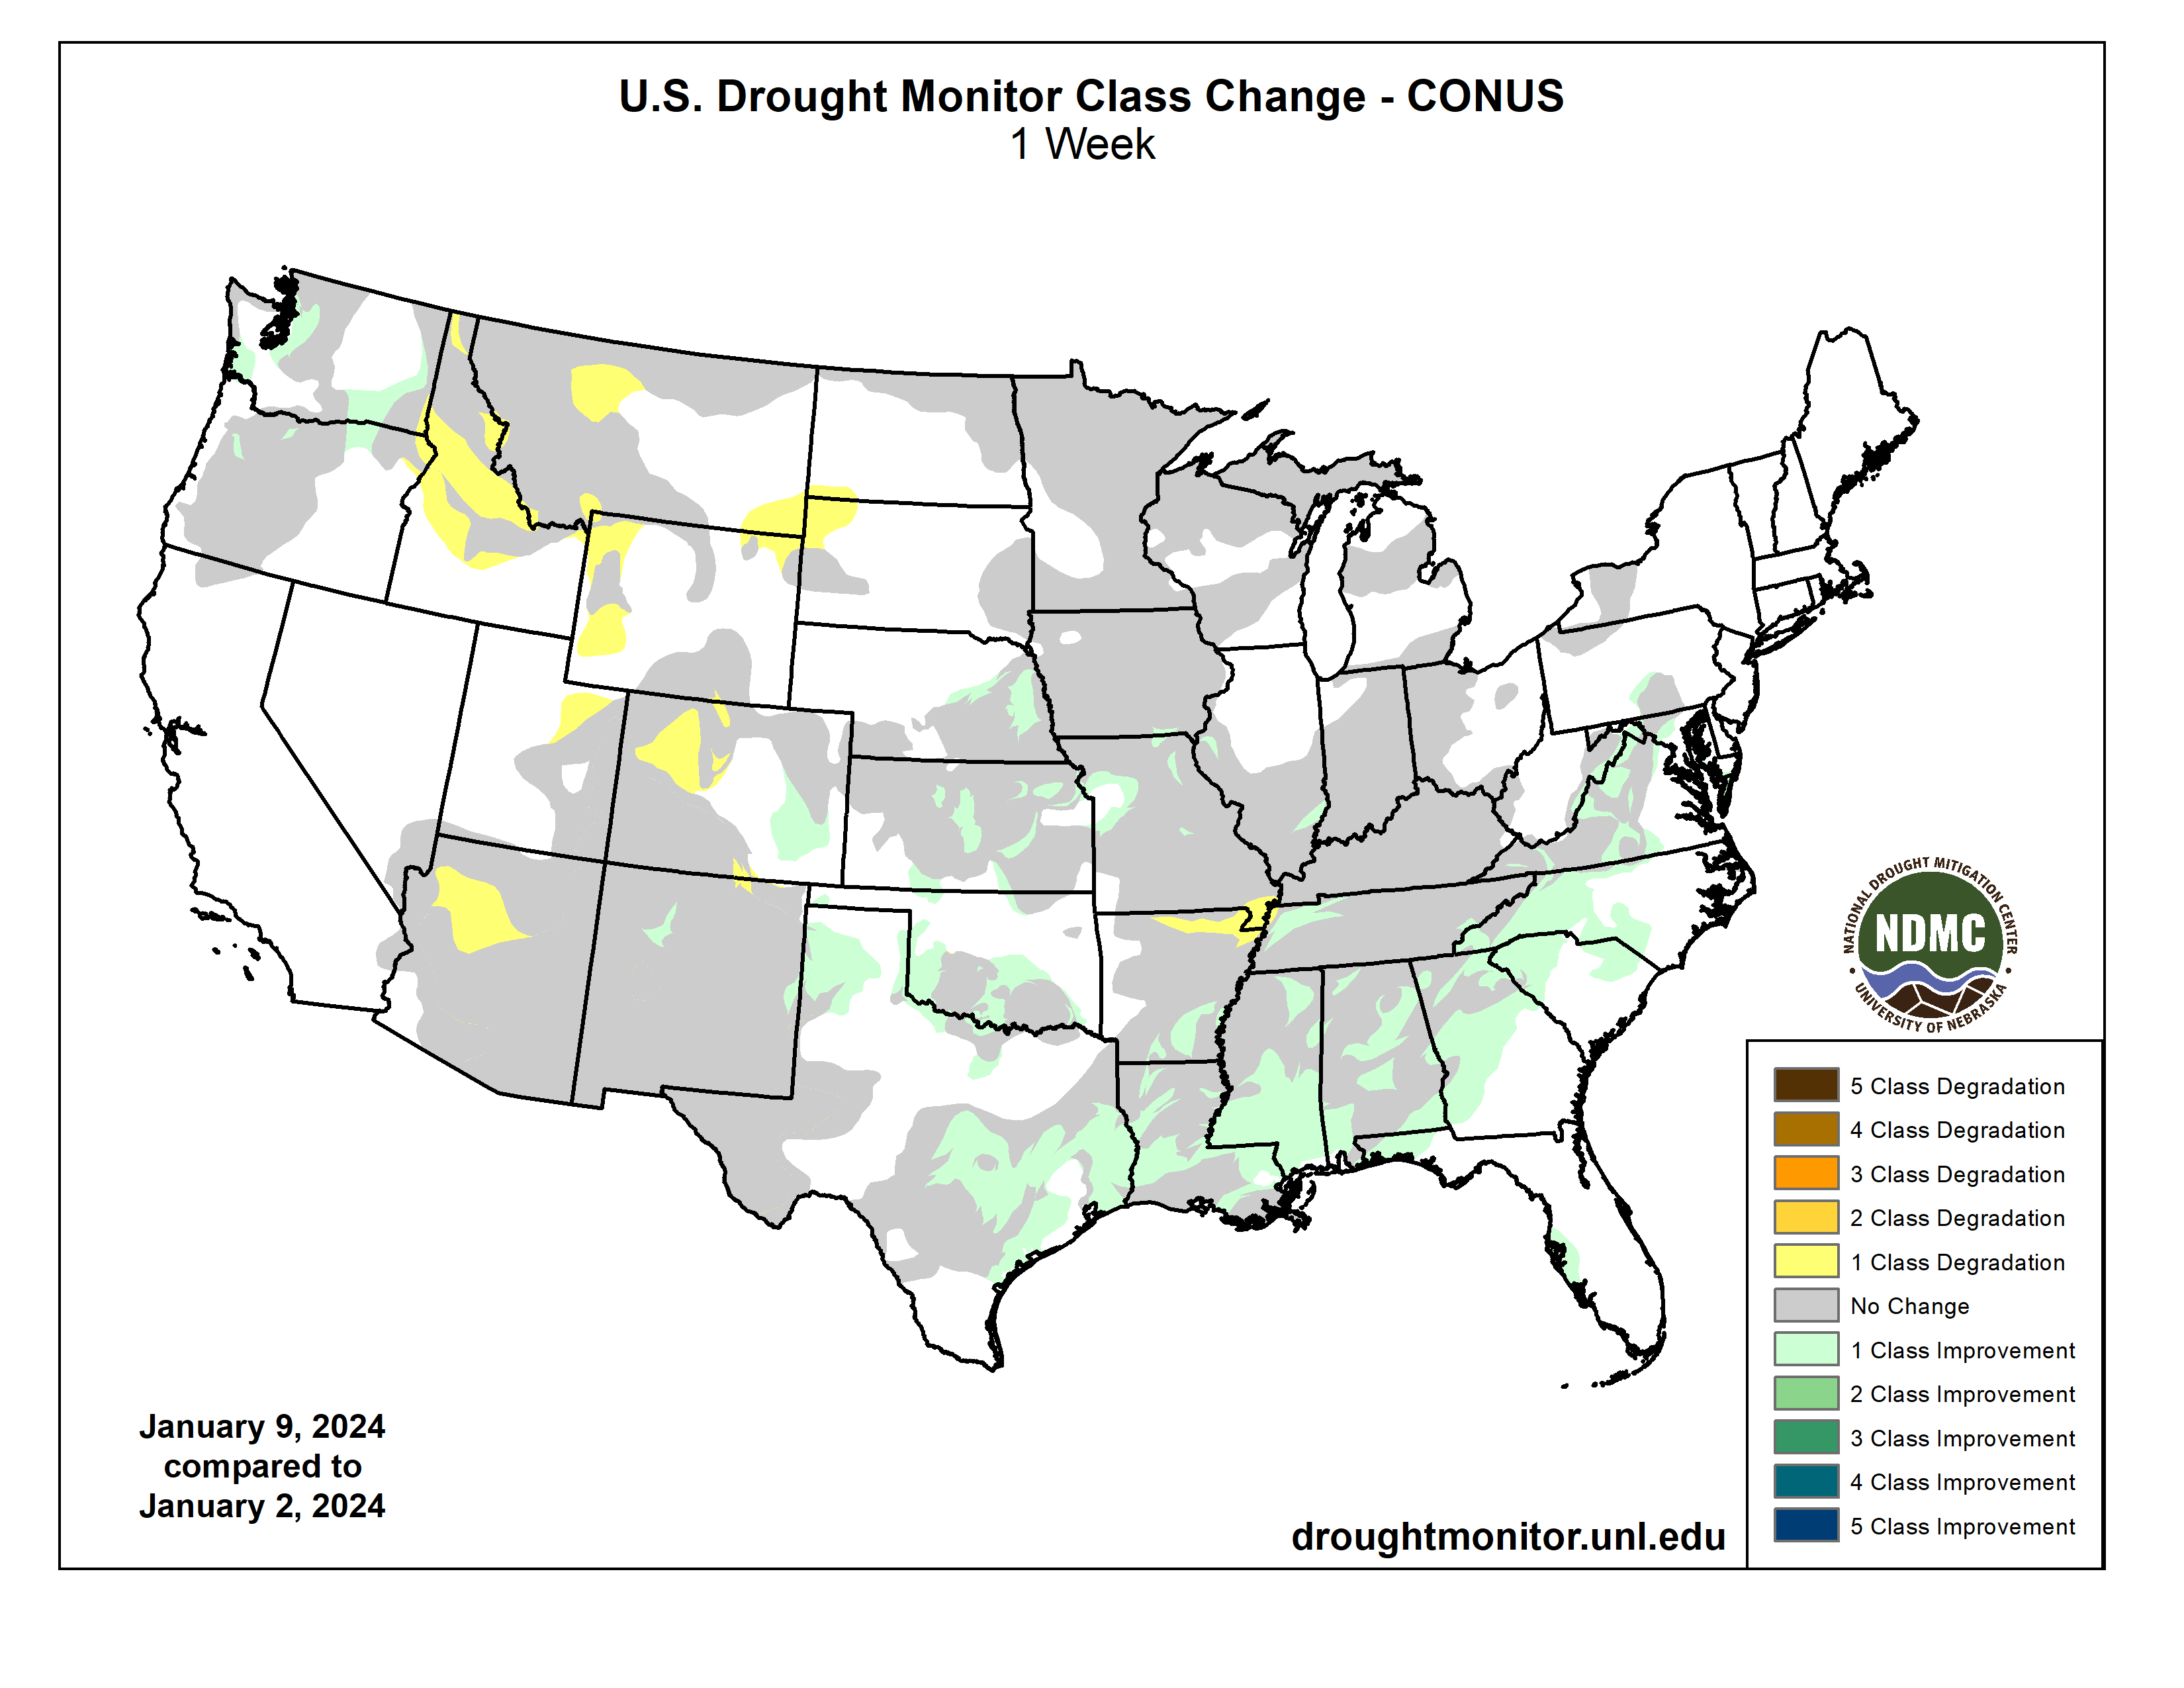
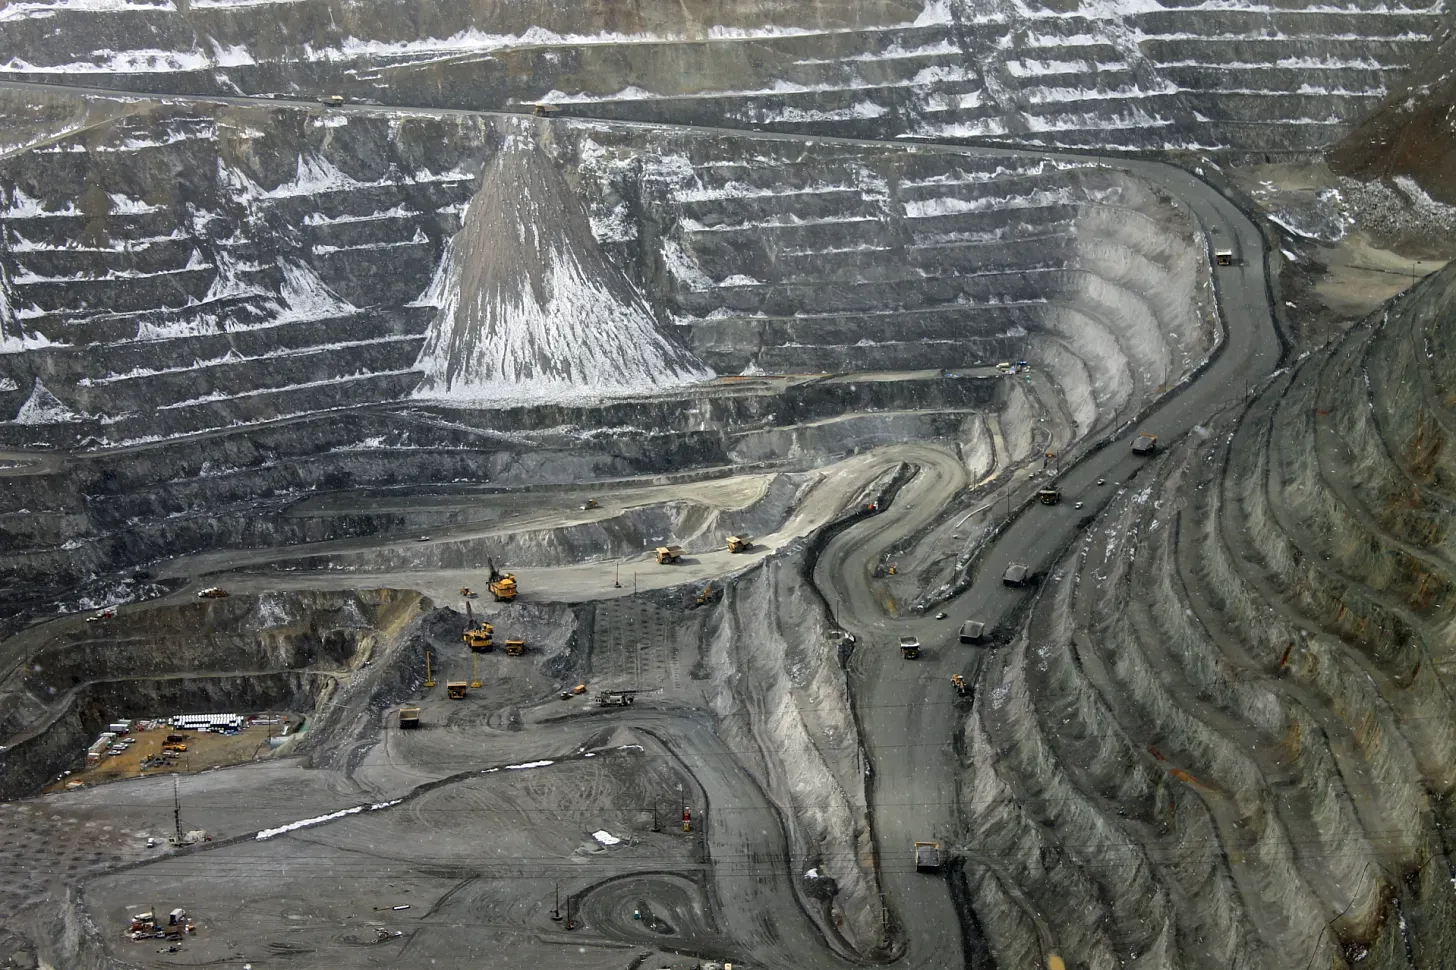

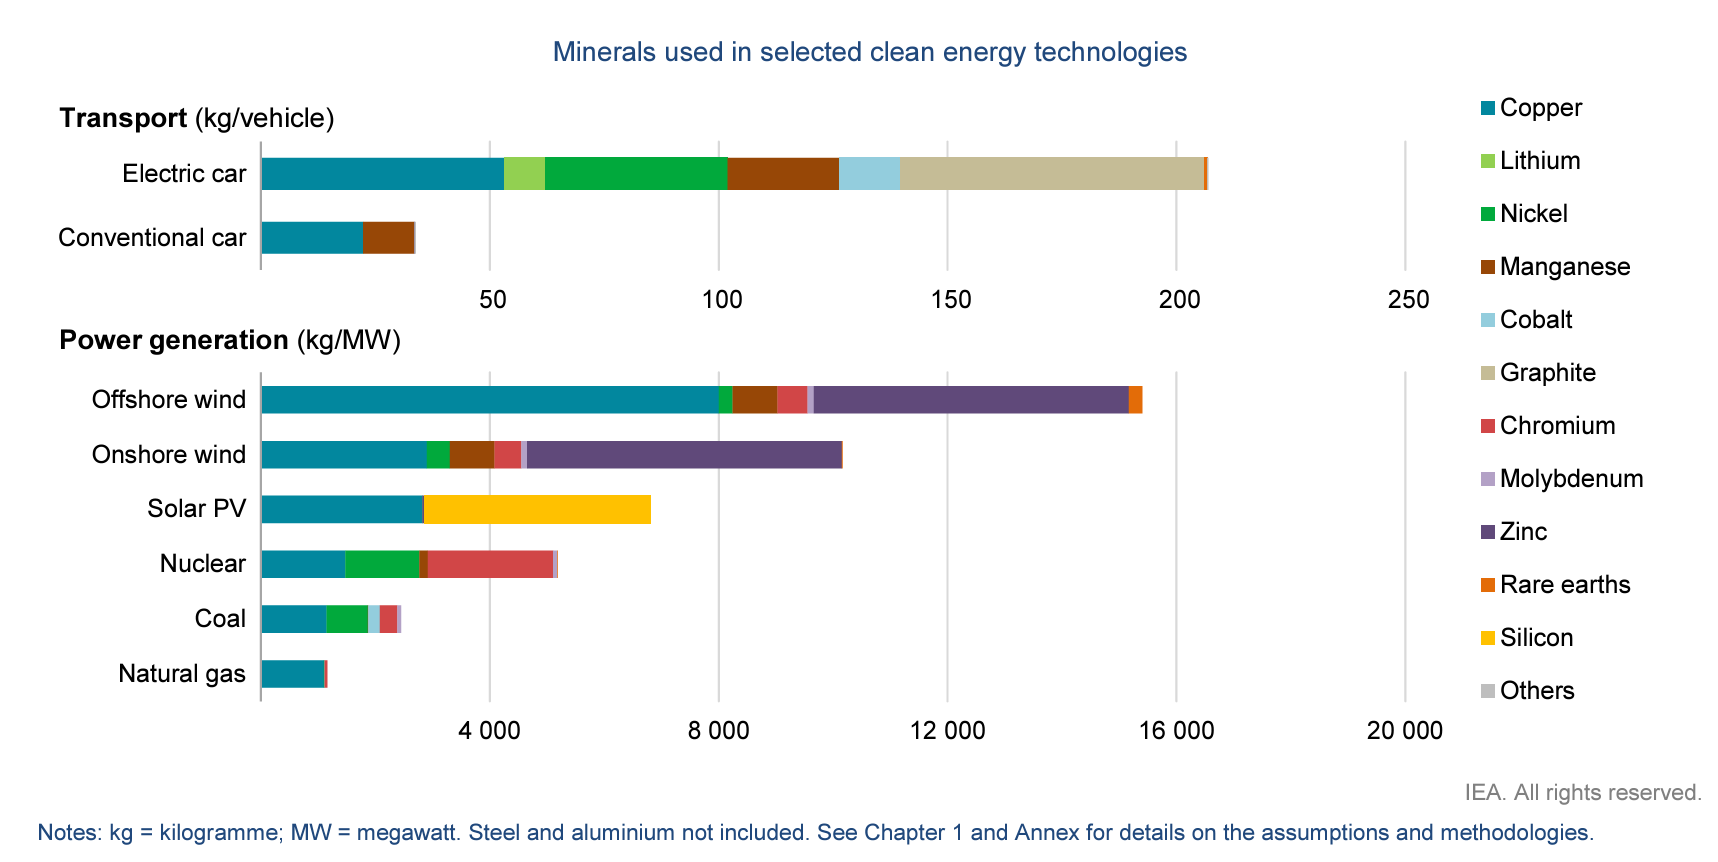

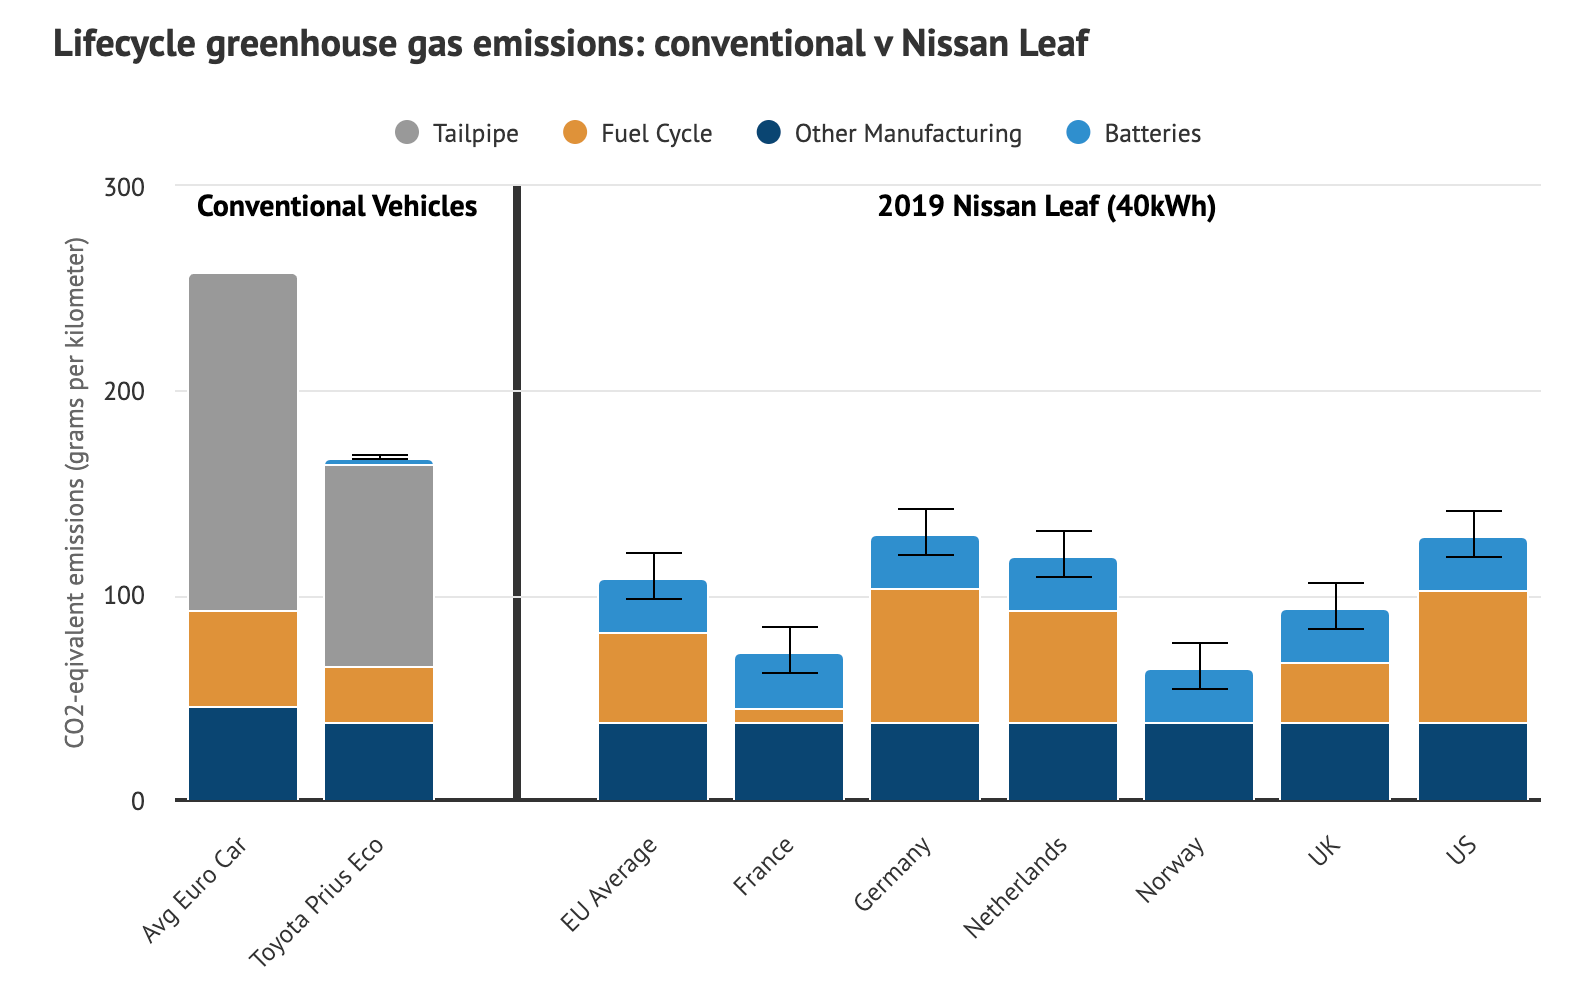
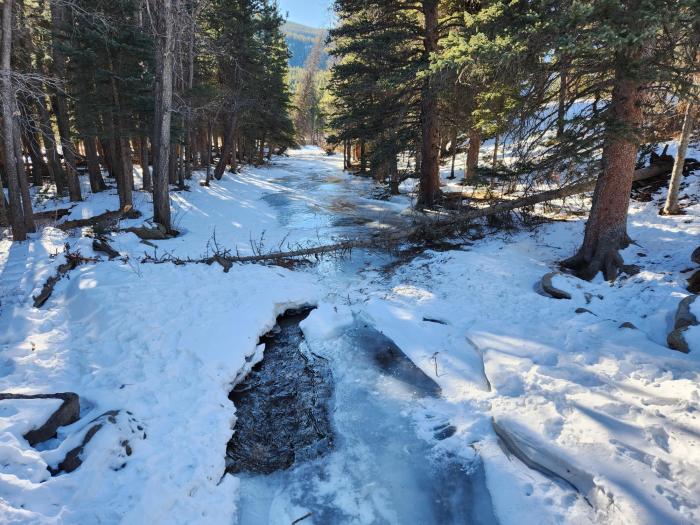
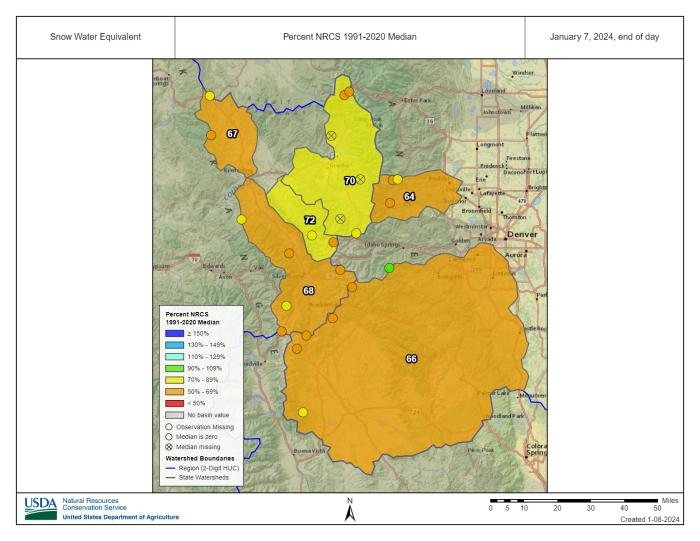


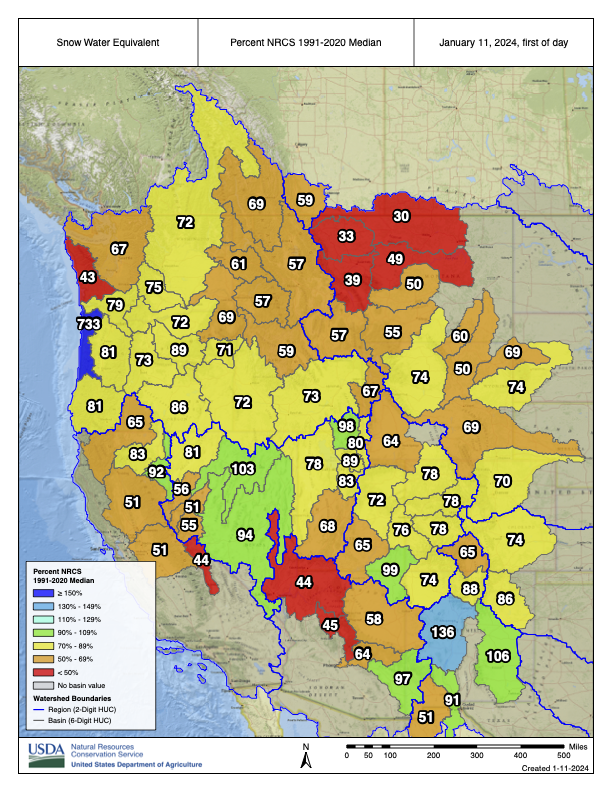
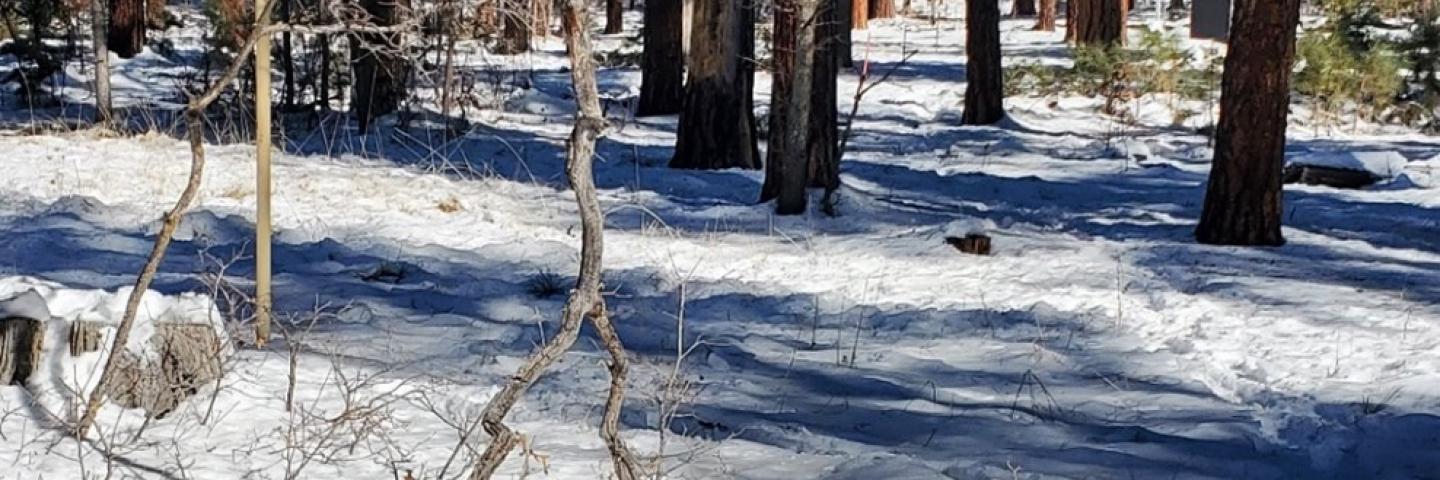
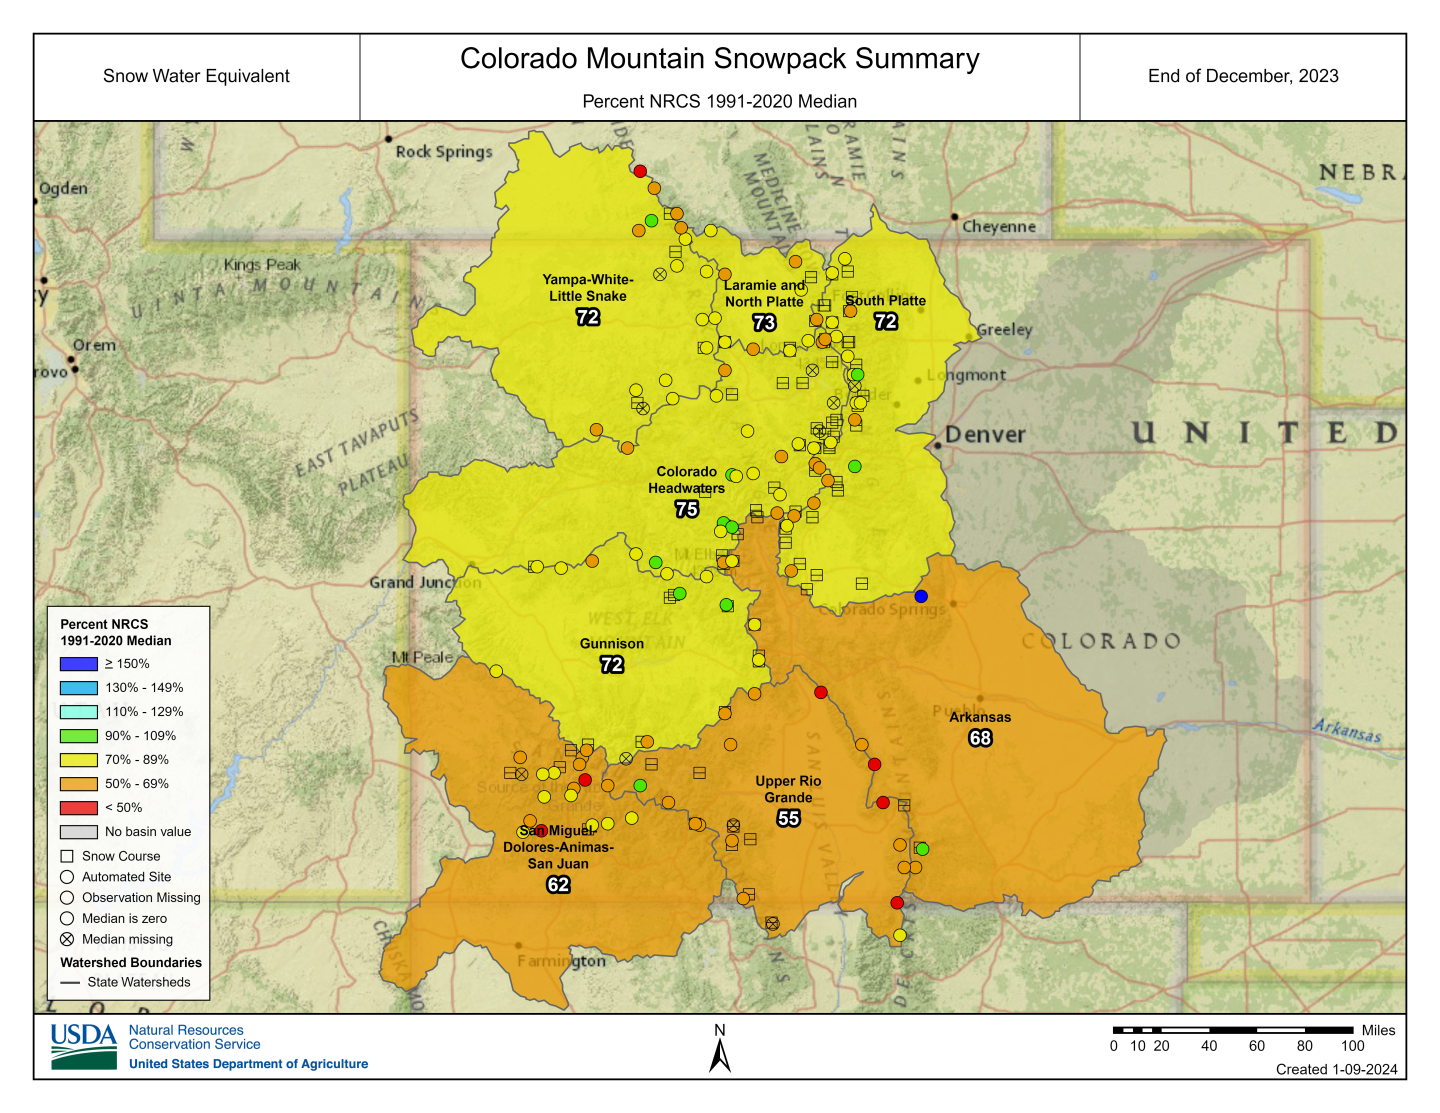
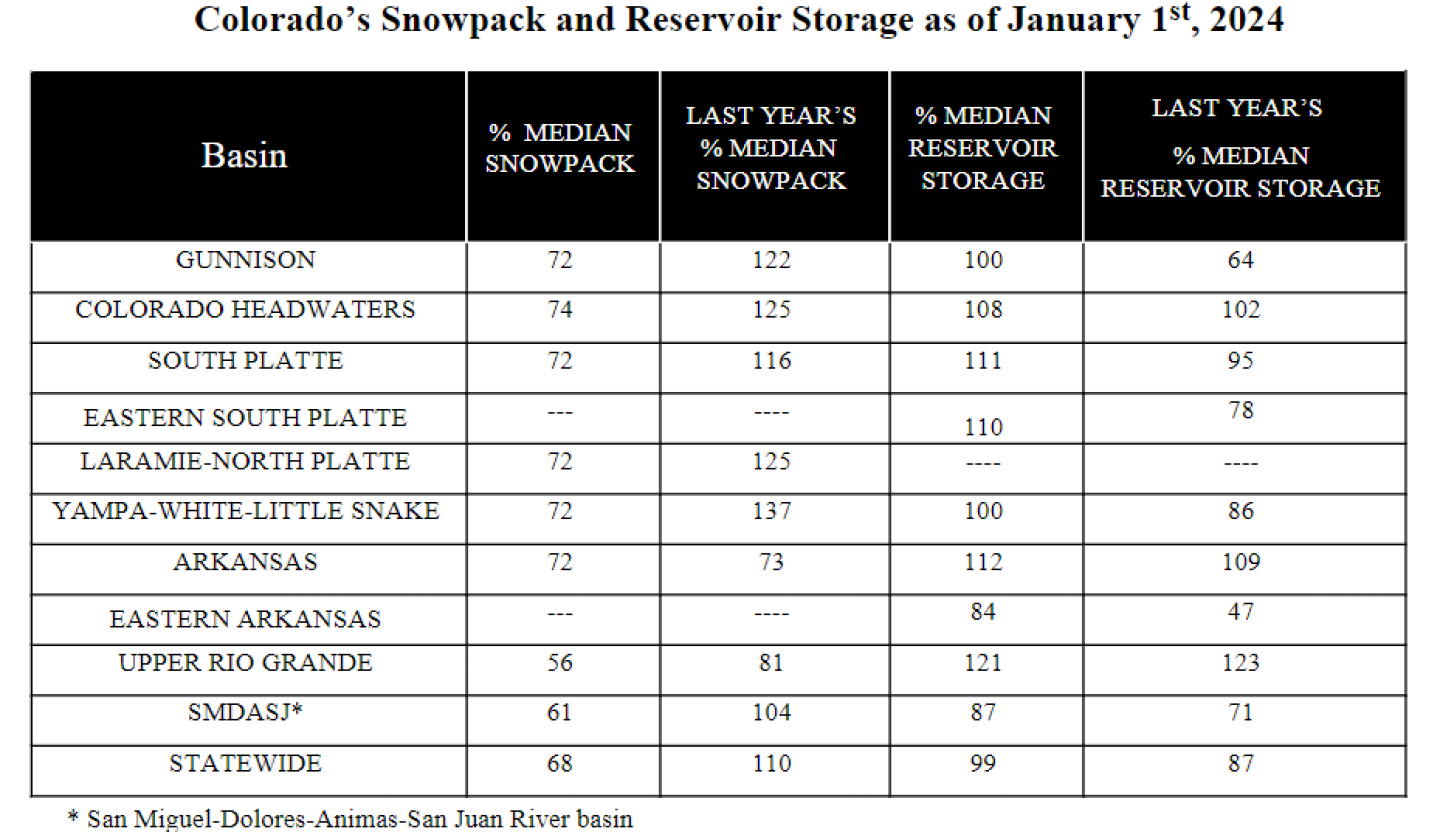
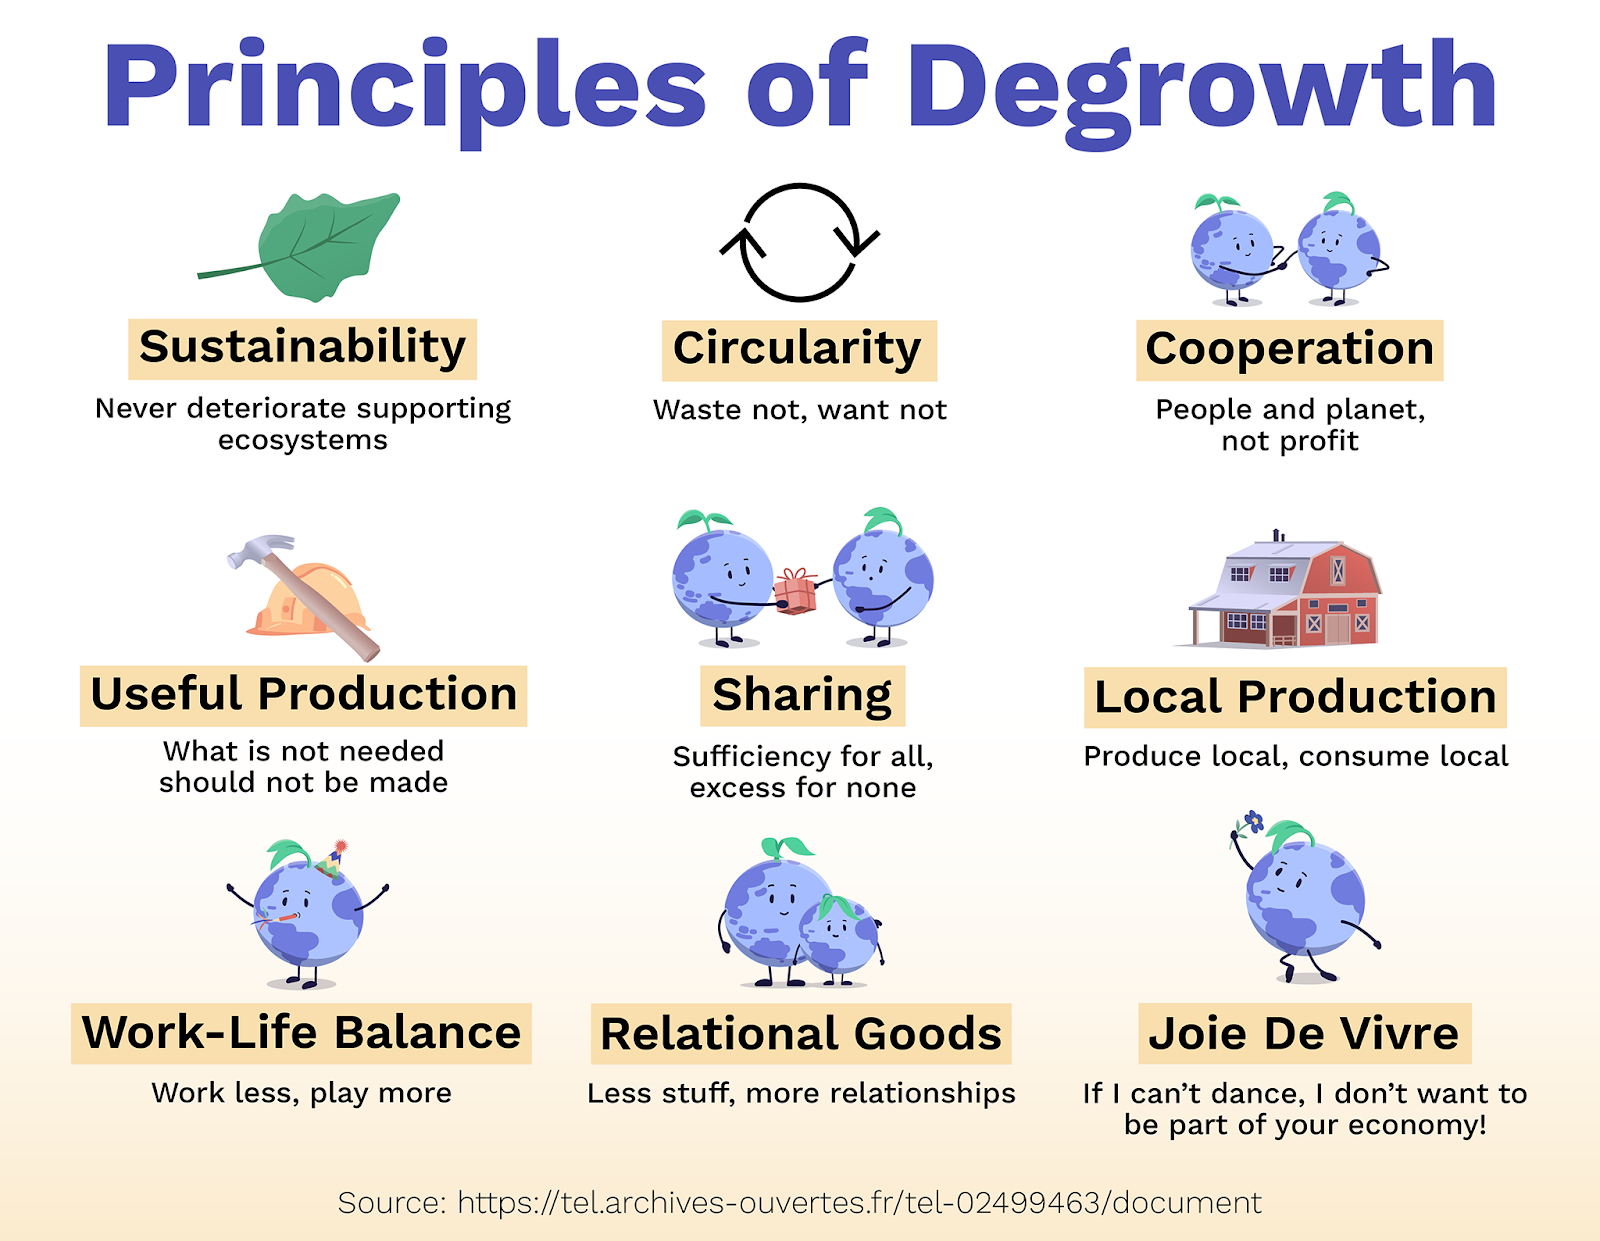
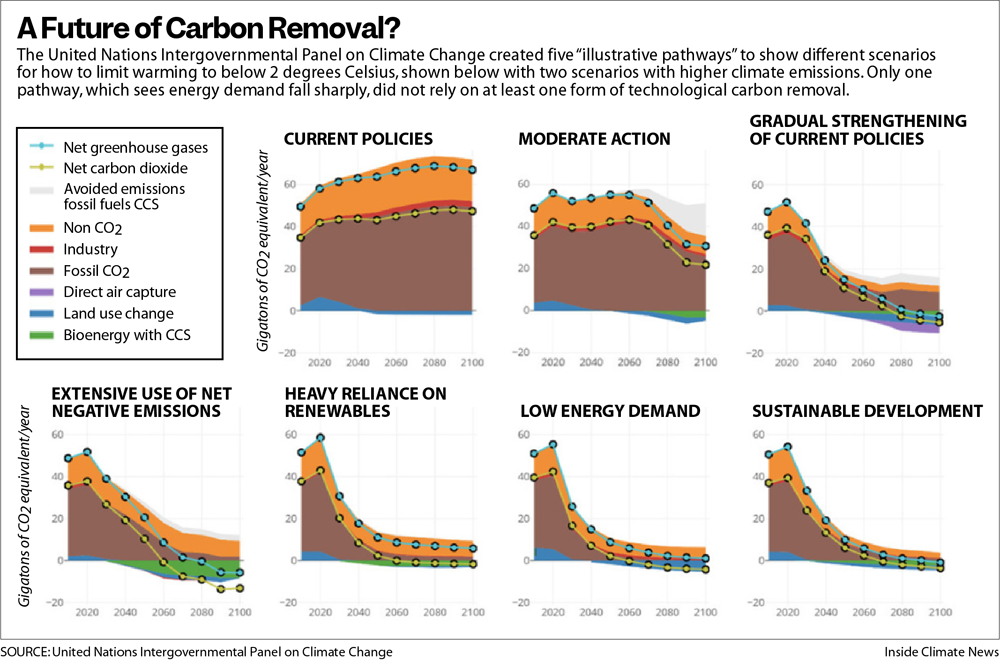
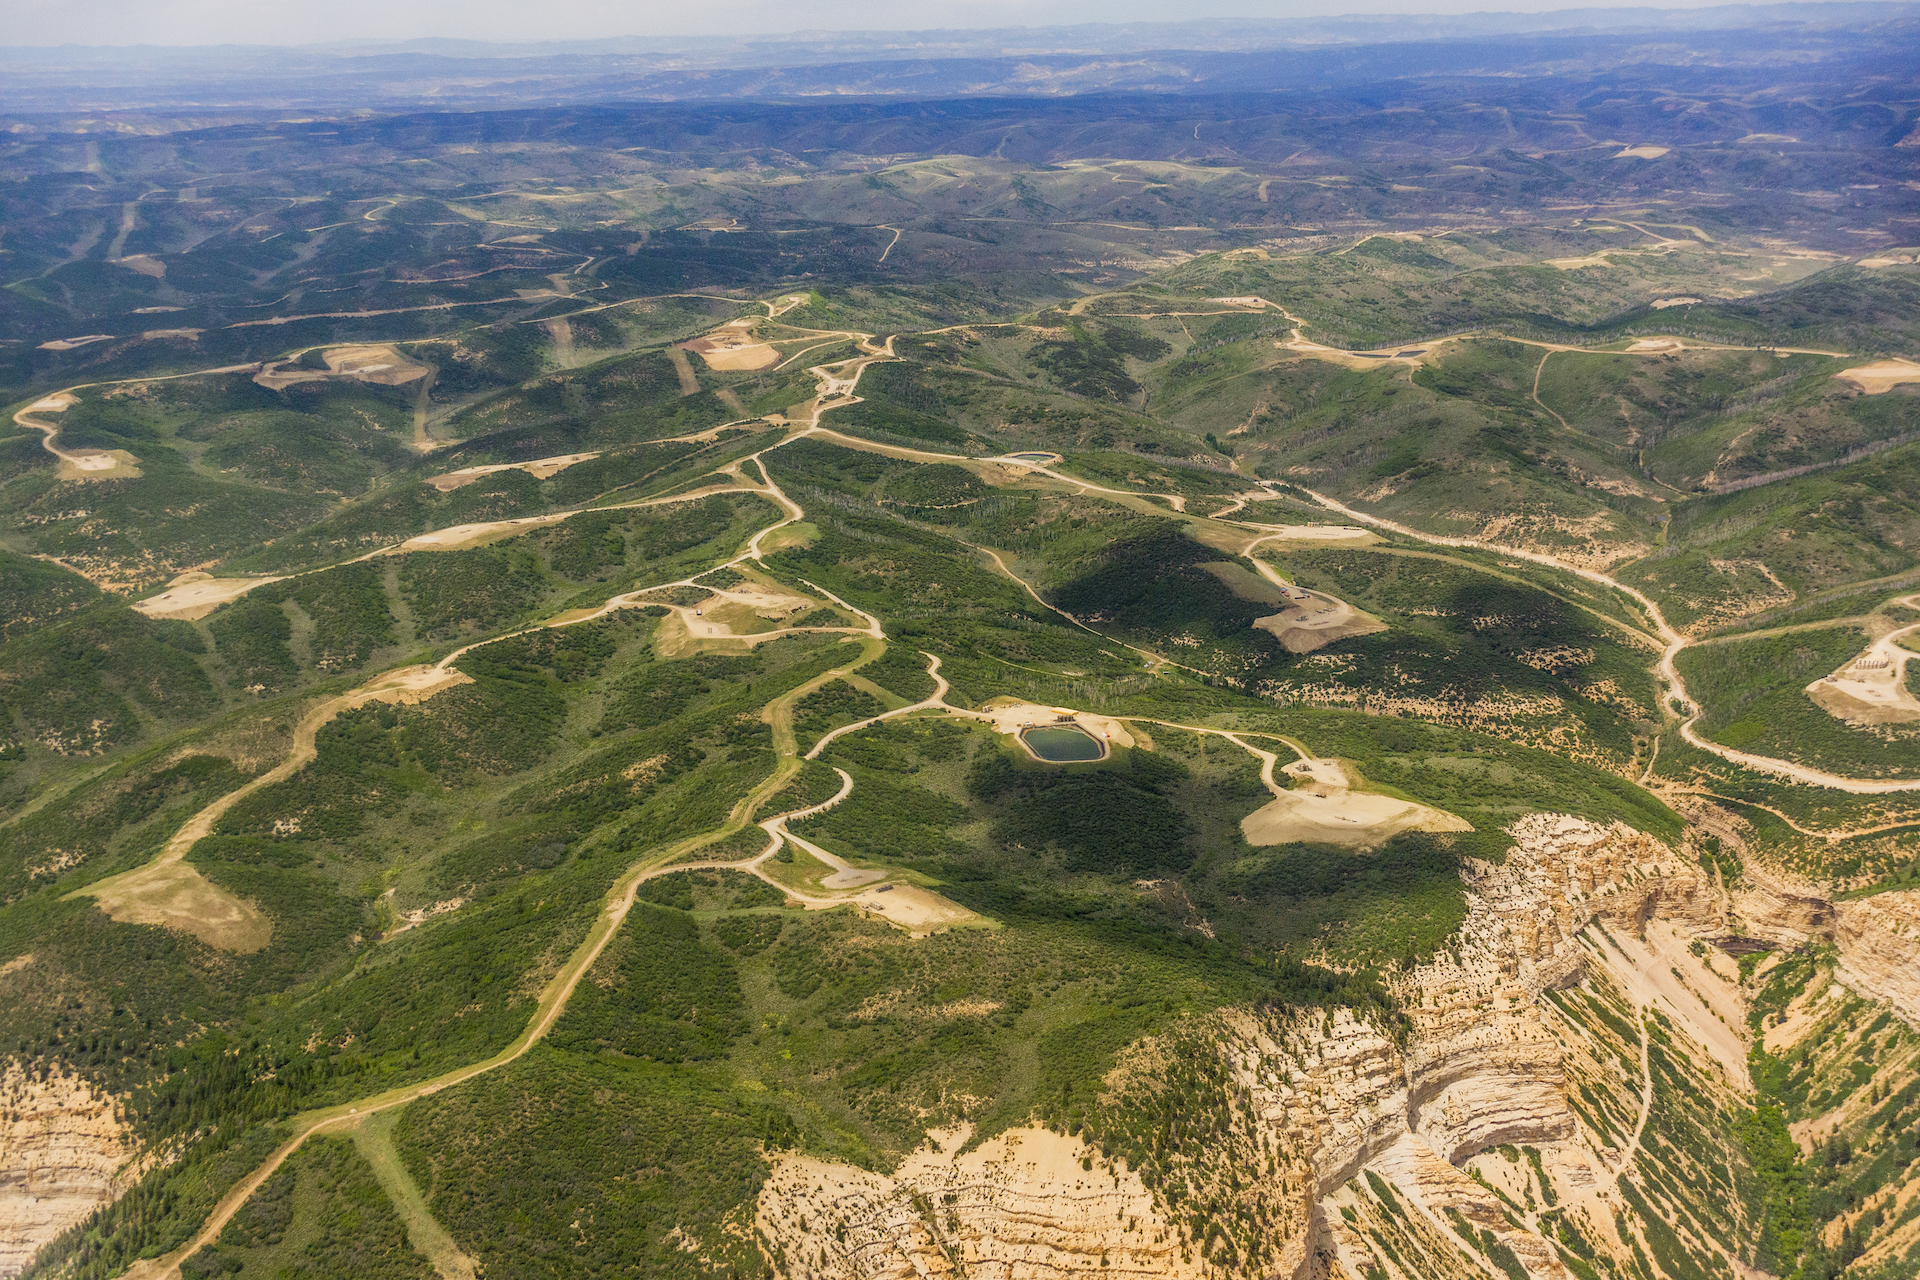

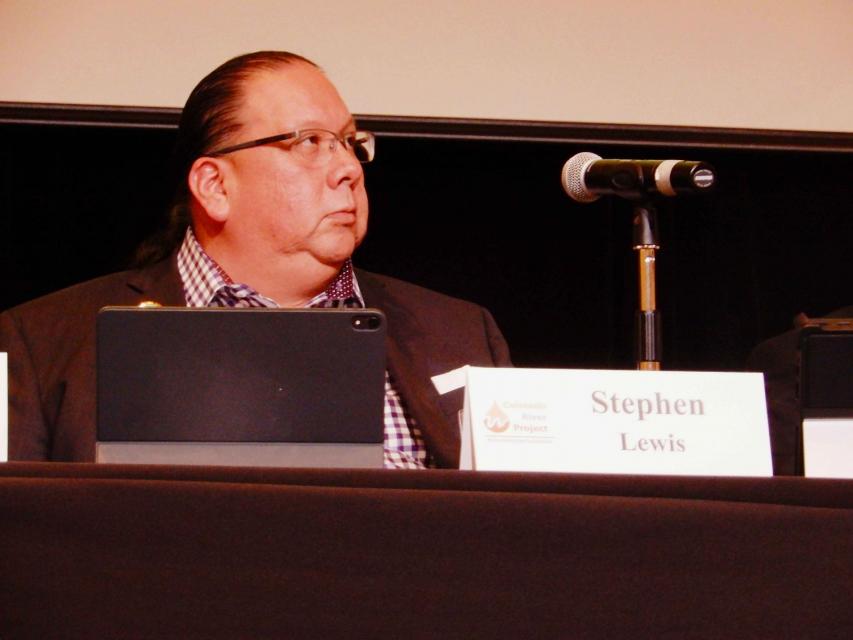
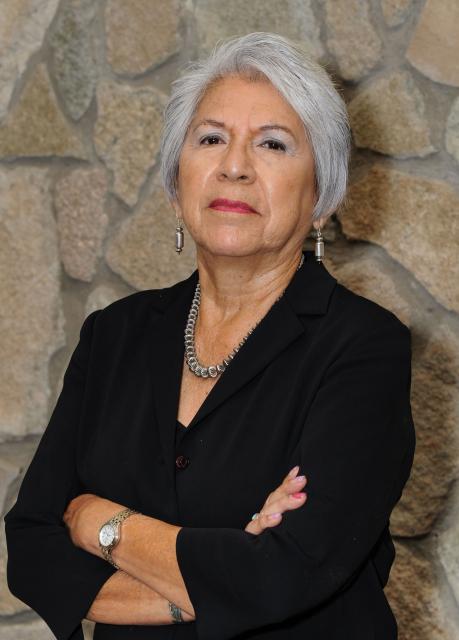
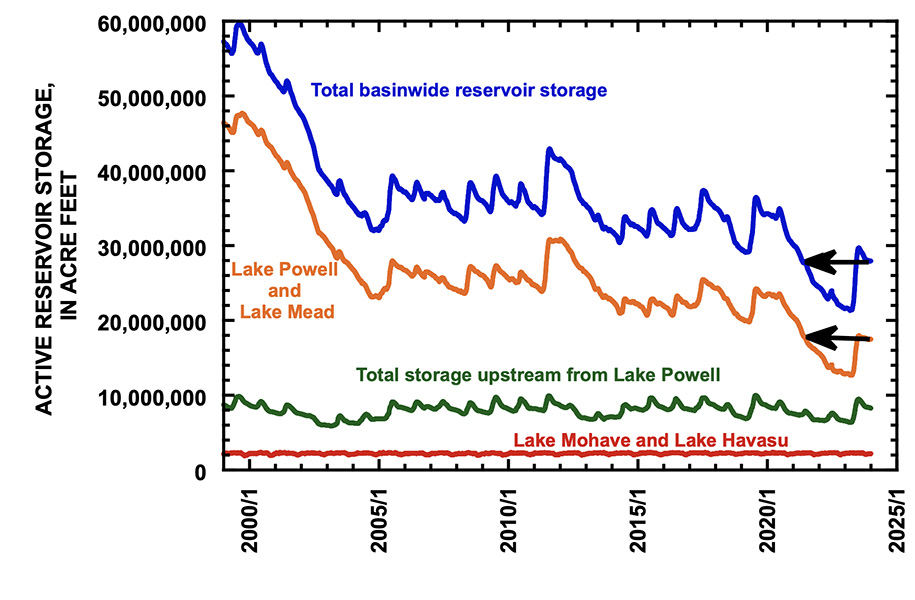
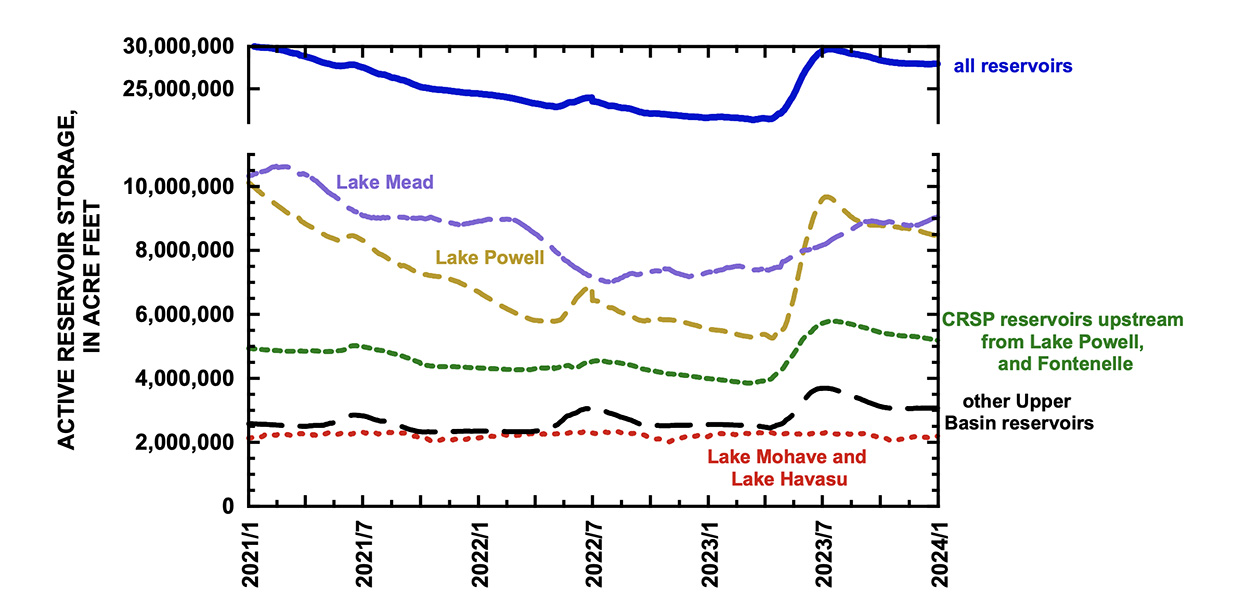
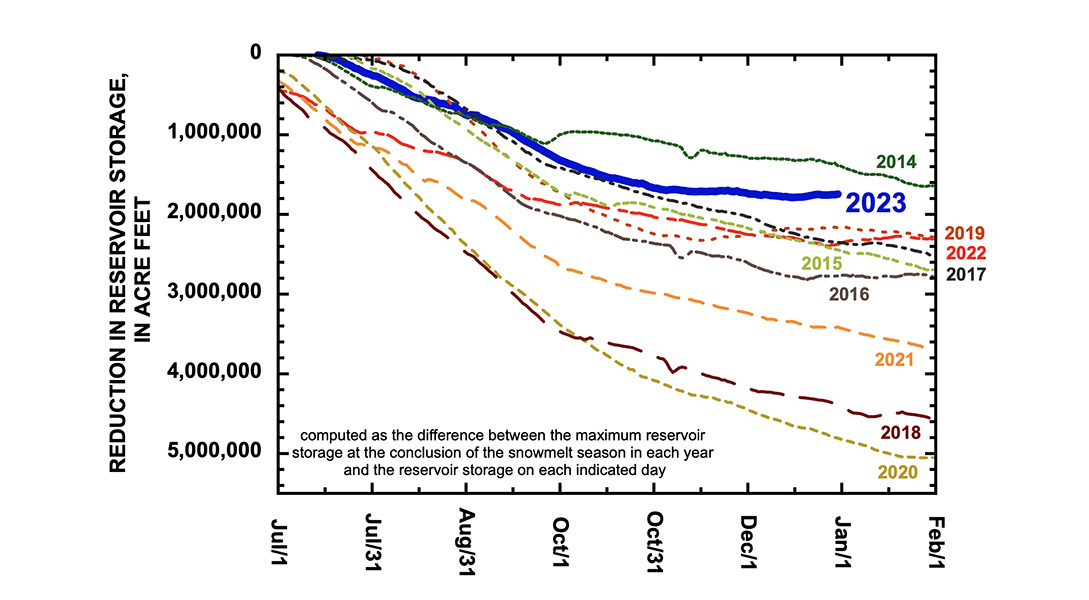
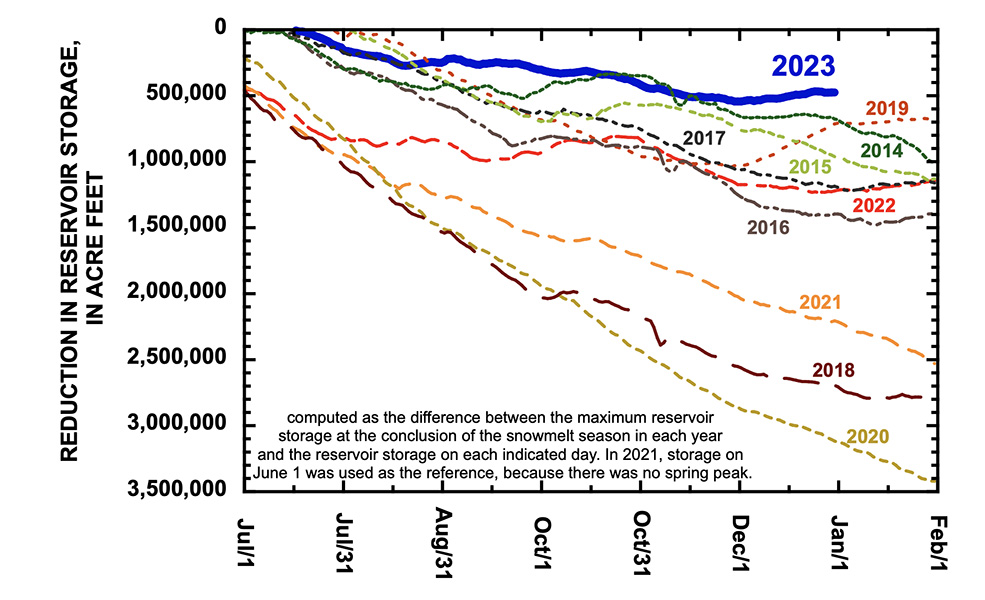
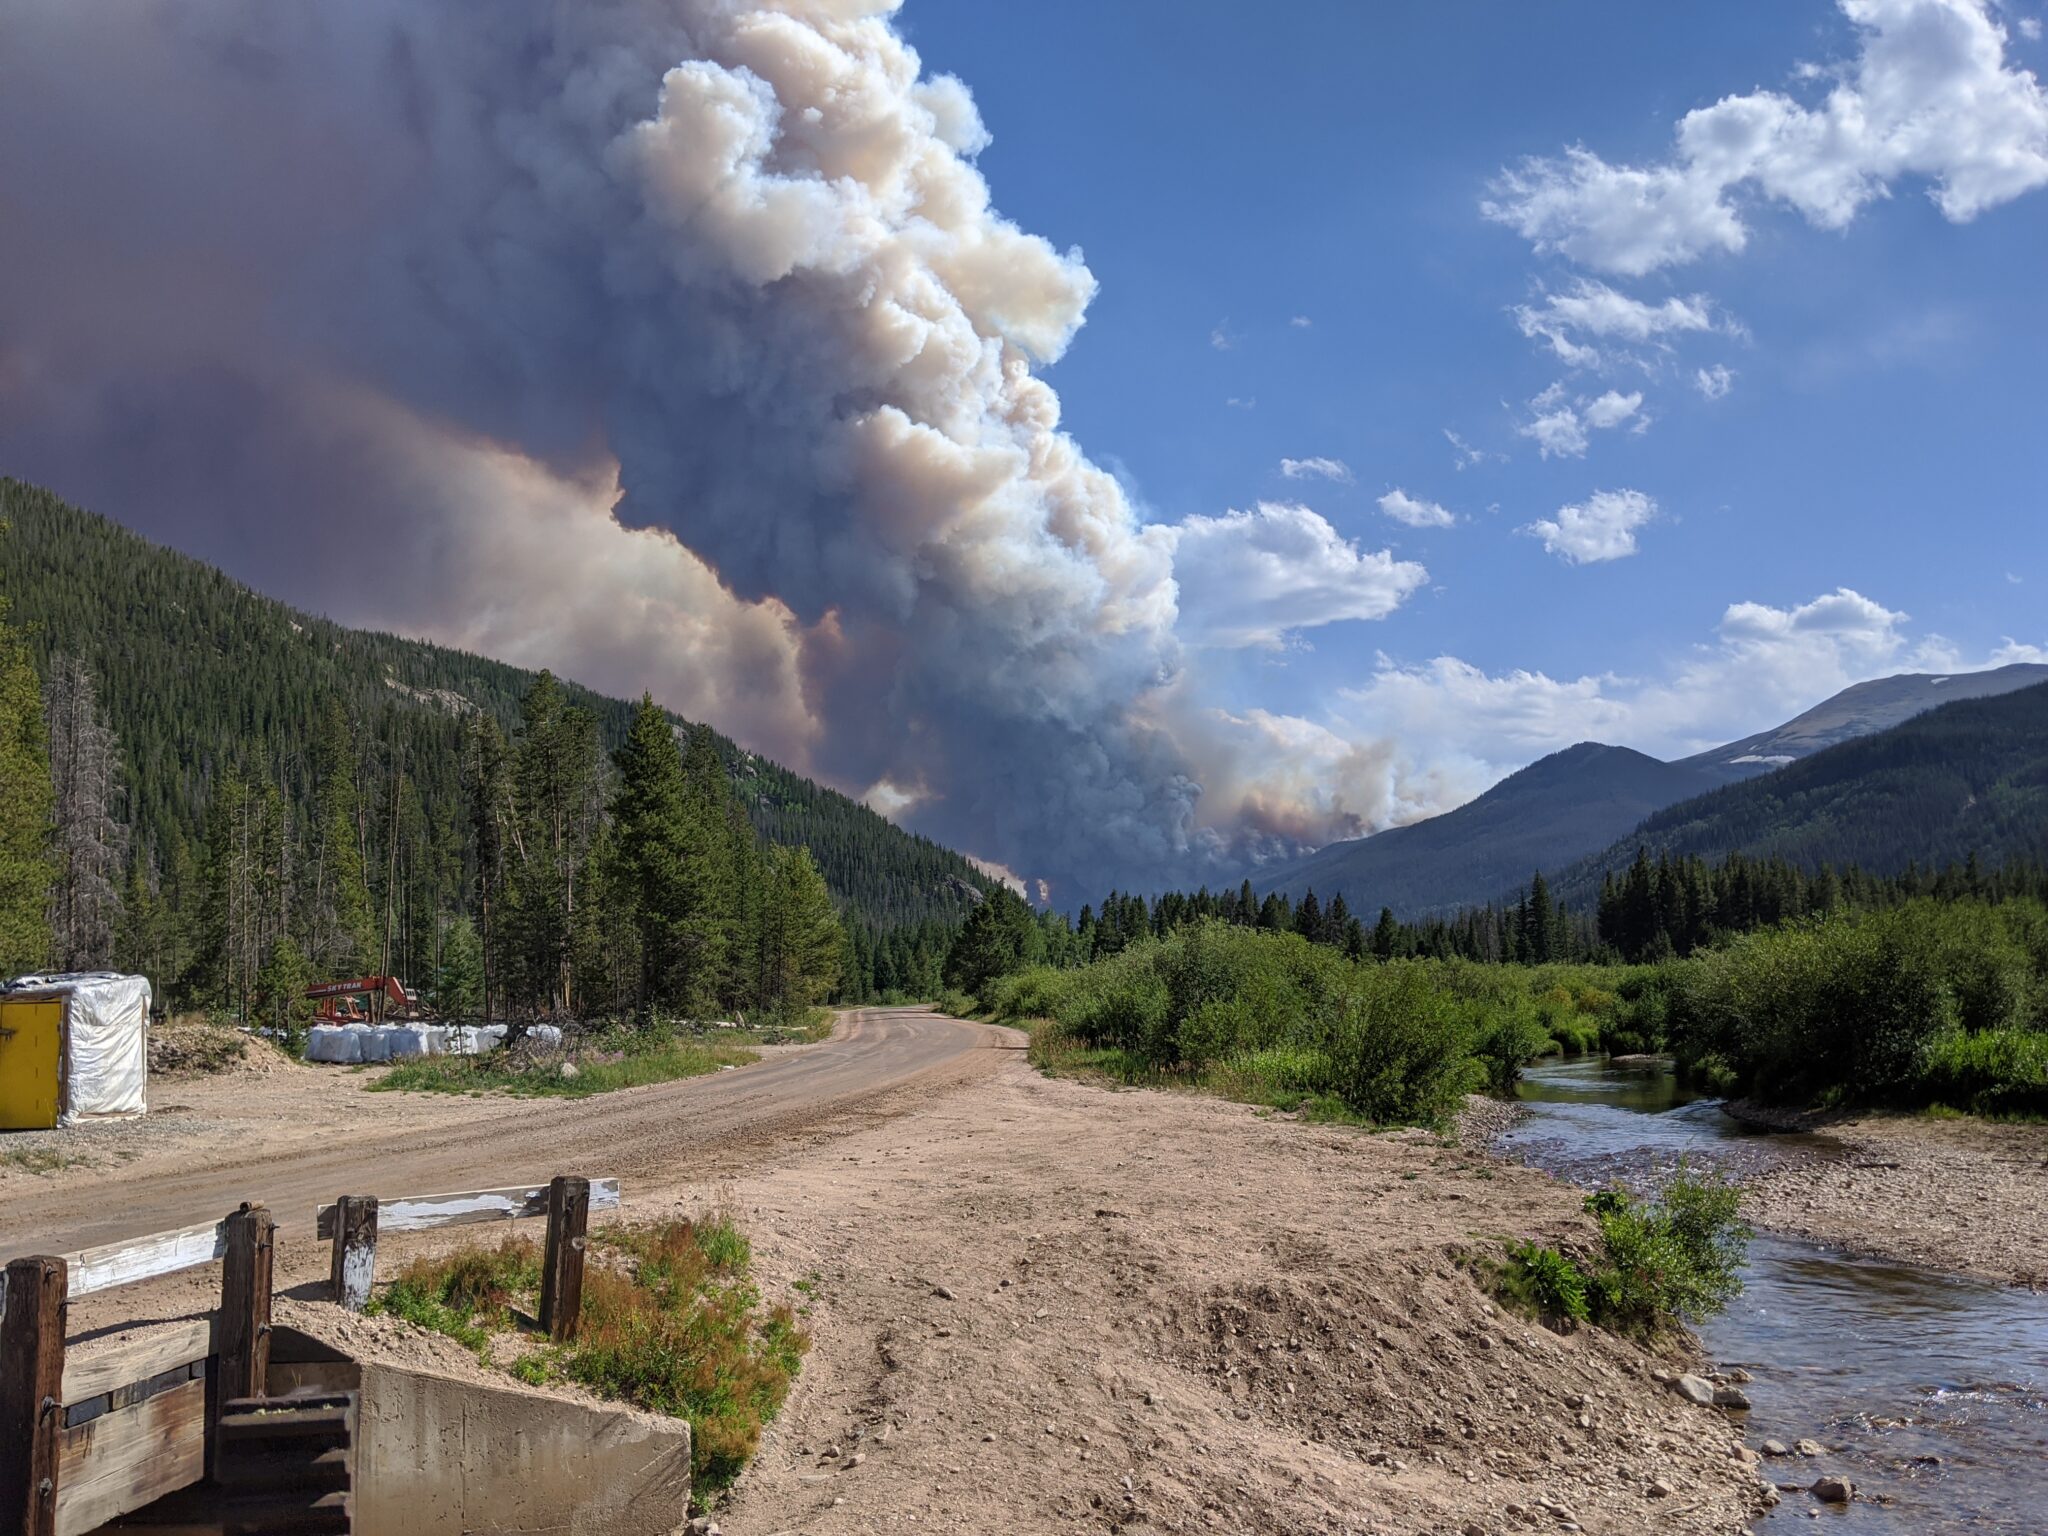

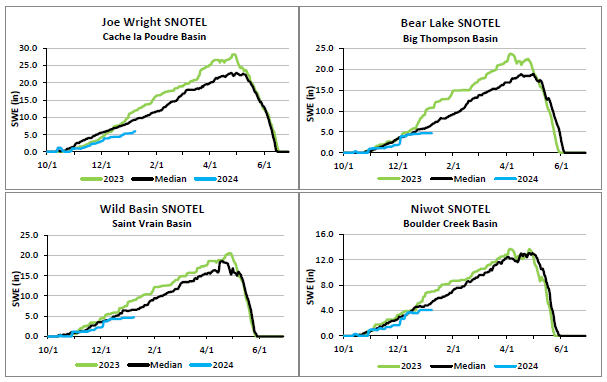
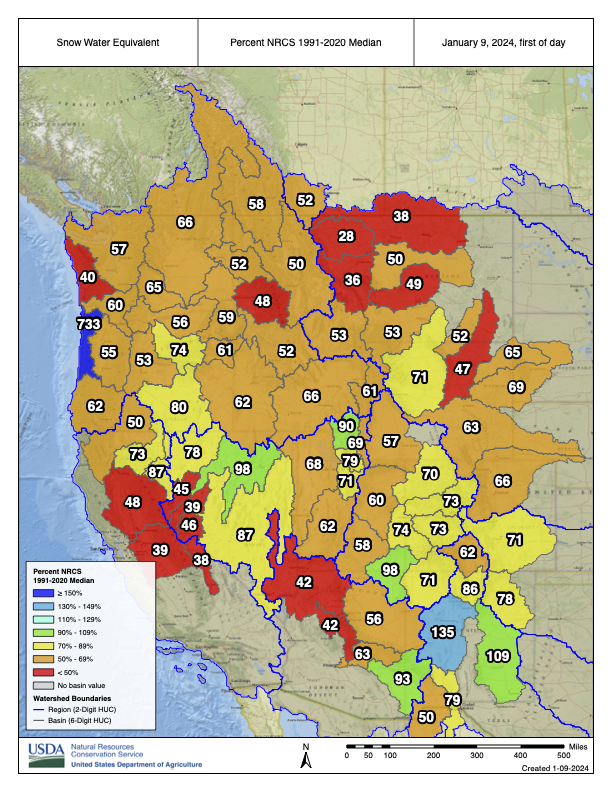
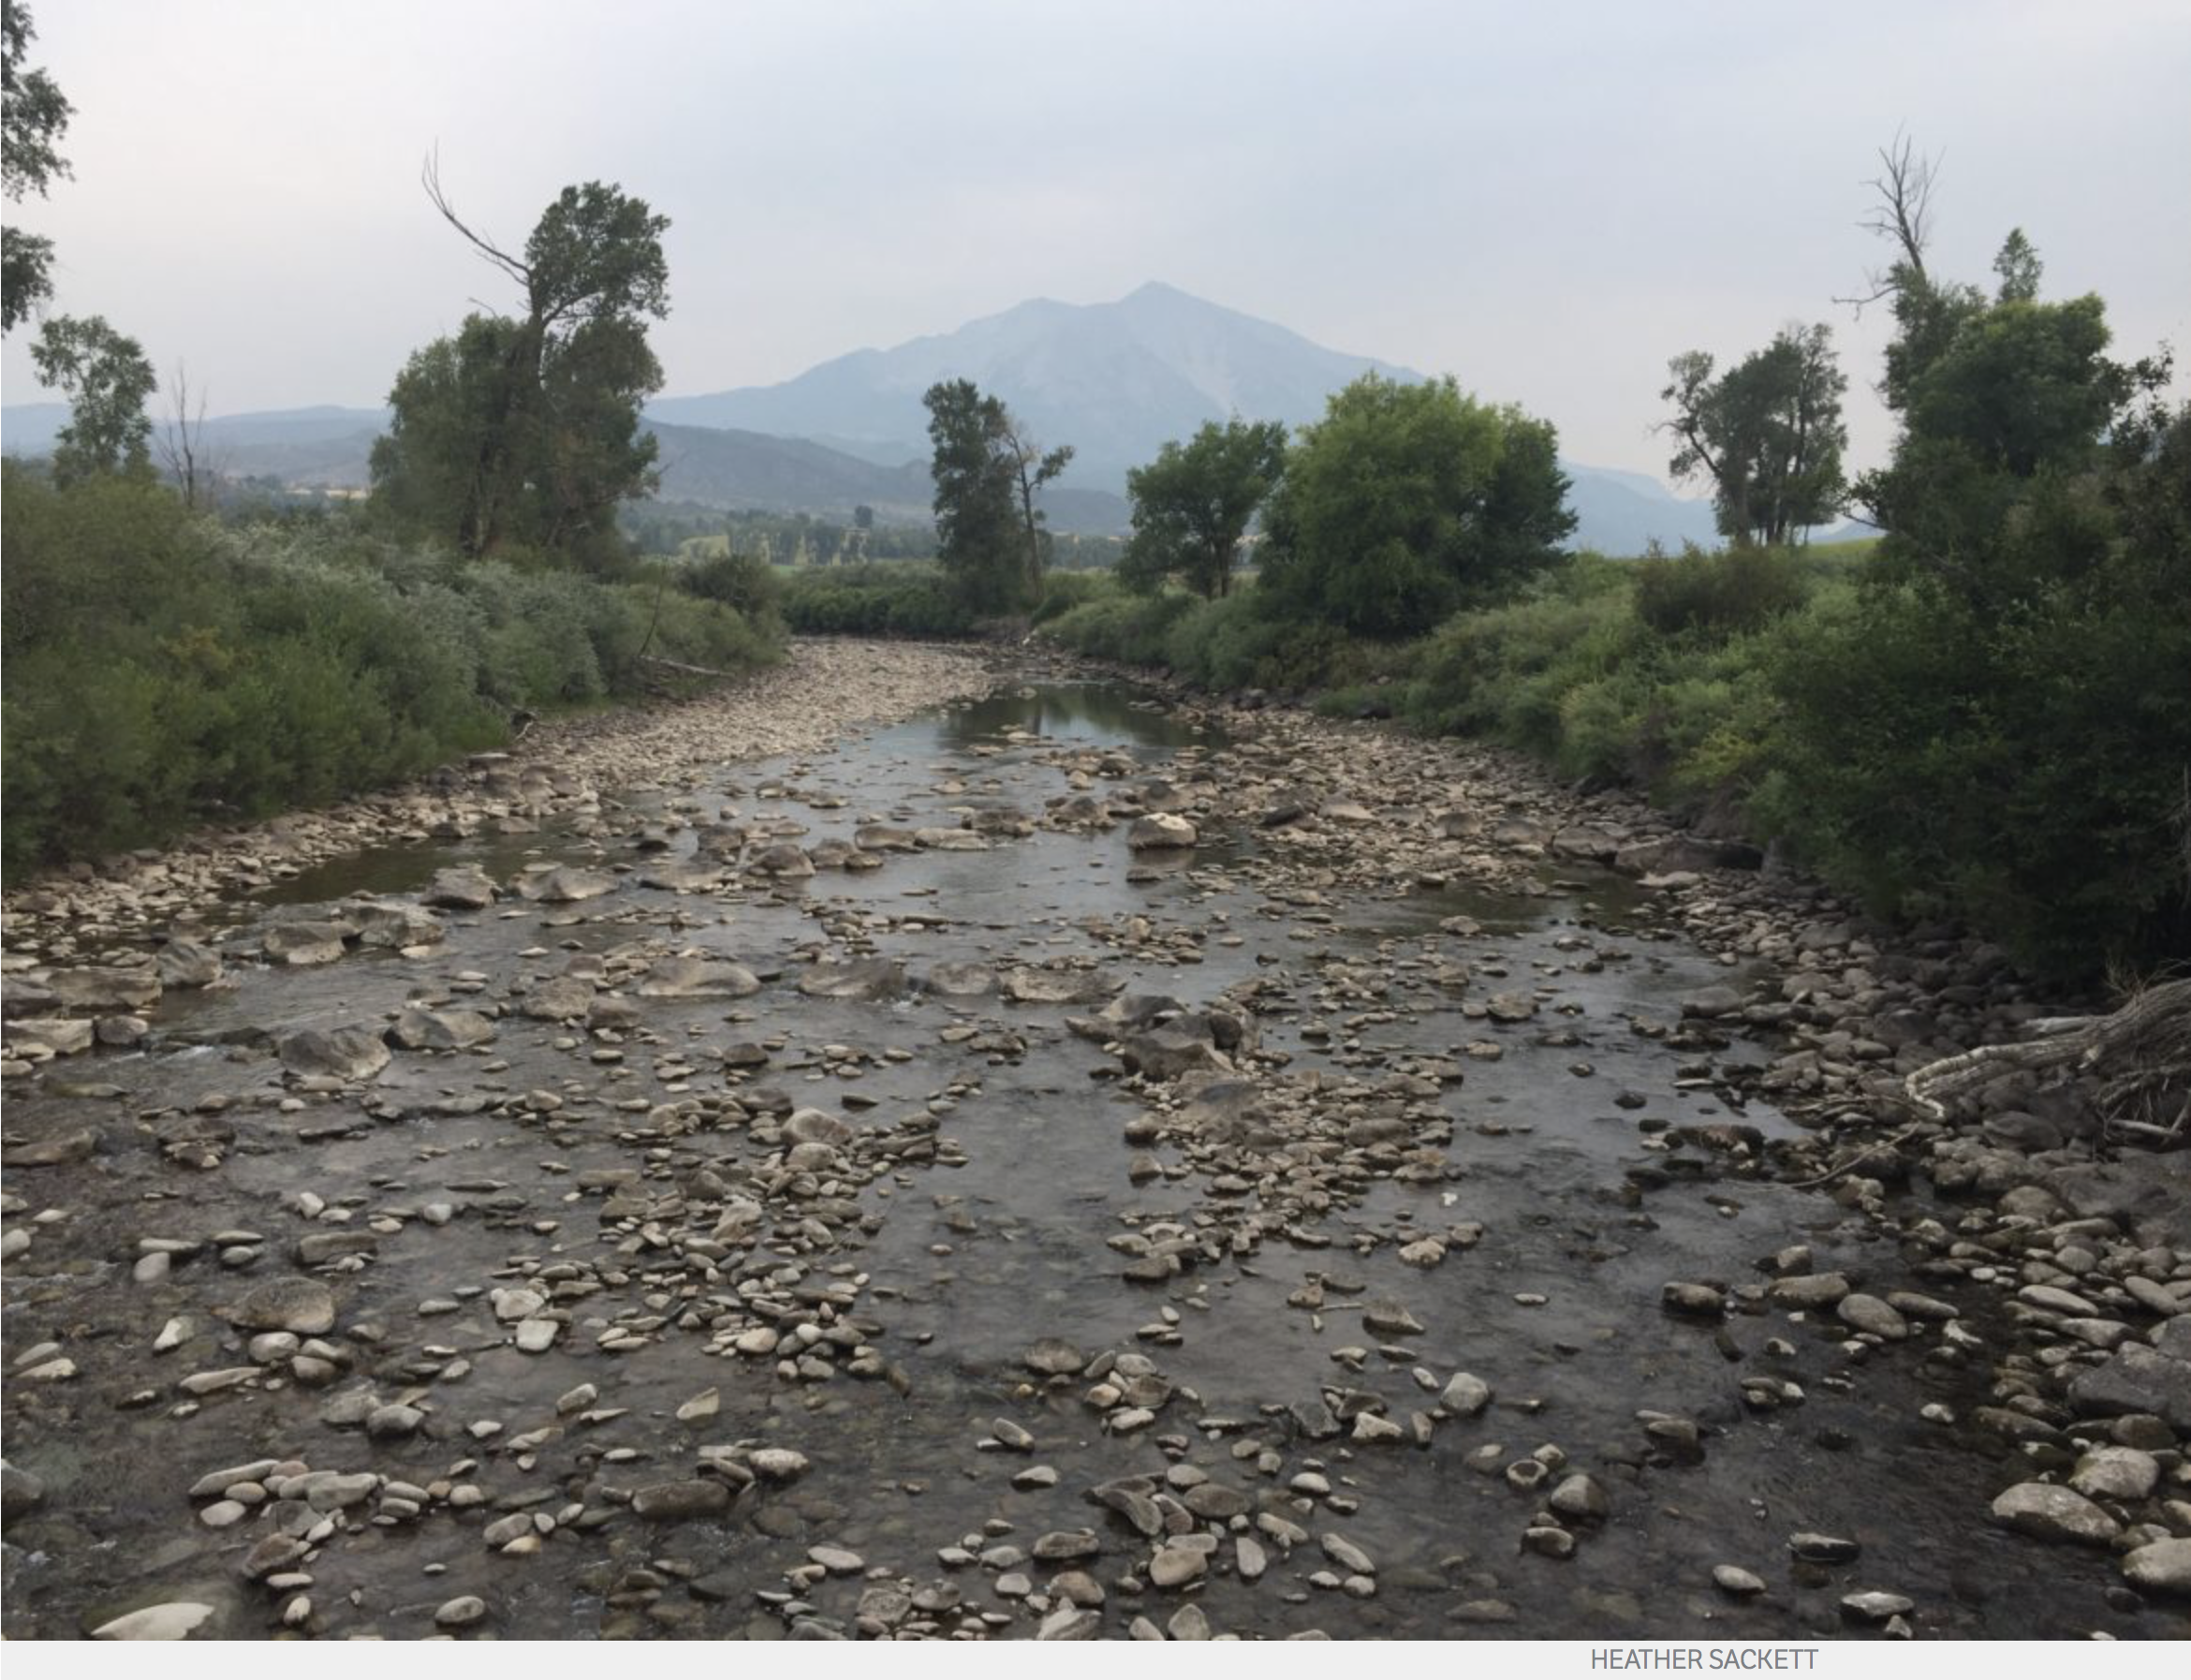
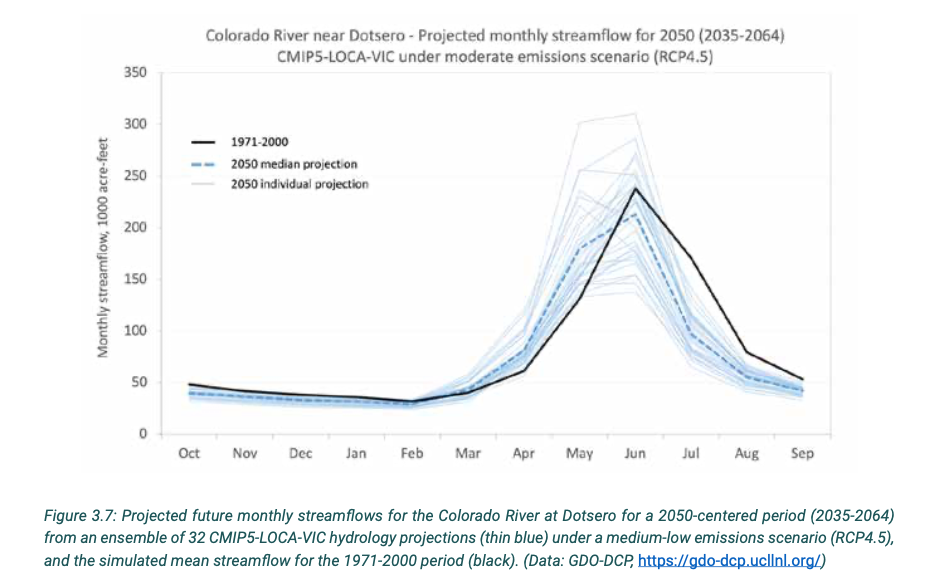
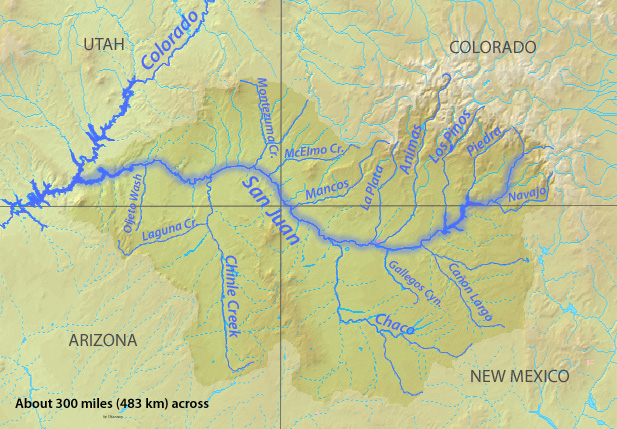

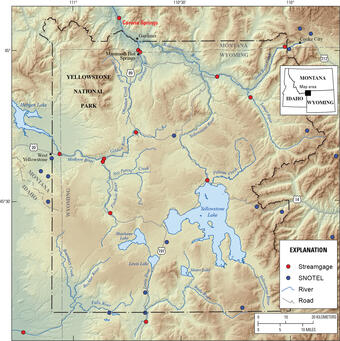
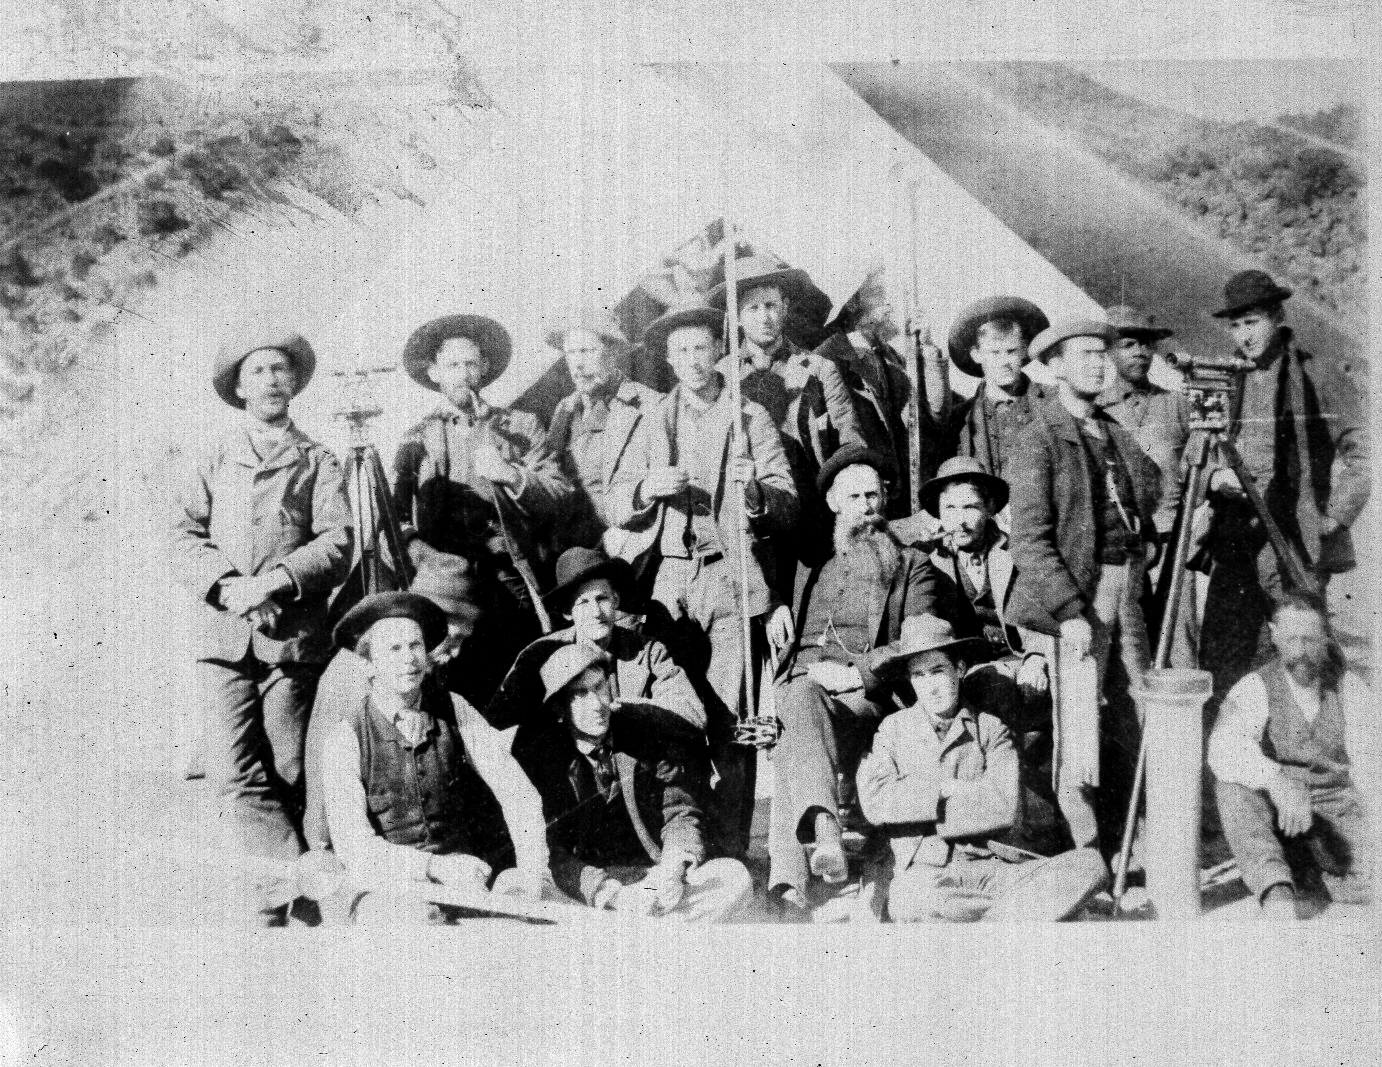
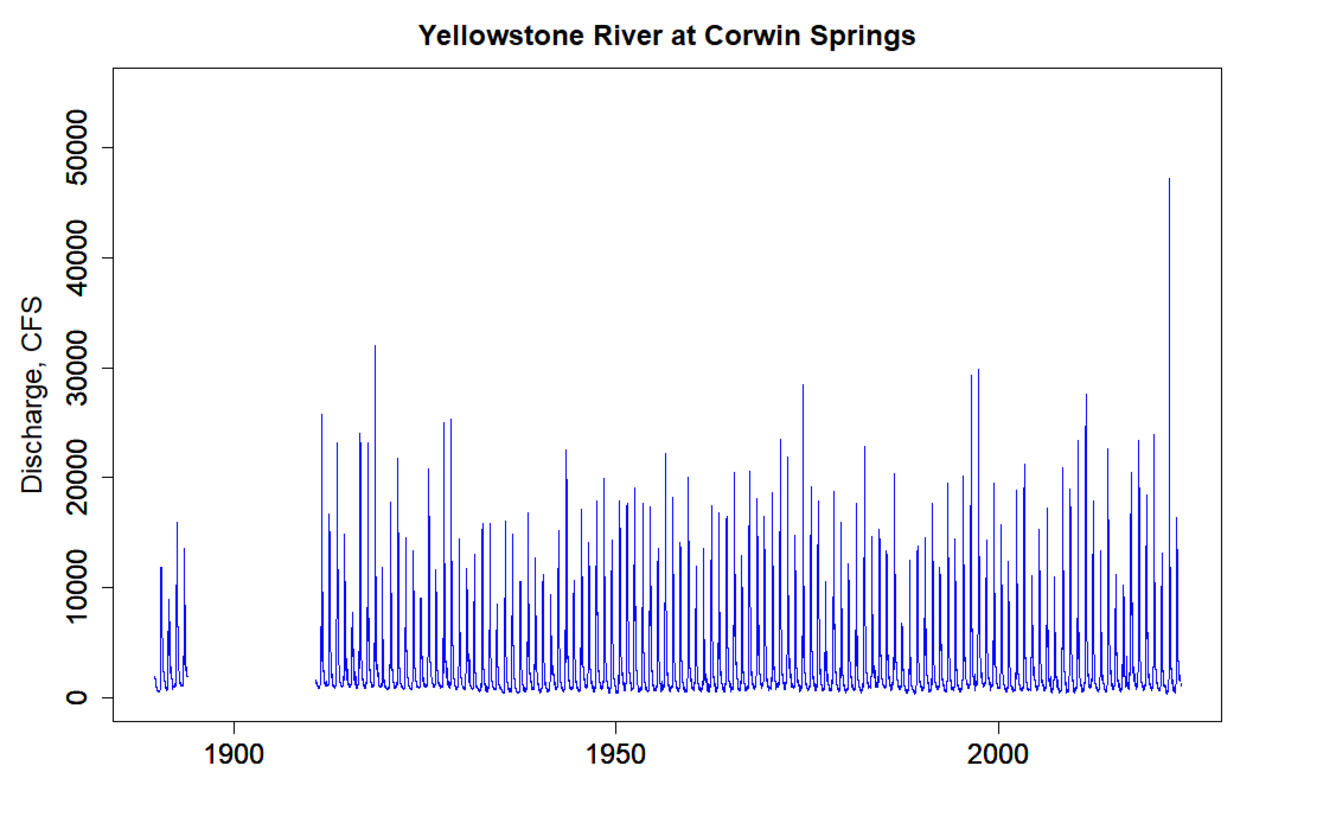
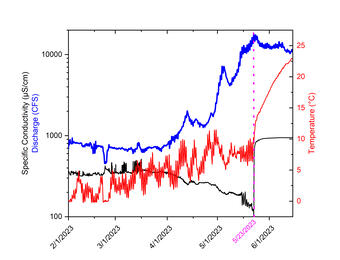
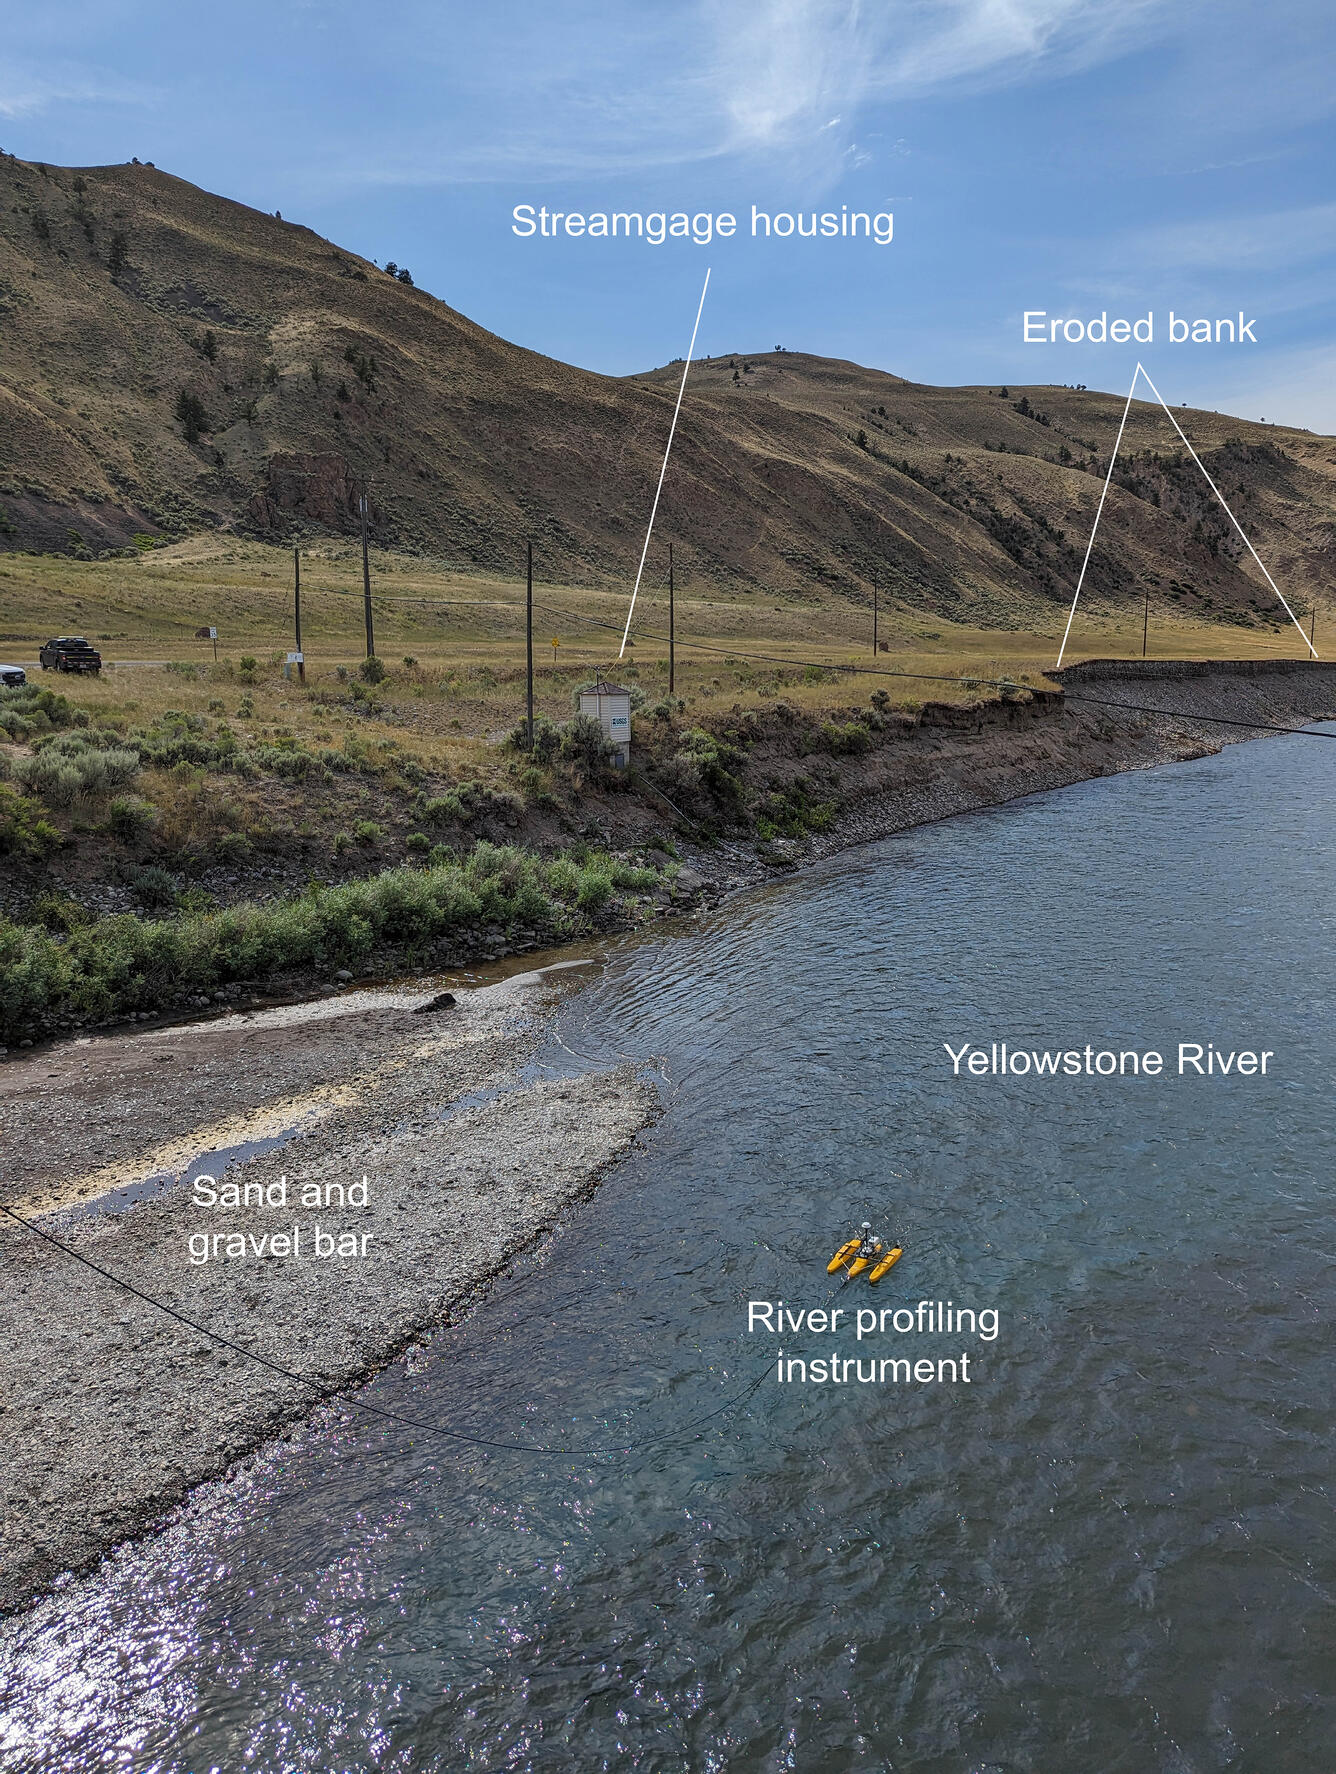
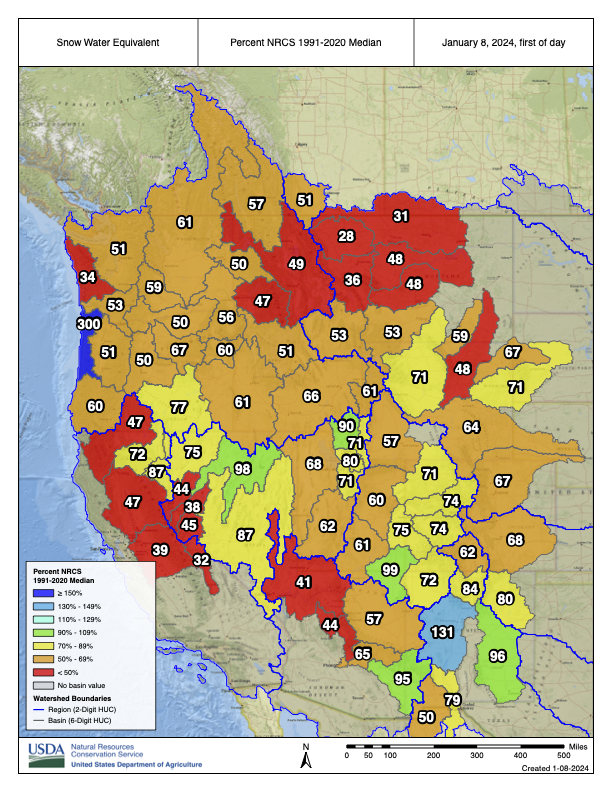
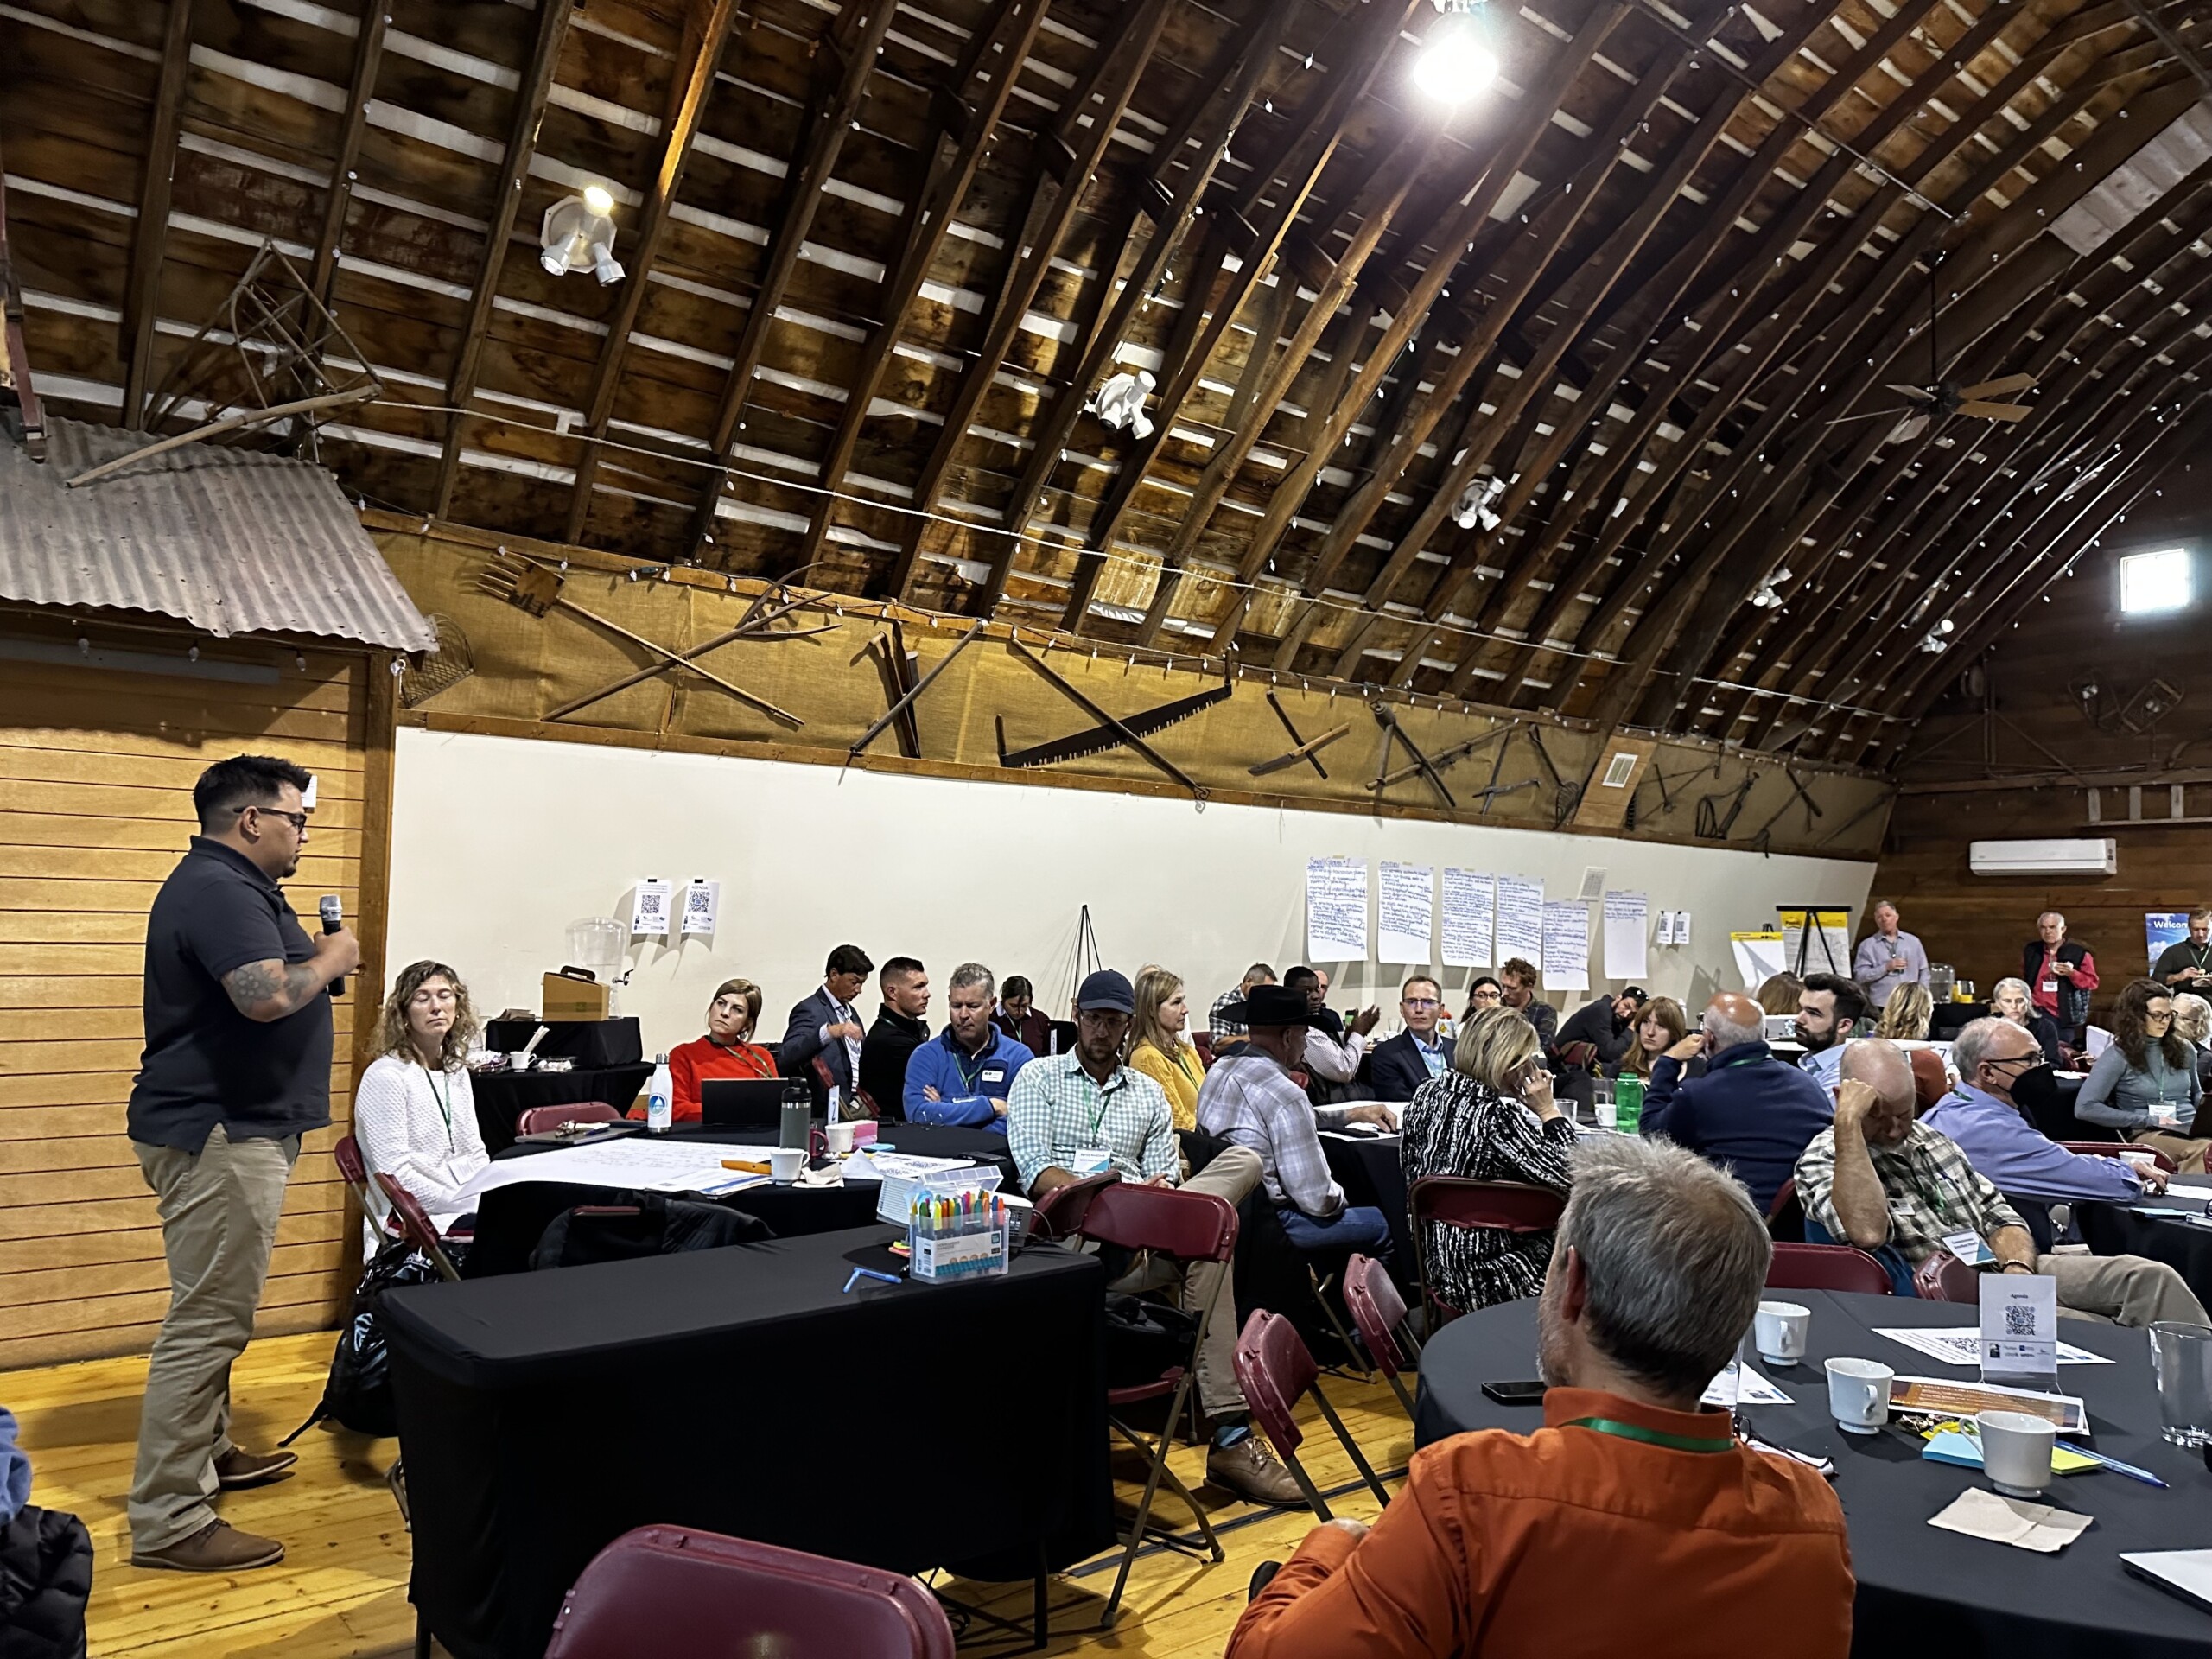
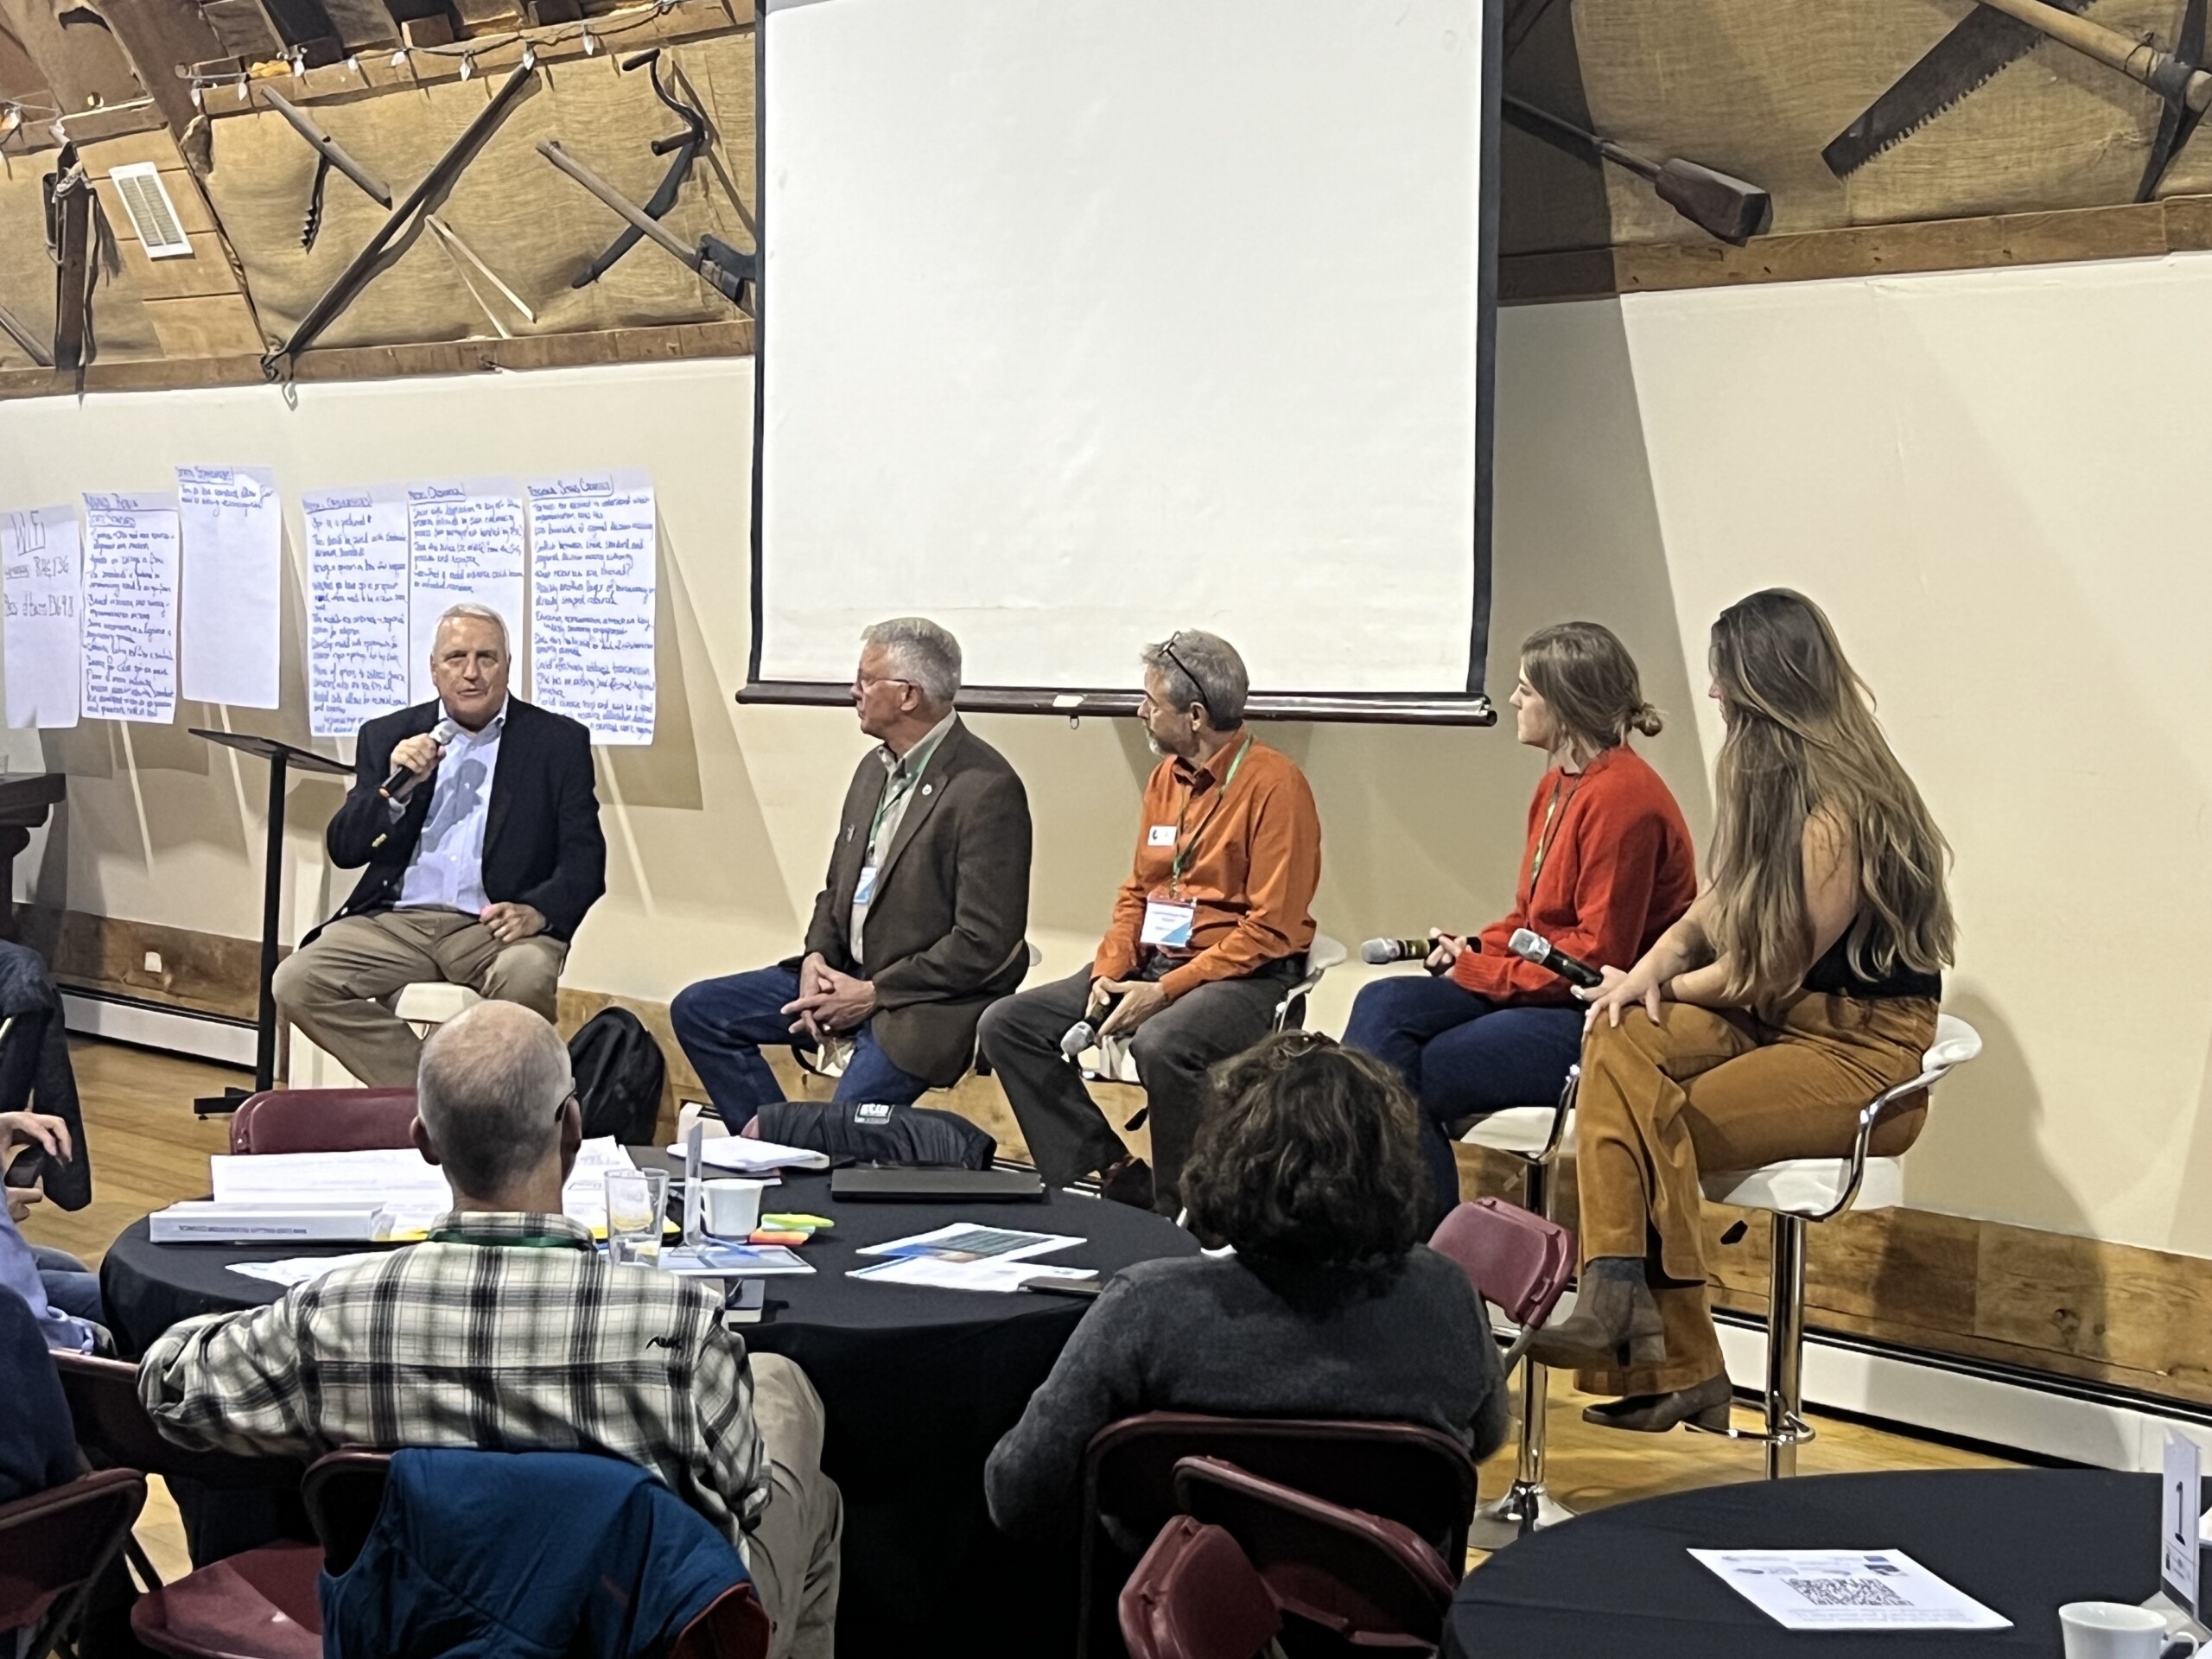
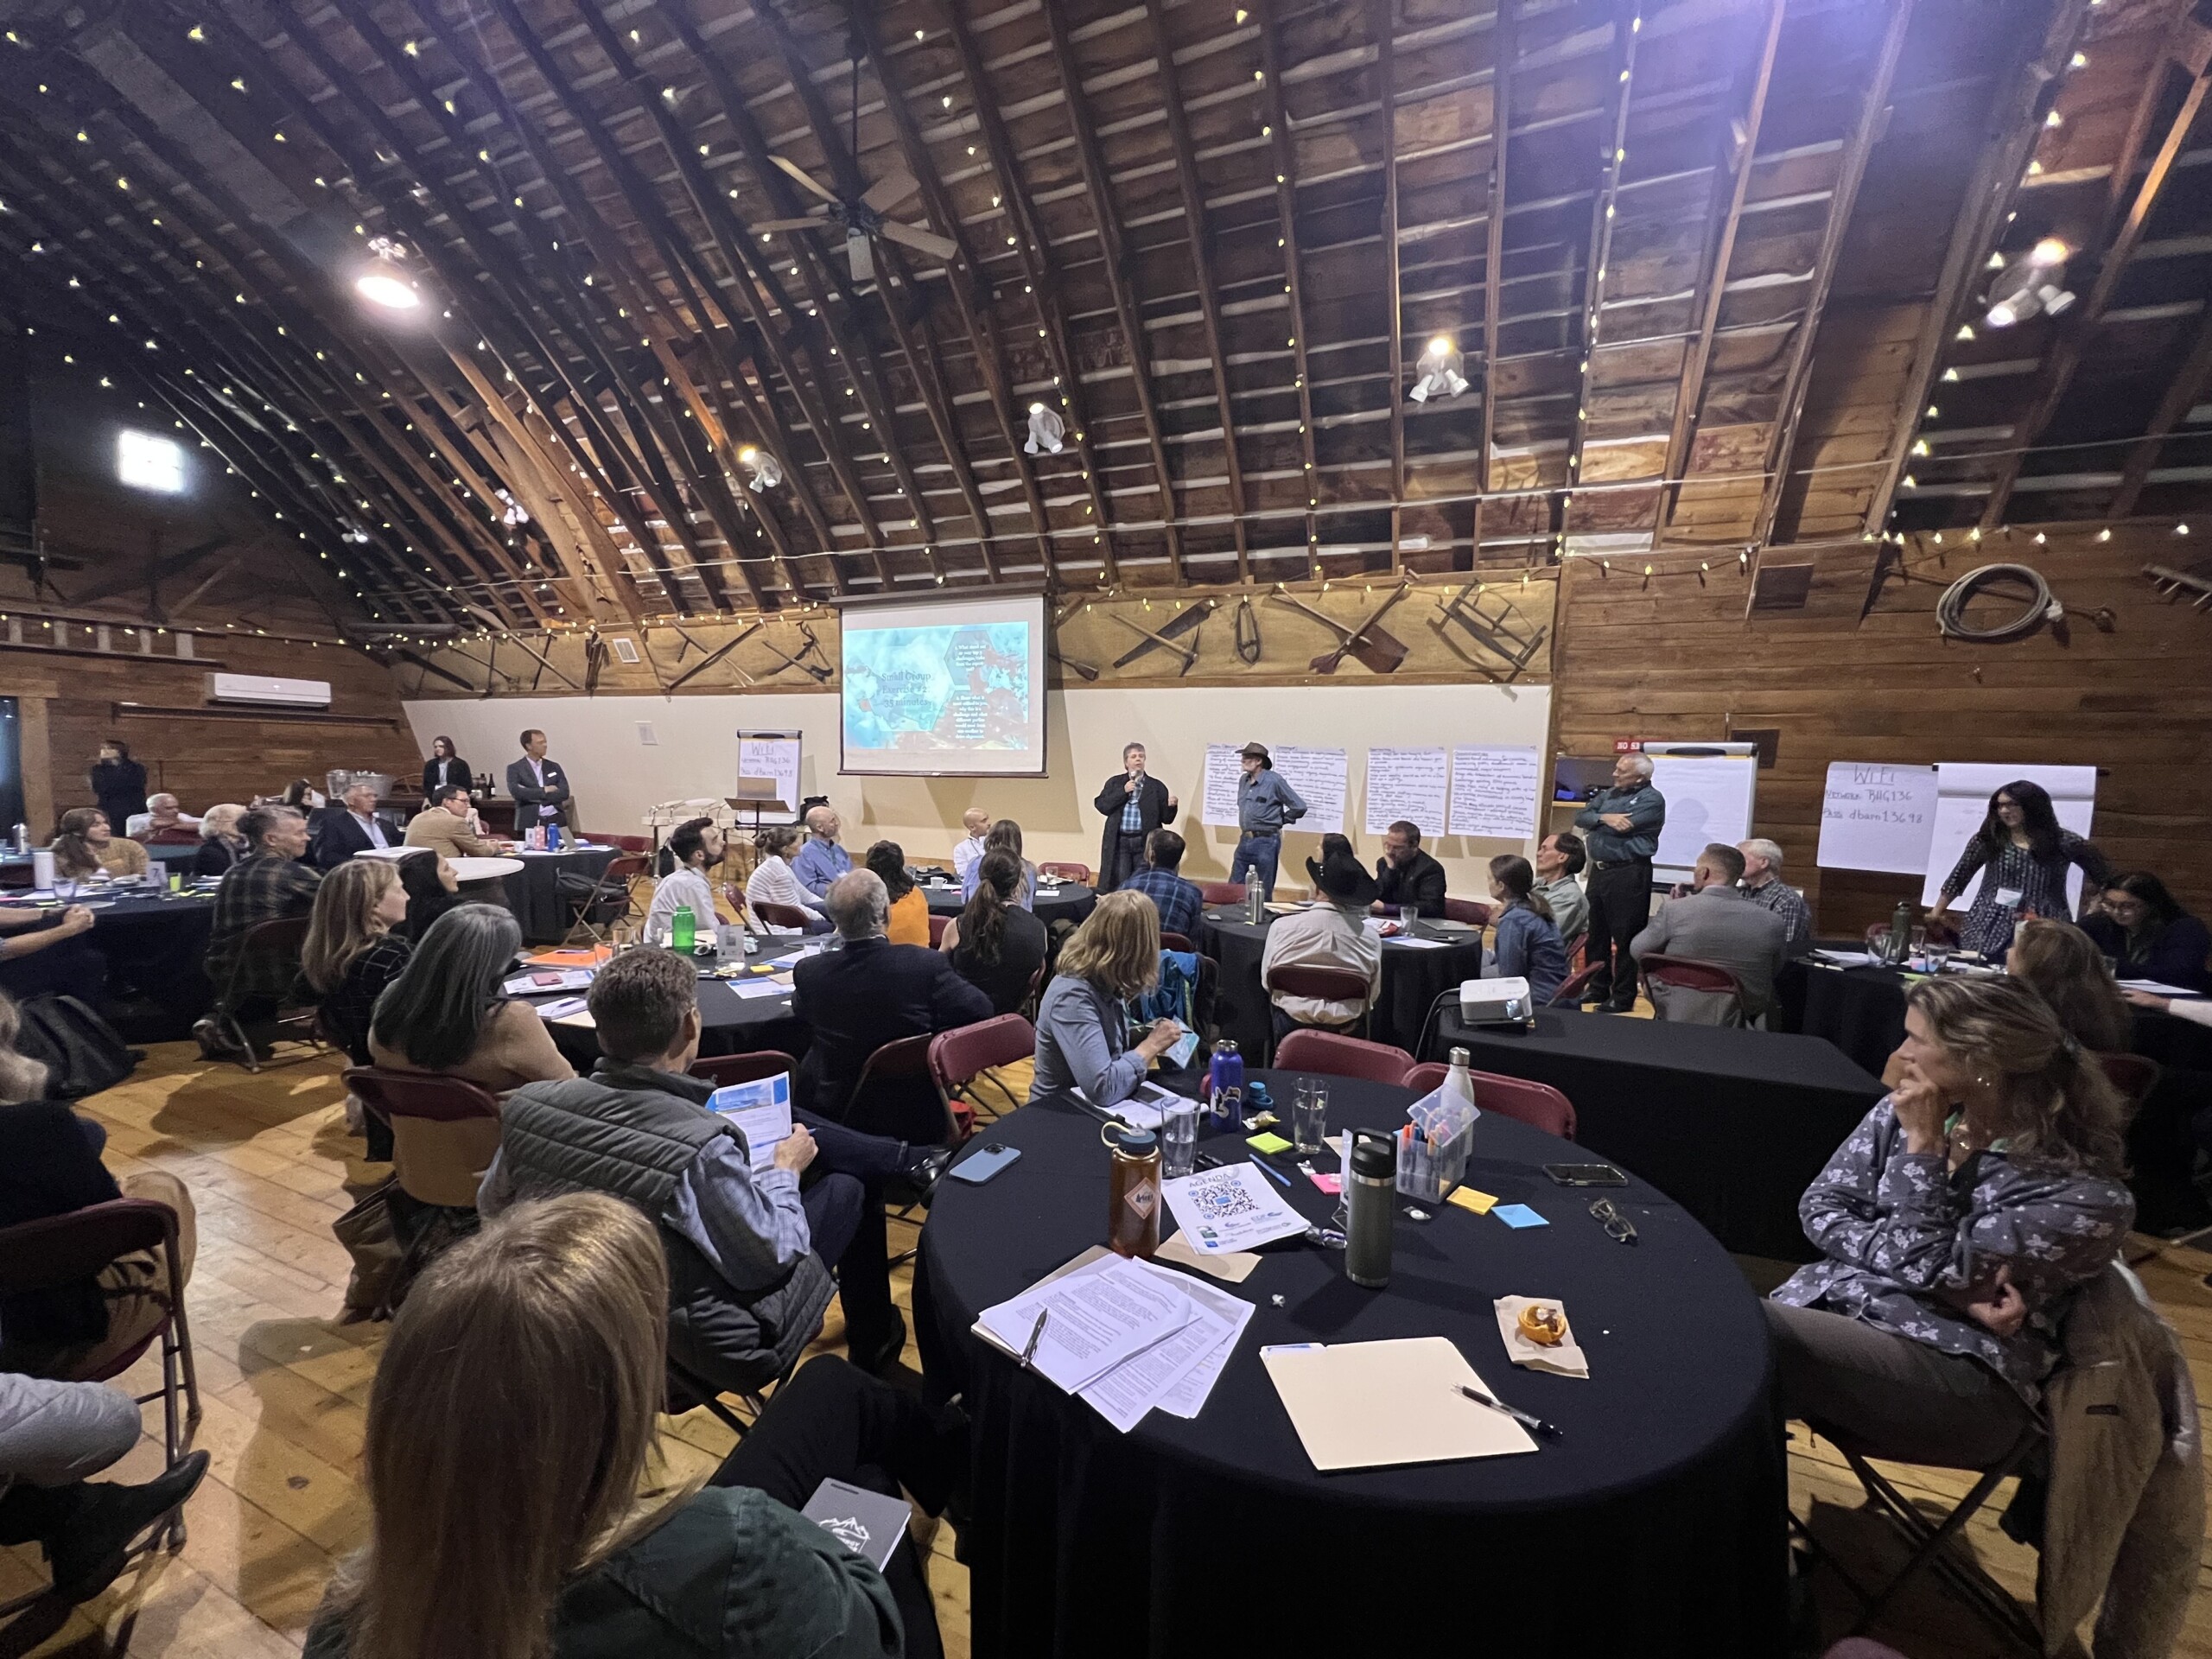
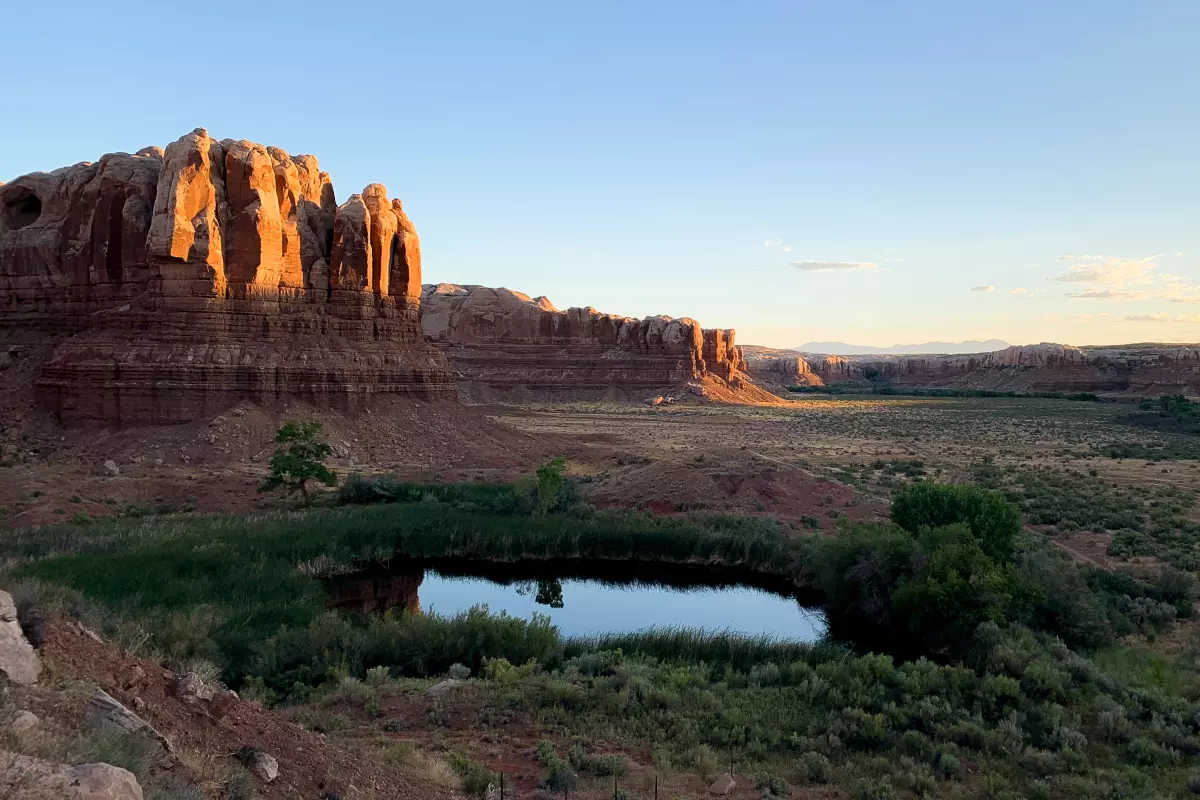
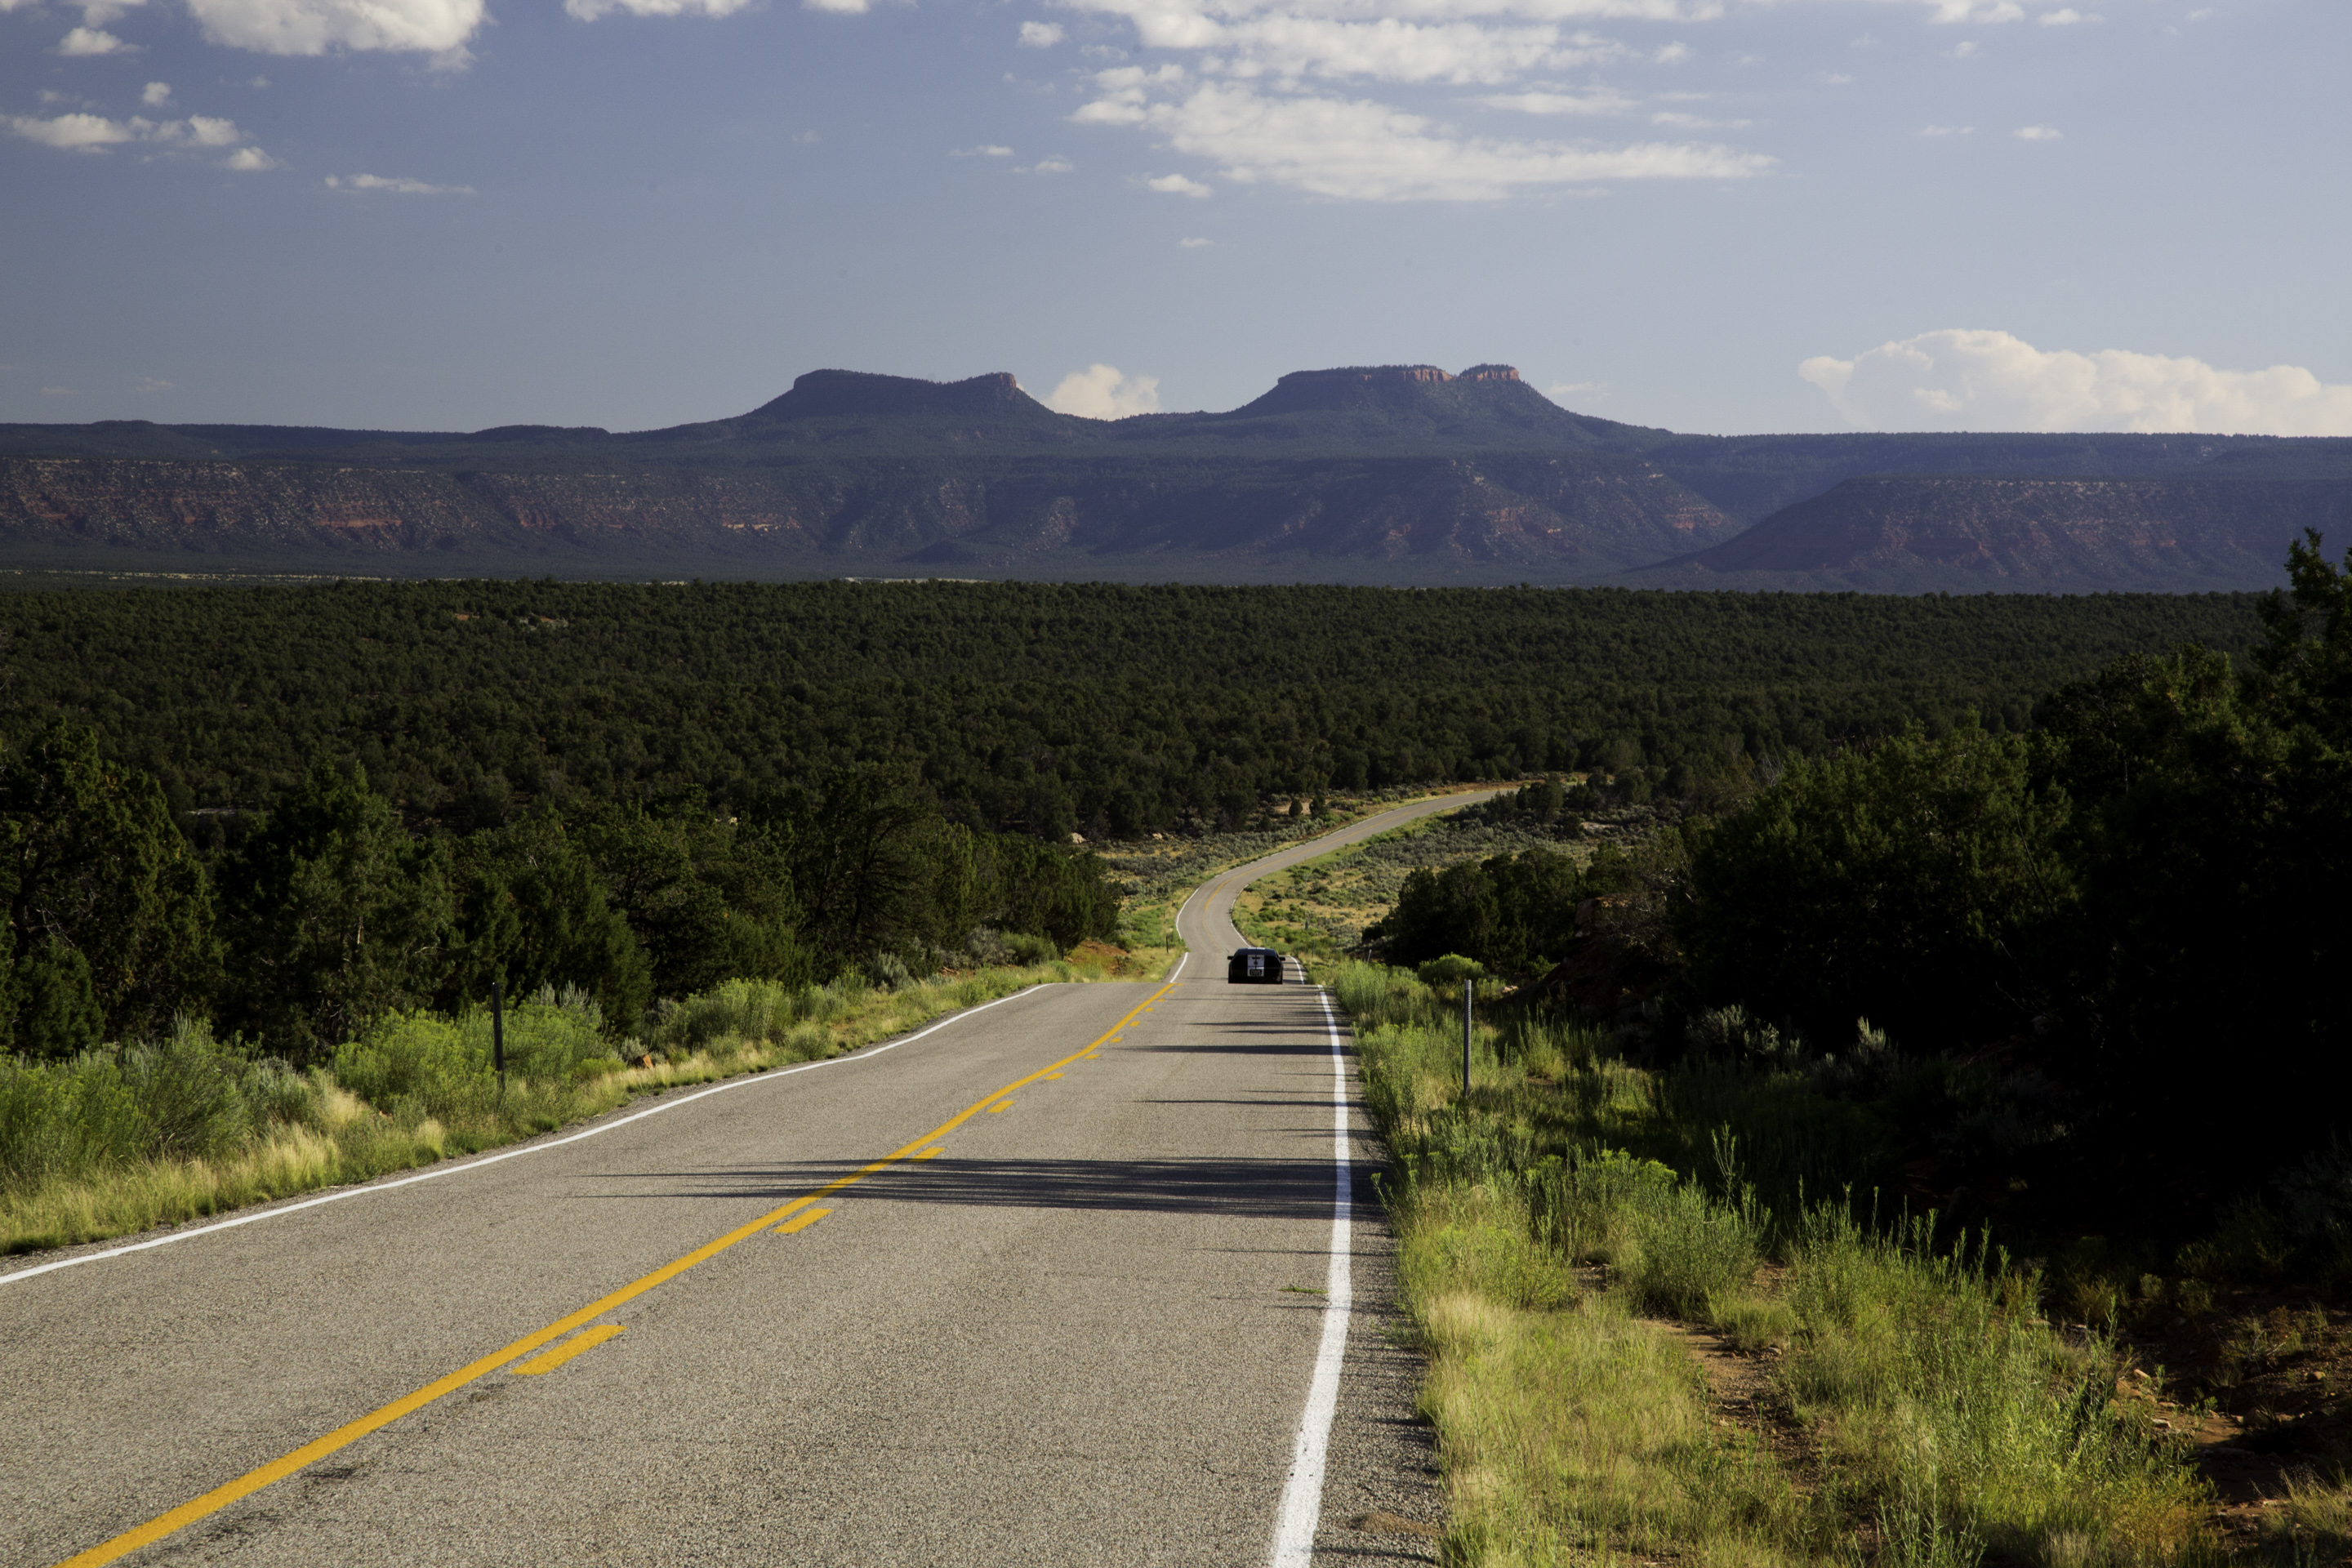

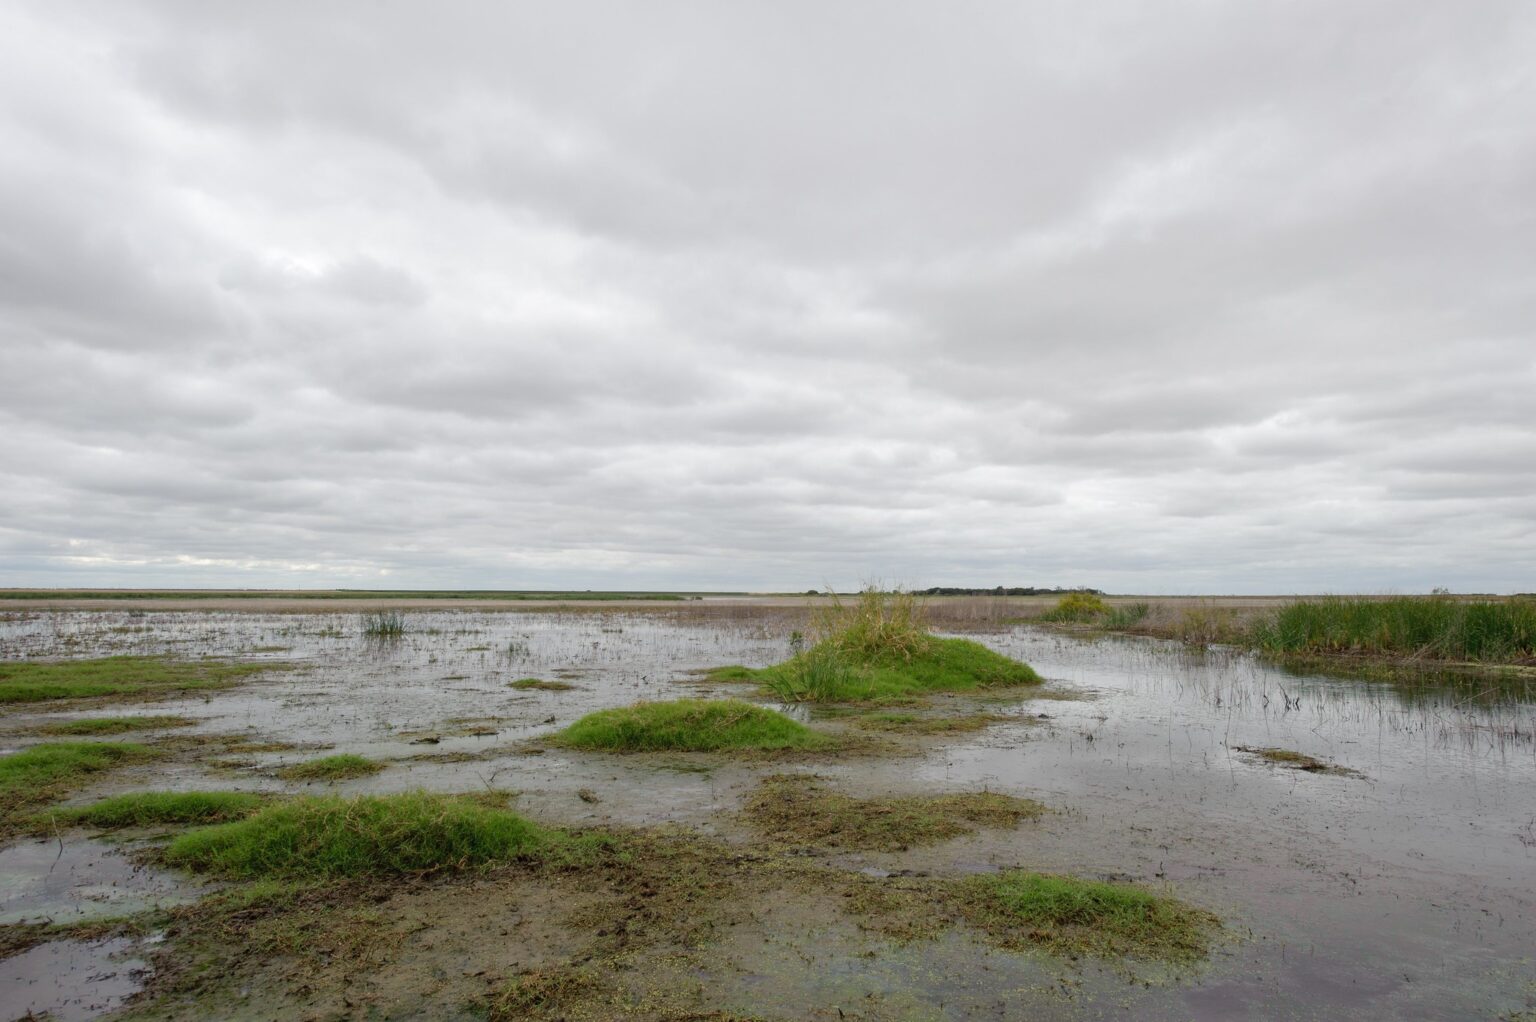
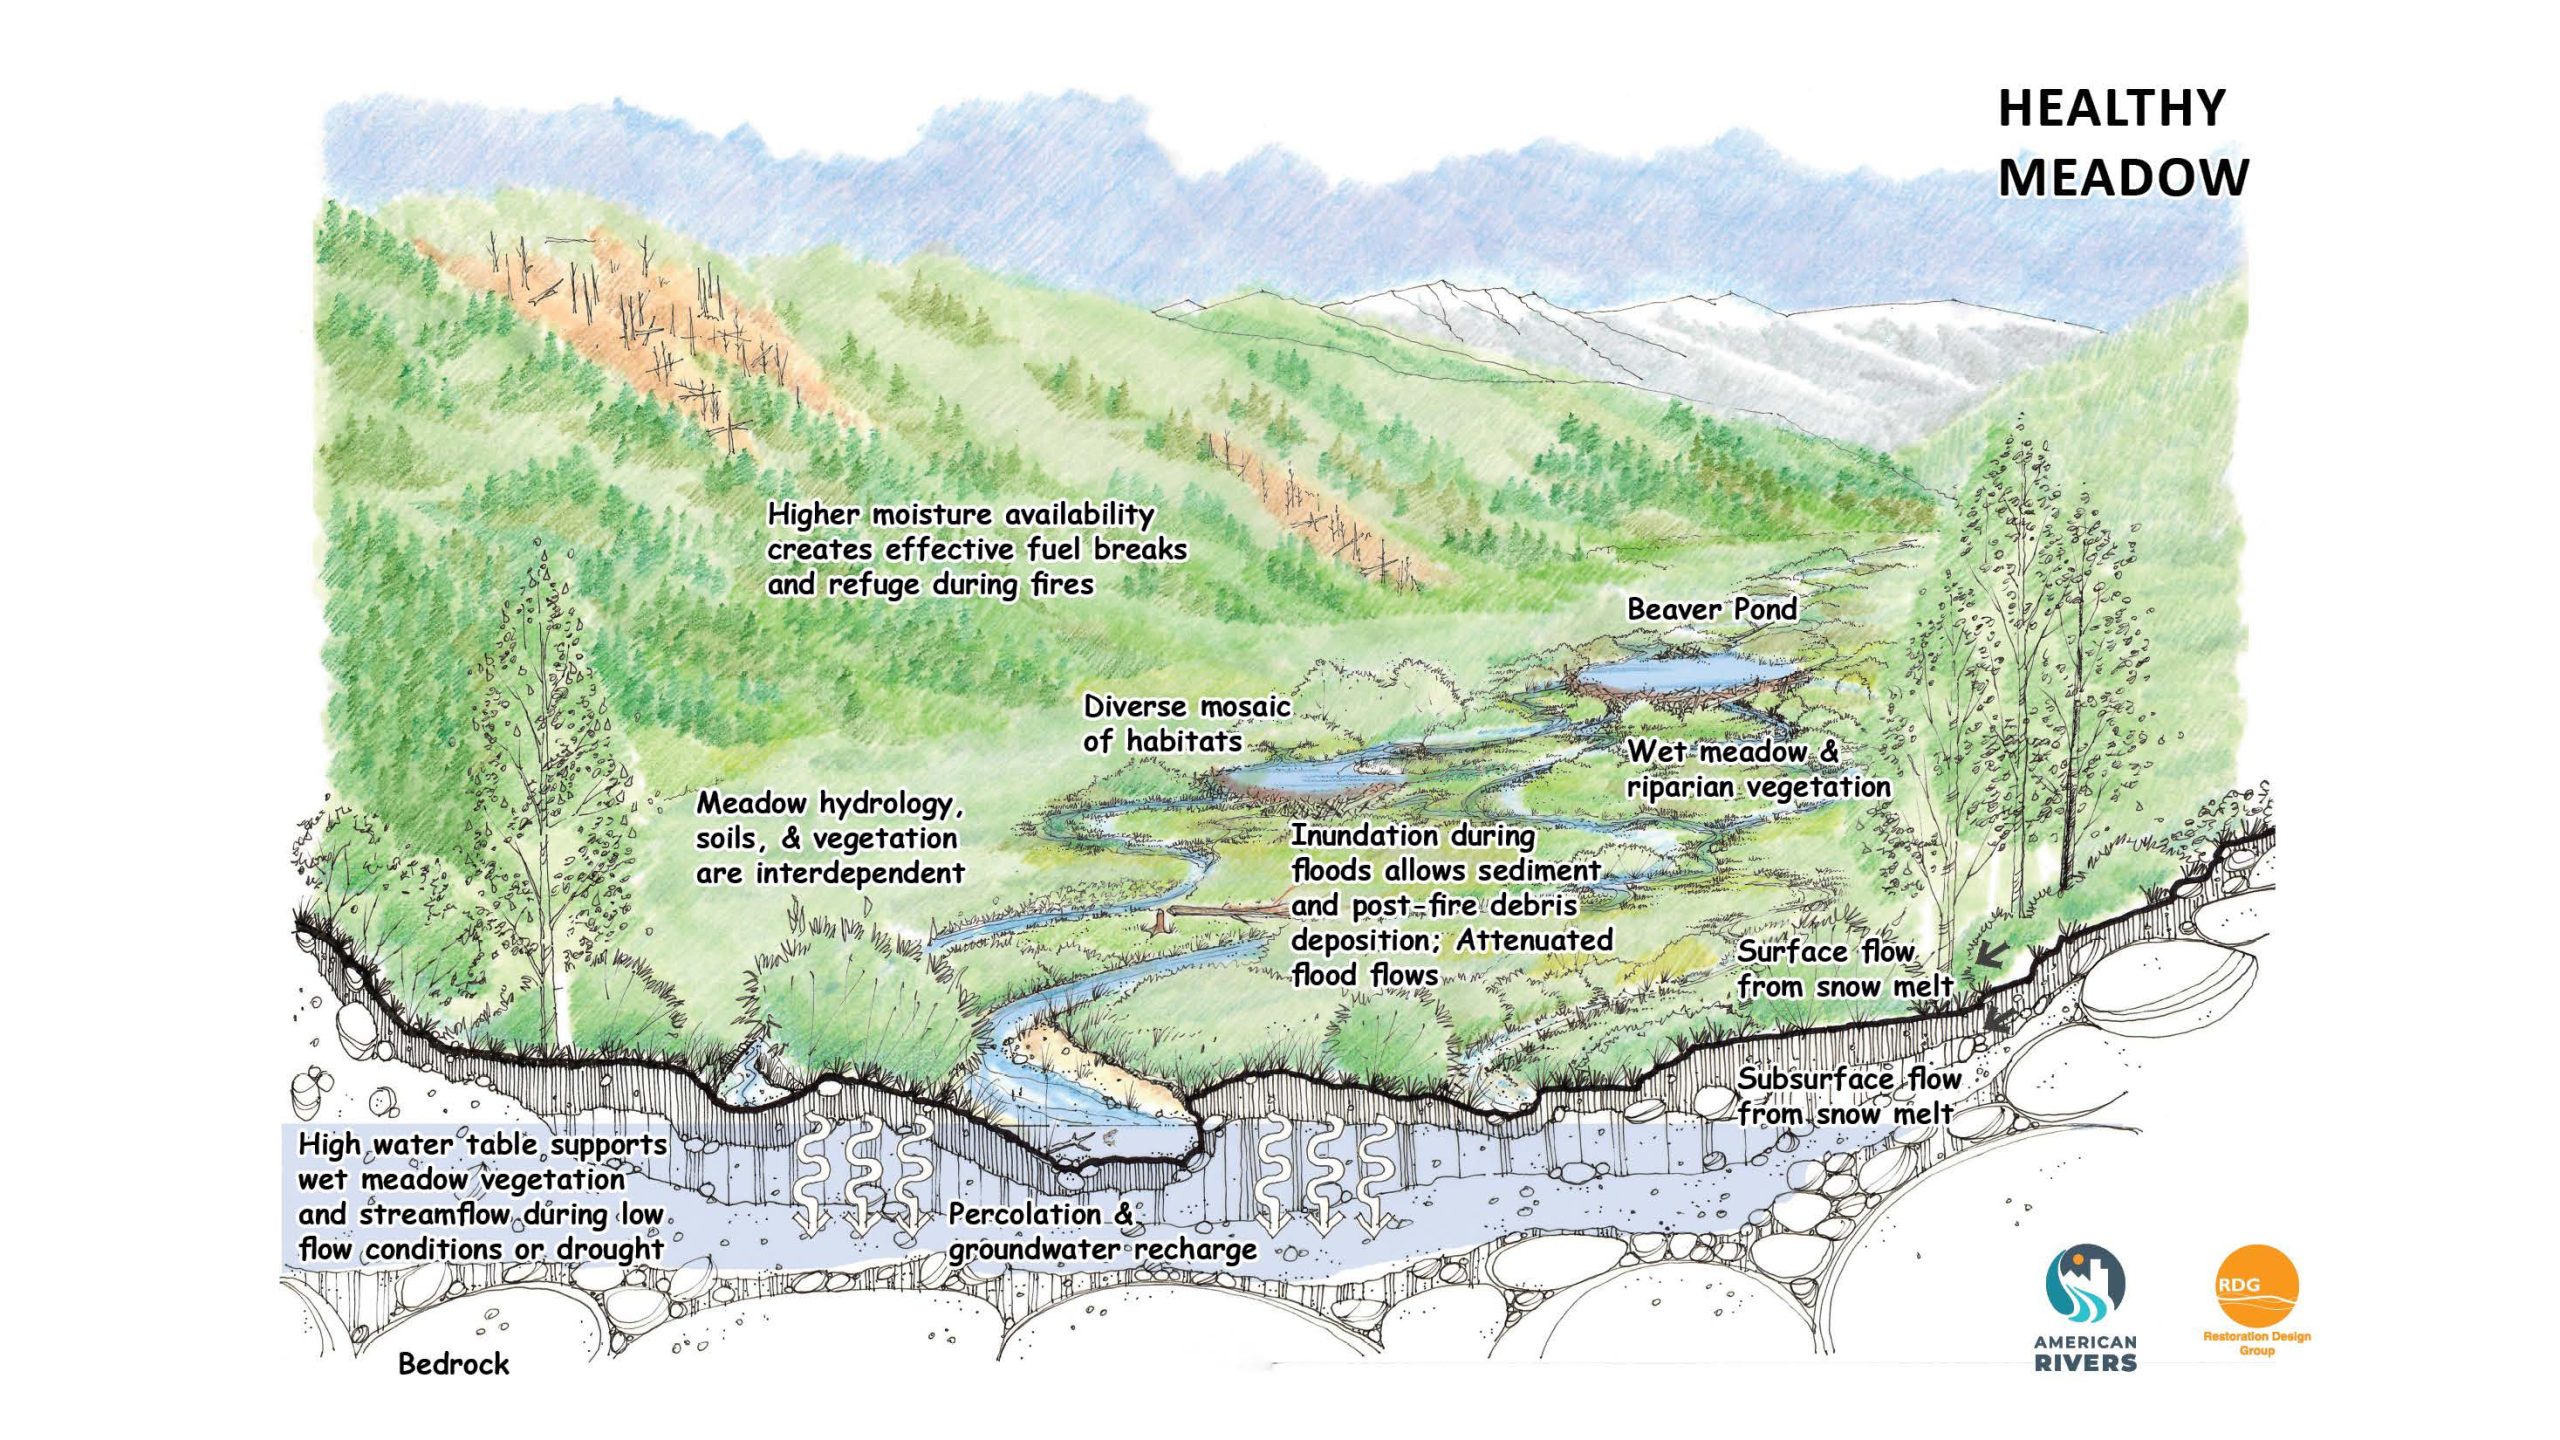
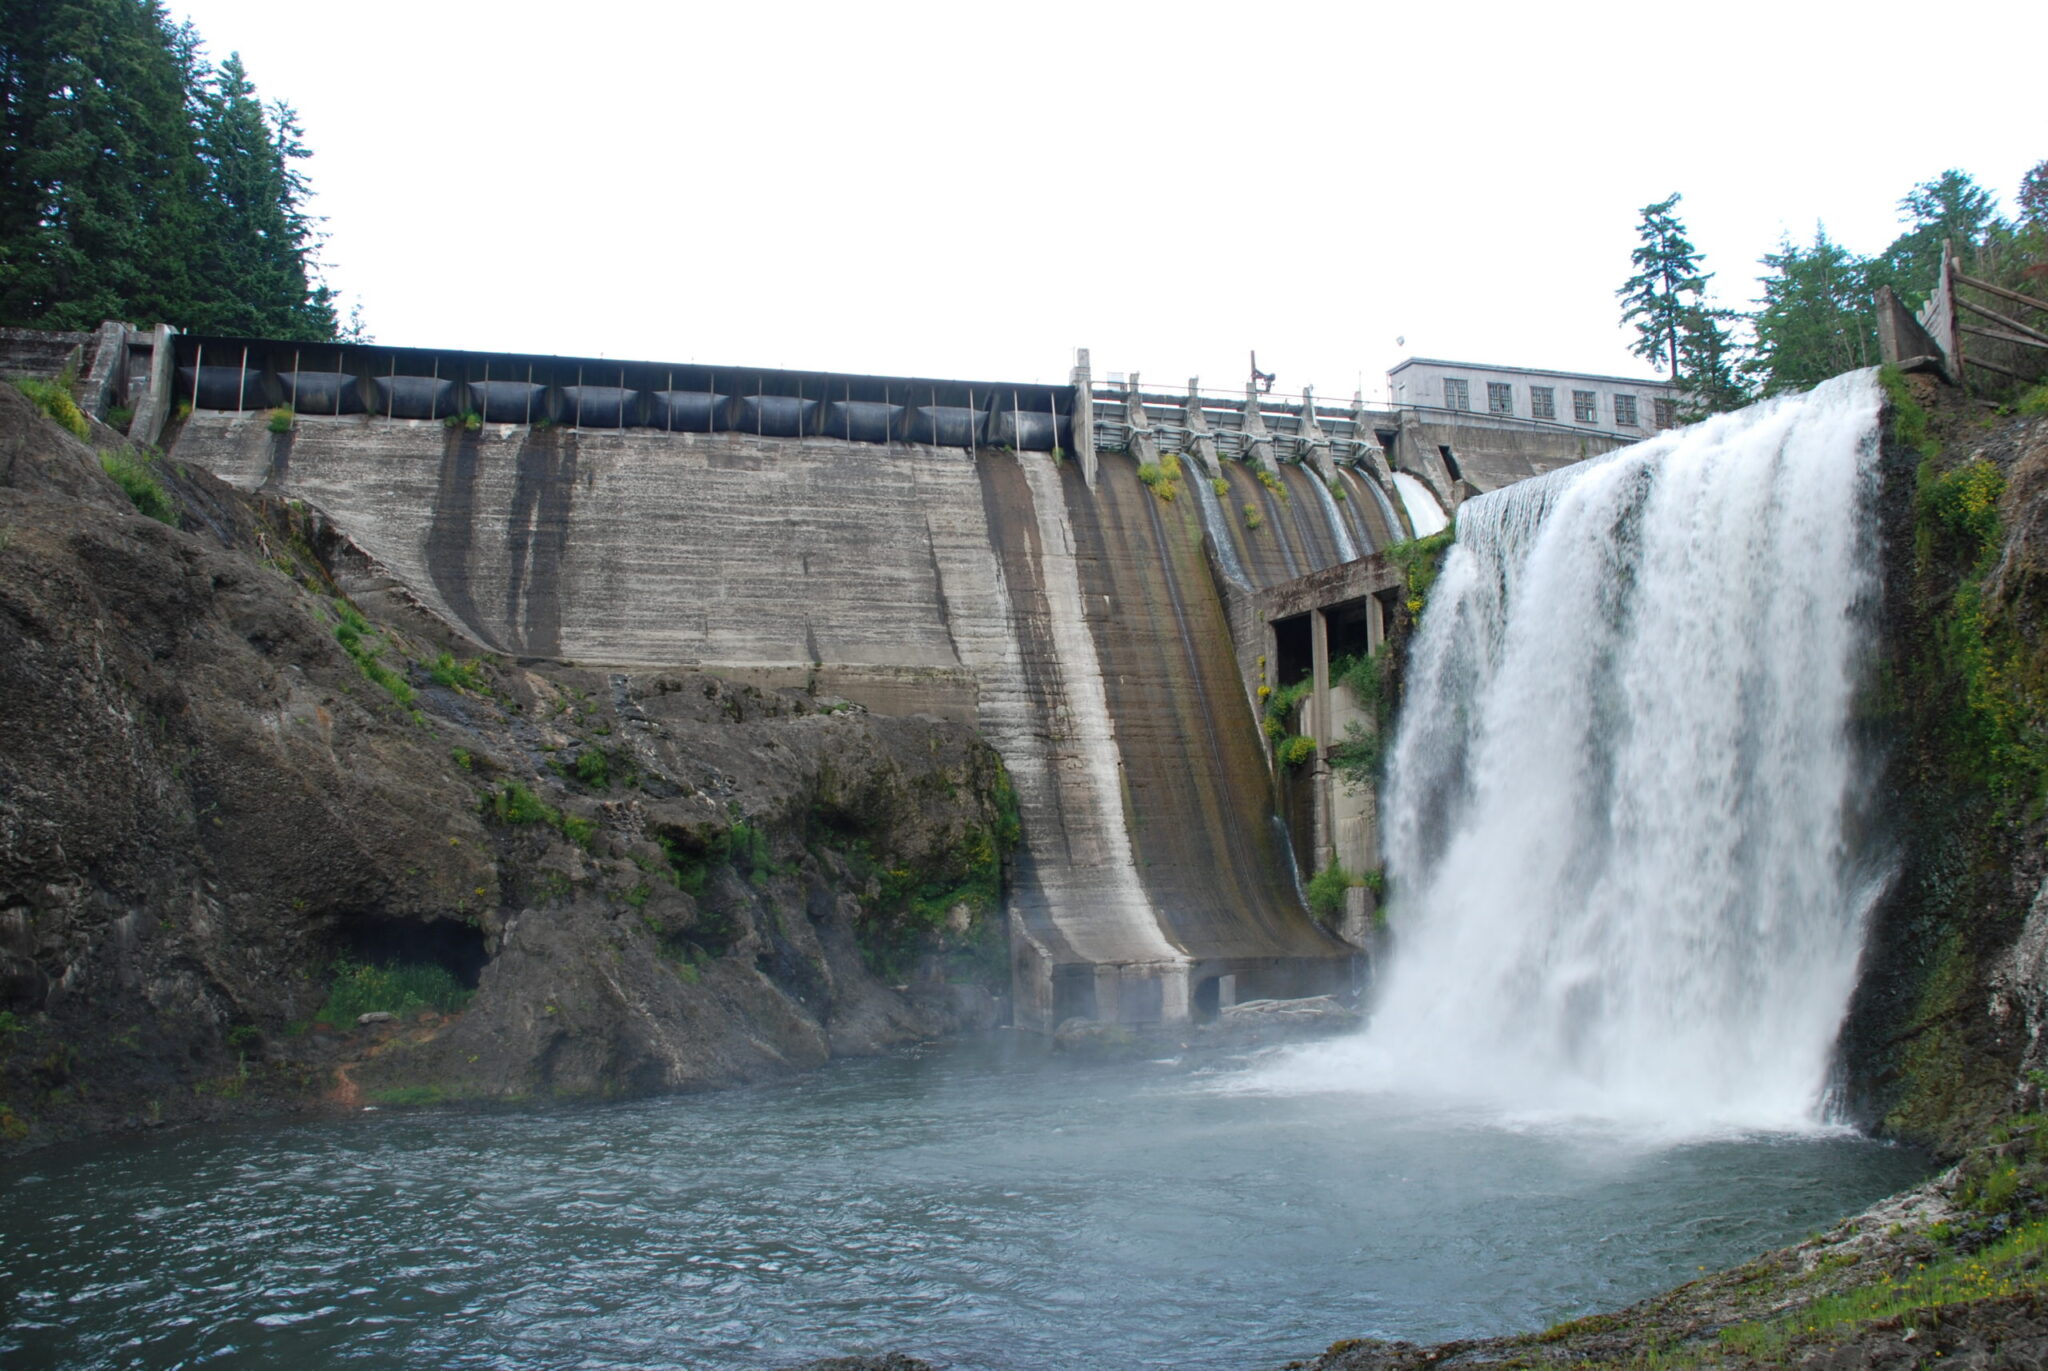
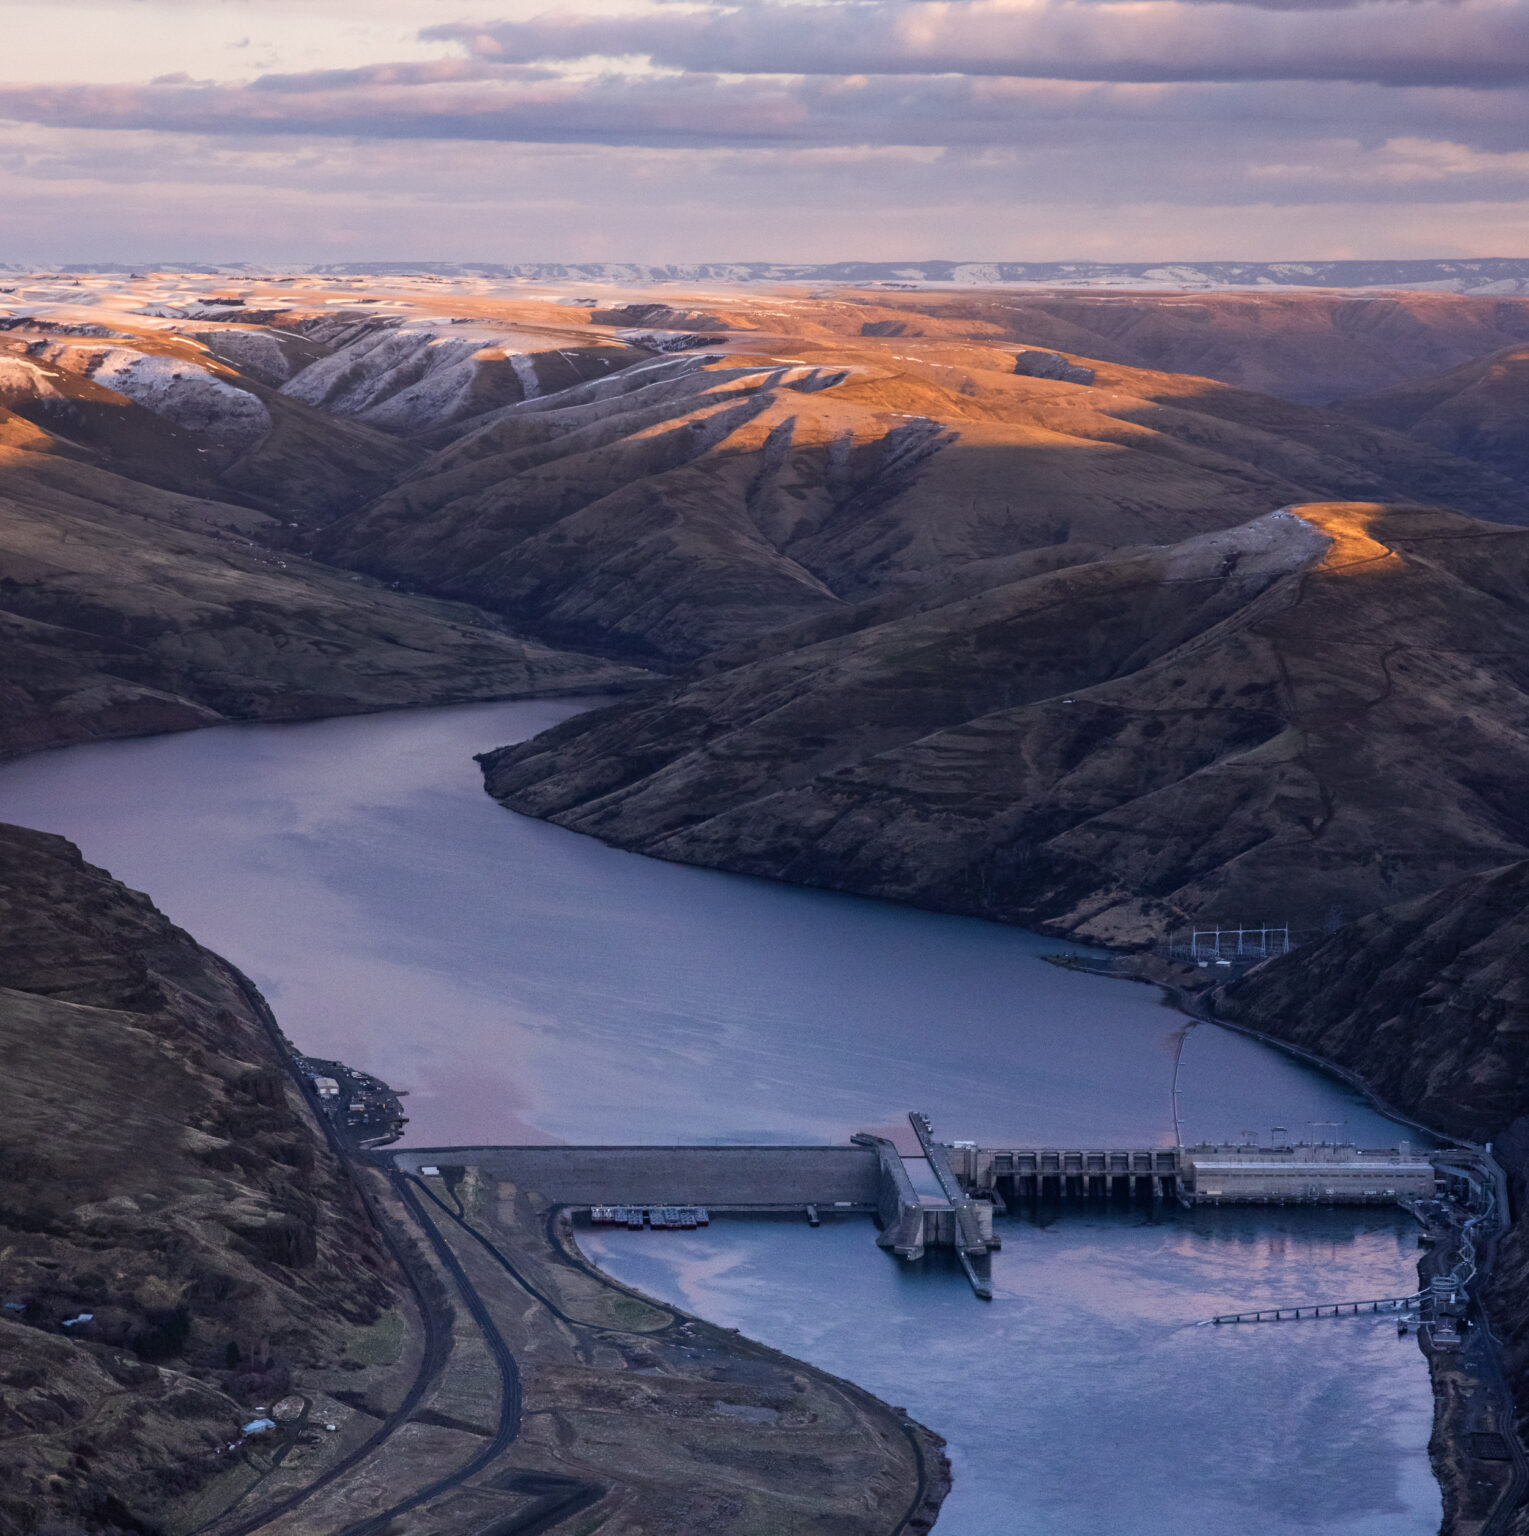
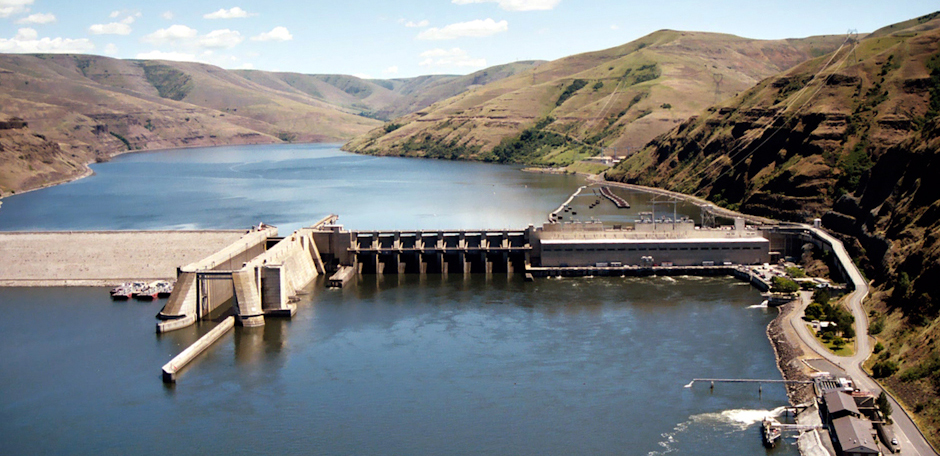
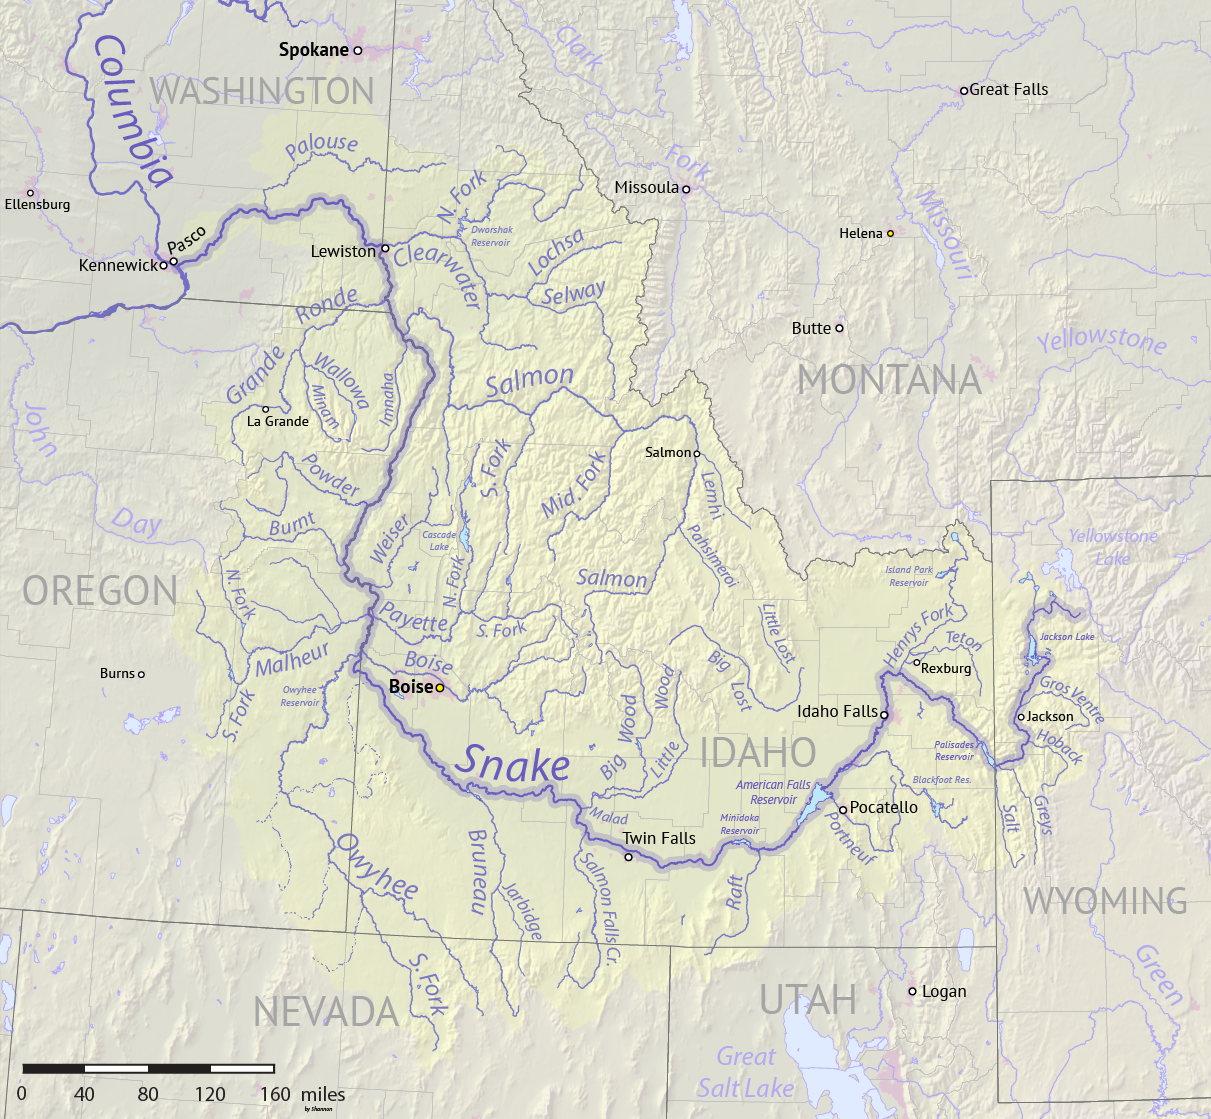
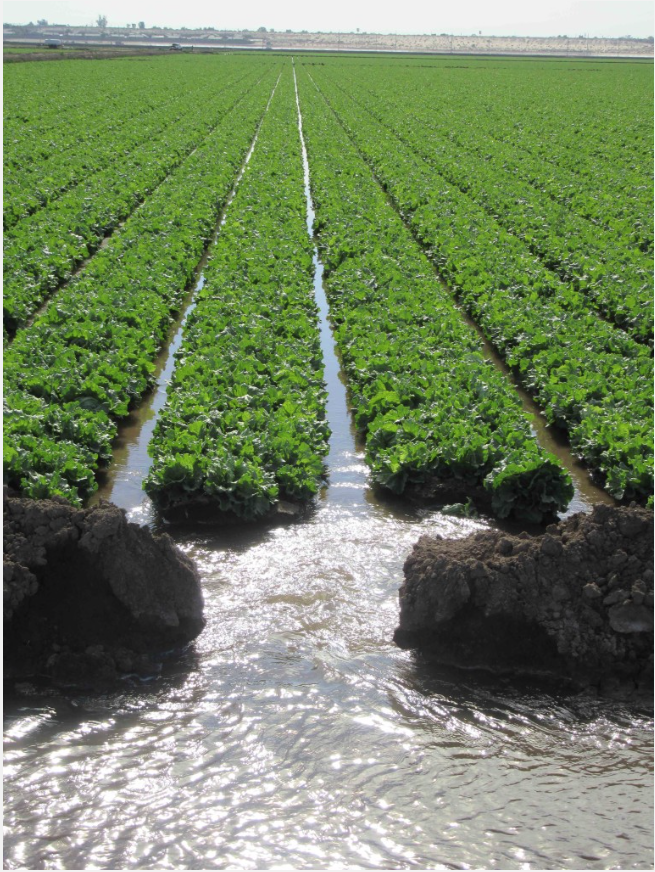

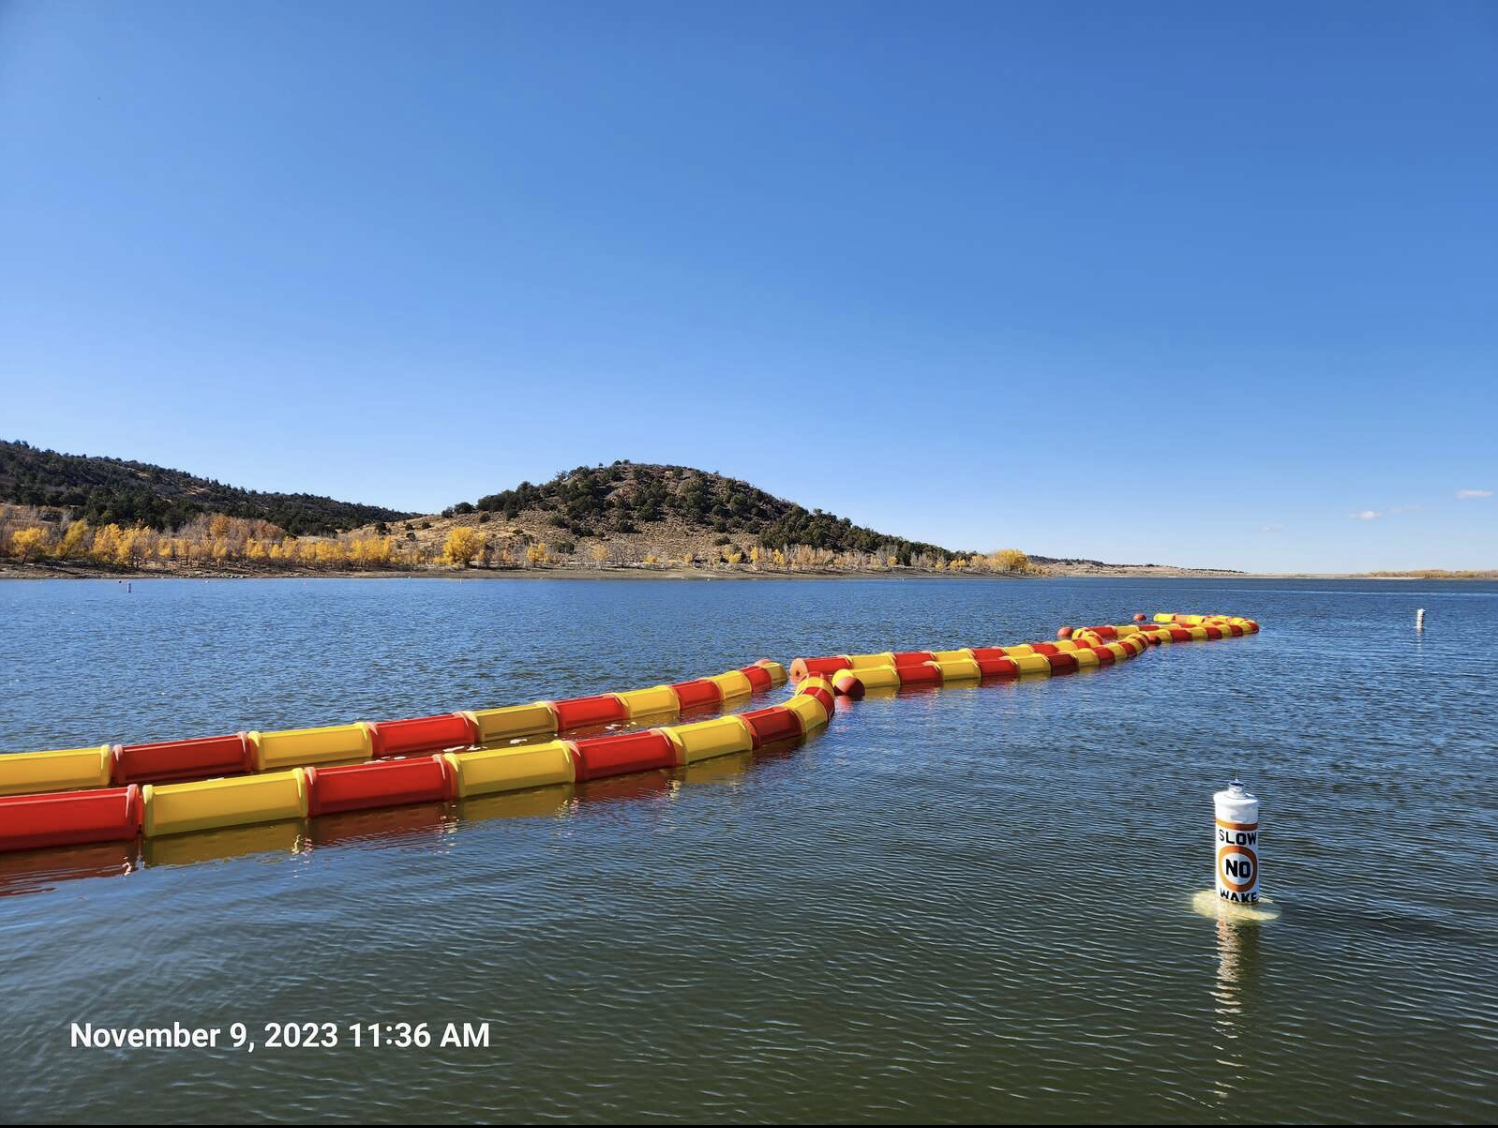

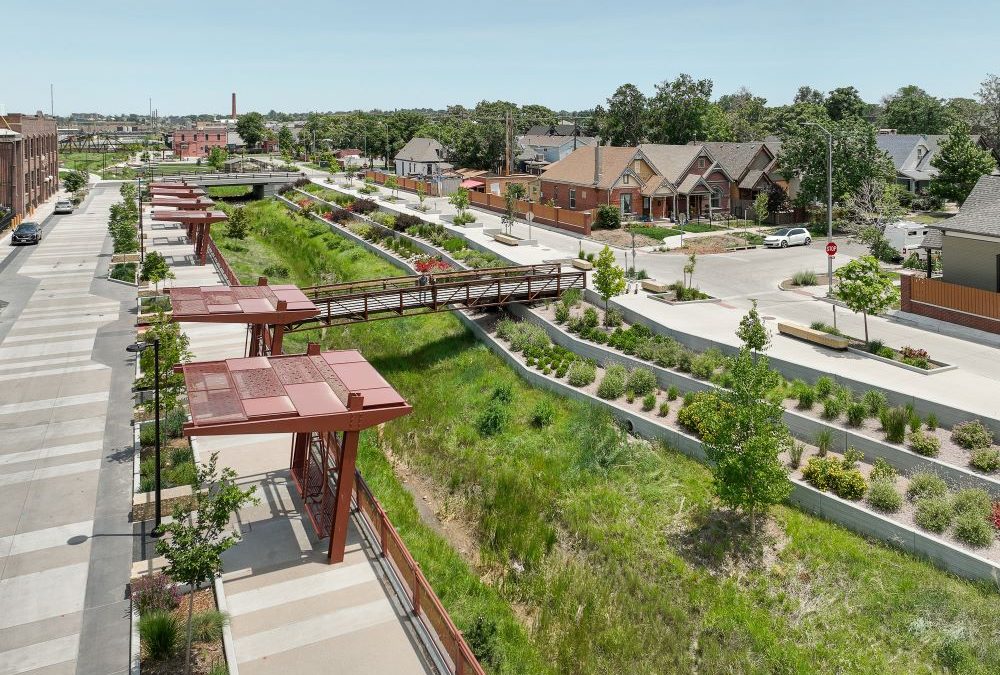


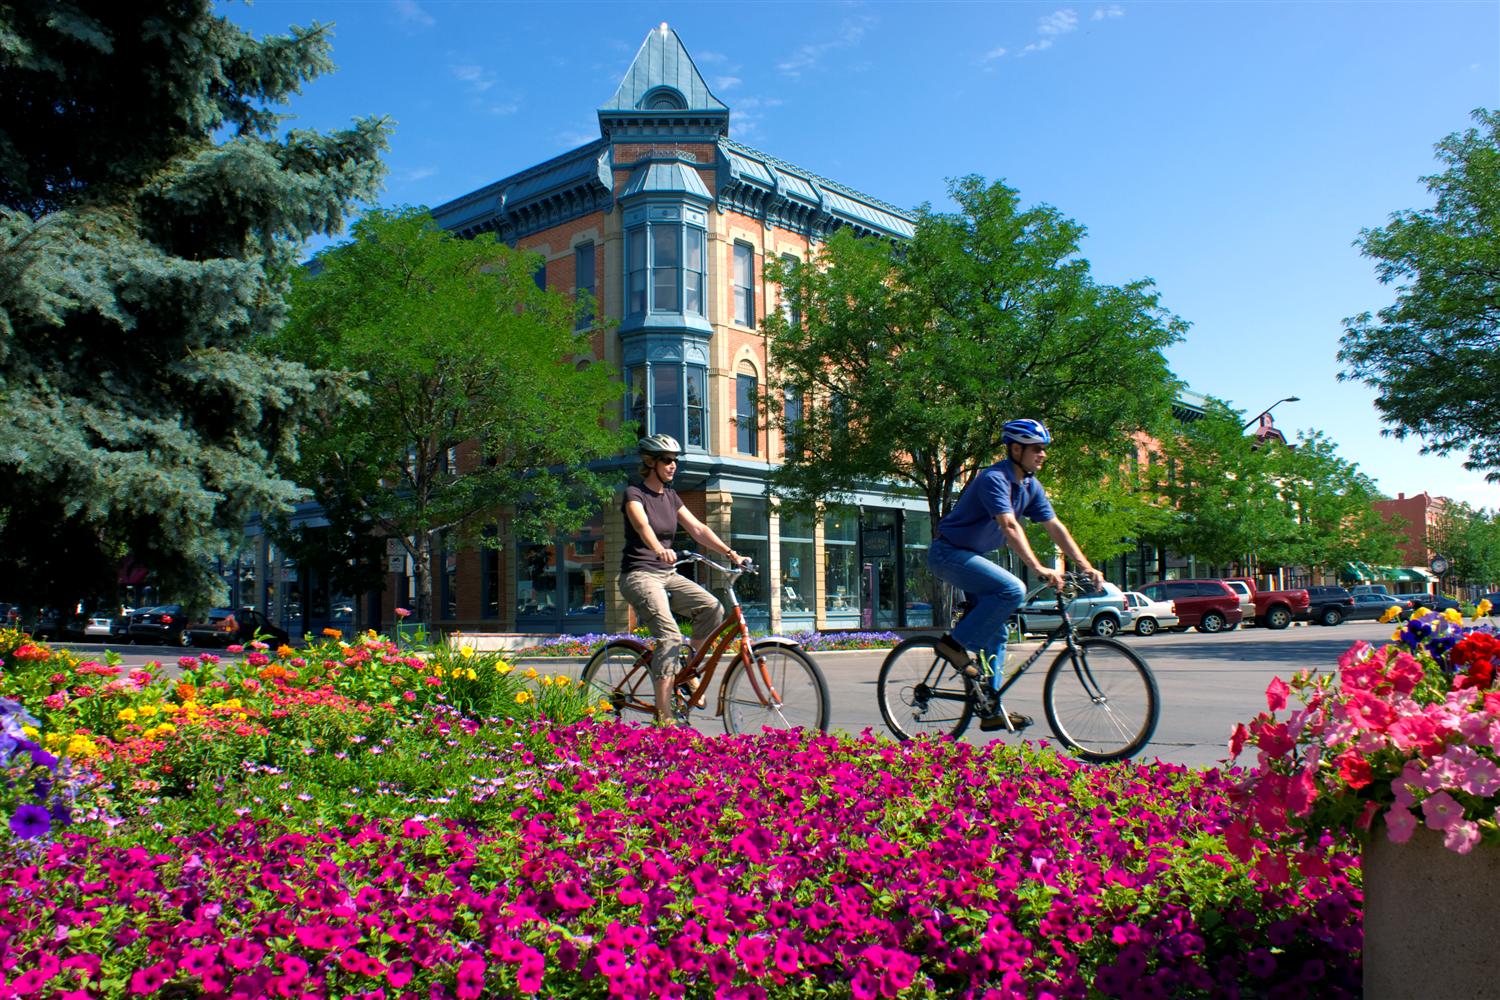

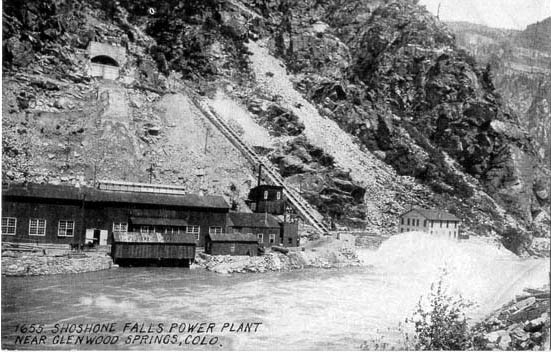
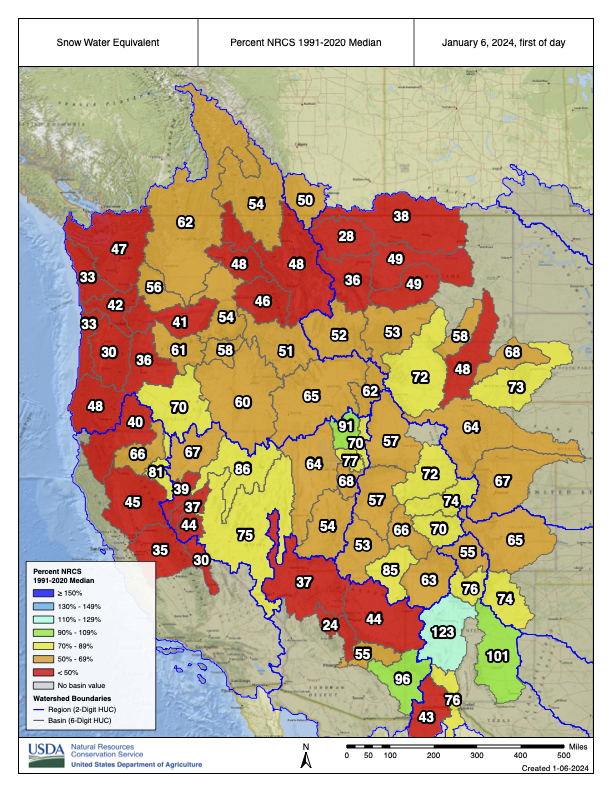
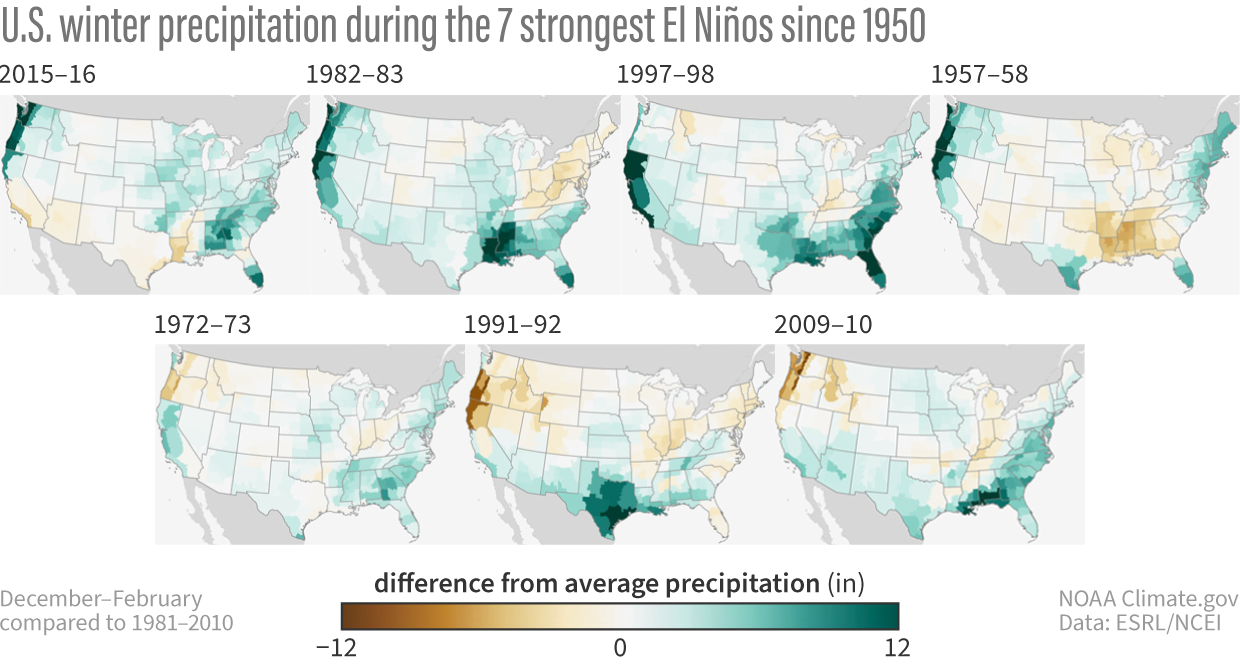
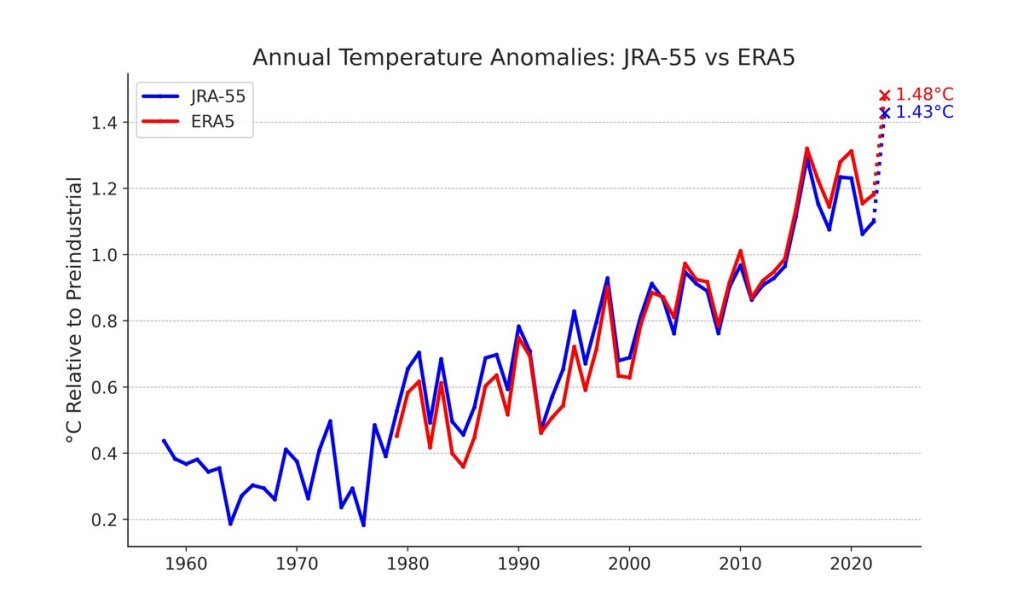

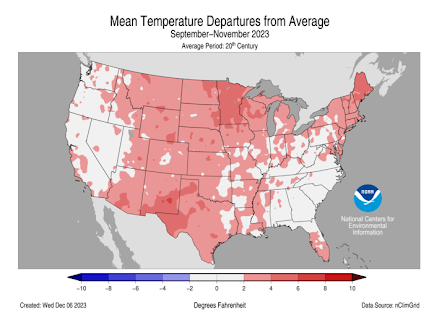
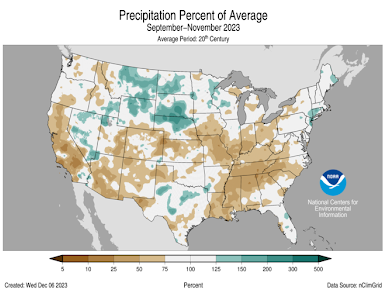
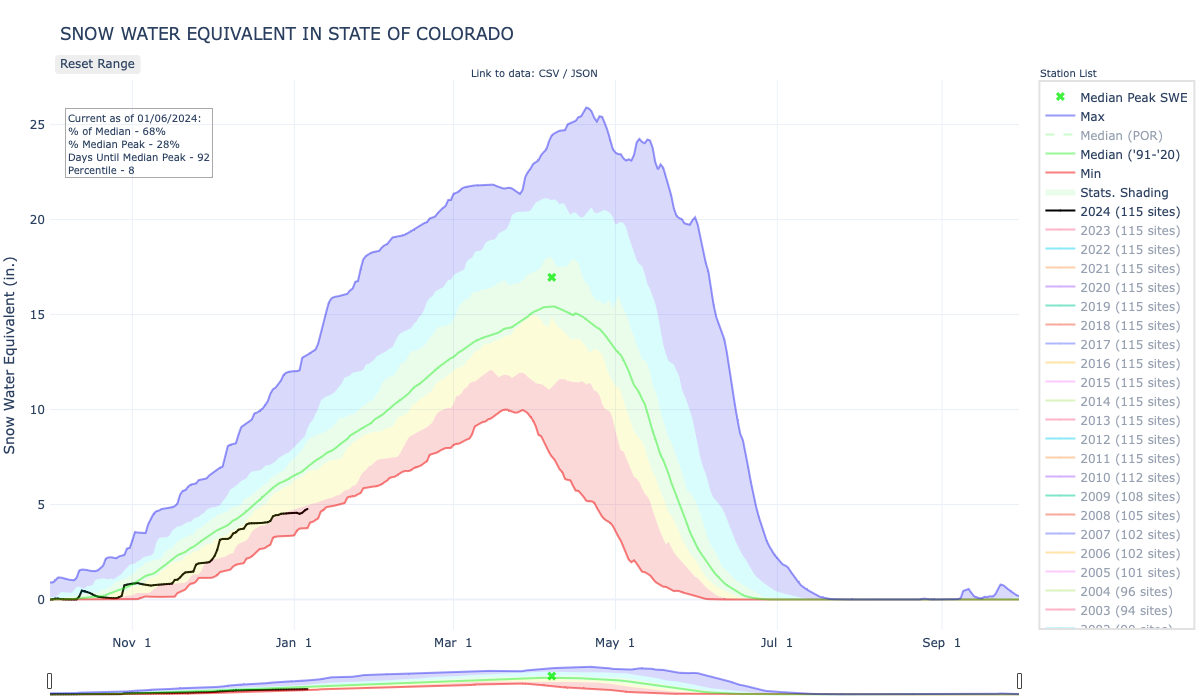


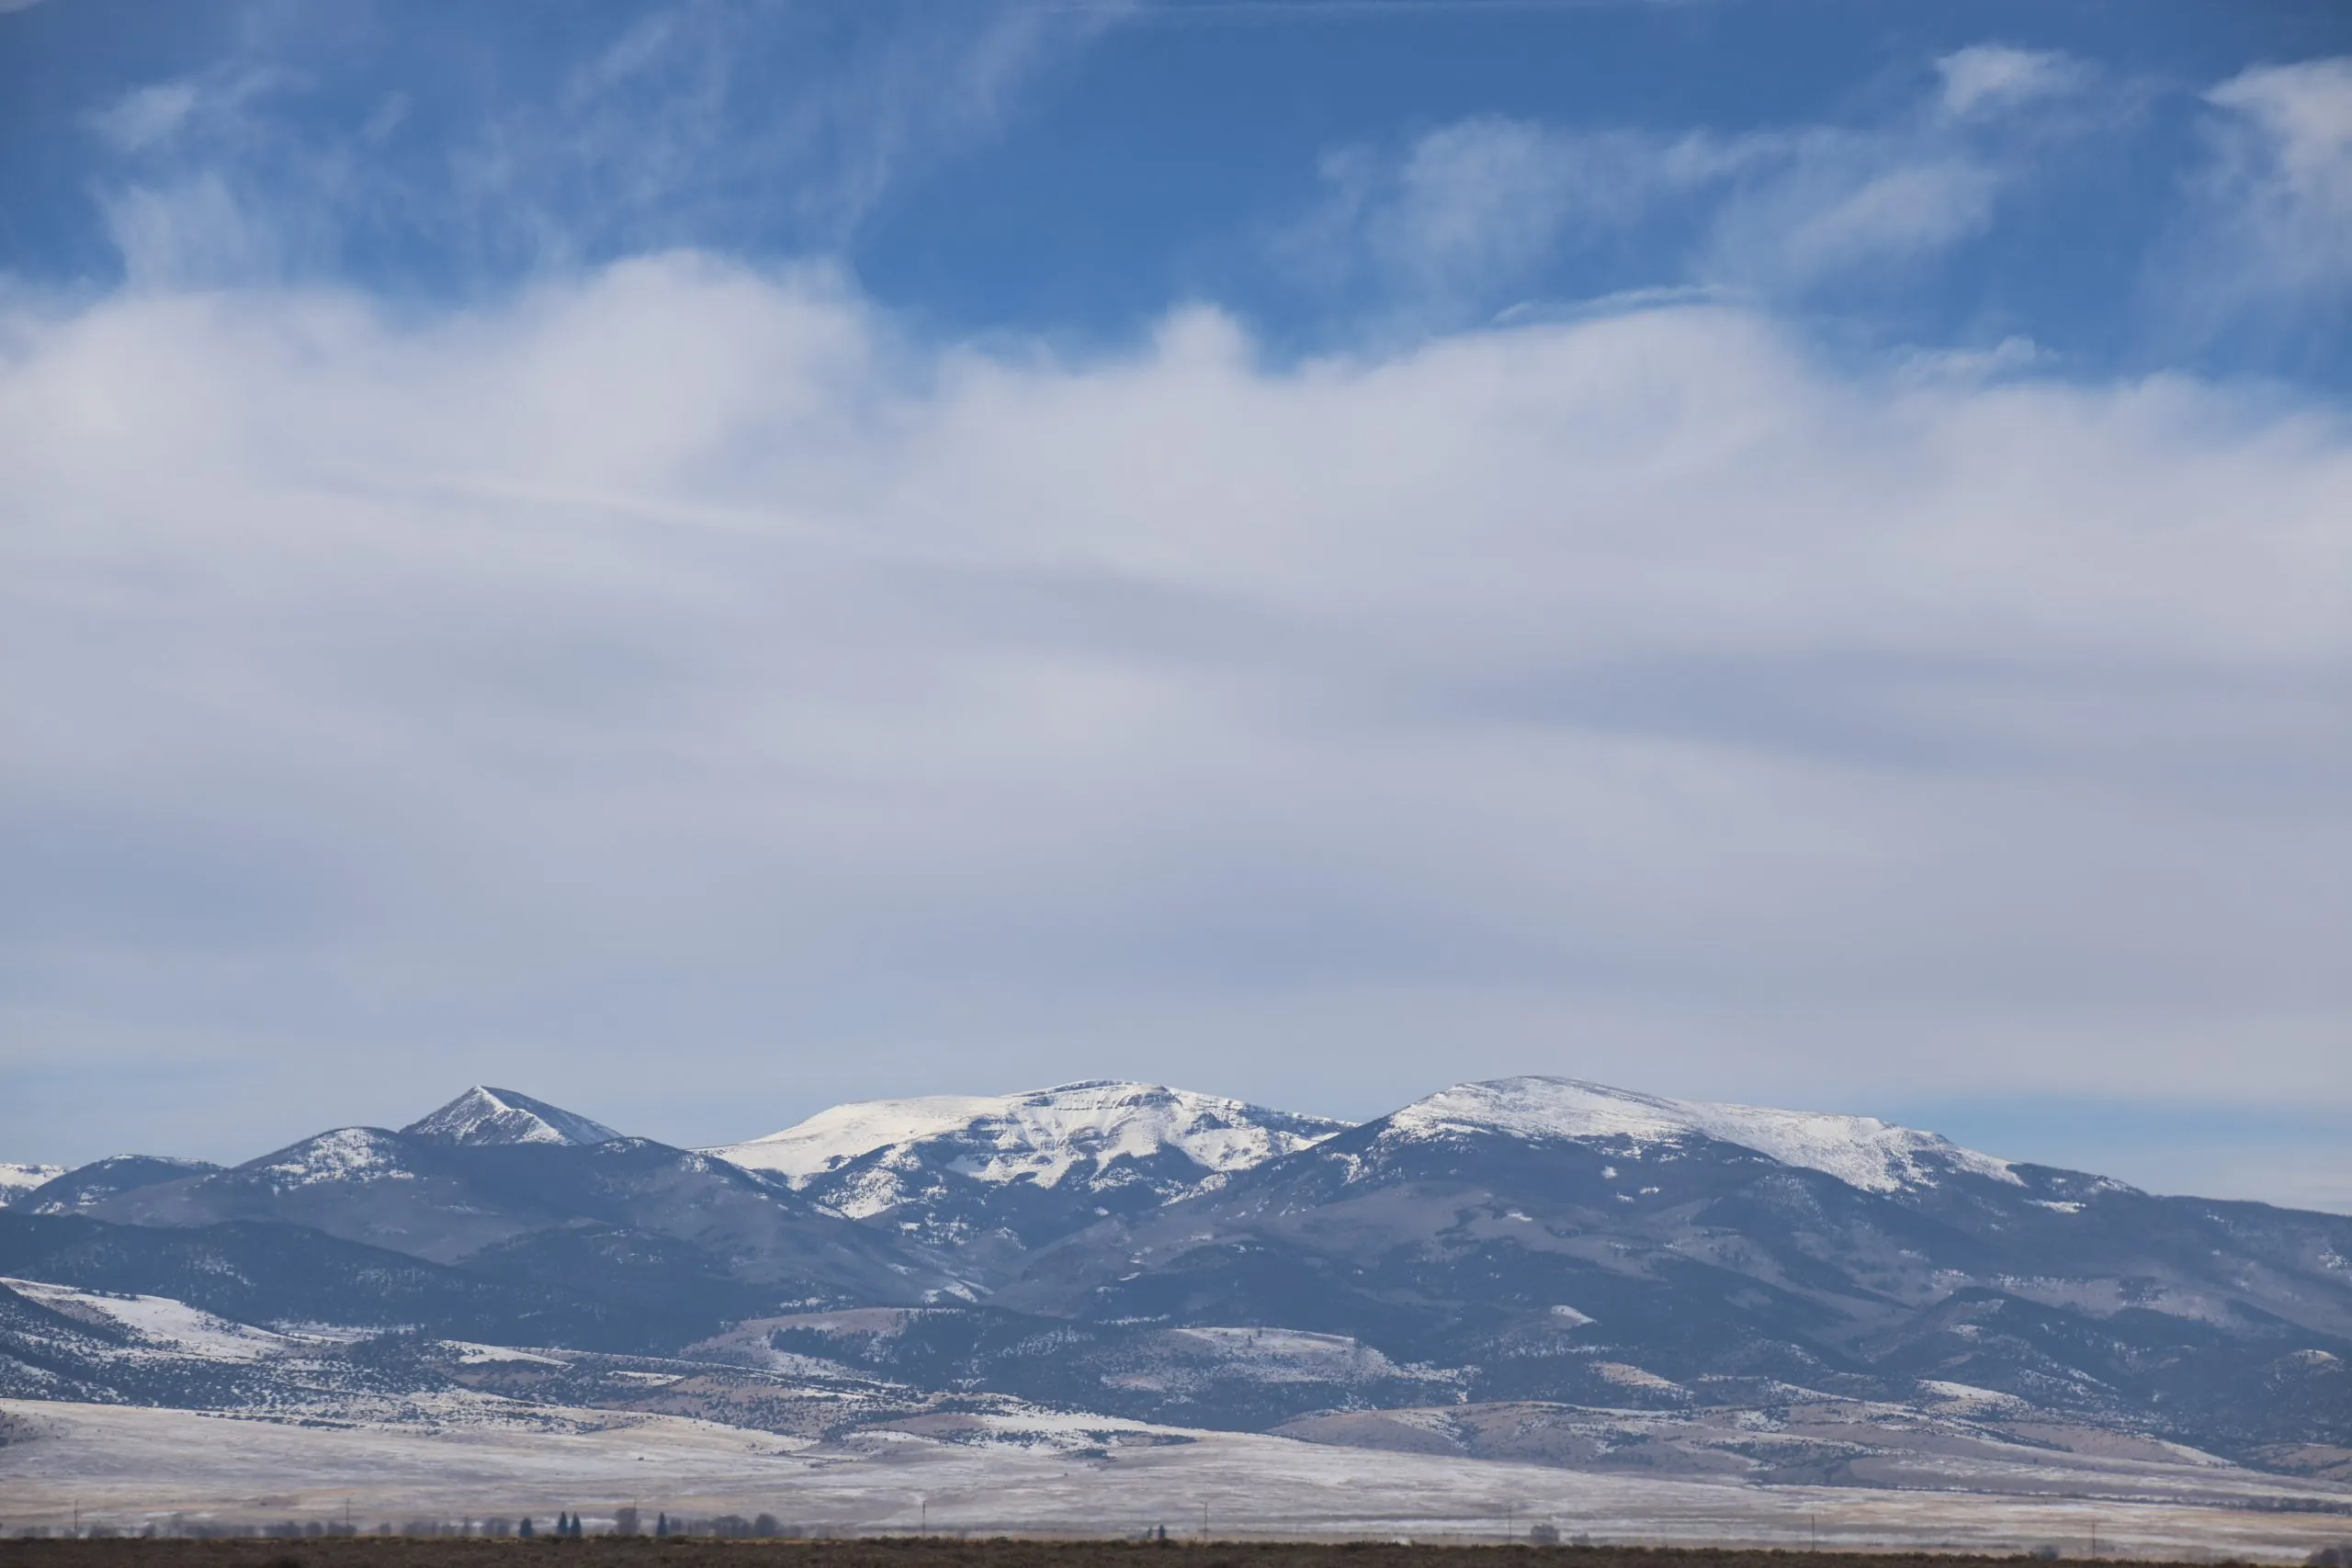
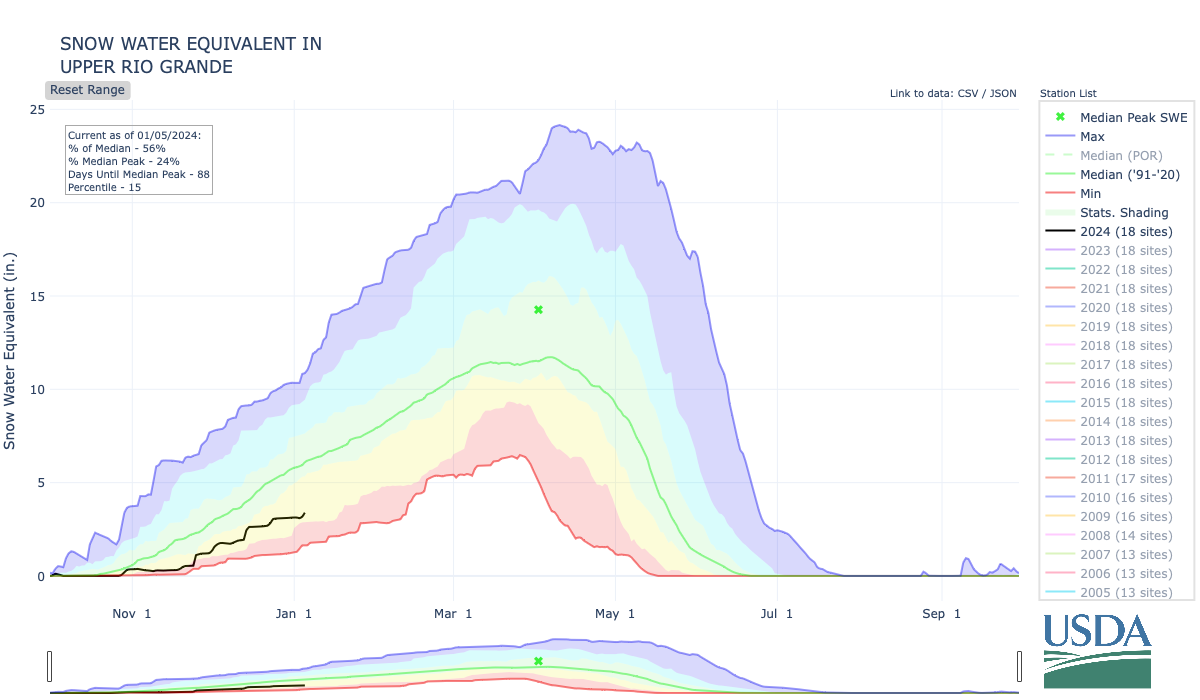
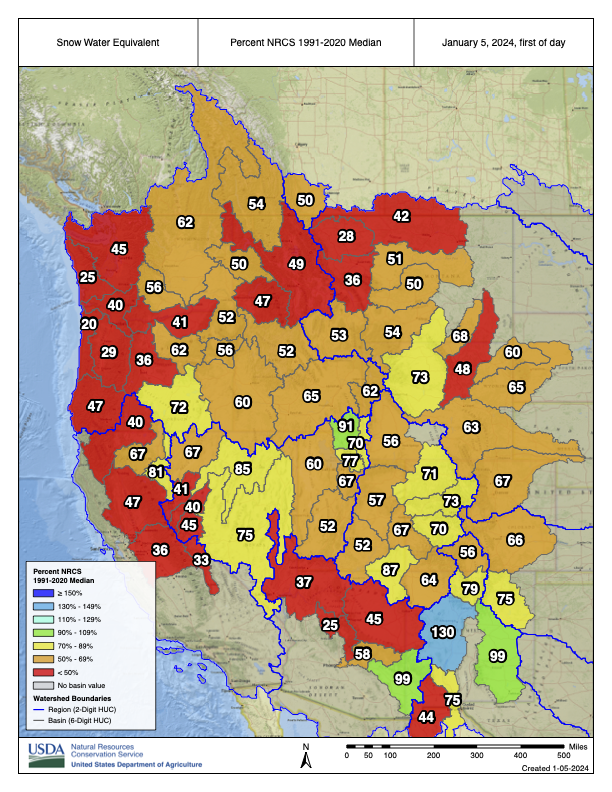


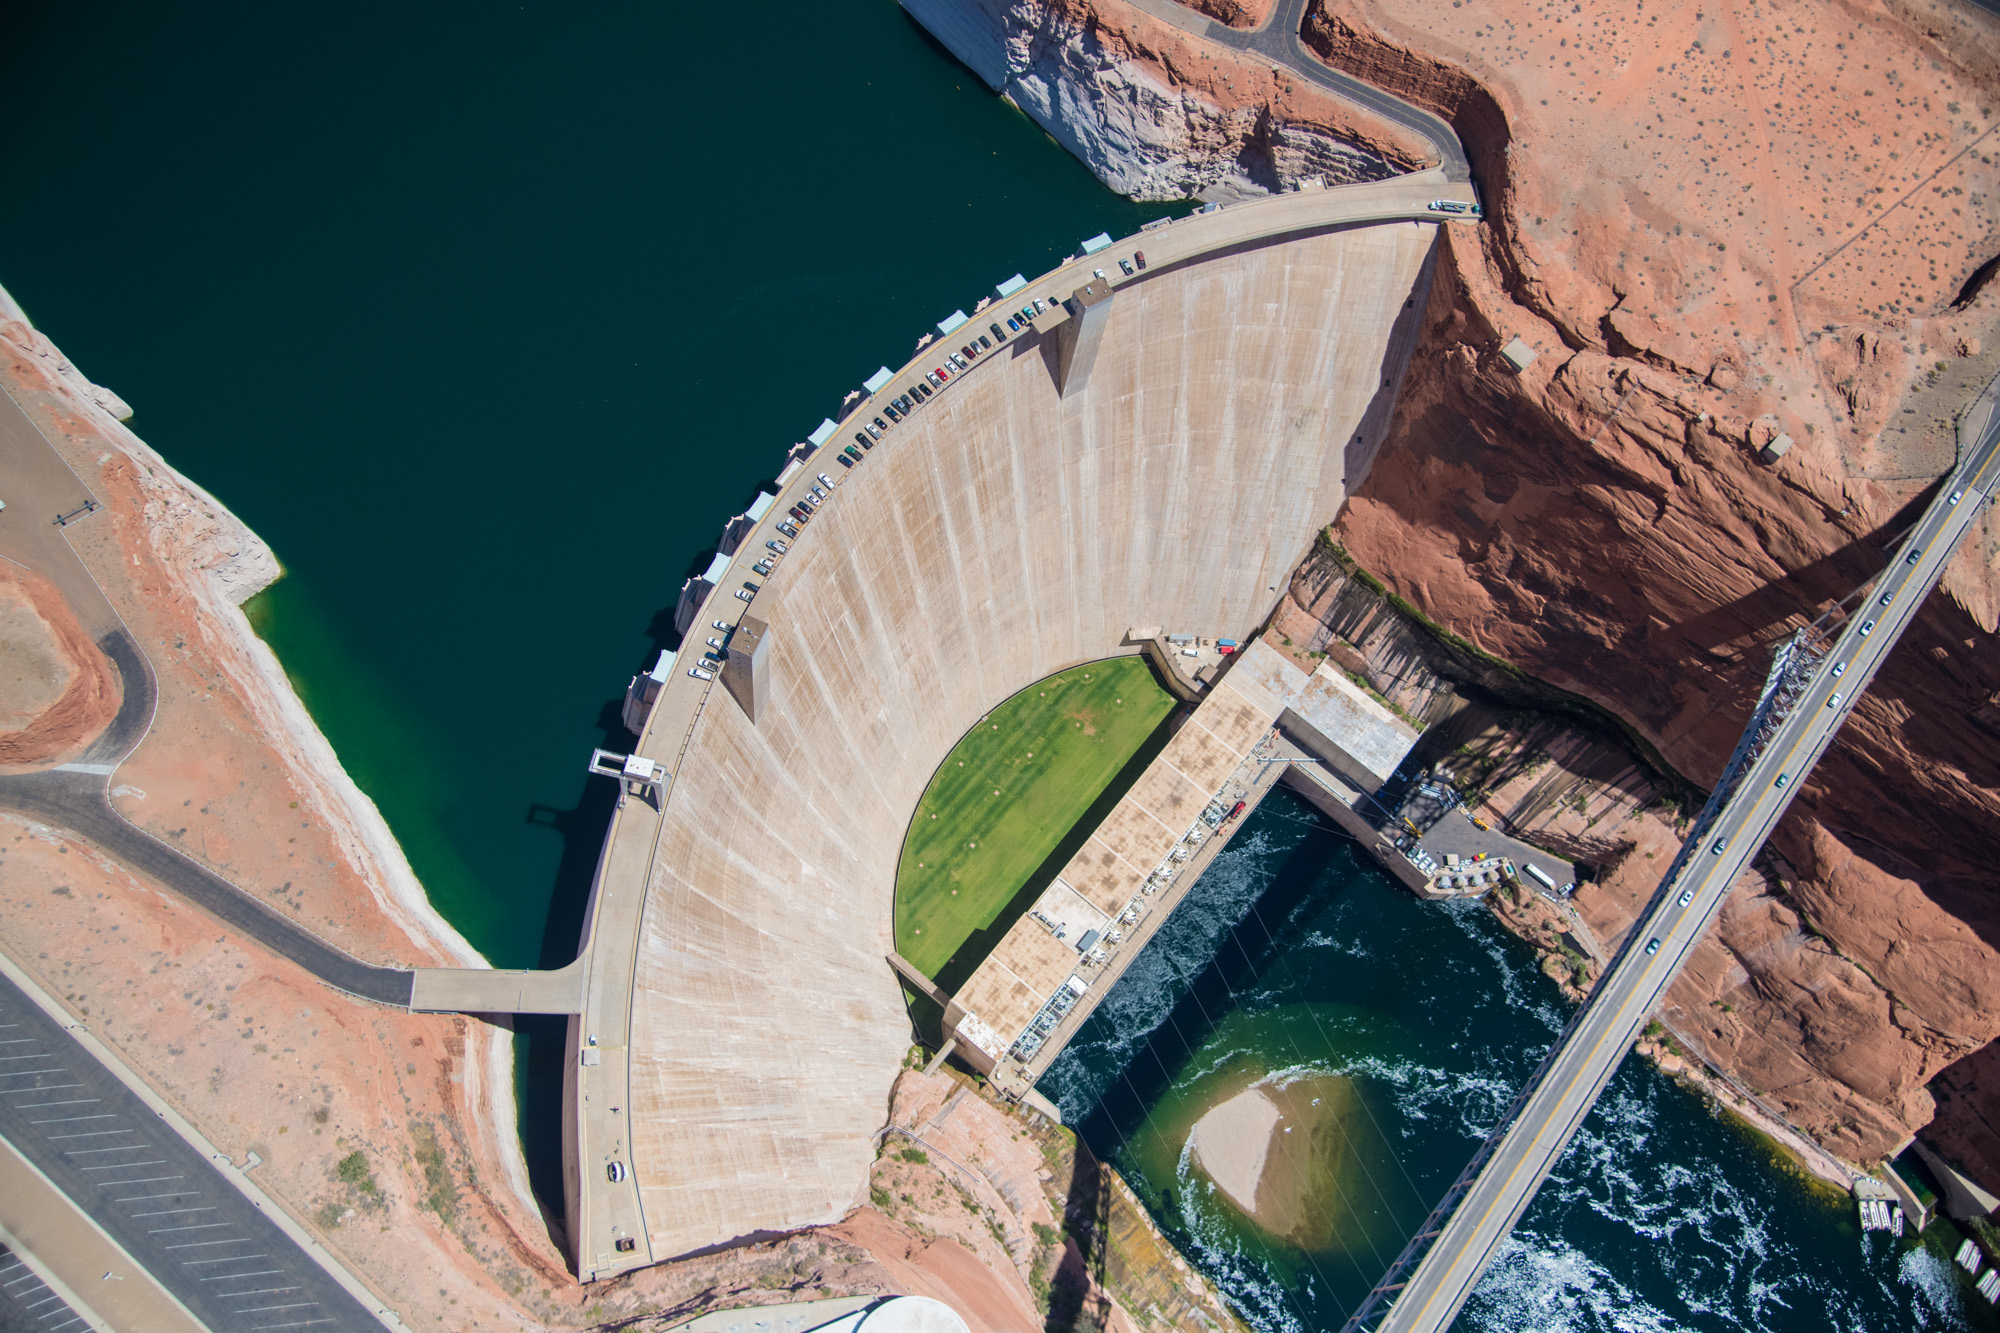
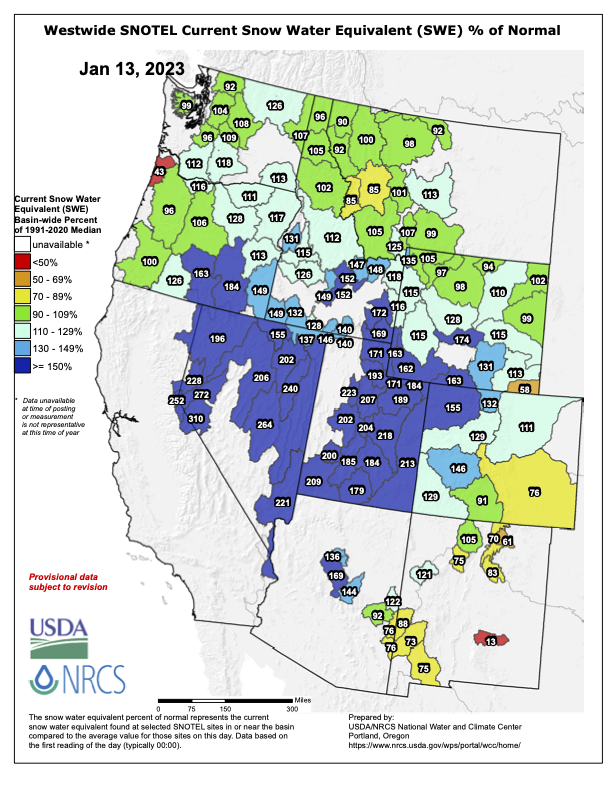


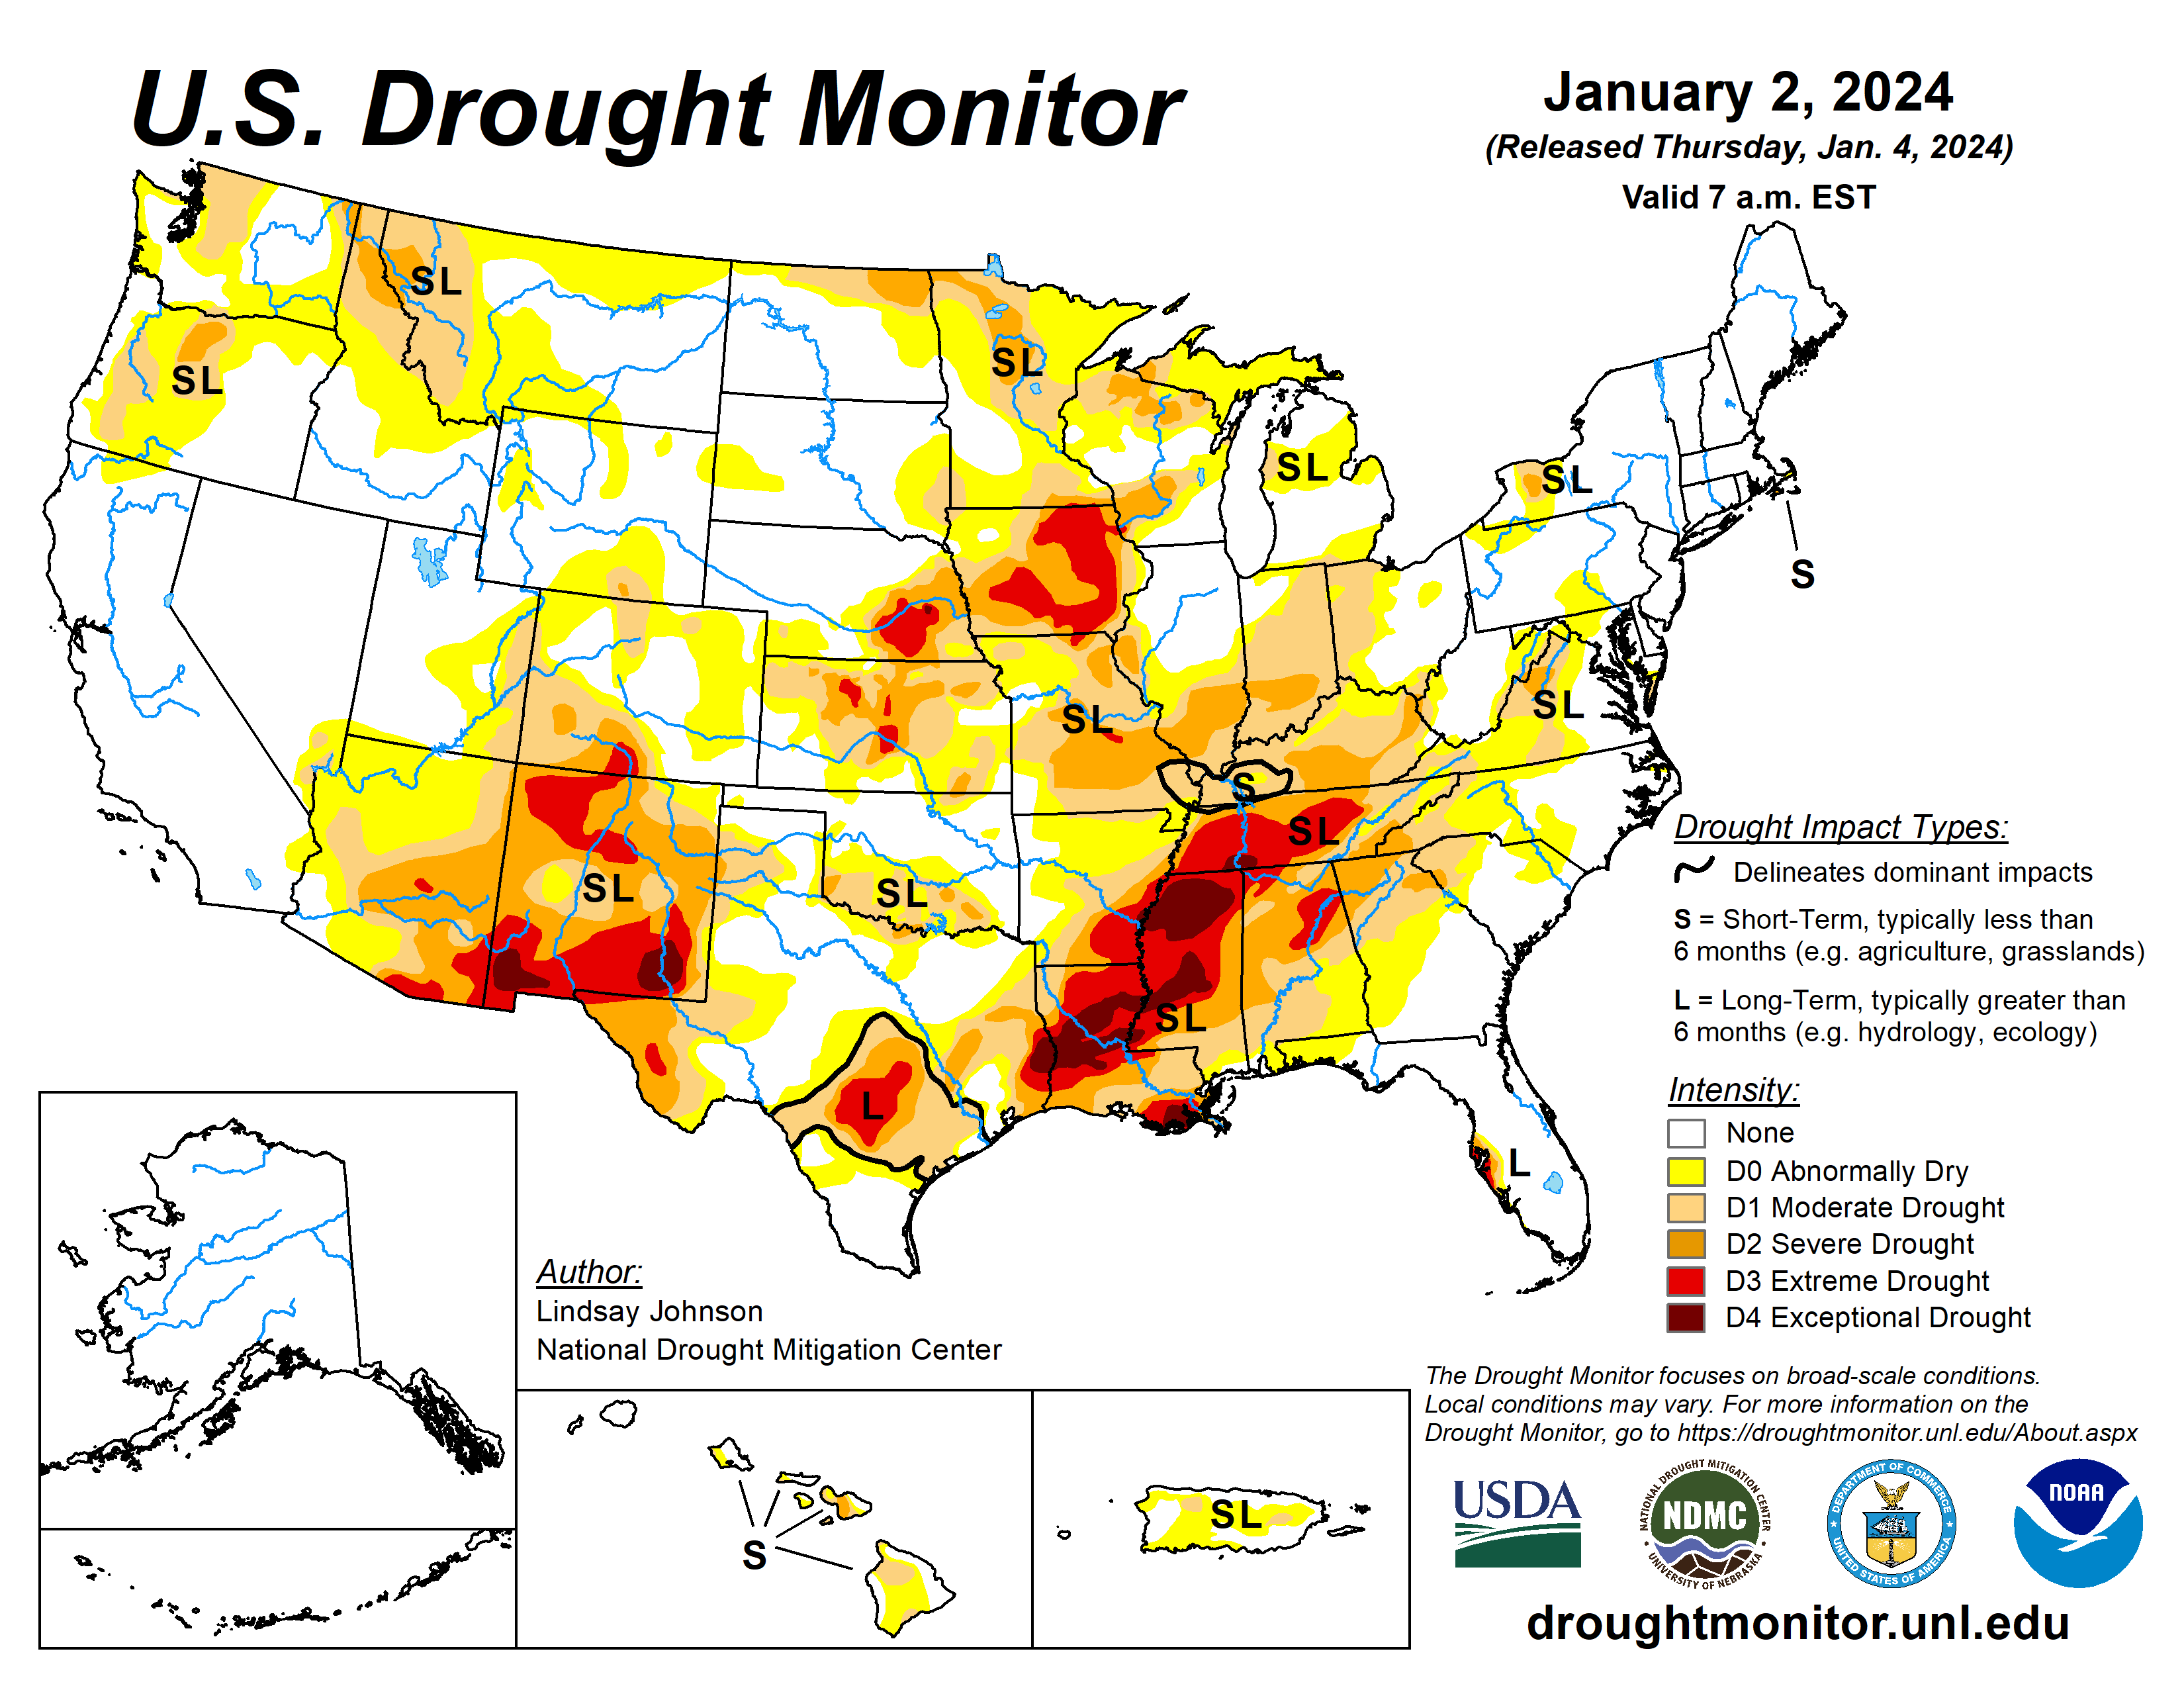
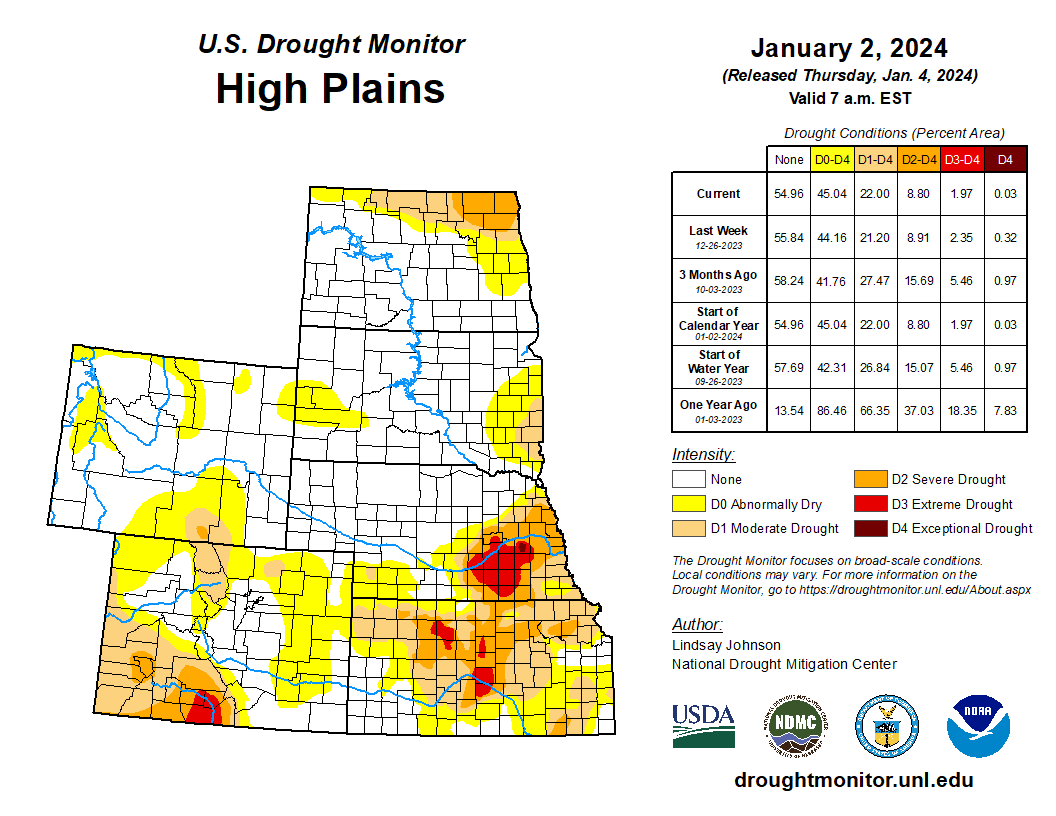

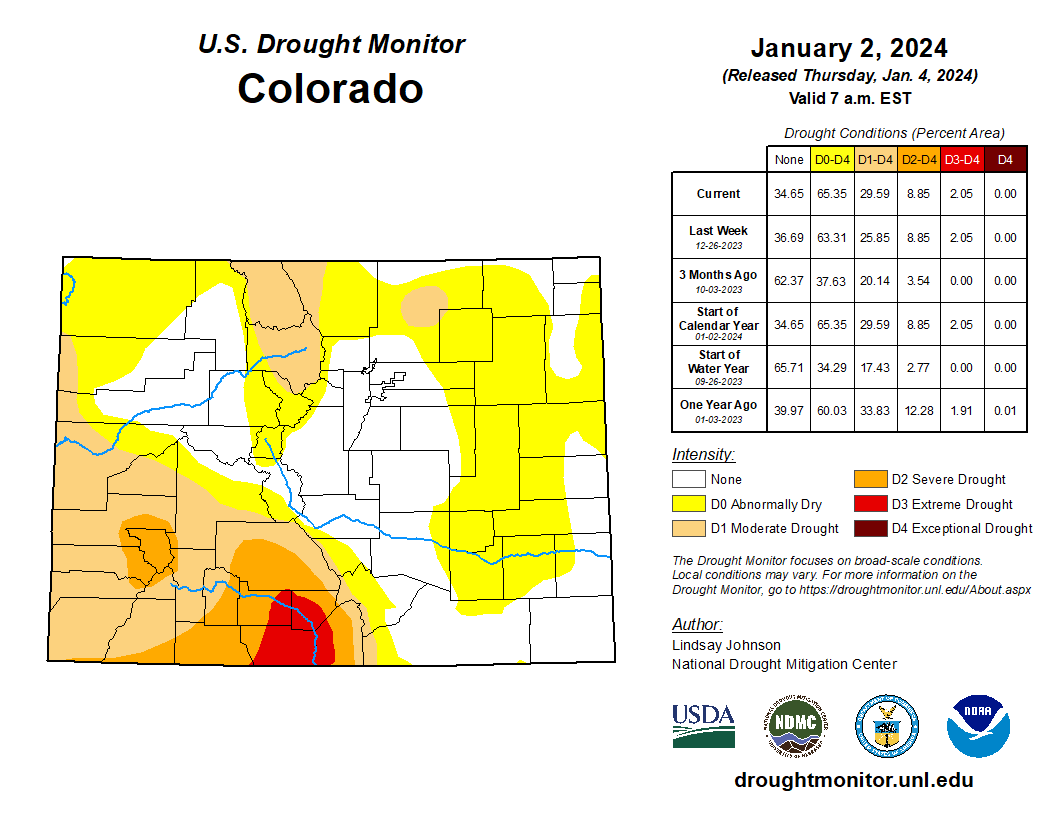
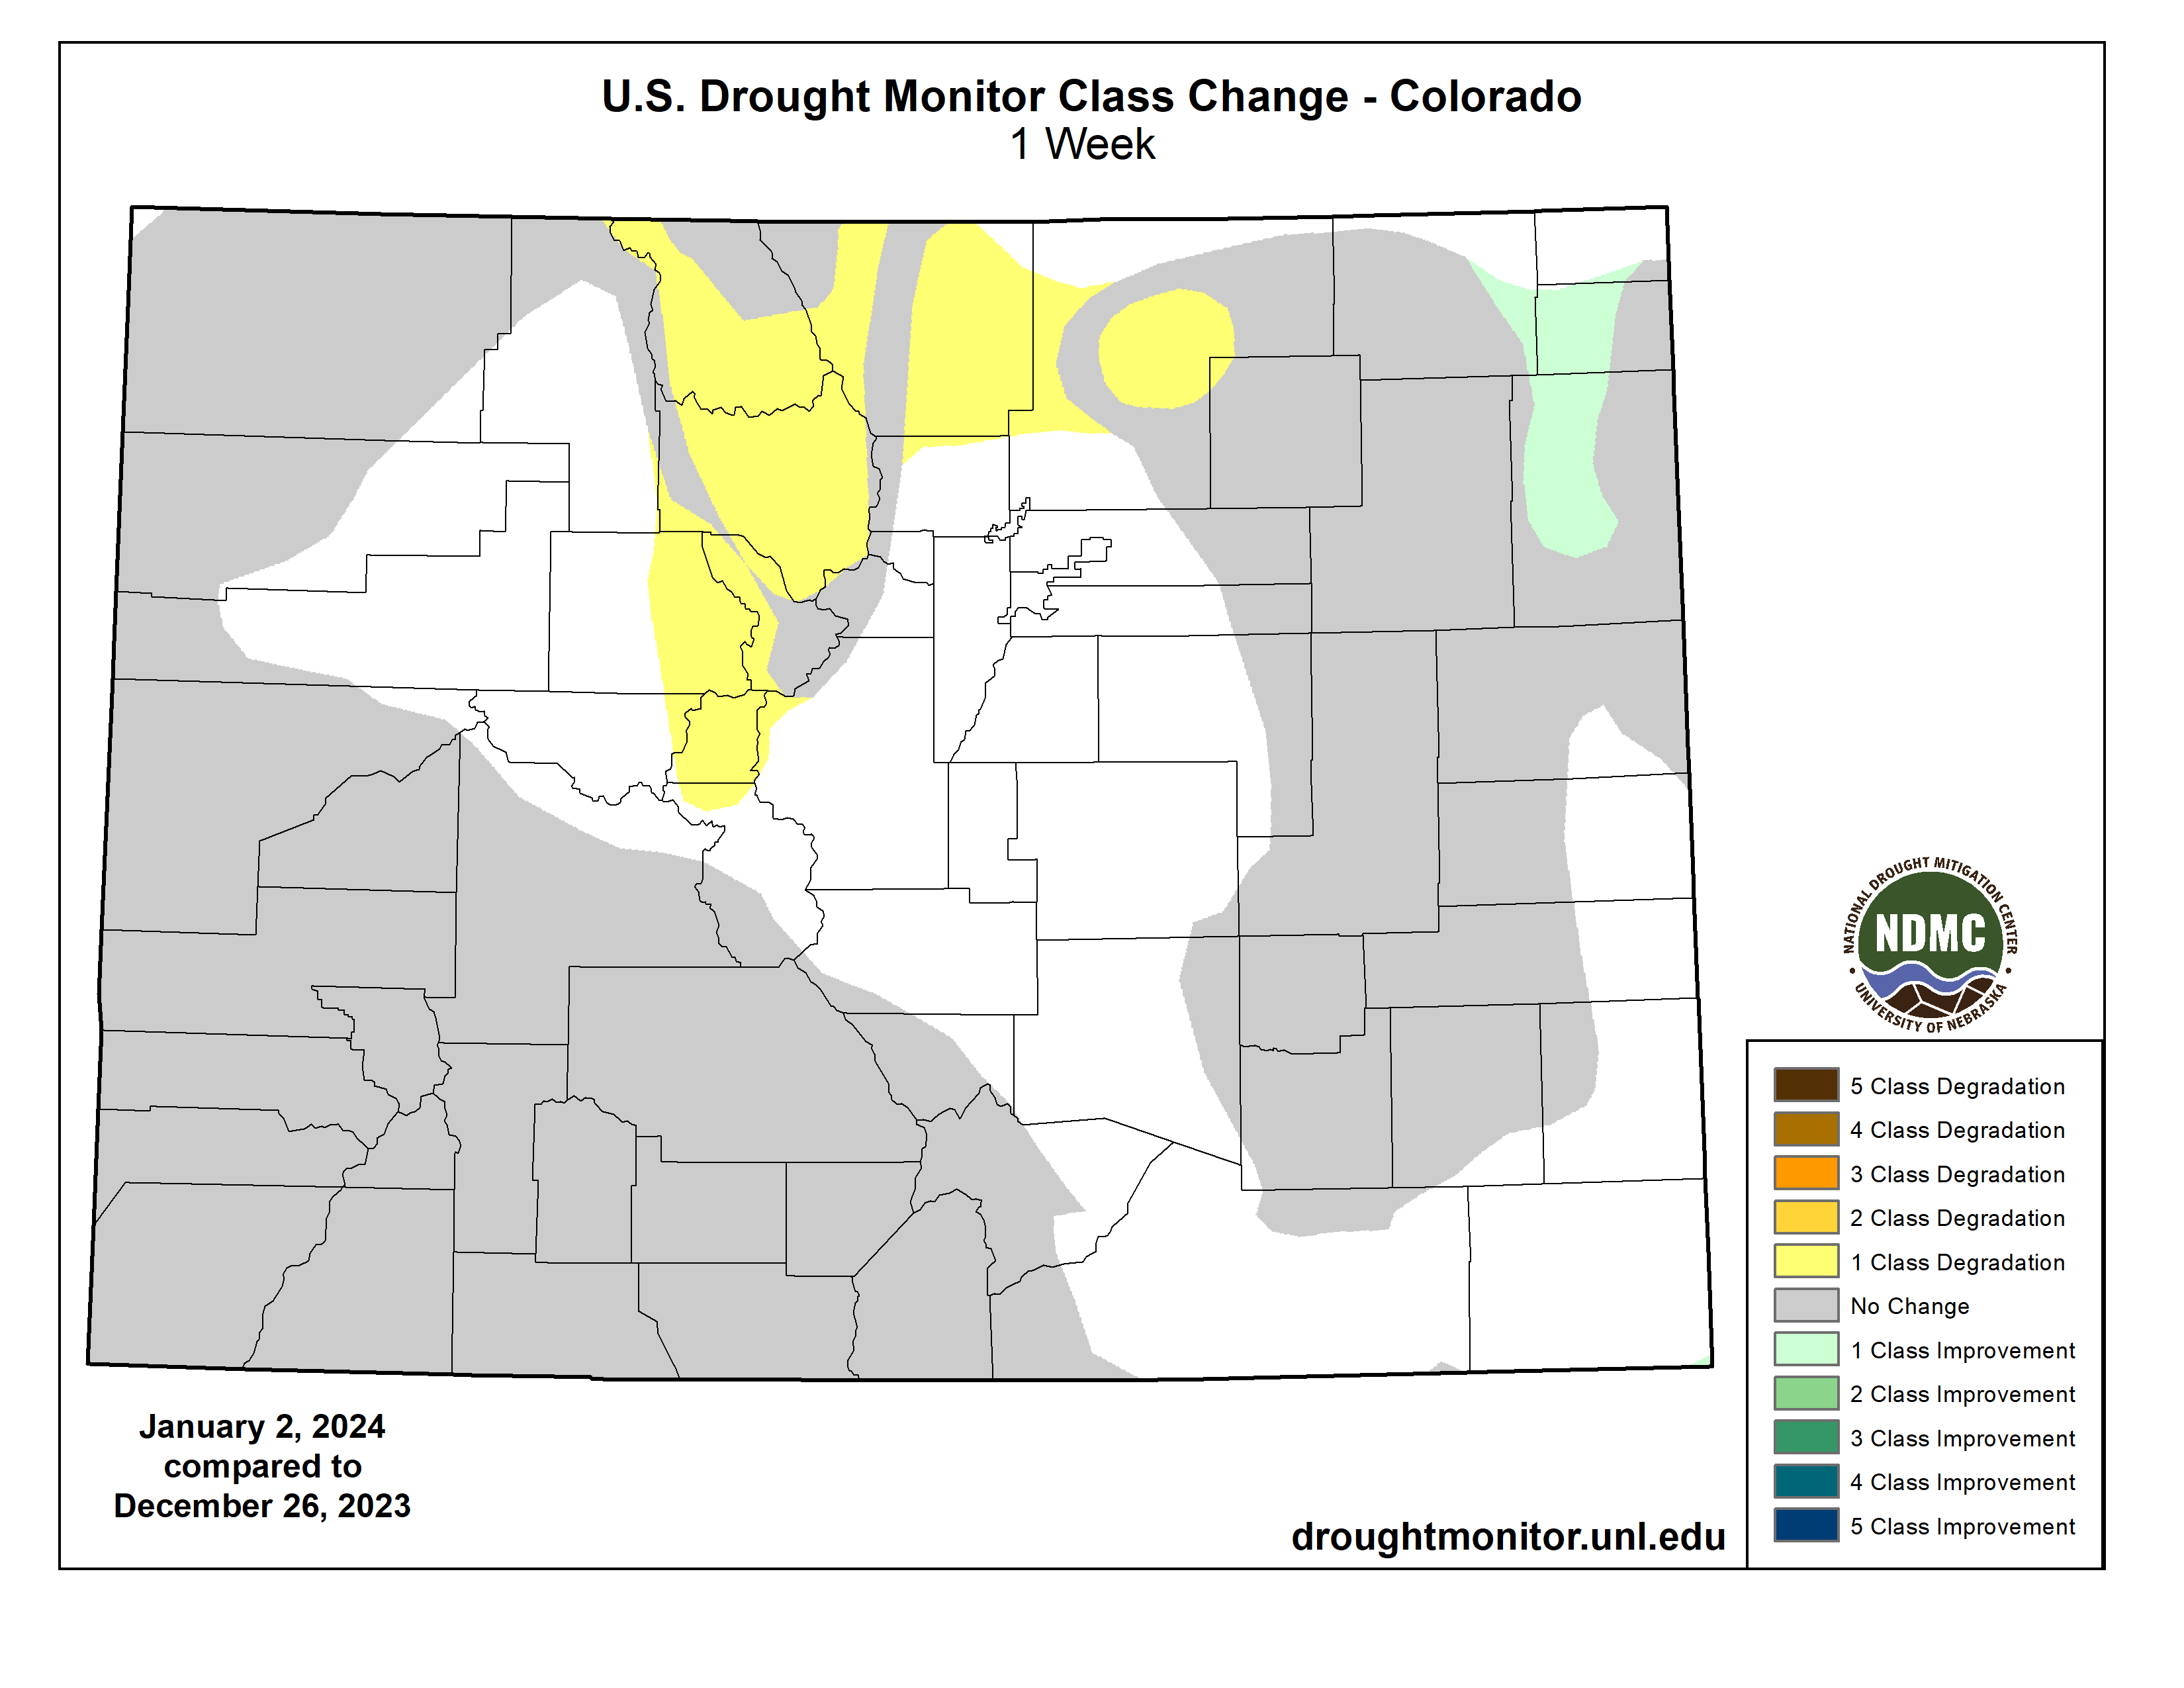
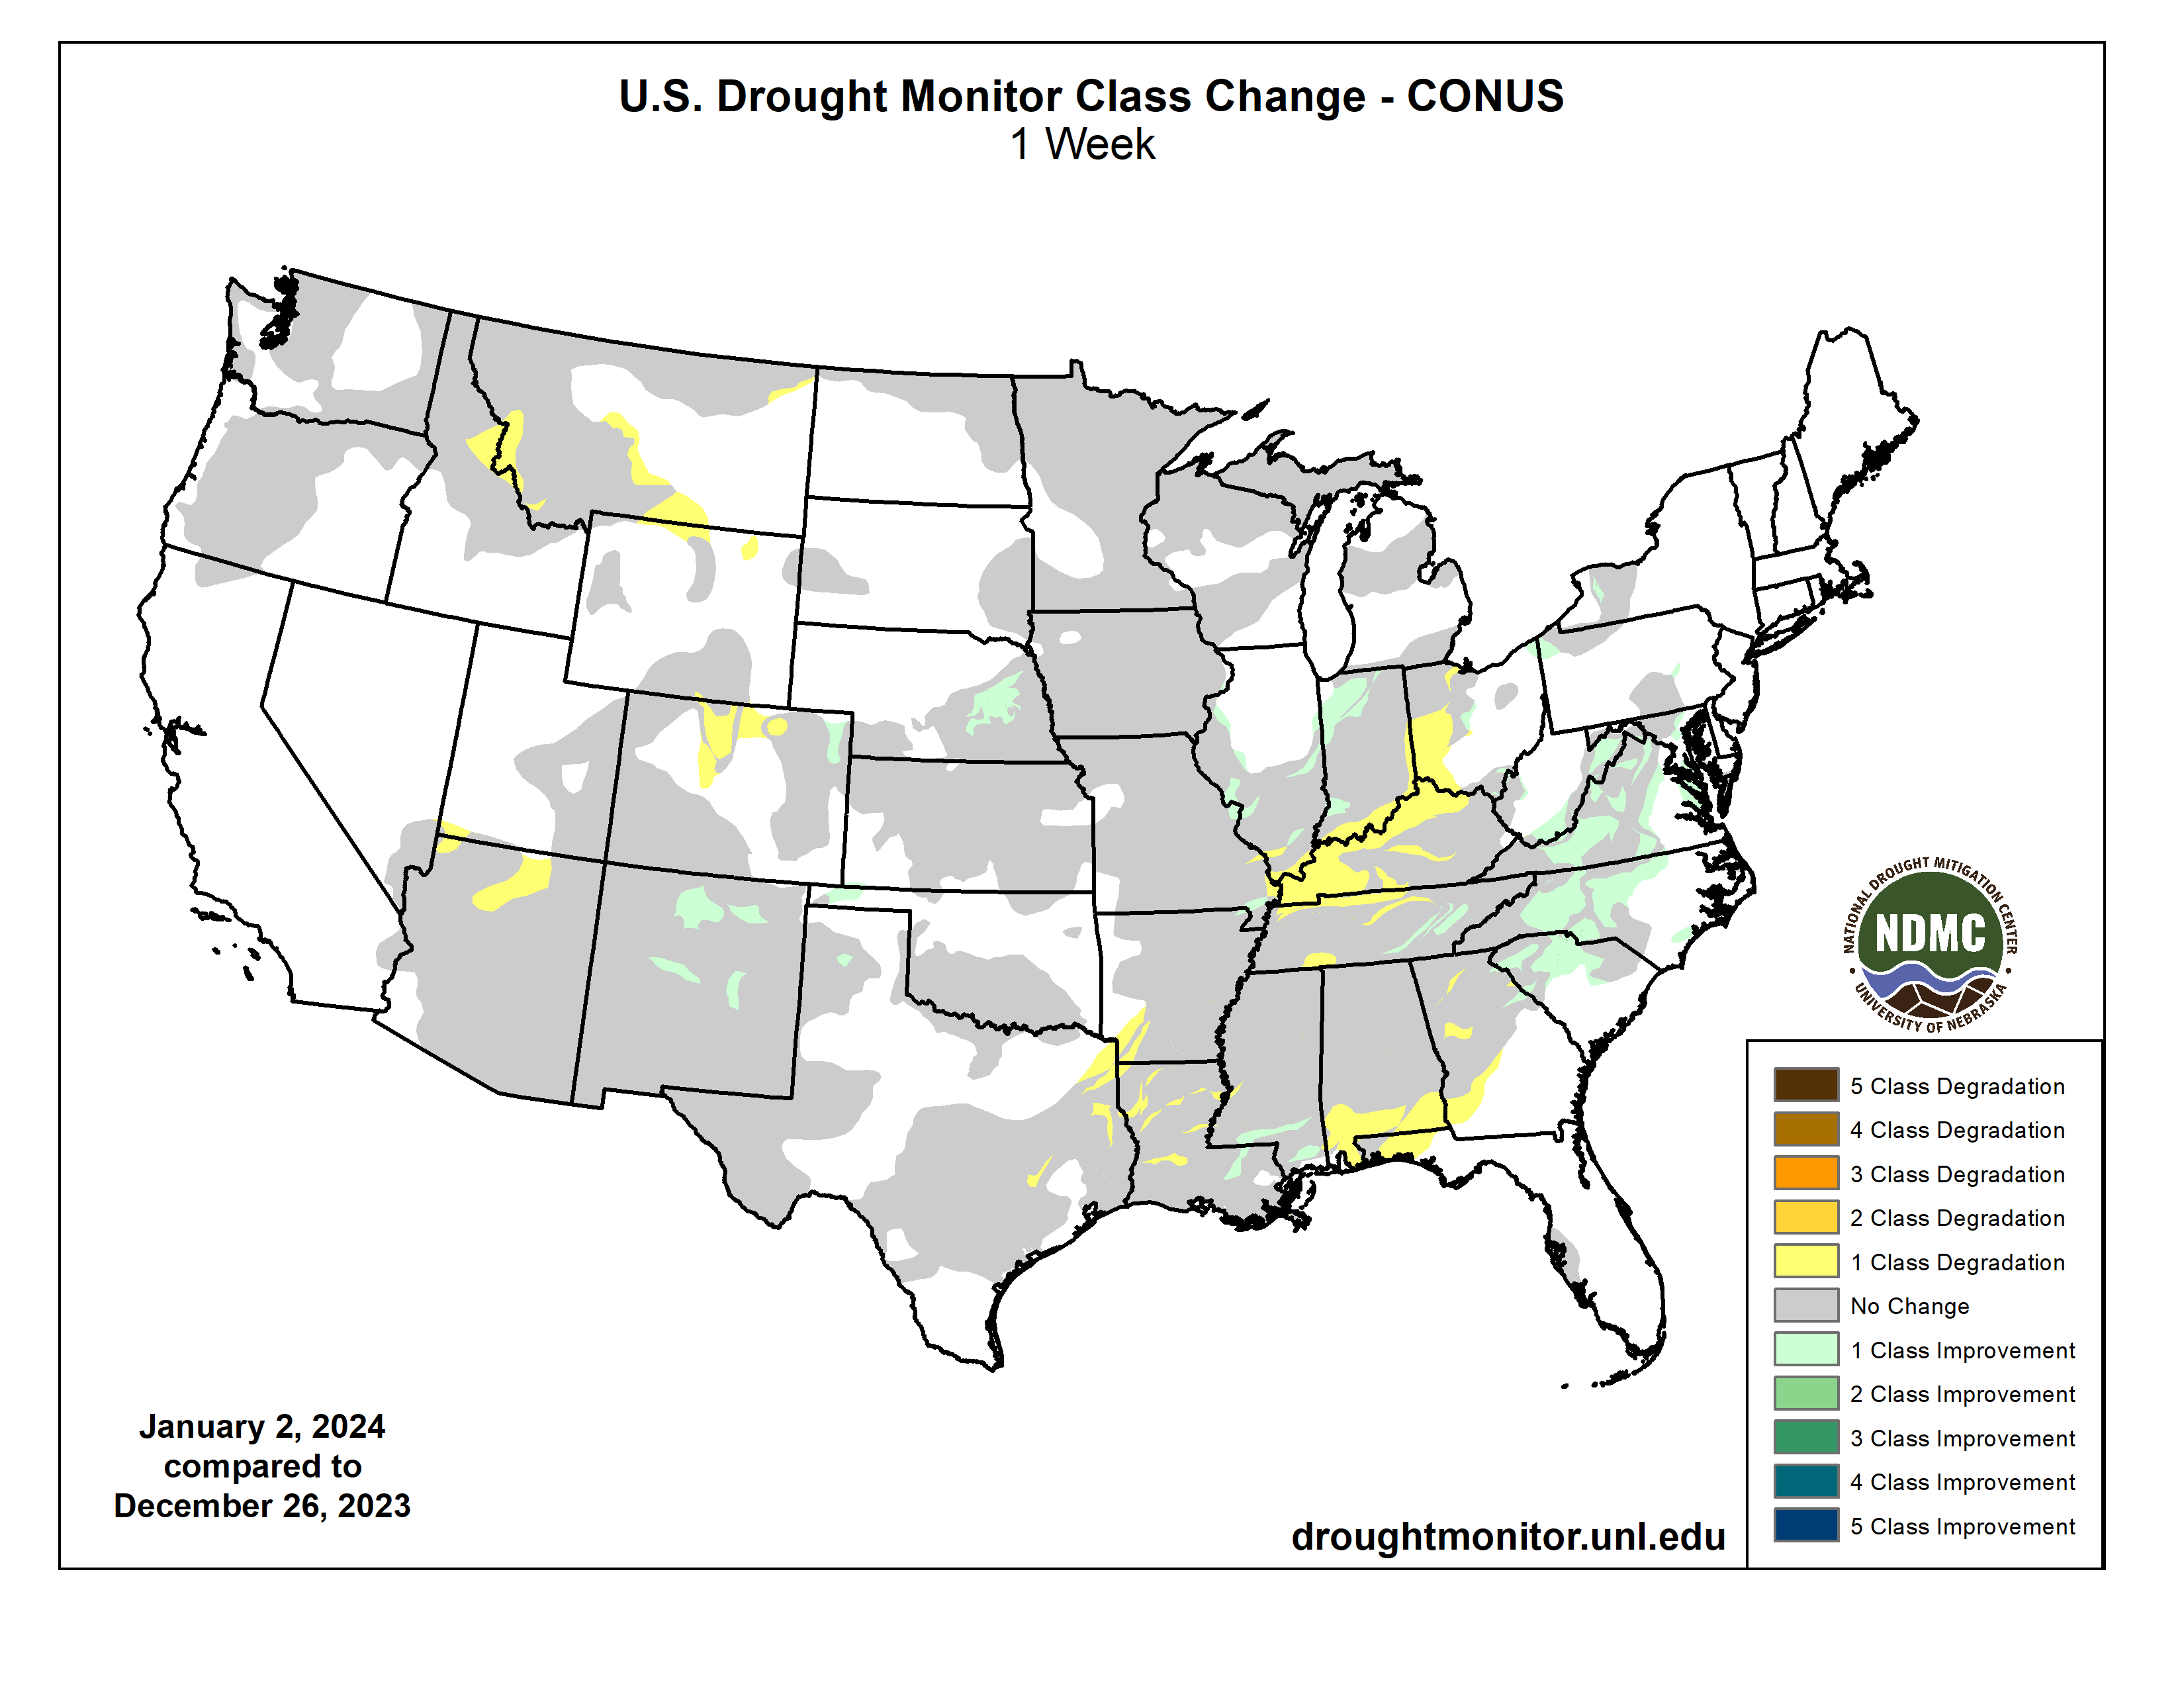

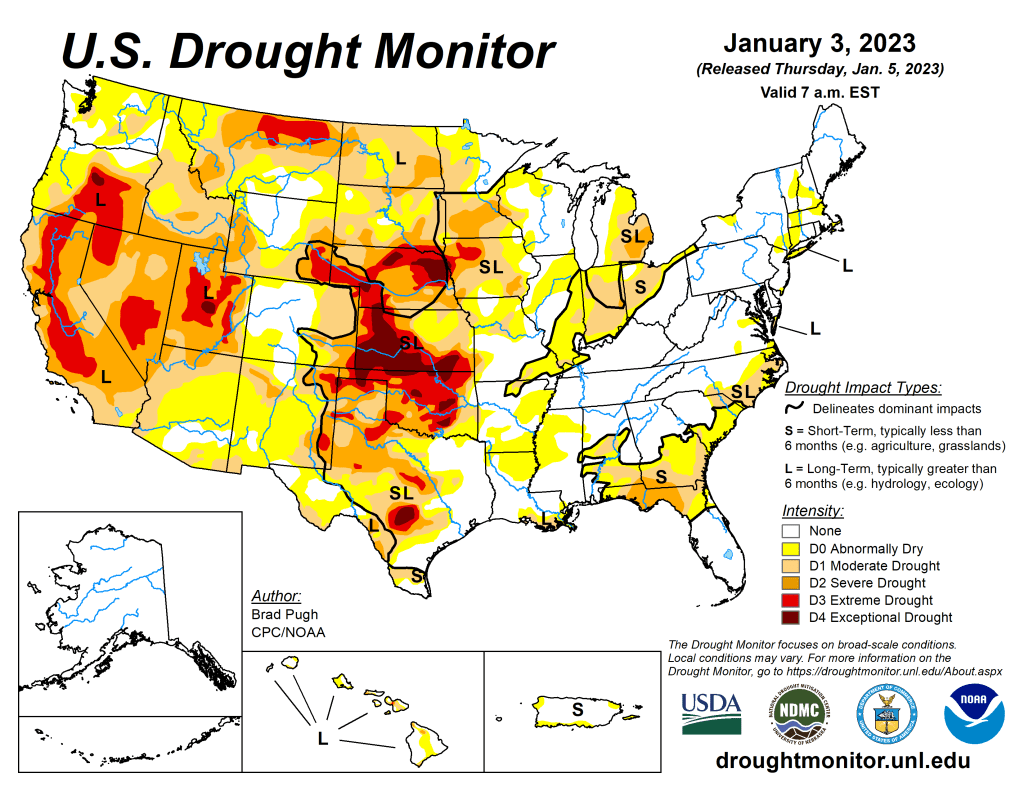


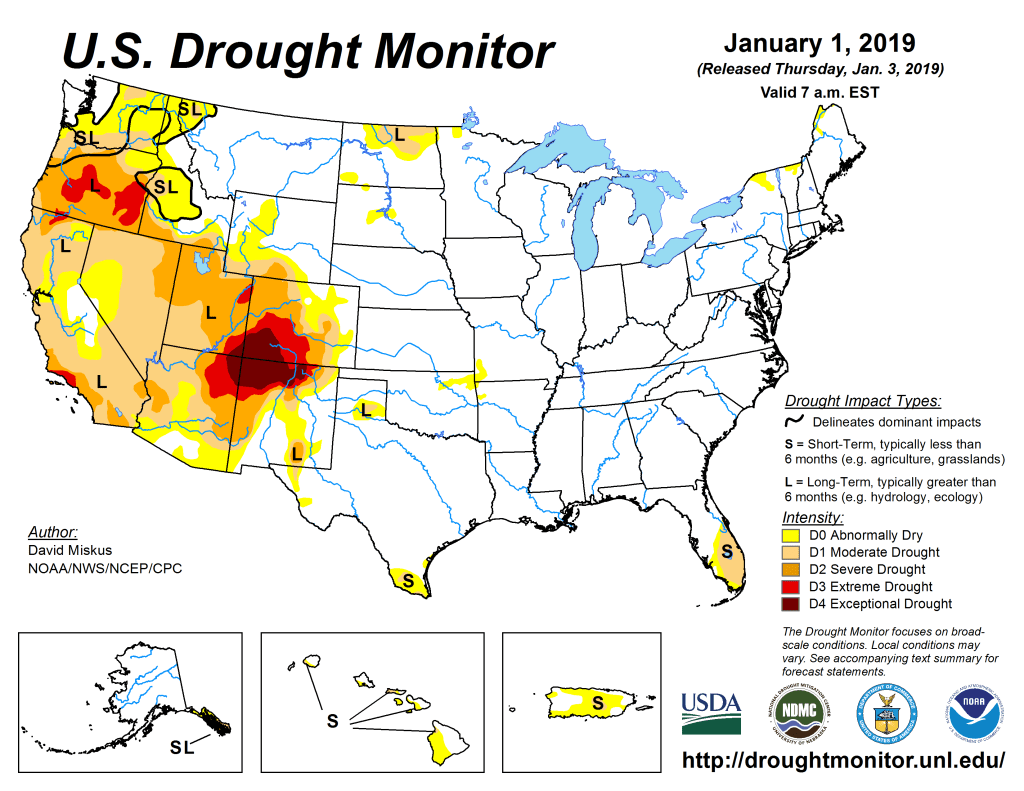
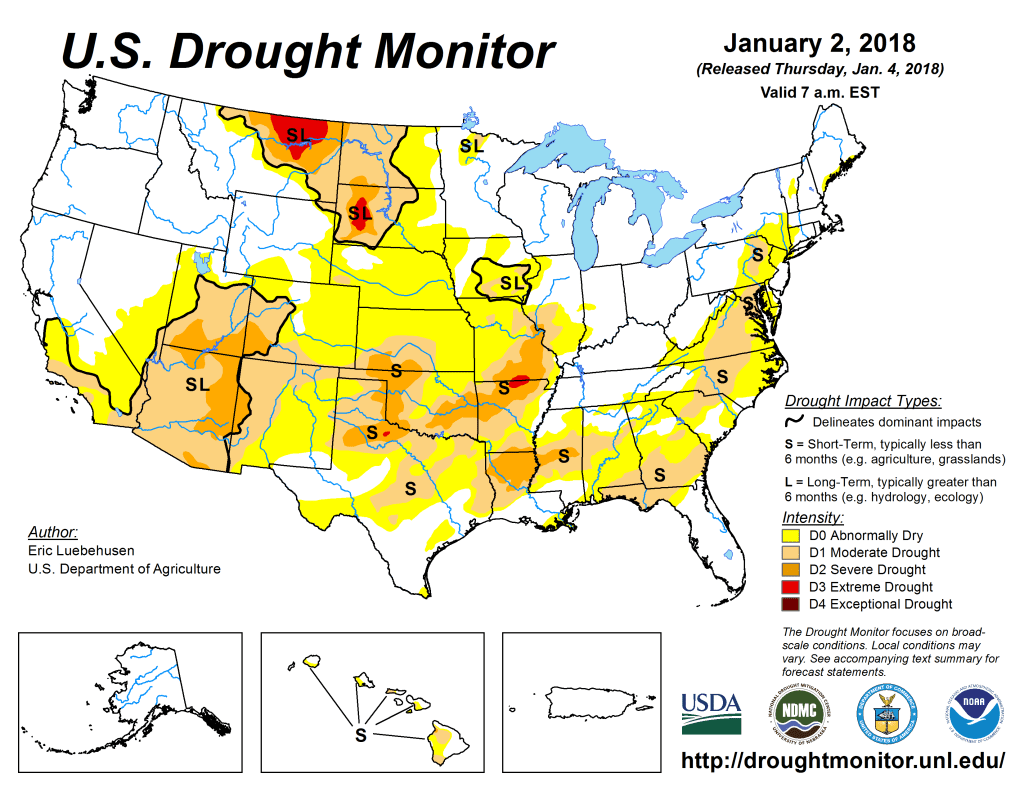
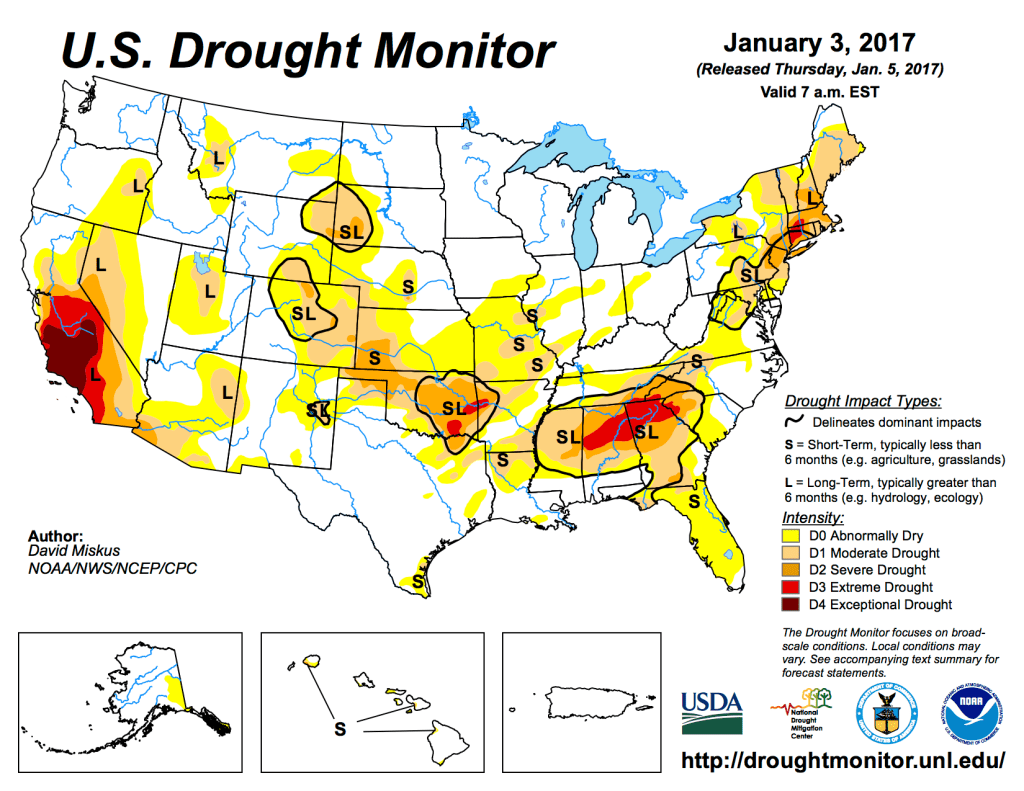

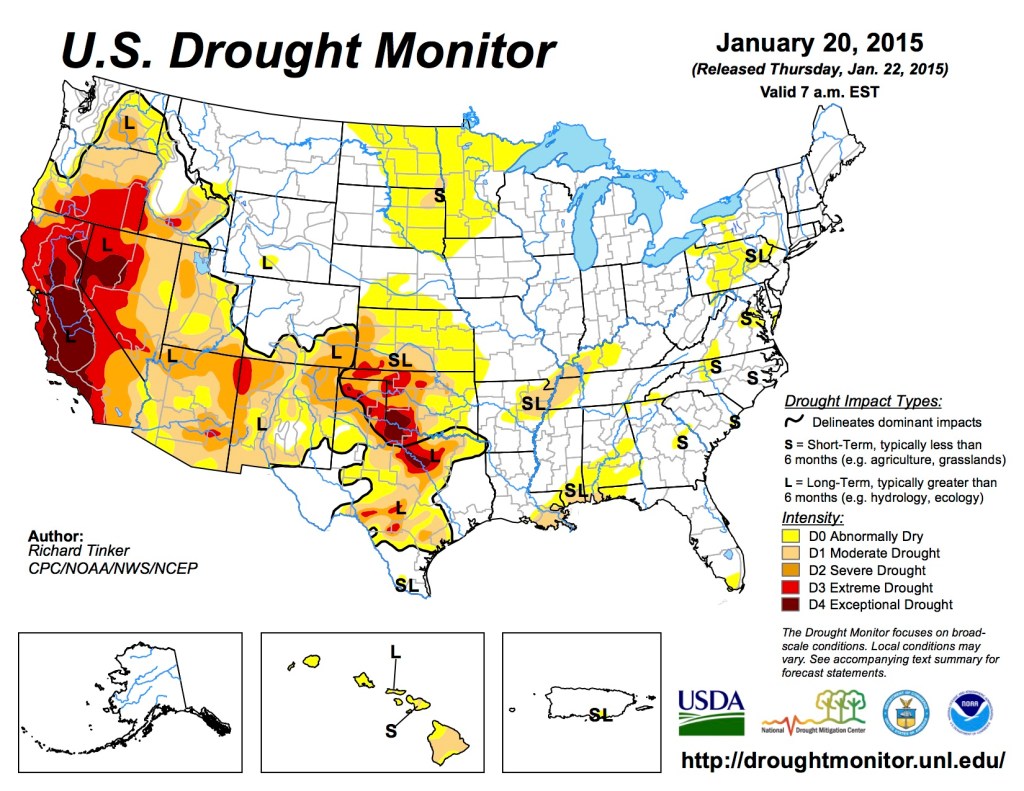

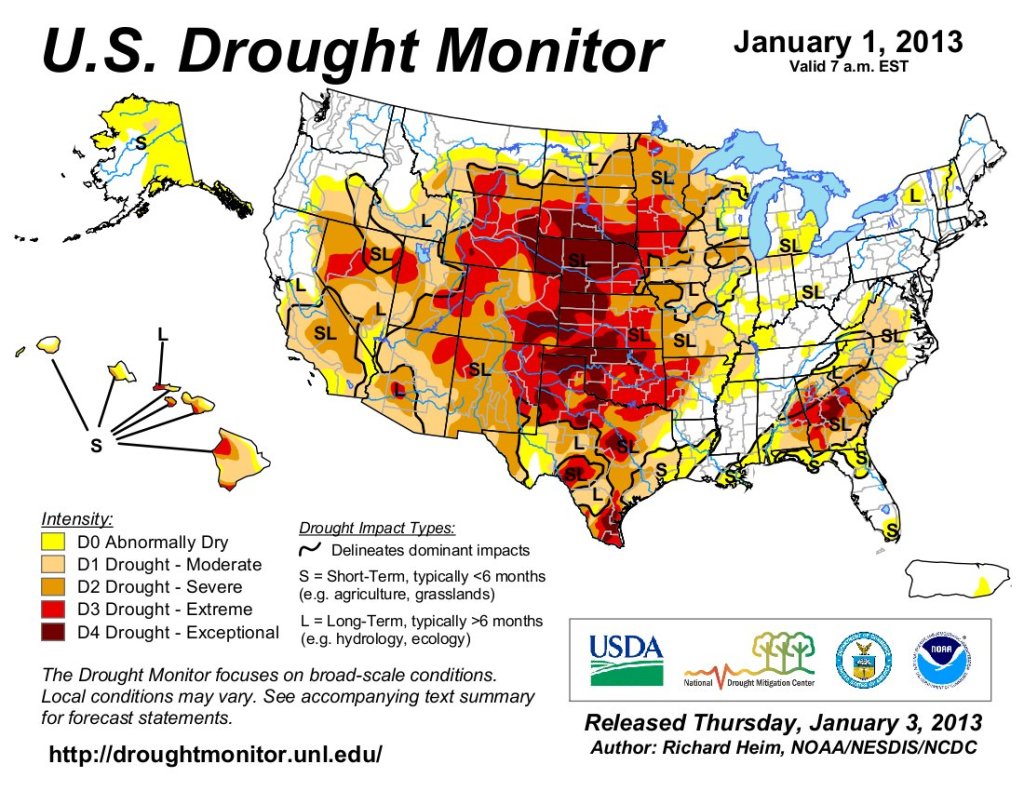
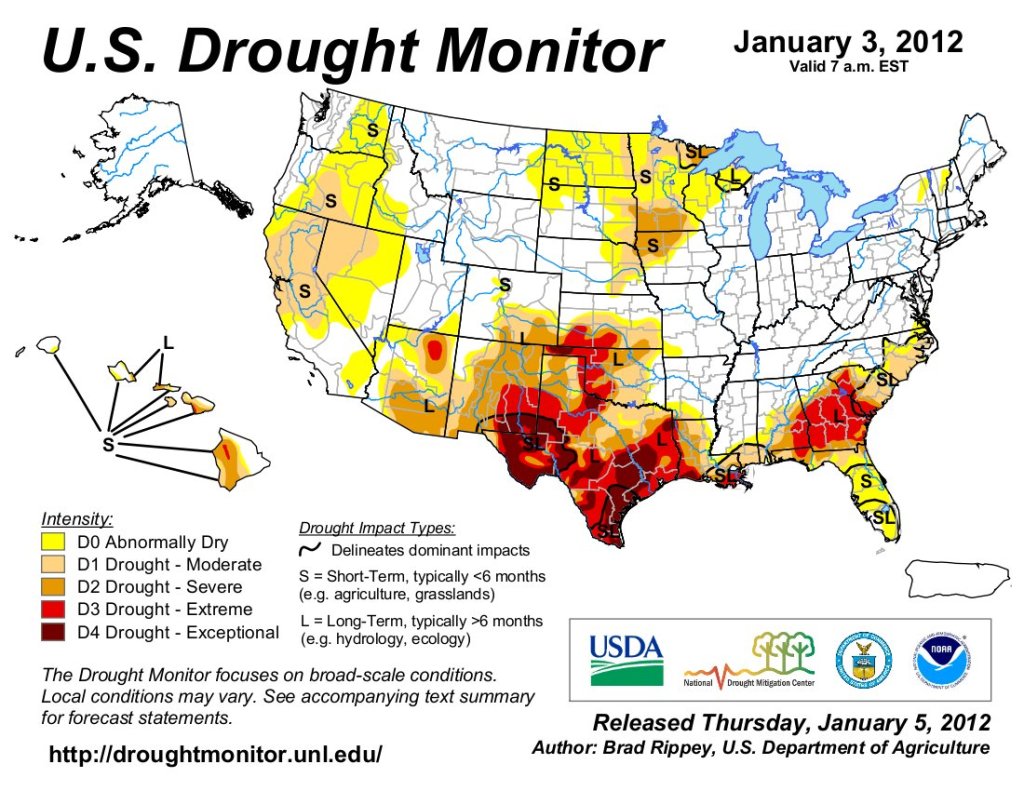
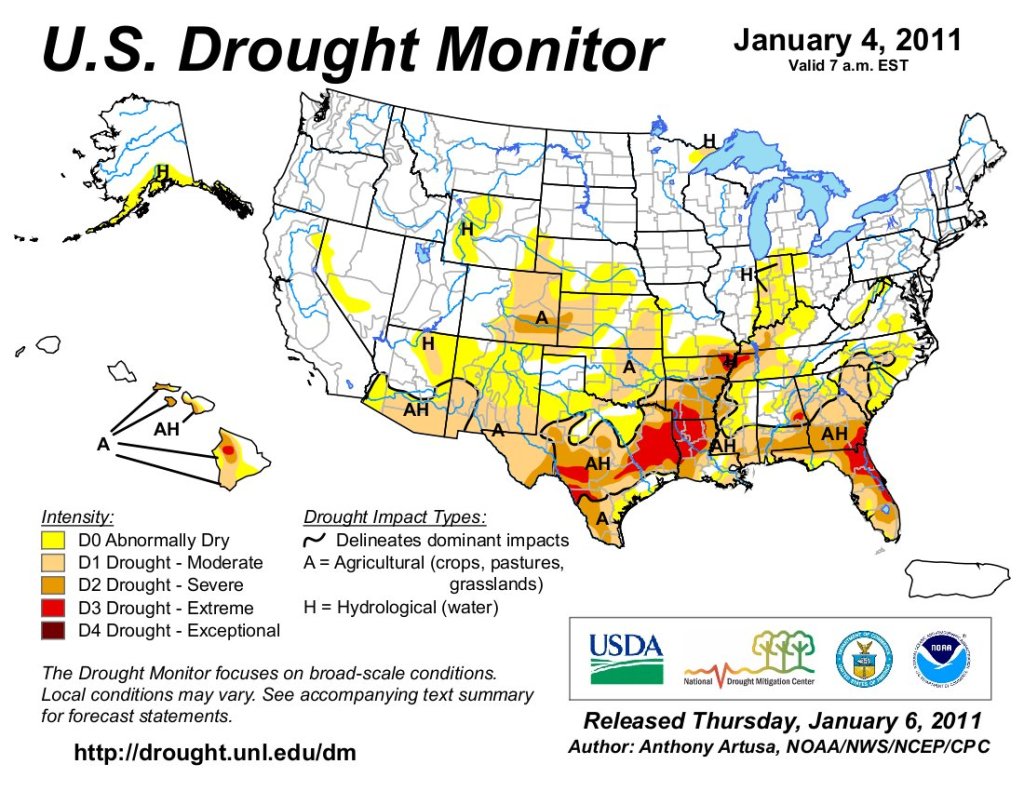


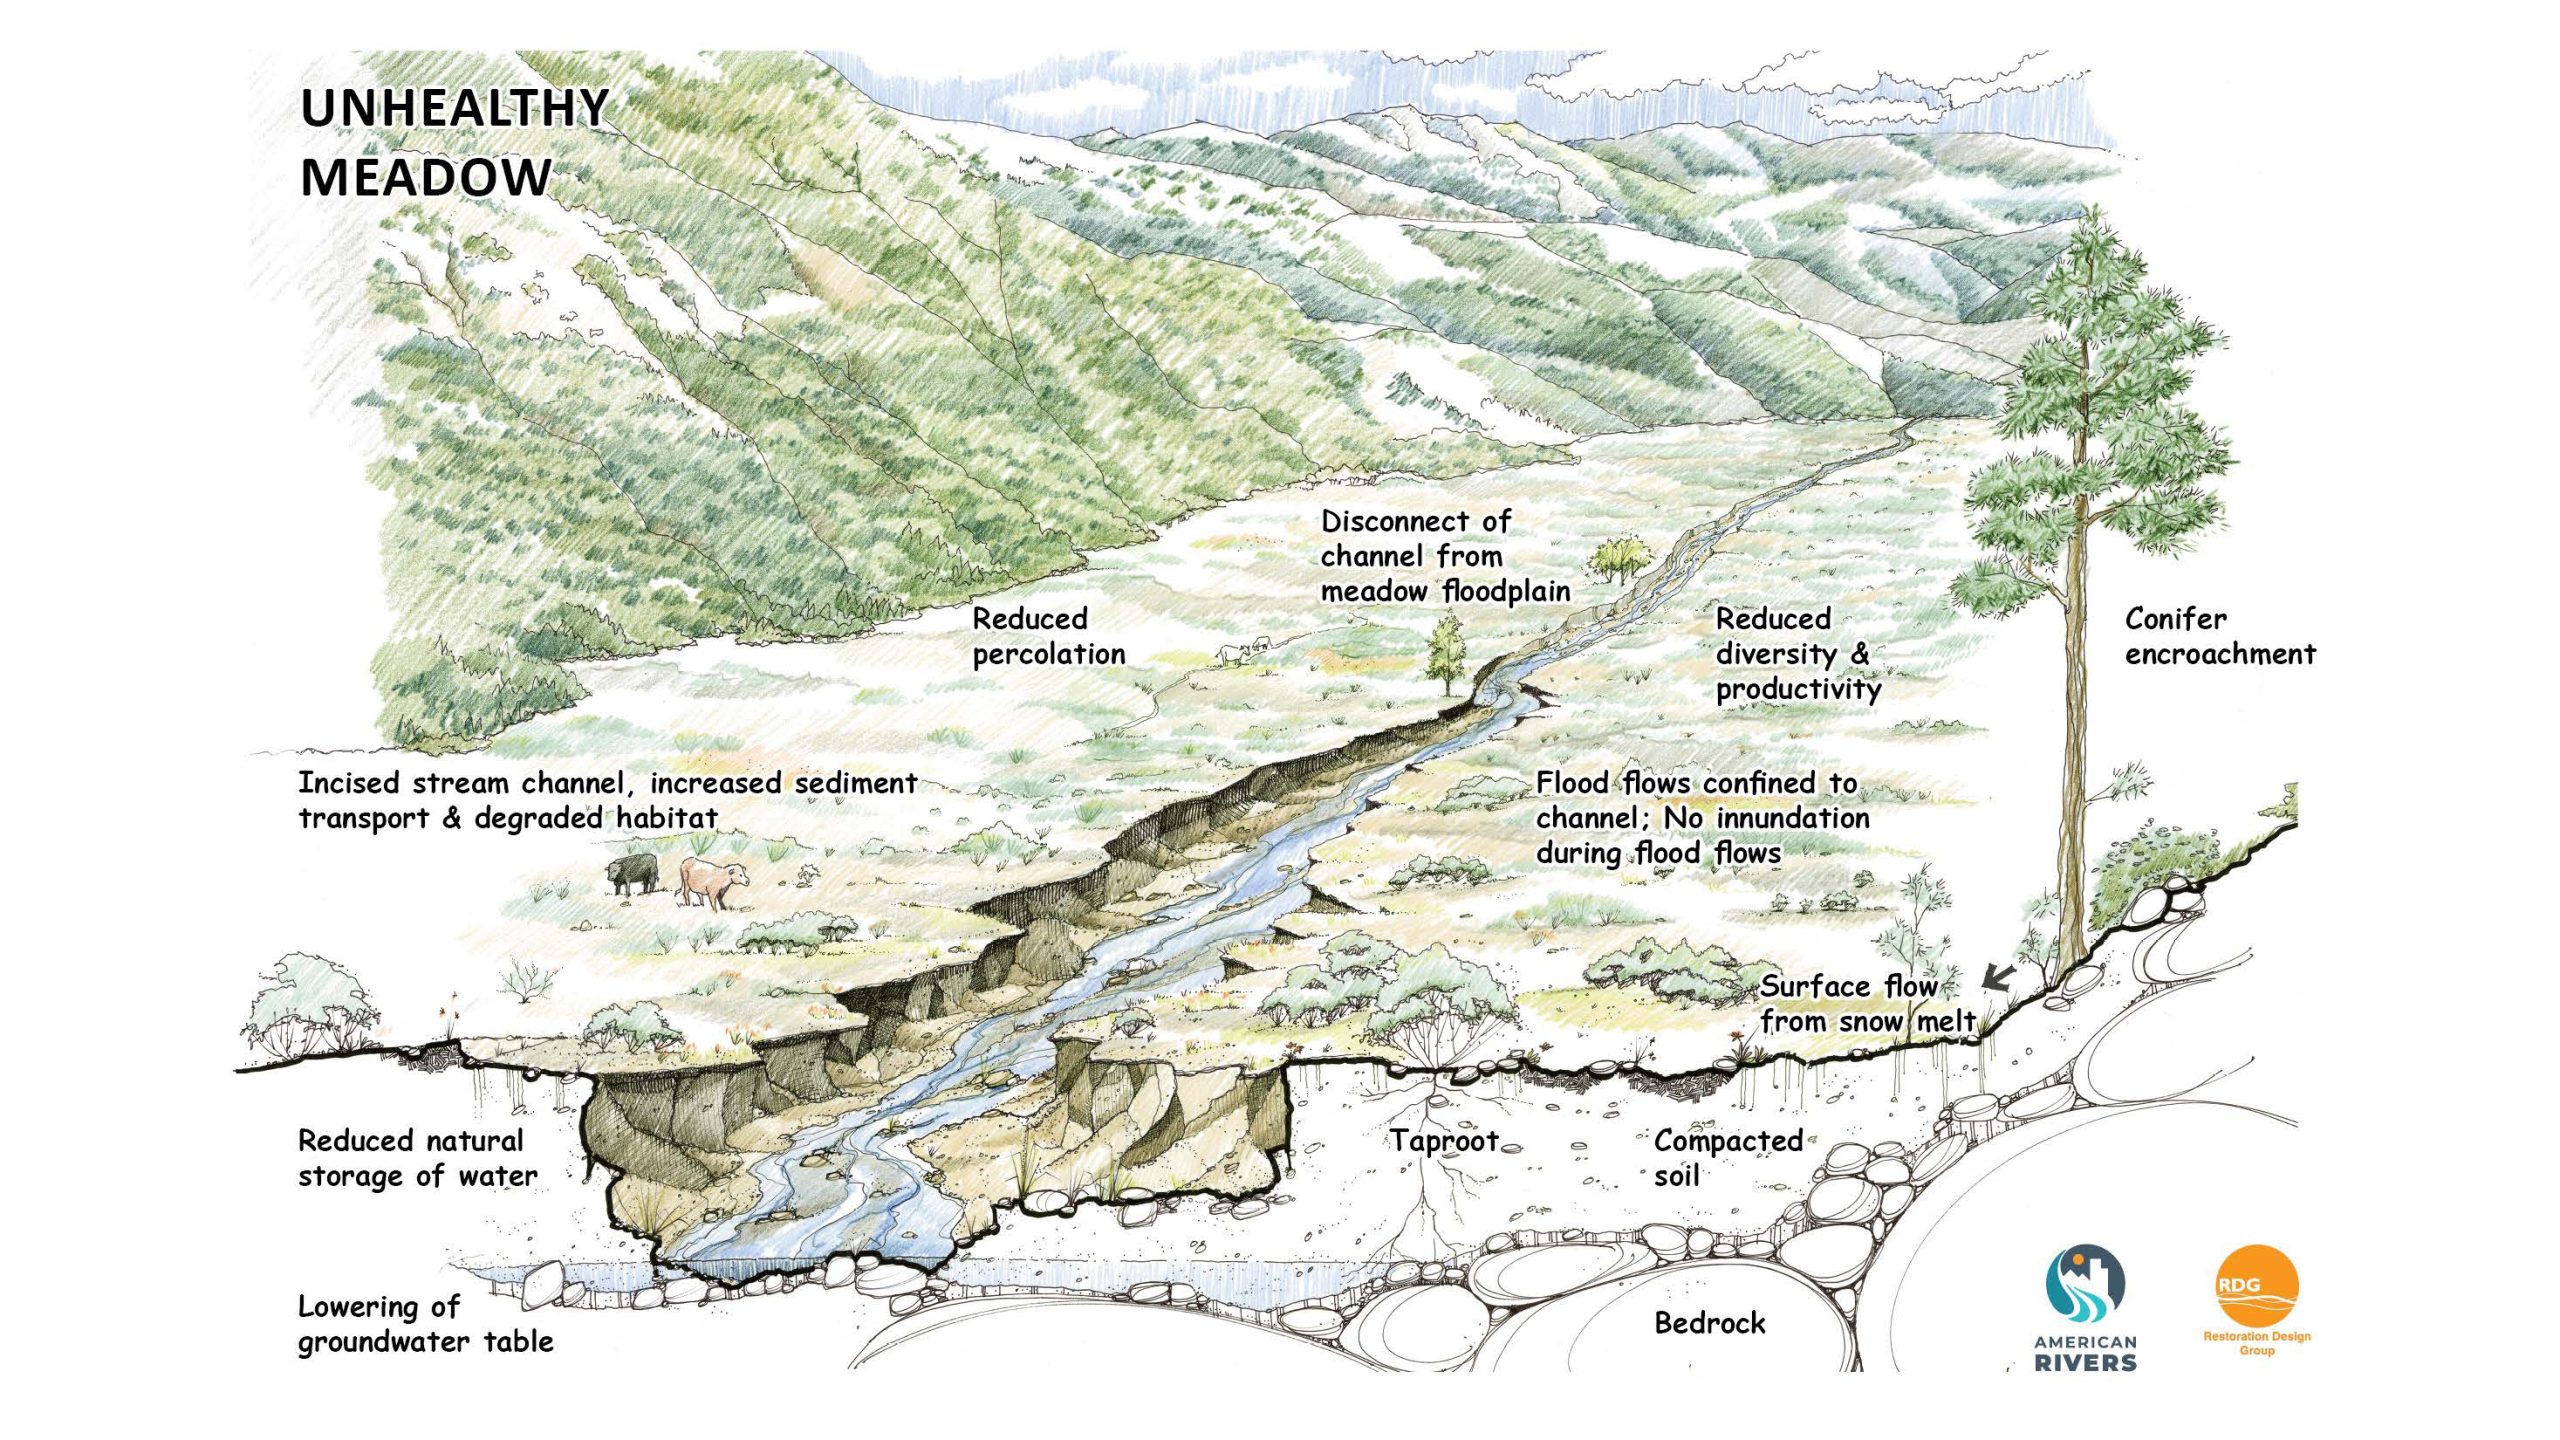


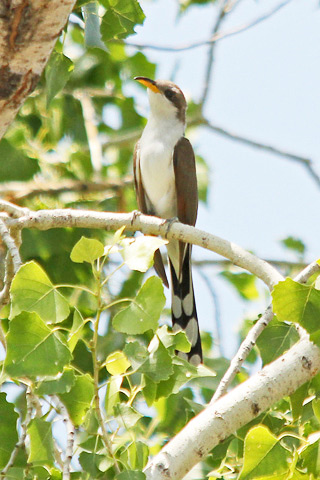

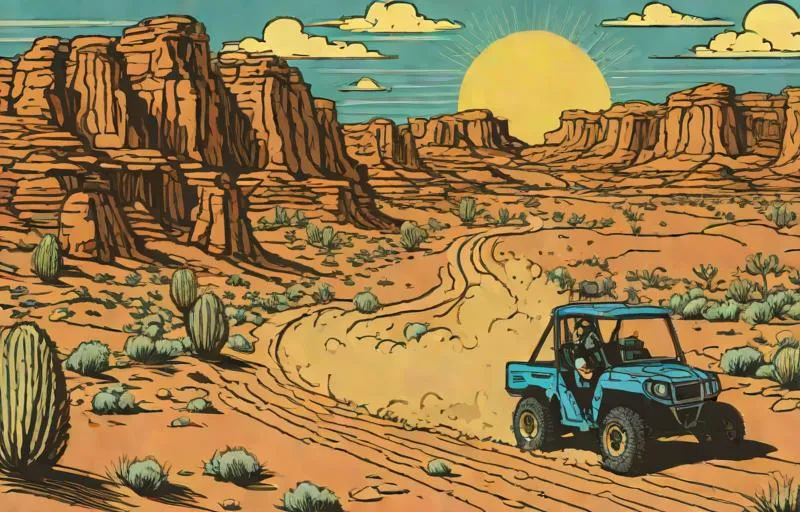
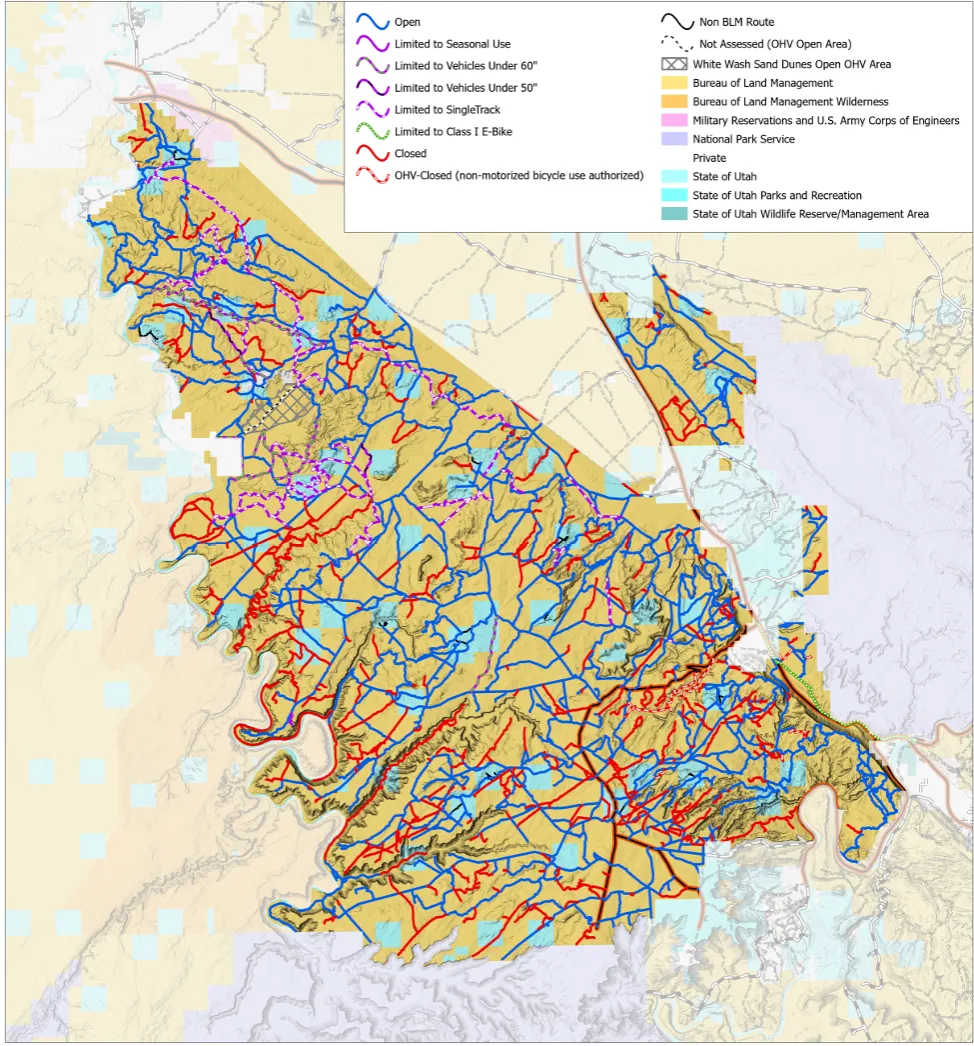
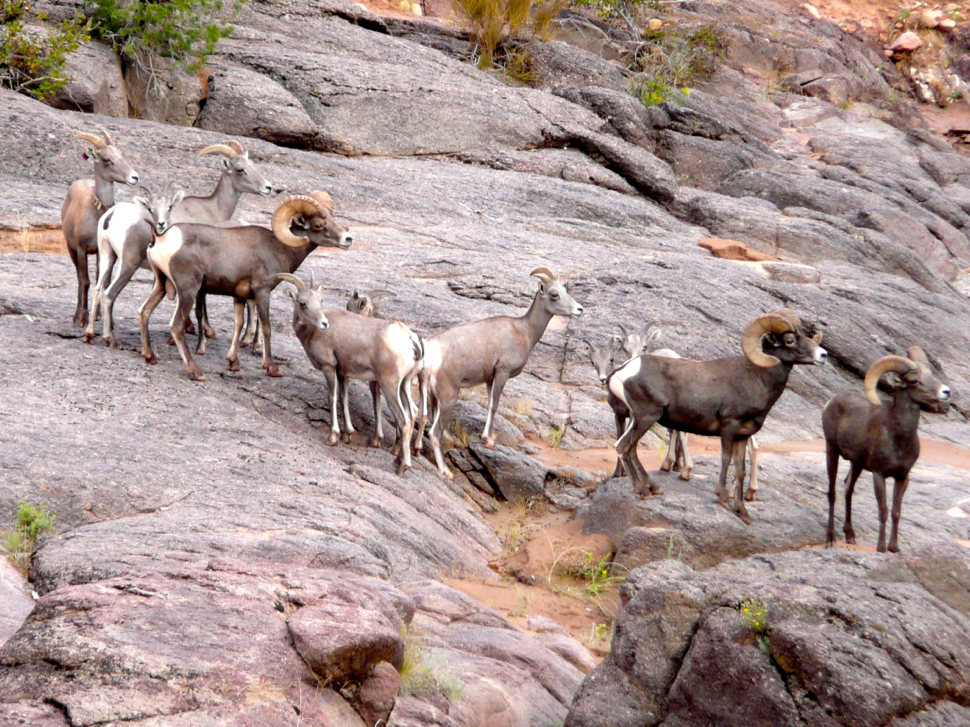
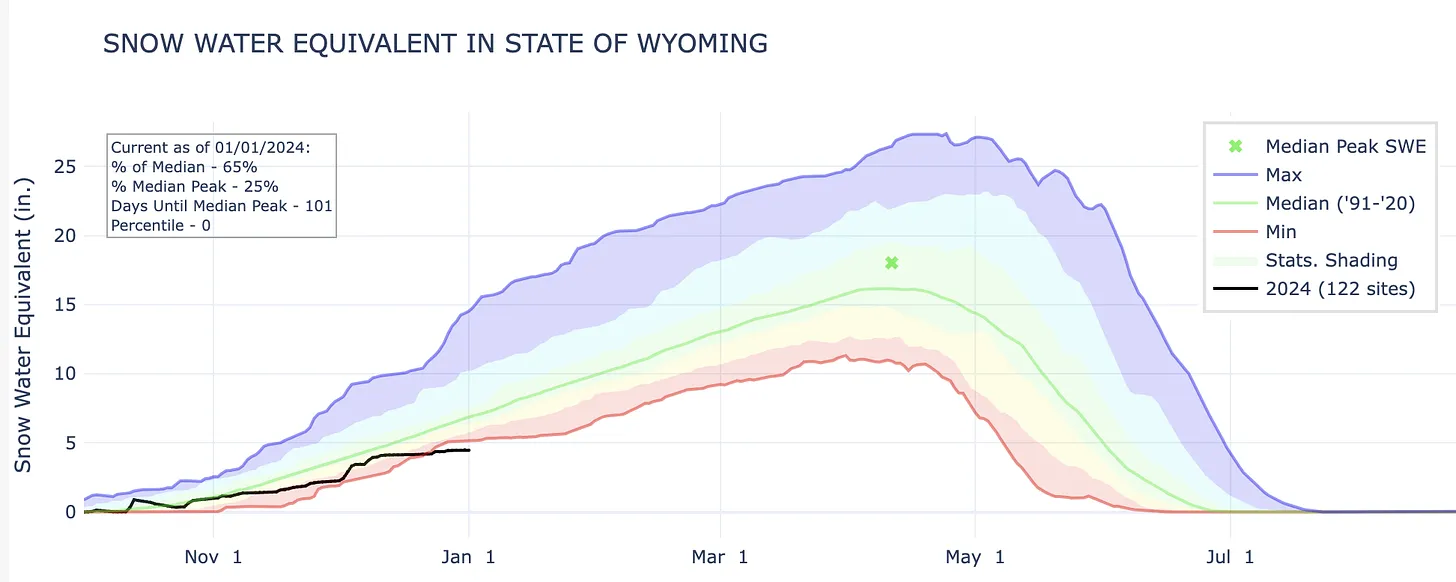
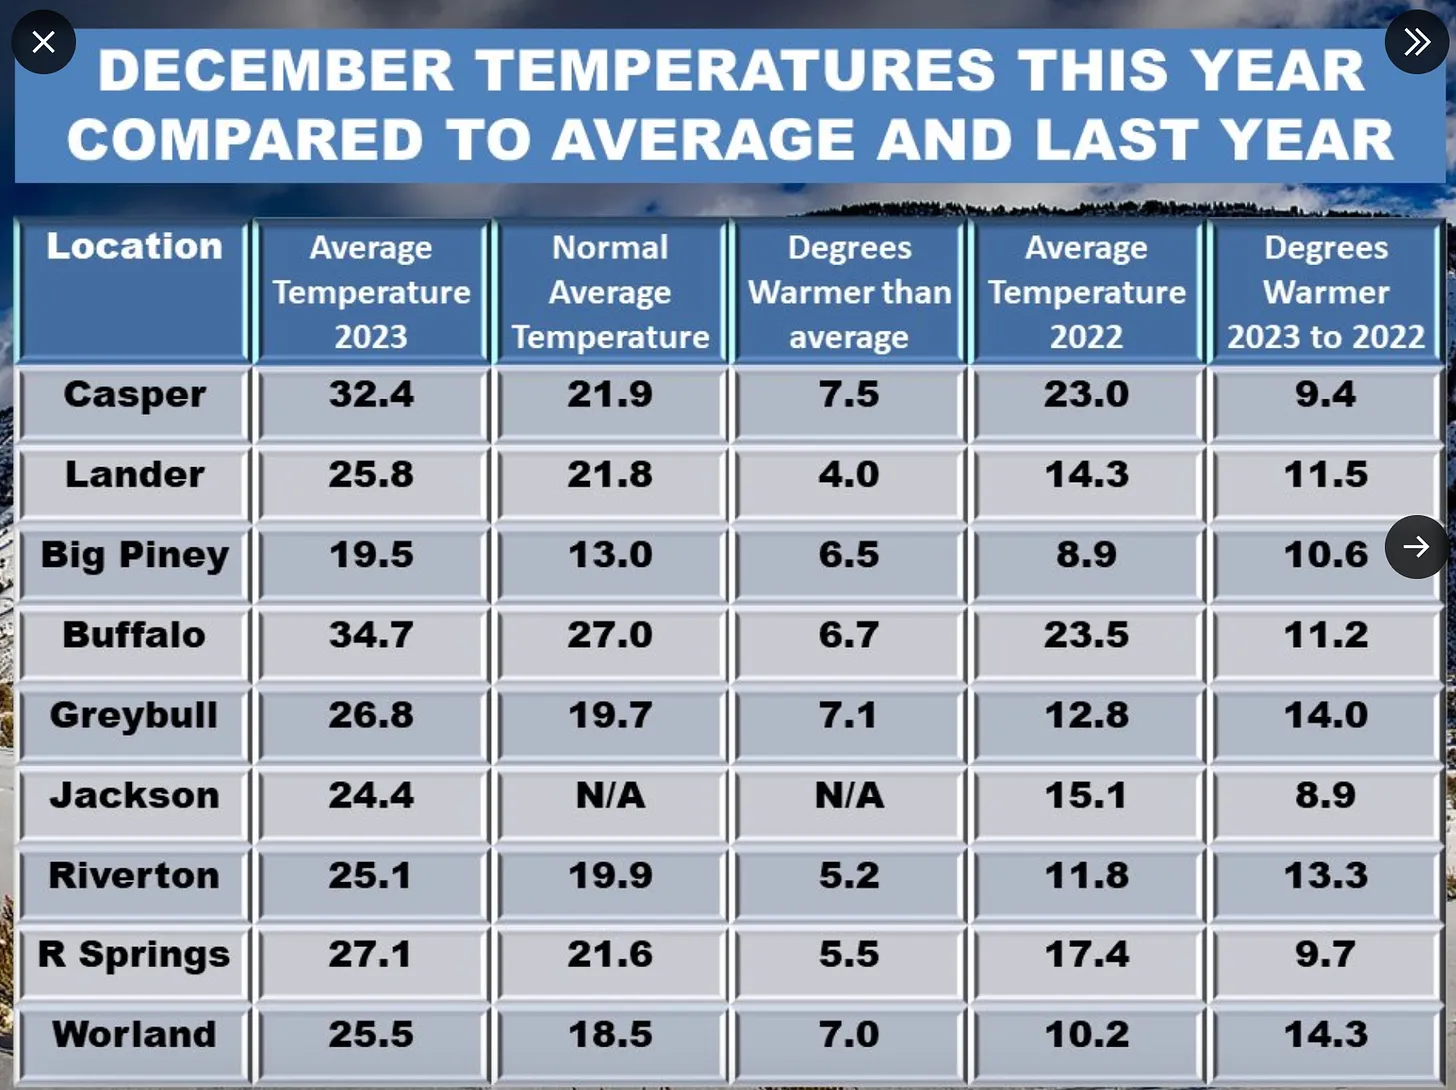

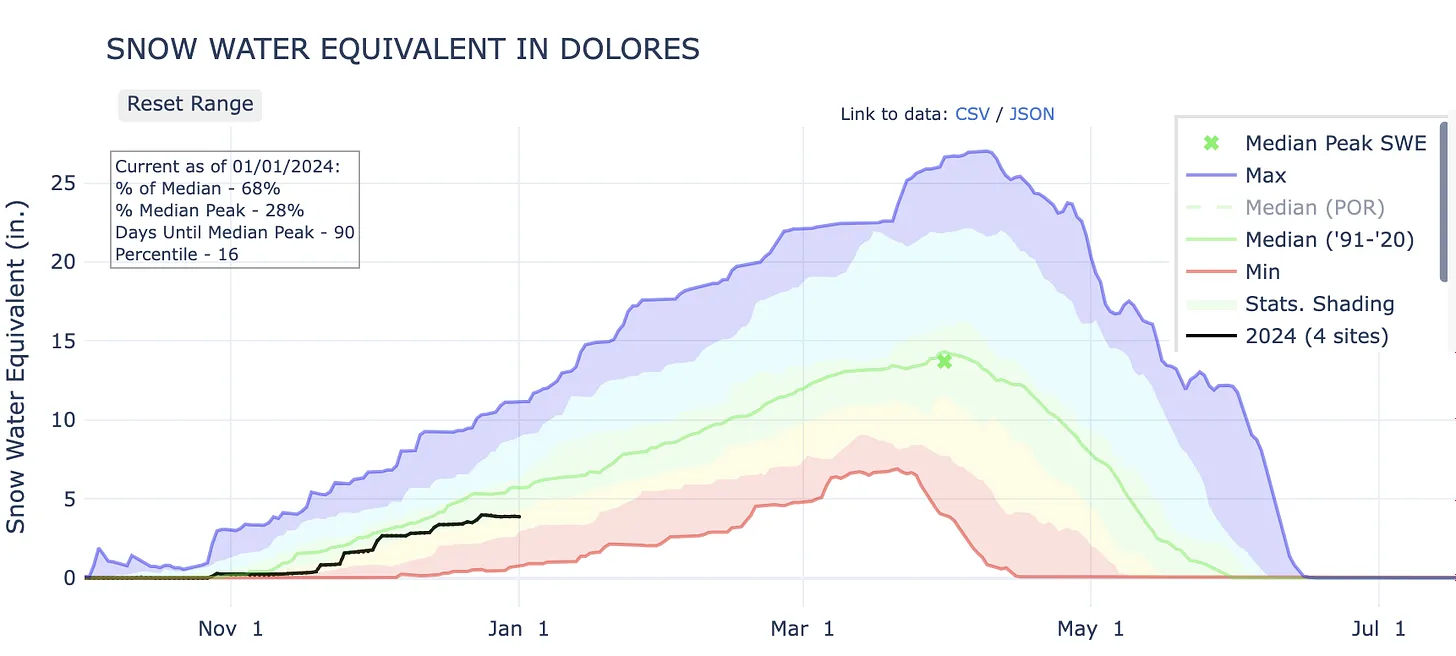

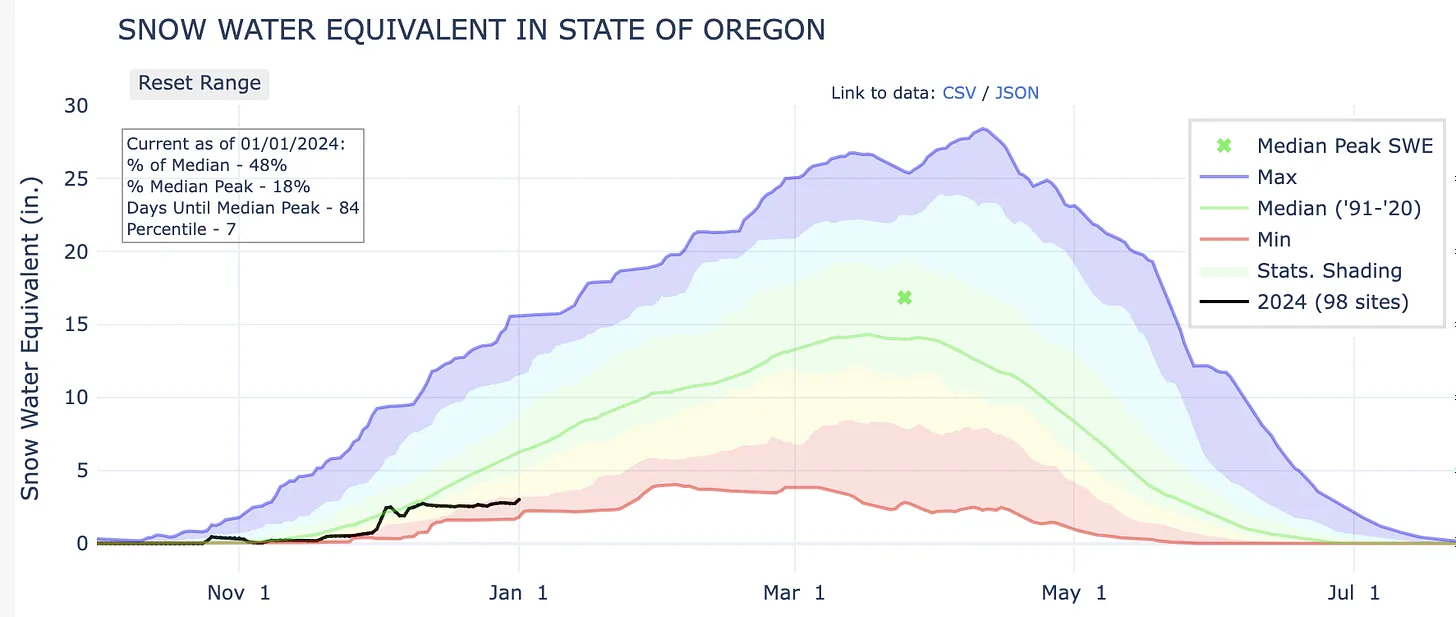
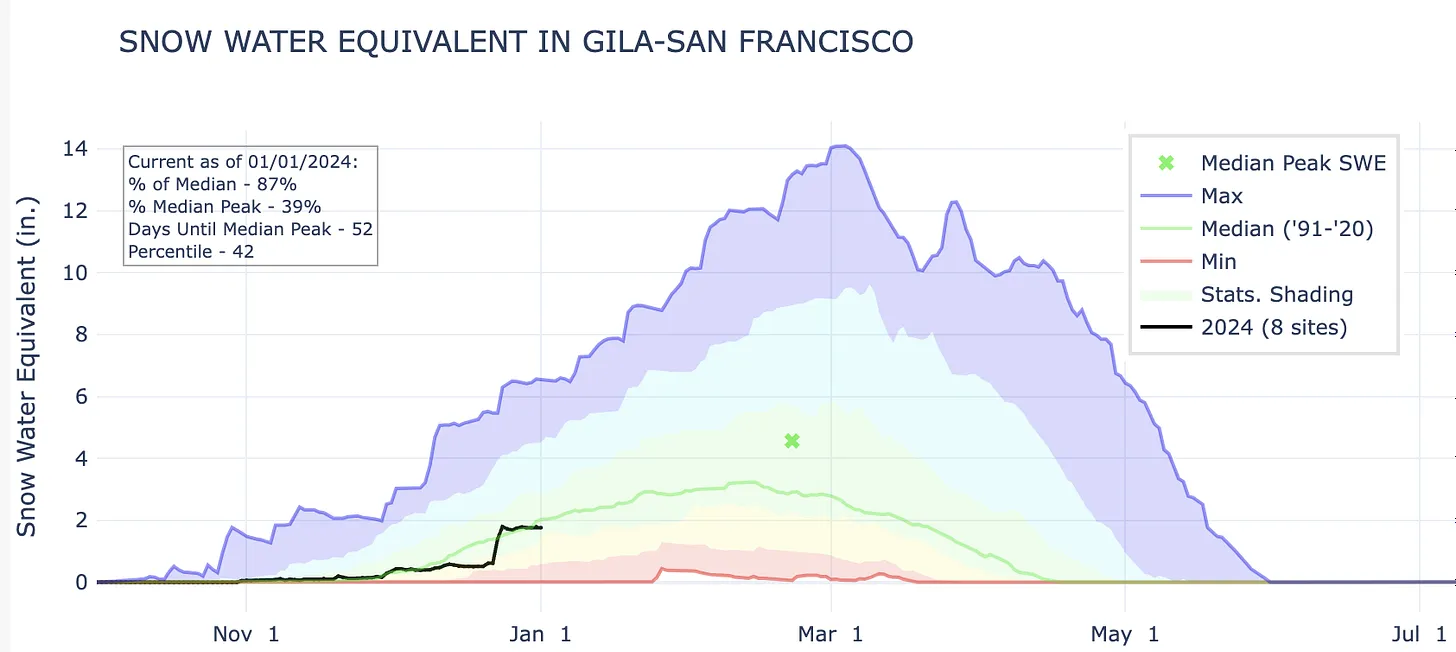
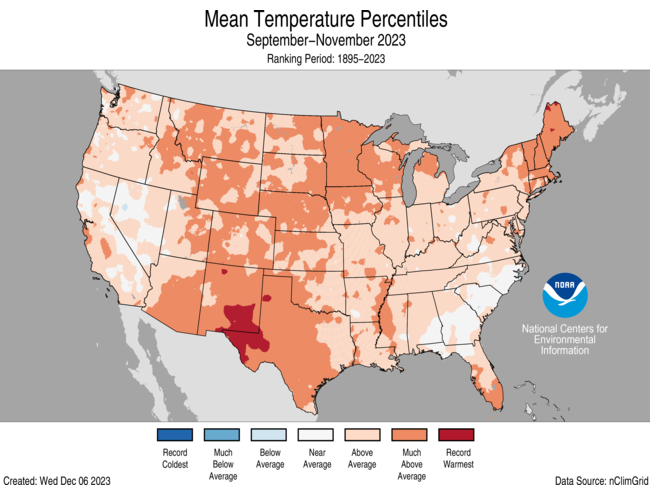
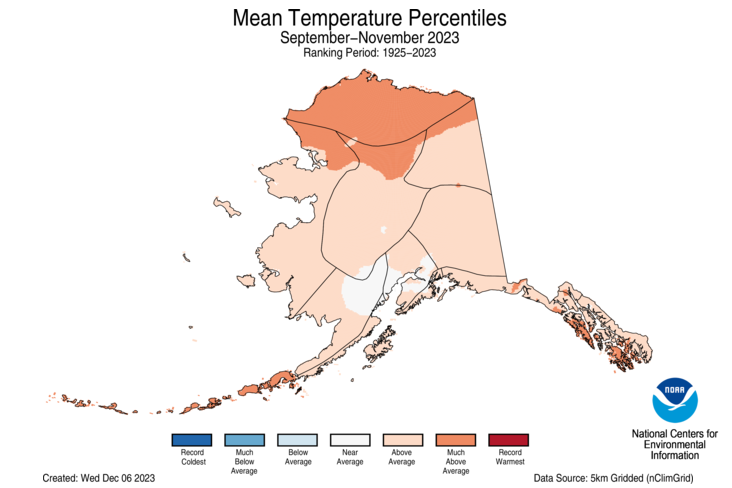
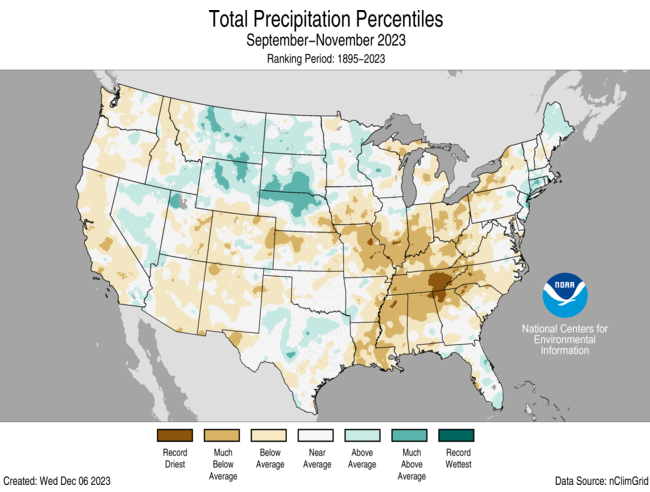