
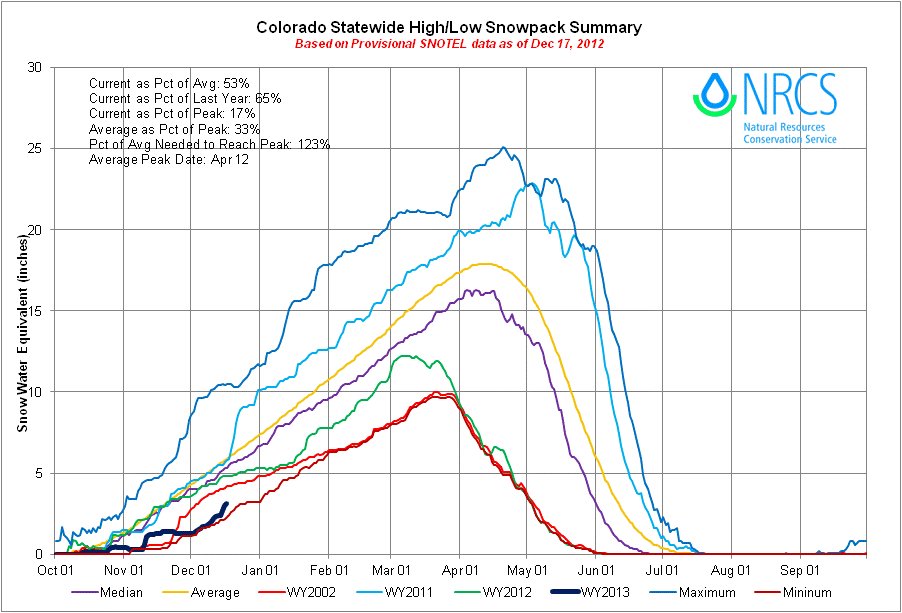
Click on the thumbnail graphic for the statewide basin high/low graph from the Natural Resources Conservation Service. Statewide snowpack = 53% of average for this date.
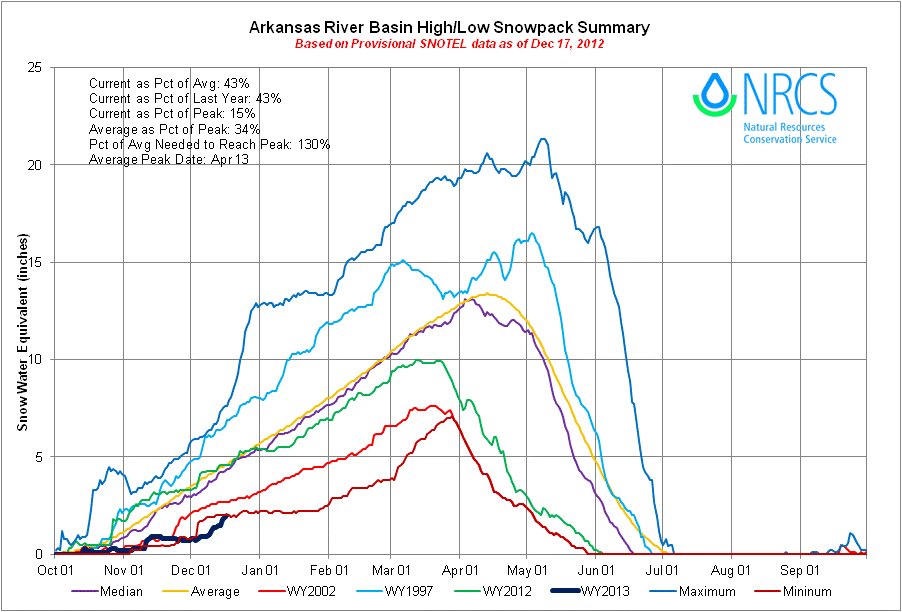
Click on the thumbnail graphic for the Arkansas basin high/low graph from the Natural Resources Conservation Service. Arkansas Basin snowpack = 48% of average for this date.
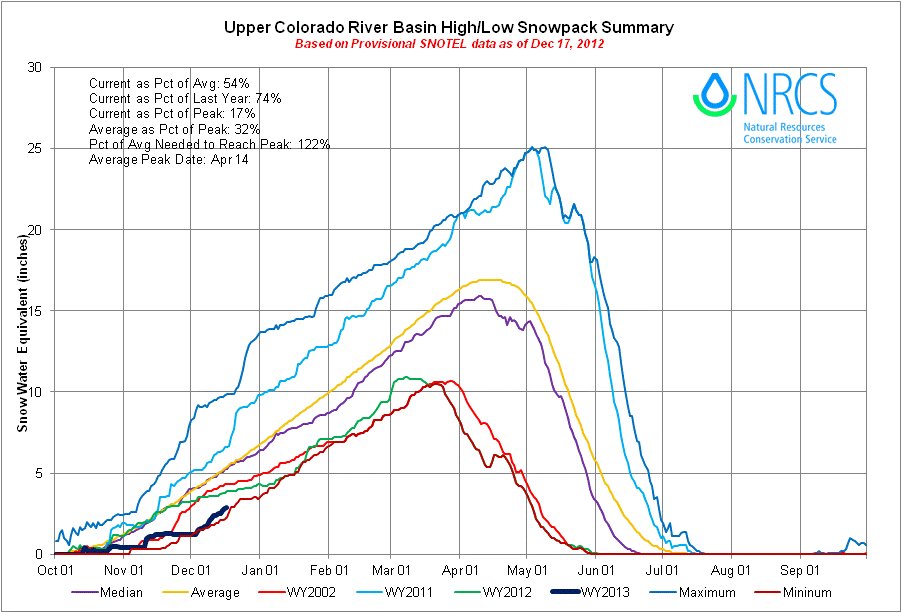
Click on the thumbnail graphic for the Upper Colorado basin high/low graph from the Natural Resources Conservation Service. Colorado Basin snowpack = 54% of average for this date.
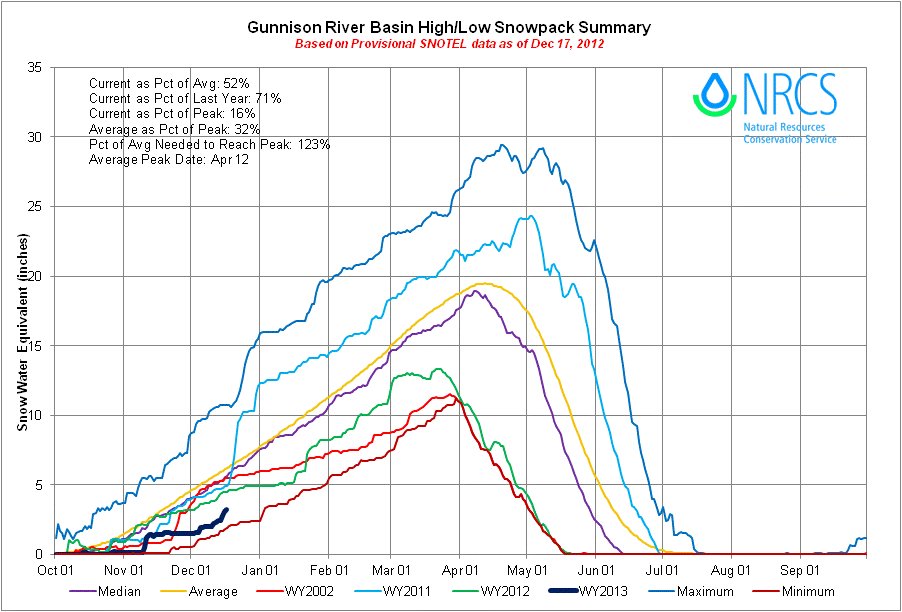
Click on the thumbnail graphic for the Gunnison basin high/low graph from the Natural Resources Conservation Service. Gunnison Basin snowpack = 52% of average for this date.

Click on the thumbnail graphic for the North Platte basin high/low graph from the Natural Resources Conservation Service. North Platte Basin snowpack = 63% of average for this date.
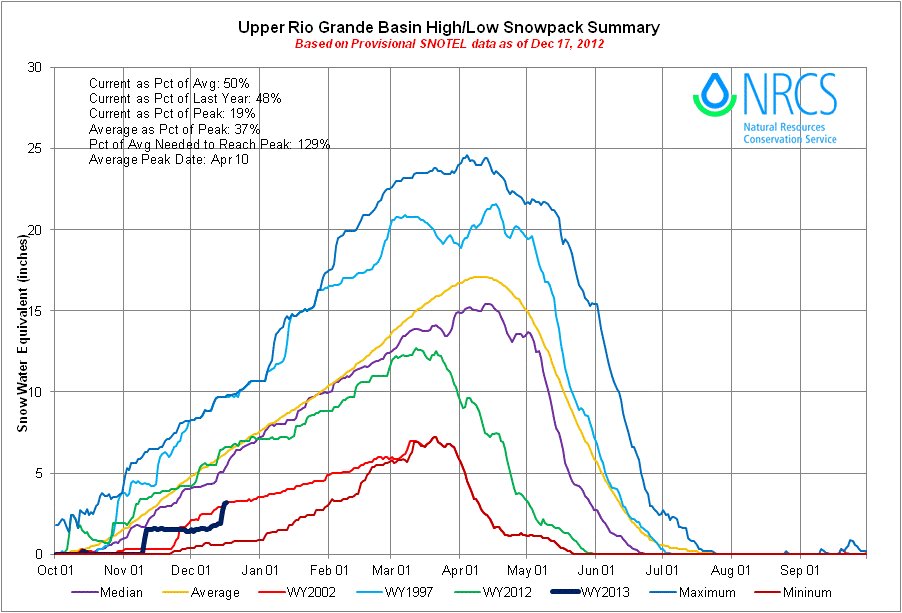
Click on the thumbnail graphic for the Rio Grande basin high/low graph from the Natural Resources Conservation Service. Rio Grande Basin snowpack = 50% of average for this date.

Click on the thumbnail graphic for the San Juan/Dolores/San Miguel/Animas basin high/low graph from the Natural Resources Conservation Service. San Juan/Dolores/San Miguel/Animas Basin snowpack = 49% of average for this date.
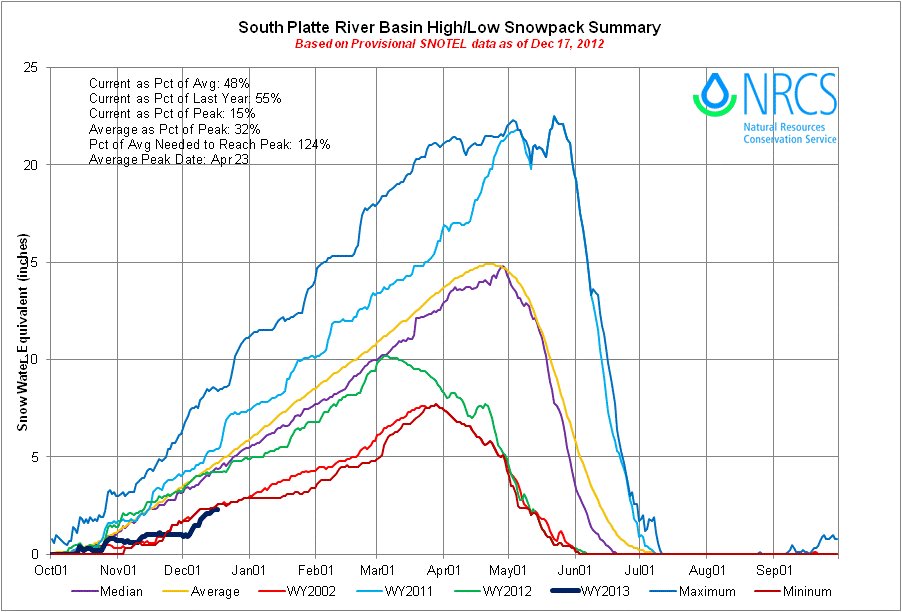
Click on the thumbnail graphic for the South Platte basin high/low graph from the Natural Resources Conservation Service. South Platte Basin snowpack = 48% of average for this date.
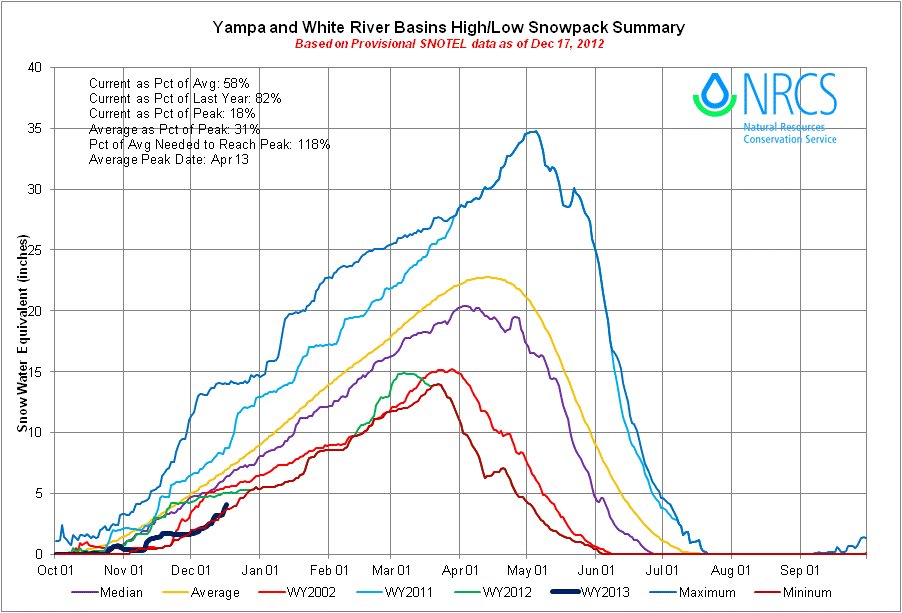
Click on the thumbnail graphic for the Yampa/White basin high/low graph from the Natural Resources Conservation Service. Yampa/White basins snowpack = 58% of average for this date.