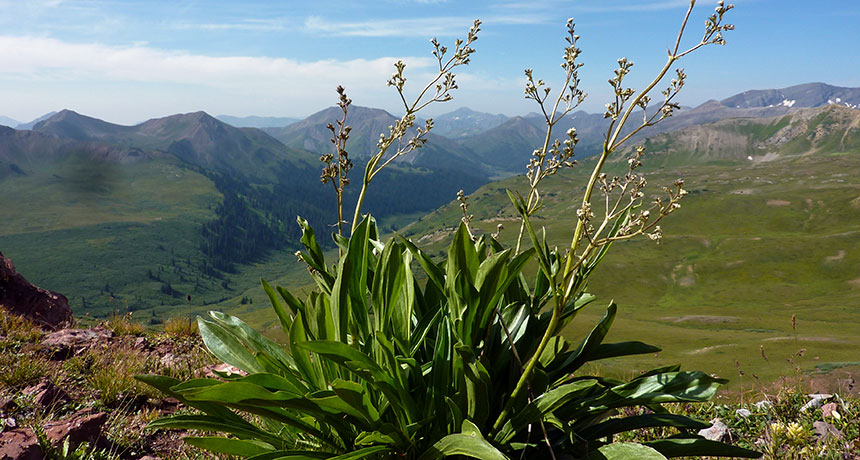
MOUNTAIN CLIMBER Male valerian plants like this one have moved up in elevation in response to hotter, drier climate conditions. As a result, male-female plant ratios have changed since the late 1970s, researchers have found. This plant is growing in the research team’s highest study site, at 3,790 meters. Via Science News.
Scientists at the Rocky Mountain Biological Laboratory near Crested Butte have documented sex-specific responses to climate change for the first time. The study, published in the journal Science, shows changes in the valerian plant’s growth patterns over 40 years of research.
Kailen Mooney, the report’s co-author and a professor at the University of California Irvine, said a warming planet has already affected where the plant grows at different elevations.
“Just like in humans, where where males and females are different, in plants, males and females are different and they have responded to climate change differently,” he said. “Specifically, what we found is that over the last 40 years, males have been increasing in abundance.”
He explained male plants have traditionally grown at lower elevations, where it’s hot and dry, and females grow higher up, in cooler, wetter areas. Mooney said warmer conditions have allowed more males to settle into female territory. Unlike most flowering plants, valerian, like asparagus, papaya, spinach, and aspen, can’t self-fertilize.
Mooney noted that the report is the first of its kind to show how male and female plants respond differently to climate change. He said the research could help scientists get a better understanding of how humans and other animals might adapt to changing conditions.
This image was taken during the peak outflow from the Gold King Mine spill at 10:57 a.m. Aug. 5. The waste-rock dump can be seen eroding on the right. Federal investigators placed blame for the blowout squarely on engineering errors made by the Environmental Protection Agency’s-contracted company in a 132-page report released Thursday [October 22, 2015]
Senators Cory Gardner, R-Colorado, and Orrin Hatch, R-Utah, on Thursday called for a hearing on a bill that would expedite reimbursements to communities impacted by last year’s Gold King Mine spill.
In a letter to senators Chuck Grassley, R-Iowa, and Patrick Leahy, D-Vermont, the chairman and ranking member of the Senate Judiciary Committee, the pair called for a hearing on Gold King Mine Accountability and Compensation for Taxpayers legislation that they introduced in May.
The bill would require the EPA to fully reimburse communities for expenses caused by the spill. It would also expedite the payout of emergency response costs for tribes, local and state governments. The letter asks for the “swift consideration” of the bill.
It is one of several pieces of legislation pending approval in Congress concerning the spill, as well as good Samaritan legislation for mine reclamation. Sen. Michael Bennet, D-Colorado, introduced a similar EPA reimbursement bill in September last year that would also require the EPA to compensate those affected by the spill.
Here’s the release from US Senator Gardner’s office.
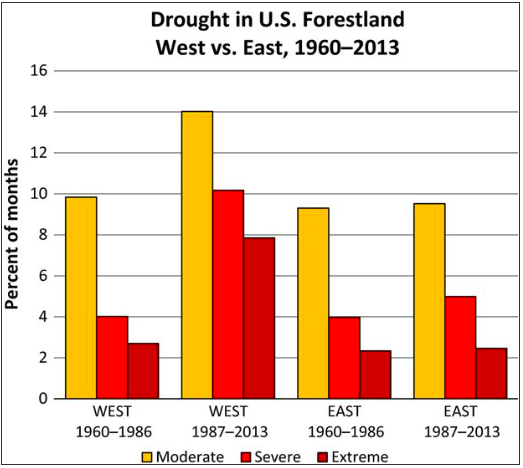
Forests across the country have been impacted by increasingly prevalent drought conditions in the last two decades, according to a new study by scientists from 14 research institutions.
Drought has the potential to impact the distribution of species, biodiversity, and the goods and services that forests provide. These and other responses have already been observed in the West, a region which has experienced its fair share of drought and resulting forest diebacks (when a community of trees has above average mortality rates), changes in the composition and structure of forests, and wildfires. Droughts are also now affecting forests in the eastern U.S., in particular in the South and Upper Midwest—regions where there is comparatively less information on how drought affects forests, particularly at the larger ‘stand’ (forest community) scale.
Understanding how drought has already affected forests will help managers anticipate what the broader scale impacts of drought will look like in the future as the climate continues to change. To address this need, researchers – including Southwest Climate Science Center director Stephen Jackson – produced a synthesis of the current state of knowledge of the effects of drought on forests across the continental U.S. The results were recently published in the journal Global Change Biology.
Researchers synthesized studies on the effects of drought on tree growth and mortality, tree recruitment, range shifts, and community composition. They also examined the role of forest management practices in mitigating and exacerbating the effects of drought, and summarized various modeling approaches used to estimate forest change.
Key findings include:
In the West, stand- and regional-level consequences of drought are well-documented. Extensive drought has coincided with reduced tree growth and an increased risk of mortality. In the East, there is very little information available at the stand-scale, though numerous studies have looked at individual tree response.
Human fire suppression in the West has resulted in higher density stands comprised of small-diameter trees. High density forests face increased moisture stress during drought, and fires that occur in these forests have more fuel and are more severe than those that occur under low-density forest conditions.
In the eastern U.S., where there are large areas of low relief, even a modest change in climate can result in large shifts in the location of suitable habitat. Meanwhile, in the more mountainous West, moisture and temperature gradients are more compact and migration has the potential to be more effective.
Models suggest that suitable habitats of many tree species are shifting faster than populations are adjusting by adaptation or migration.
Photo: Tree mortality in the southern Sierra Nevada mountains, California. Credit: USFS
Interestingly, the researchers note that forest managers already engage in several practices that can be harnessed to mitigate the effects of drought. For example, thinning can be used to selectively remove moisture-demanding species, allowing drought tolerant species to take their place and improving moisture access to remaining trees. Artificial regeneration (i.e. plantings) can also be implemented during drought to help forests recover.
Anticipating the future of forests is a challenging task that relies heavily on observational data, which is difficult to extrapolate to larger scales and is unavailable in some parts of the country. Furthermore, other variables that affect forests are changing simultaneously, such as rising CO2 levels, nitrogen deposition, and invasive species, making it difficult to attribute observed changes in forests to drought.
The results of this study show that we have some understanding of how drought affects the individual trees that make up a forest. However, we do not yet have sufficient information to predict the future of forest ecosystems in the face of a changing climate. The authors emphasize that future research should prioritize identifying how drought effects forests at the larger community scale, so that managers can take appropriate action to protect forests.
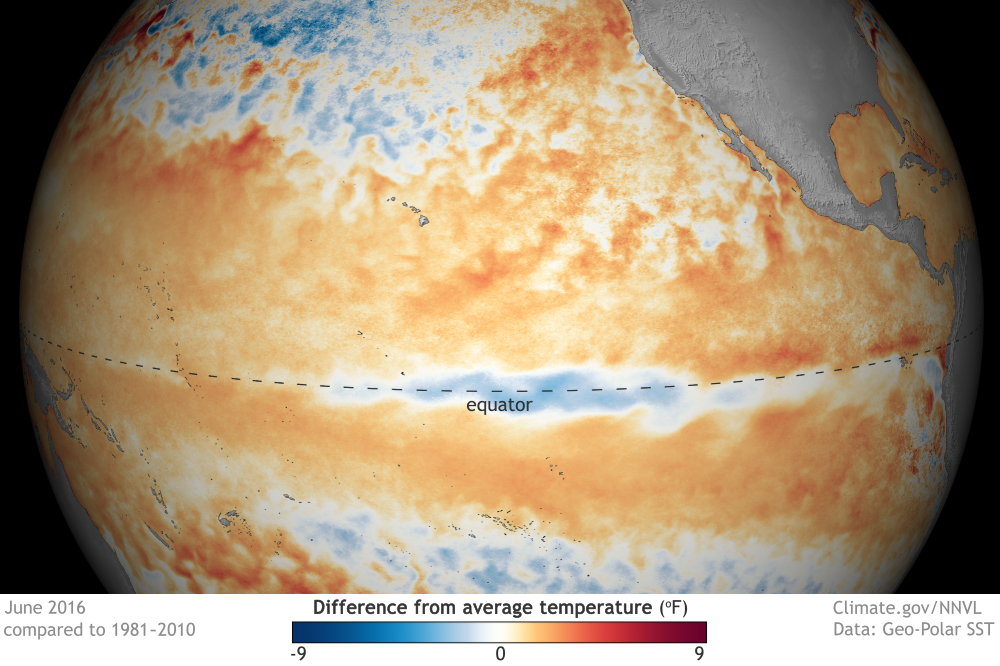
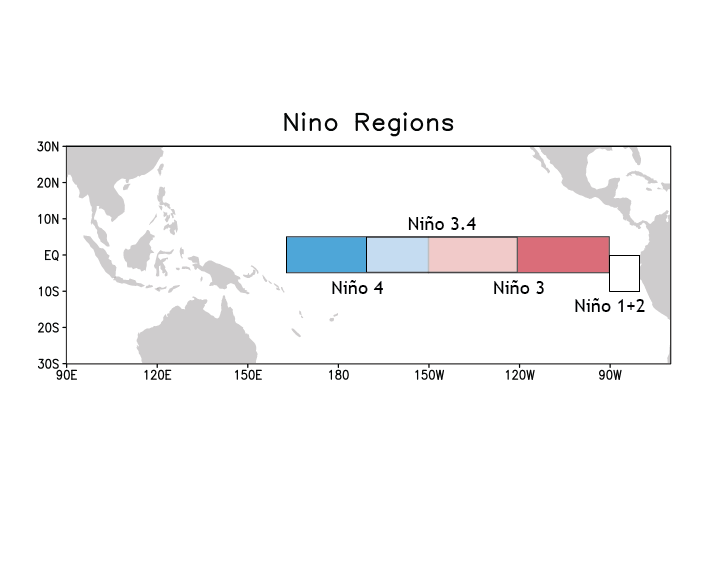
Neutral ENSO conditions reigned during June and so far in July, as the sea surface temperature in the Niño3.4 region, often used to measure the El Niño/La Niña (ENSO) state, was between -0.5°C and 0.5°C away from average. ENSO-neutral means forecasters can relax a bit, and phones are no longer ringing off the hook now that this whale of an El Niño finally bit the dust.
Sea surface temperature in June 2016 compared to the 1981-2010 average. Cooling in the central tropical Pacific confirms that El Niño is over and hints that La Niña may develop later this year, if the atmopshere responds. NOAA Climate.gov map by Dan Pisut (NOAA EVL), based on GEO-Polar data.
However, we can’t rest too much. During the last 60 or so years, strong El Niño years have often been followed by La Niña years. There are known physical reasons for this, which we have covered (here and here). Although the record is short, it appears the stronger the El Niño, the greater the chance for a La Niña the next year. And we just had a pretty strong El Niño!
Sure enough, forecasters currently believe there is an approximately 50% chance that sea surface temperatures for the Niño3.4 region will drop to at least -0.5°C below average (qualifying as a La Niña condition) during the August–October season, and a 55-60% chance for La Niña for the fall. Although 55-60% is far from a sure thing, it means that getting some grade of La Niña, even if just a weak one, is more likely than not.
At the moment, there is a good supply of cooler-than-average water below the surface in the central and eastern tropical Pacific. This cold water has been making contact with the surface along portions of this vast stretch of ocean right along the equator, and the Niño-3.4 index dropped into weakly negative territory by late June as a result.
Weakened Probabilities for La Niña
However, the 55-60% chance for La Niña represents a noticeable drop in probability from last month, which had peak probabilities of about 75%. Why the decrease? A typical cop-out answer would be “The ENSO forecast models now show a decrease in the likelihood, and also in the peak La Niña strength, and we trust them.”
But why are they showing the decrease? What are the models seeing that the sea gull of average intelligence flying over one of the TAO or Argo buoys in the eastern tropical Pacific might not see? Or that some egghead scientist sitting on the 13th floor of an ivory tower at a high-powered university overlooking a green hill might miss in eyeballing a dozen busy-looking charts and graphs?
First, let’s probe the obvious, and look at the recent monthly rate of decrease of the ocean temperature in the Niño3.4 region since the peak of the 2015-16 El Niño, in comparison with what happened following other past El Niño events—in particular, the very strong 1997-98 and 1982-83 events. The figure below shows the result.
Temperatures in the Niño3.4 region of the tropical Pacific compared to the 1981-2010 average for 2015-16 (black line) and for other moderate-to-strong El Niño years since 1950. The two strongest previous events (1982-83 and 1997-98) are shown in magenta, four more strong events in purple, and the moderate events in light gray. The graph starts in July of the first year of El Niño and ends two years later in June. Climate.gov graph, based on ERSSTv4 data.
We can see that between May and June this year, the temperature decrease lost pace with that of 1998, after more closely paralleling it up through May. Note that a significant La Niña developed by late summer 1998. However, this year’s rate of decrease has been steeper, so far, than the one in 1983, and a weak La Niña condition even emerged in late 1983 (but it didn’t last long enough to make in on NOAA/CPC’s official list). So far, we’re on a trajectory this year that is somewhere in between those two cases.
But looking carefully at the behavior of 1998, 1983 and other significant post-El Niño cases like 1973, 1992, 1958 and 1988, we see that monthly fluctuations in behavior may not mean much in the grander scheme of things. Remember that ENSO usually acts more on a seasonal time scale than a monthly one, although ENSO-relevant events can occur within a single month from time to time, such as when the MJO interacts with ENSO. We may not have cooled at a very fast rate between May and June, but could easily make up for it in the coming months. So then, why are the models weakening their forecasts at this point in time?
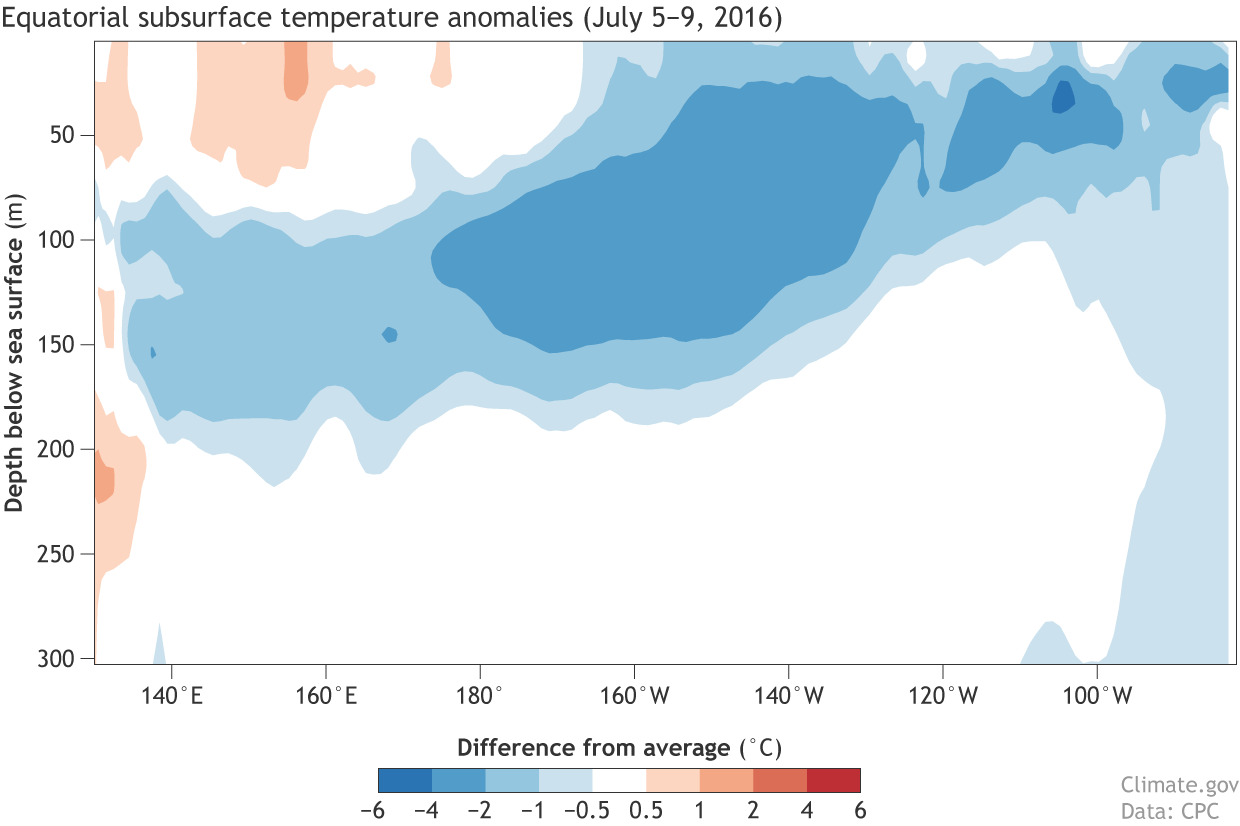
One likely answer is the delay in the expected onset of La Niña-like ocean-atmosphere coupling in the eastern tropical Pacific Ocean. What is coupling? To set the stage, cooler than average water currently sits beneath the surface, and is now impacting the surface across the eastern Pacific Ocean, as seen in the figure below.
Departure from average of the surface and subsurface tropical Pacific sea temperature averaged over July 5-9 2016. The vertical axis is depth below the surface (meters) and the horizontal axis is longitude, from the western to eastern tropical Pacific. Values are for right along the equator. The massive volume of water of below-average temperature extends to the surface near 130°-150°W, and also near 105°W and 85°-90°W.
With below-average water temperature along the equator in the eastern tropical Pacific, we would expect some atmospheric coupling, such as enhanced trade winds that blow from the colder-than-average water in the east toward the warmer-than-average waters of the central and western Tropical Pacific. Sinking motion (higher surface pressure) tends to occur over anomalously cool water, with rising motion (lower pressure) over warm water. And surface winds blow from high toward low pressure. If the trade winds were to increase, they would cause upwelling of the even more anomalously cold waters from below the surface, which would then cause even stronger trade winds, and so on—the typical La Niña feedback loop. This is nothing more than a strengthening of the Walker circulation that typifies La Niña.
Enhanced Trades—Where Are You??
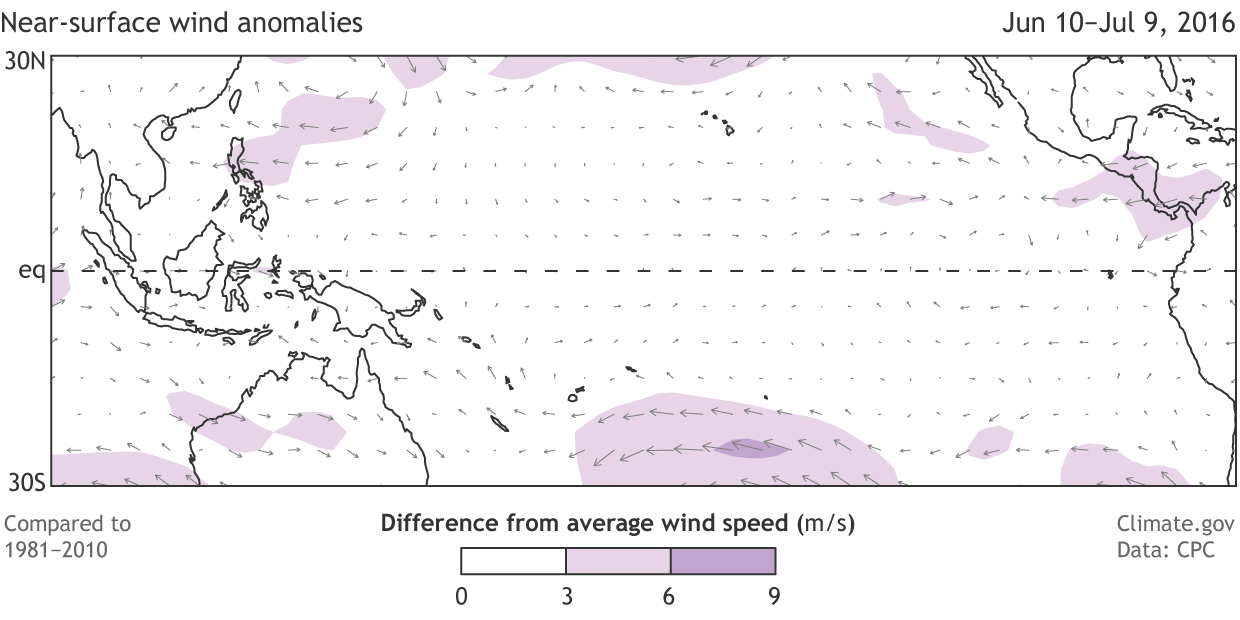
But the first nod toward above-average trade winds has not yet been observed, as we can see in the figure below. Trades are very close to average across most of the tropical Pacific.
Departure from average low-level (850 hPa) winds across the tropical Pacific Ocean from June 10–July 9, 2016. Arrows show wind direction, and shading shows areas where the speed is different from zero to a noteworthy degree. Along the central and eastern equatorial Pacific, the trade winds were mostly average.
To get a La Niña started, someone—the ocean or the atmosphere—has to make the first move. The ocean has done that—the ocean surface has cooled somewhat, and appears to be “waiting” for some stronger surface winds to upwell still colder water. To get the La Niña to grow, we need more upwelling. It is the atmosphere’s turn to play ball. Is it going to kick in or isn’t it?
Climate forecast models, which look at the latest observations, are beginning to wonder the same thing. Therefore, they recently have become less bullish on the La Niña—both for the rate of onset and the peak strength later in 2016. But they are not forecasting a cancellation of the event, so we need to keep our eyes peeled over the coming weeks and months to see if we get some action.
Fog-filled Black Canyon via the National Park Service
FromThe Grand Junction Daily Sentinel (Gary Harmon):
Summer arrived a bit late water-wise, but the rest of the year looks to be hot and dry, even though it began cold and wet.
The Bureau of Reclamation today is releasing more water from Crystal Dam to boost fast-falling flows in the lower Gunnison River, the agency said.
The increased releases are needed to keep the lower Gunnison at levels required to support endangered fish and the timing of this year’s increased release is a bit later than last year, probably by a couple weeks, said bureau spokeswoman Justyn Liff.
Releases from Crystal Dam increased from 1,850 cubic feet per second to 2,000 cfs today.
Blue Mesa Reservoir, the largest impoundment in the Aspinall Unit of reservoirs on the Gunnison, is 796,000 acre-feet, or 96 percent full. The releases are also intended to begin lowering the reservoir to meet wintertime goals.
On the Colorado River, the winter snowpack disappeared quickly and for the past two weeks, most streams and rivers were flowing at half of normal, said Chris Treese, spokesman for the Colorado River Water Conservation District.
“Runoff curves dropped very steeply this year,” Treese said.
Lake Powell, the all-important holding area for water sent down by the Upper Colorado River Basin states to Arizona, California and Nevada, is 57 percent full and the reservoir has received 95 percent of the water it typically receives during the water year, Oct. 1 to Sept. 30.
Ute Water Conservancy District is seeing the end of the runoff, as well, after a long, slow melt, said Steve Ryken, assistant general manager.
Ute, which draws water from the top of Grand Mesa, is the largest supplier of domestic water in the Grand Valley.
“This has been our best year since 2011,” Ryken said. While the snowpack wasn’t a record, it did come off slowly, filling reservoirs, such as Mesa Lakes, which hadn’t filled since 2011, Ryken said.
“The Jerry Creeks have been spilling and we’re just getting ready to draw them down,” Ryken said.
The Colorado River, which has been running about 2,500 cfs near Palisade, is about to dip sharply to about 1,500 cfs, as the last of winter snow melts away, Ryken said.

![This image was taken during the peak outflow from the Gold King Mine spill at 10:57 a.m. Aug. 5. The waste-rock dump can be seen eroding on the right. Federal investigators placed blame for the blowout squarely on engineering errors made by the Environmental Protection Agency’s-contracted company in a 132-page report released Thursday [October 22, 2015]](https://coyotegulch.blog/wp-content/uploads/2015/10/goldkingminespill1057am08052015viaepa.png)


