A canal to bring in water from Colorado and a large lake between Omaha and Lincoln both inched one step closer to reality Friday, but both proposals remain awash in questions.
Gov. Pete Ricketts has backed the water-related initiatives. Lawmakers on the Legislature’s Natural Resources Committee voted to advance bills laying the groundwork for each of them on Friday, and the Appropriations Committee approved a fraction of the $500 million the governor requested to fund the canal project.
Legislative Bill 1015 would give the Department of Natural Resources the authority to build and maintain a canal and reservoir system to divert water from the South Platte River in Colorado for use in Nebraska. Under a compact that’s nearly a century old, the canal would allow the state to claim up to 500 cubic feet per second of water for irrigation between Oct. 15 and April 1.
The South Platte River Basin is shaded in yellow. Source: Tom Cech, One World One Water Center, Metropolitan State University of Denver.
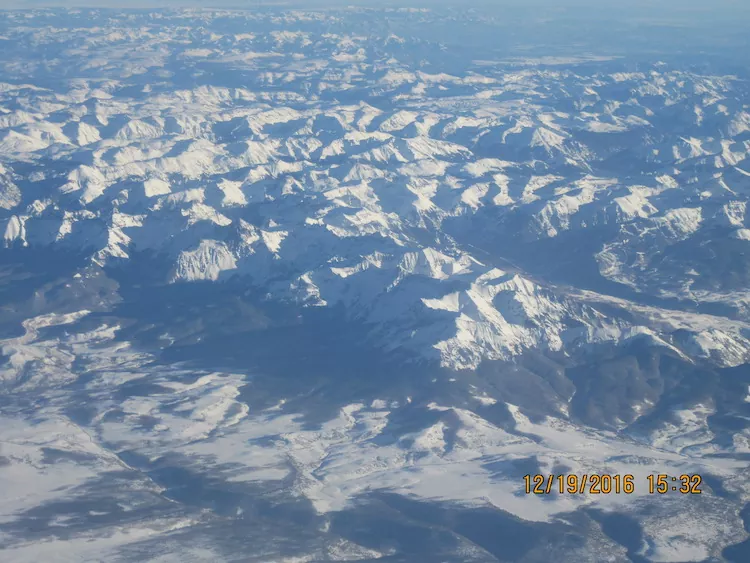
San Juan Mountains December 19, 2016. Photo credit: Allen Best
From email from Reclamation (Susan Novak Behery):
In response to decreasing flows in the critical habitat reach, the Bureau of Reclamation has scheduled an increase in the release from Navajo Dam from 350 cubic feet per second (cfs) to 400 cfs for tomorrow, Saturday, February 26th, at 4:00 AM.
Releases are made for the authorized purposes of the Navajo Unit, and to attempt to maintain a target base flow through the endangered fish critical habitat reach of the San Juan River (Farmington to Lake Powell). This release change is calculated as the minimum required to maintain the target baseflow.
The San Juan River Basin Recovery Implementation Program recommends a target base flow of between 500 cfs and 1,000 cfs through the critical habitat area. The target base flow is calculated as the weekly average of gaged flows throughout the critical habitat area from Farmington to Lake Powell.
This scheduled release change is subject to changes in river flows and weather conditions. If you have any questions, please contact Susan Behery (sbehery@usbr.gov or 970-385-6560), or visit Reclamation’s Navajo Dam website at https://www.usbr.gov/uc/water/crsp/cs/nvd.html
Click the link to read the article on the NOAA website (Kai-Chih Tseng and Nat Johnson):
Guest co-author Dr. Kai-Chih Tseng is a postdoctoral research scientist at Princeton University and the NOAA Geophysical Fluid Dynamics Laboratory who is an expert on climate variability and prediction, including the study of atmospheric rivers. In the summer of 2022, Dr. Tseng will begin an assistant professor position in the Department of Atmospheric Science at National Taiwan University.
This past December, a mind-boggling 18 feet of snowfall fell in the California Sierra Nevada Mountains! How does so much snow fall in one place in such a short period of time? One of the primary phenomena responsible for such extreme rain and snowfall, particularly in regions like the western U.S., is the atmospheric river. Like their terrestrial counterparts, atmospheric rivers carry tremendous amounts of water over thousands of miles. These aerial versions, however, often bring both severe disruption and great benefit through the heavy rain and mountain snows that they produce. In this blog post, we will give you a brief primer on atmospheric rivers and (of course!) explain how they are affected by ENSO (El Niño-Southern Oscillation).
Flying Mississippis
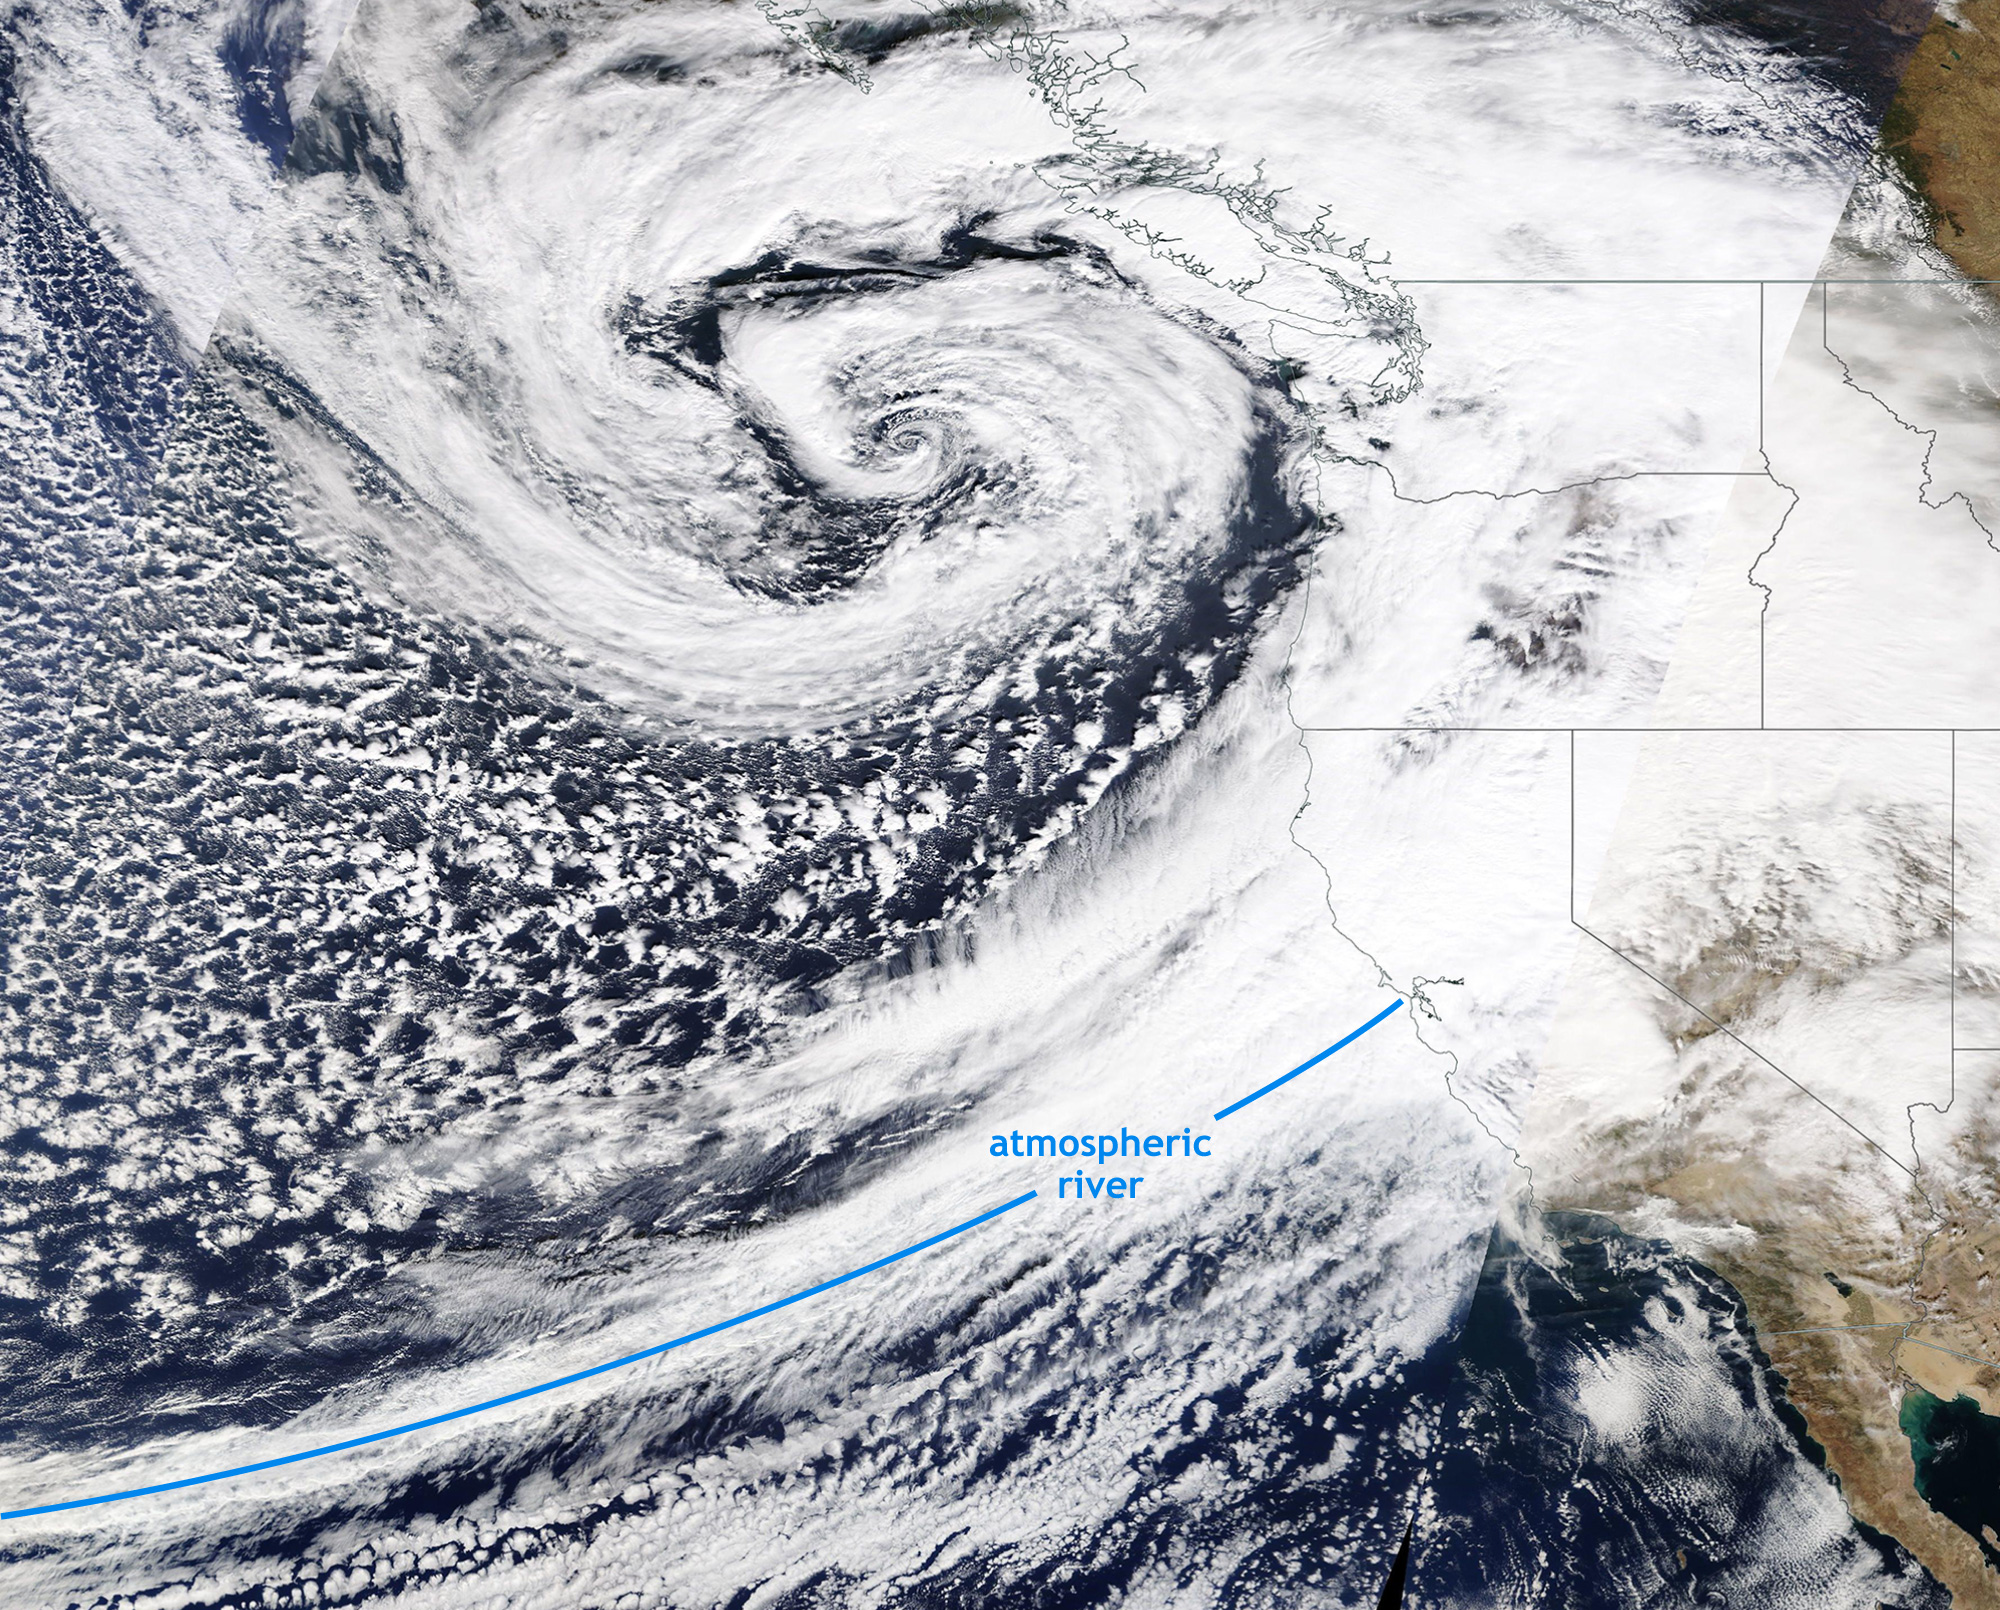
Satellite image taken on October 24, 2021. A powerful storm off the Pacific Northwest coast brought an intense atmospheric river to the San Francisco Bay region of California. NASA MODIS/TERRA satellite image taken from NASA Worldview.
Atmospheric rivers are long, narrow corridors of moisture-laden air extending from the tropics to higher latitudes. They can produce heavy rain and snowfall in short periods of time, especially when the air is lifted over high terrain, cooling the air and condensing the moisture into droplets, like wringing out an atmospheric sponge. When you see these impressively long features on satellite imagery, it’s no wonder that they are compared to rivers. In fact, an average atmospheric river carries 25 times the amount of water as the Mississippi River!
They form when warm, moist air in lower latitudes is transported poleward like a conveyor belt ahead of a trailing cold front from a powerful mid-latitude storm. Around the globe, atmospheric rivers are responsible for more than 90% of the water vapor that is transported to the mid-latitudes from the tropics and are a critical source of water for many regions, such as California and Nevada. They also can be quite destructive, causing severe flooding and damaging winds, with the strongest atmospheric rivers in the western U.S. typically causing damages in the hundreds of millions of dollars (1).
Click the image to render an animation of the atmospheric river hitting the U.S. west coast on October 23, 2021. Credi: NOAA
Several notable atmospheric rivers have made landfall along the West Coast of the U.S. this past fall and winter. On October 24-25, 2021, an intense atmospheric river brought high winds and historic rain reaching up to a foot to the San Francisco Bay region, providing a temporary reprieve from an enduring drought (but clearly not enough to end it). The animation above (2) shows the narrow, river-like corridor of concentrated water vapor that resulted in this historic rainfall. California is no stranger to this “boom or bust” precipitation pattern. Incredibly, up to half of the annual precipitation in parts of California falls in just 5 to 10 wet days during the year (is it any wonder that seasonal prediction of precipitation is so hard?), and atmospheric rivers are a major source of those few wet days (3). California is unique in terms of such extreme precipitation variability, but other western states, like Washington and Oregon, also rely on atmospheric rivers for water supply.
So, where and how often?
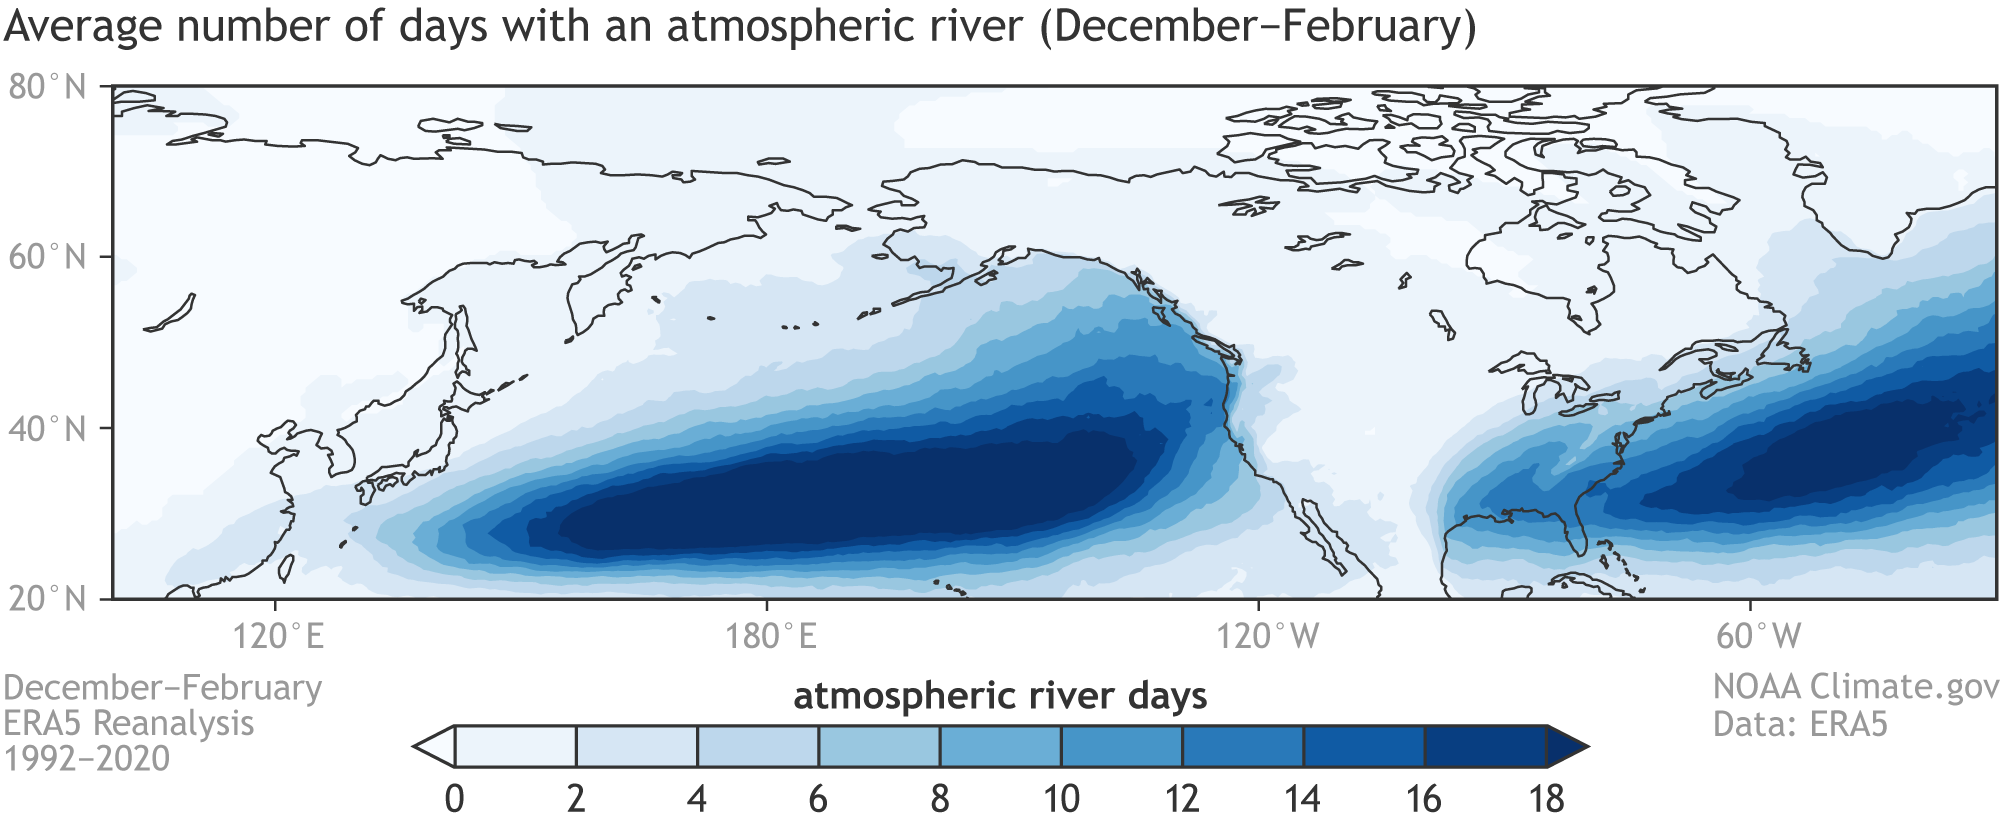
Average number of days each winter (December–February) with an atmospheric river occurrence over the northeastern Pacific Ocean. Maps calculated with ERA5 Reanalysis data covering the 1992-2020 period and with the Mundhenk et al. (2016) method for detecting atmospheric rivers.
Atmospheric rivers (see footnote 4 for how we define them) occur throughout much of the globe outside of the tropics and in all seasons, but they are most frequent in the storm tracks in the vicinity of jet streams. Their impacts on the U.S. are most pronounced in winter. The figure above shows that in a typical December–February period, atmospheric rivers near North America occur most often offshore in the North Pacific and North Atlantic. Although their importance is emphasized in the western U.S. because of their large contribution to annual rain and snow totals, they also frequently occur in central and eastern U.S. states, where we can expect approximately 10 winter days each year with an atmospheric river occurrence.
This is the ENSO Blog!
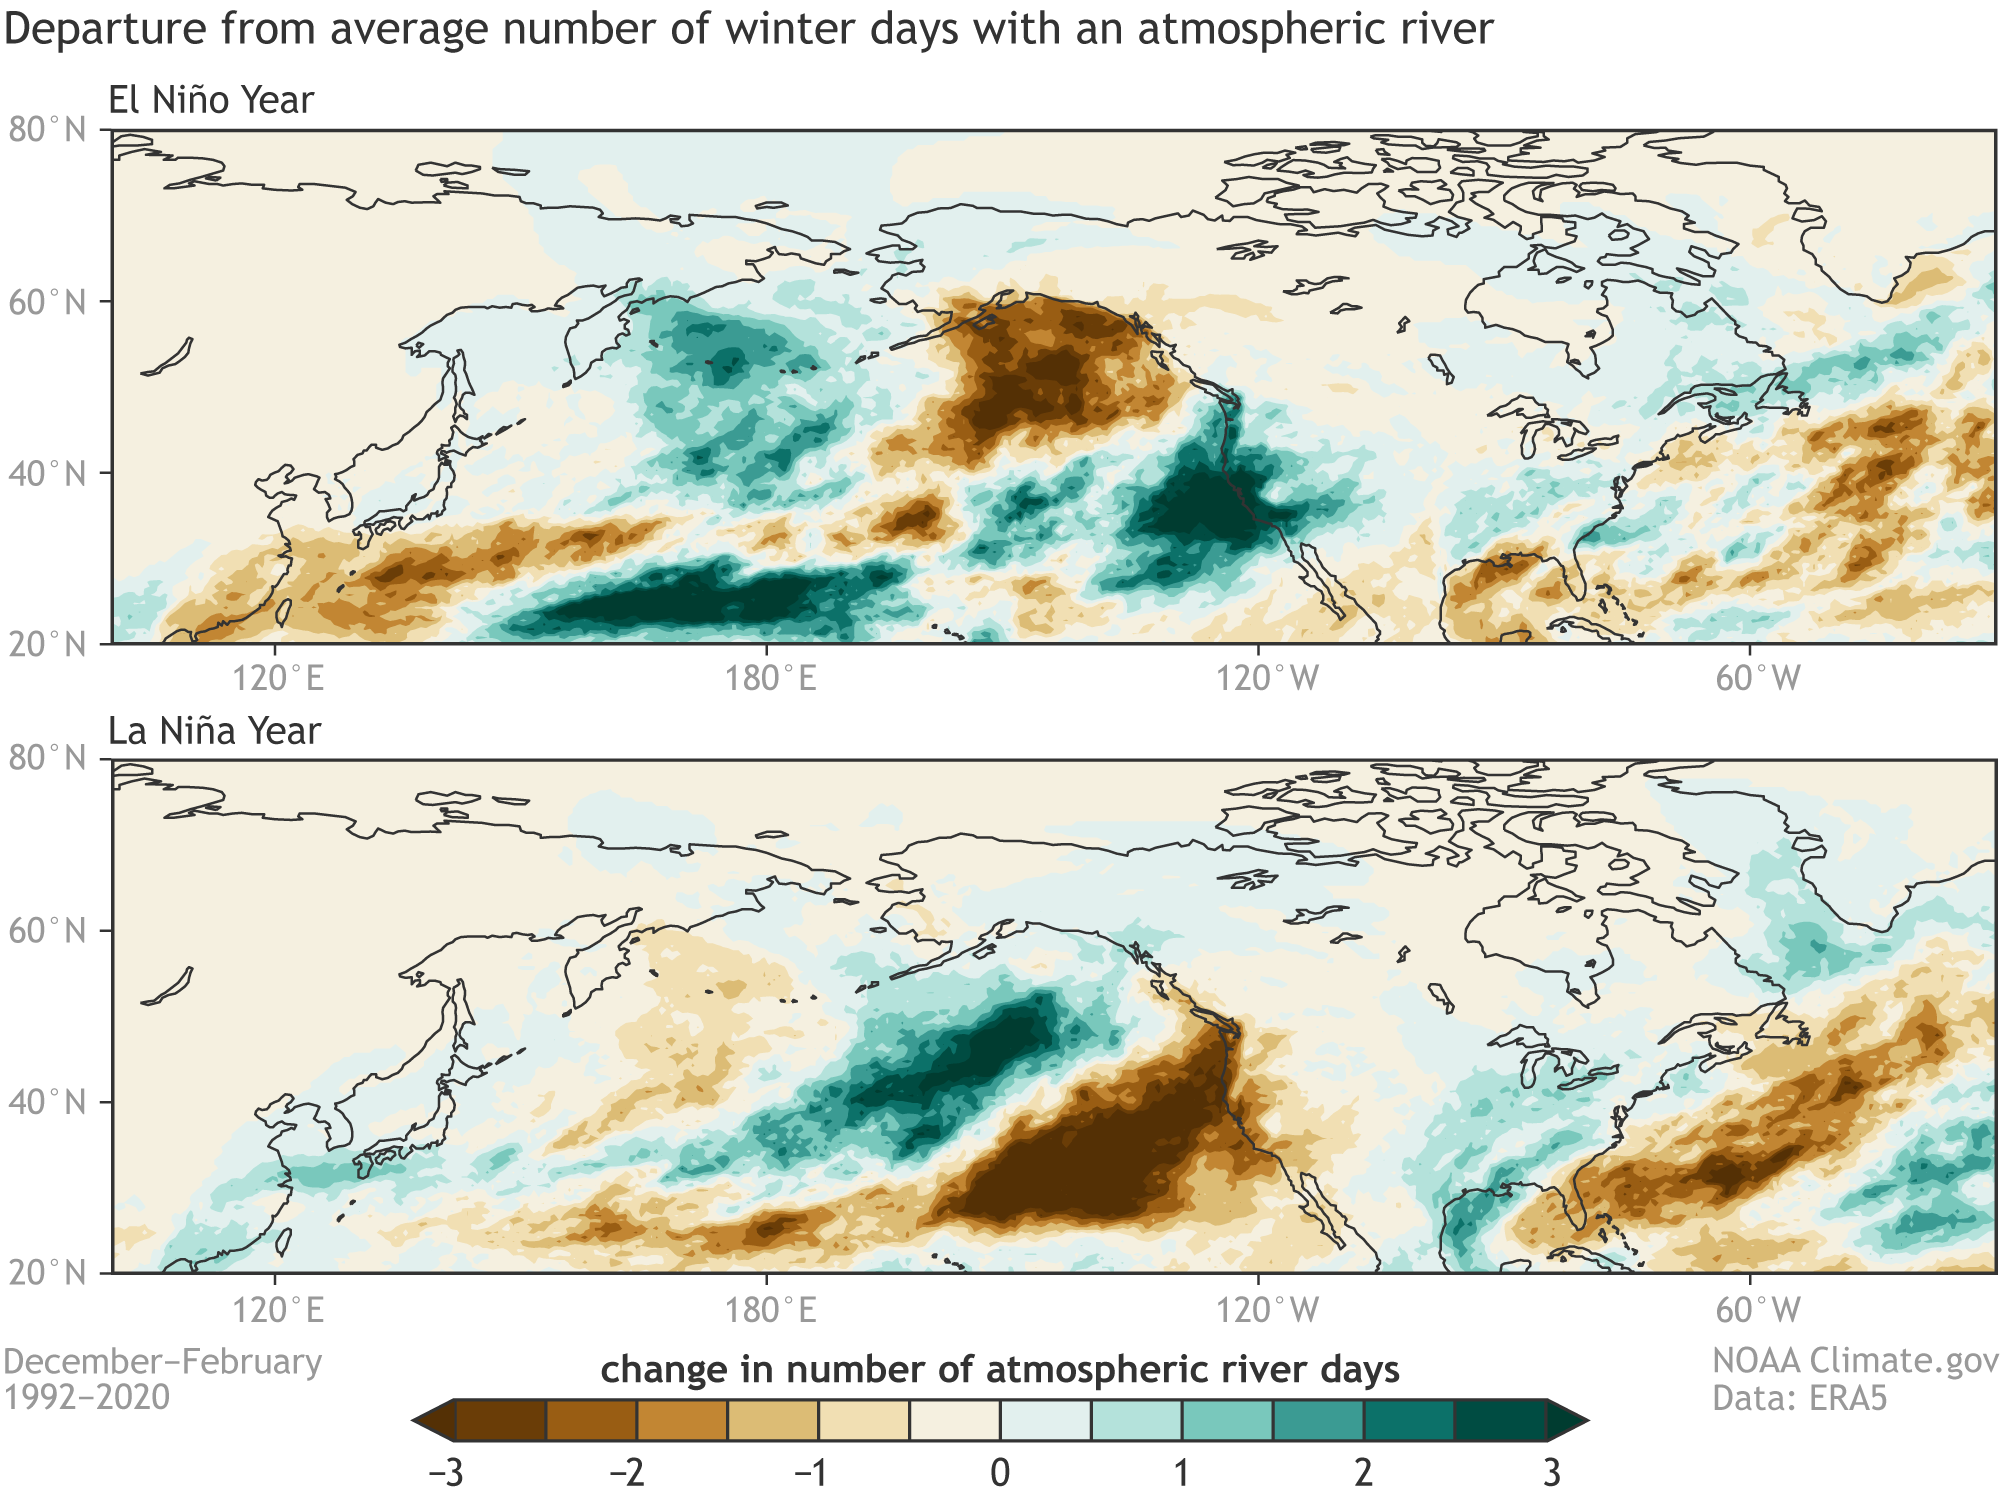
Don’t worry, we didn’t forget about the role of ENSO! Just as ENSO impacts the seasonal temperature and precipitation patterns over North America, it also affects the frequency of landfalling atmospheric rivers. Over the past 30 years, El Niño has brought more frequent than normal West Coast landfalling atmospheric rivers, whereas La Niña generally has brought less frequent occurrences. This winter has been pretty consistent with typical La Niña conditions, with below-average western U.S. atmospheric river activity. Despite a two-week period in December that brought atmospheric rivers and record snow to California, January was the second driest on record in California and Nevada.
Departures from the average number of days each winter (December–February) with an atmospheric river occurrence for (top) El Niño and (bottom) La Niña from 1992-2020. During El Niño winters, the number of days with atmospheric rivers is below average along the Alaska and western Canada coastlines, but above average along the U.S. West Coast. La Niña tends to bring the opposite: fewer atmospheric river days along the U.S.West Coast.
But how well can we predict atmospheric rivers?
As with all extreme precipitation events, accurate forecasts of individual atmospheric rivers and their impacts are limited to short-range weather forecasts. However, the latest research efforts are advancing our ability to predict regional atmospheric river activity (not individual storms) on subseasonal (roughly 2-4 weeks in advance) and even seasonal time horizons. On subseasonal timescales (5), the sources of atmospheric river predictability are rooted in large-scale climate patterns such as the Madden-Julian Oscillation and the Pacific-North American Pattern. On the seasonal side, a recent study led by guest co-author Dr. Kai-Chih Tseng indicates that one of the models participating in the North American Multi-Model Ensemble (NMME), SPEAR, can produce skillful seasonal forecasts of atmospheric river activity over some regions, including coastal California and Alaska, up to nine months in advance. The guiding hand of ENSO is one of the main reasons that seasonal atmospheric river forecasts may be possible.
Effects of climate change
Human-caused climate change is likely to increase atmospheric river intensity. Warming oceans lead to increasing available moisture for these powerful storms, enhancing the moisture transport and heavy precipitation that they produce. While several global climate model studies support the increasing intensity of atmospheric rivers with global warming, additional study is needed to better understand how other atmospheric river properties, like size, shape, frequency, and location, will change.
The bottom line is that any increase in atmospheric river intensity will contribute to the growing water resource challenges in the western U.S. Therefore, we can expect that improving our understanding and our ability to predict atmospheric rivers across a range of timescales will remain a major scientific priority.
Footnotes
1. For more information on how destructive atmospheric rivers can be for the western U.S., we recommend this article. Corringham et al. (2019) use a scale that divides atmospheric rivers into 5 intensity categories, like what we do for hurricanes and tornadoes.
Corringham, T. W., Ralph, F. M., Gershunov, A., Cayan, D. R., & Talbot, C. A. (2019). Atmospheric rivers drive flood damages in the western United States. Science Advances, 5(12), eaax4631. https://doi.org/10.1126/sciadv.aax4631
2. Hat tip to our friends at the Seasoned Chaos blog for providing the tools to construct this animation. Please check out their awesome complementary post on atmospheric rivers.
3. For additional information on the link between atmospheric rivers and California’s water resources, we recommend this article.
Dettinger, M.D., Ralph, F. M., Das, T., Neiman, P.J., & Cayan, D. R. (2011). Atmospheric rivers, floods and the water resources of California. Water, 3(2), 445–478. https://doi.org/10.3390/w3020445
4. At this point, you may be saying, “Wait, Nat and Kai-Chih, how do I know if an atmospheric river is occurring?” Good question! There is no single, objective method to identify atmospheric rivers, but there are several algorithms that are commonly used. All these algorithms share at least two features in common: (1) atmospheric vapor transport must be unusually strong, and (2) the vapor transport must be concentrated in a feature that is long and narrow. In the analysis of this blog post, we analyze daily fields of vertically summed water vapor transport and use the method of Mundhenk et al. (2016) to identify grid cells where an atmospheric river is occurring. The Mundhenk et al. (2016) method ensures that the two criteria listed above are met.
5. For example, check out some of the neat experimental subseasonal atmospheric river forecast products provided by the Center for Western Weather and Water Extremes (CW3E) at this site.