In many semi-arid, snow-fed river systems, climate change is shifting the timing and quantity of streamflow; at the same time, changing water use priorities are introducing additional demands on water supplies. These dynamics challenge water security across the globe. Water markets – economic instruments used to reallocate water via voluntary trade – may be used to adapt to these changes, though their implementation remains limited. To understand how water markets may enhance water security in the western United States, we assess diverse actors’ perceptions of water allocation institutions broadly, as well as their preferences for different water market designs, in the empirical context of the Walker River Basin. This 4,200-square mile watershed, located on the California-Nevada border, exemplifies many key regional water management challenges. Through an analysis of 30 in-depth interviews, we find that actors across sectors desire changes to traditional water allocation institutions, preferably at the local level, and view markets as an acceptable tool for reallocation. Despite identified legal and social challenges, markets that facilitate temporary water trading are generally preferred. While limited to the context of a single basin, these findings provide lessons for designing water markets to enhance water security in basins regionally and beyond.
Click the link to read the article on the NOAA website:
Climate research has revealed dramatic increases in temperatures since the late 19th century, but our analysis is limited by how long temperatures have been consistently sampled around the world, providing data that lasts for only a negligible fraction of the Earth’s lifespan. How can researchers compare modern temperatures to past centuries and millennia?
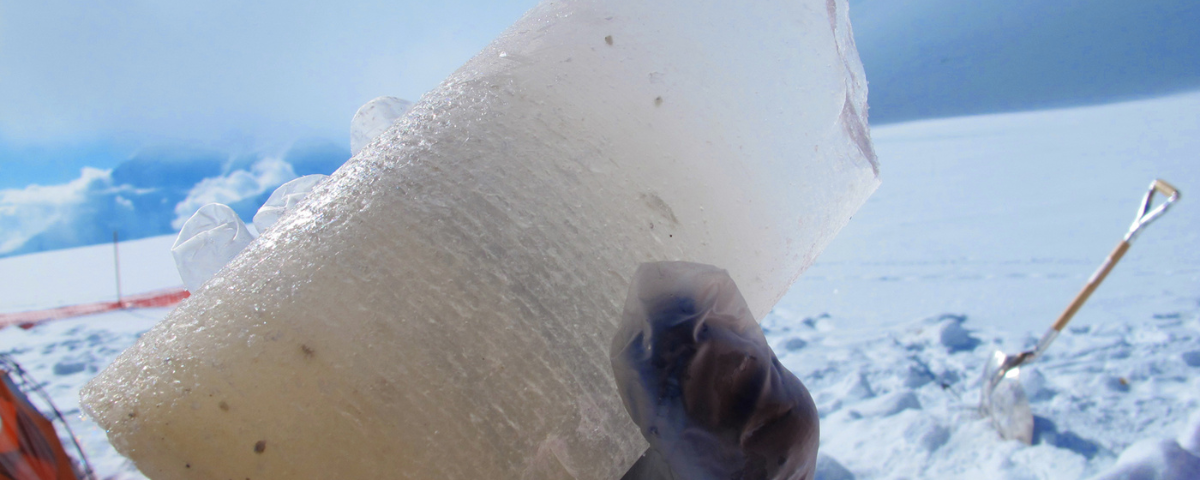
The answer is paleoclimate research. By using various proxies, scientists can infer climate information from thousands or even millions of years ago. Tree rings and ice cores contain physical or chemical evidence that can be reliably traced to certain time periods. For instance, scientists can observe the width of annual tree rings in temperature-sensitive (as opposed to moisture-sensitive) trees or the relative concentrations of oxygen isotopes in ice cores (at high latitudes, precipitation in colder conditions has a lower O-18/O-16 ratio as compared to warmer conditions).
Paleoclimate data allows us to better understand current trends in the context of centuries of climate variability.
Temperature and Carbon Dioxide Change
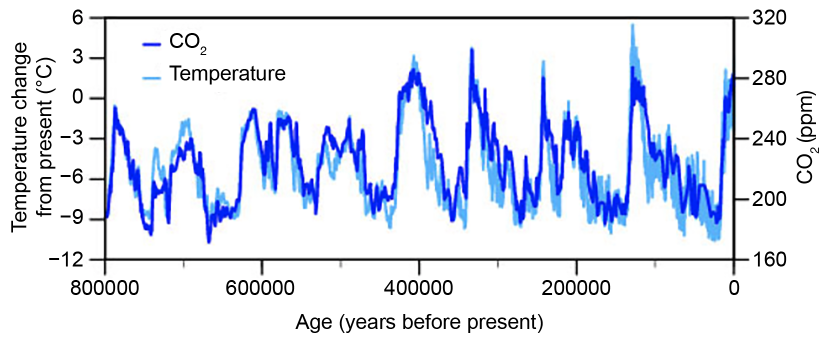
When broadly viewing the paleoclimate record, one clear trend emerges: when the concentration of carbon dioxide in the atmosphere increases, temperature increases along with it—and vice versa. These values may rise and fall over 100,000 year periods, but they do so at similar rates. This trend is consistent with the role of greenhouse gases in climate change.
Temperature change (light blue) and carbon dioxide change (dark blue) measured from the EPICA Dome C ice core in Antarctica. (Jouzel et al. 2007; Luthi et al. 2008).
Carbon dioxide is coupled to temperature in other ways. For instance, warmer temperatures release more carbon from soils and permafrost, warmer oceans absorb less carbon from the atmosphere, and warmer periods prevent the fertilization of marine phytoplankton that can take up excess carbon dioxide.
Paleoclimate data also reveals that climate change is about more than temperature. During times with lowest temperatures, snow lines were lower, continents were drier, and tropical monsoons were weaker. While some of these changes may be independent, some could be tied to changing levels of carbon dioxide. Understanding what changes may occur in the future and to what extent remains a topic of vigorous research.
Paleoclimatic Data for the Last 2,000 Years
Since the 1970s, paleoclimatologists have developed methods for reconstructing temperatures over the last 2,000 years based on a broad range of proxy data types. While some differences between these records may be due to their using diverse statistical methods, they show similar patterns of temperature variability over the last 2,000 years.
These paleoclimate reconstructions reveal three important conclusions:
Temperatures have increased over the last 50 years at an unprecedented rate.
Warmer than average temperatures are more widespread across the Northern Hemisphere since the mid-20th century than in any previous time.
Prior to 1850 CE, there was a millennial-scale cooling trend including a multi-century period with relatively cooler temperatures beginning in the 15th century.
Climate Model Simulations of the Last 1,000 Years
Paleoclimate records indicate that natural climate variations are a result of “forcings,” factors that drive the climate system to change. These forcings include solar and volcanic activity. Some theorize that these forcings are behind global warming, rather than human-caused greenhouse gas emissions. We can test this using another tool: the climate model.
Climate models are computer programs that use physical laws to determine how climate has changed in the past and may change in the future. Models range from simple ones tracking only the most essential processes to complex ones which incorporate additional important interactions between the atmosphere, ocean, sea ice, and land surface. Through modeling studies, researchers have examined the contribution of greenhouse gas concentrations to global warming.
These climate model simulations have revealed that:
Solar and volcanic activities have been responsible for some variations in Northern Hemisphere temperature over the past 1,000 years.
Neither solar nor volcanic forcing can explain the dramatic warming of the 20th century. Natural changes in these forcings would actually have resulted in a small cooling since 1960 under a normal emissions pathway.
Only by adding the human-caused increase in greenhouse gas concentrations are the models able to explain the unprecedented warmth we are experiencing.
Paleoclimate Data Before 2,000 Years Ago
Studying data from well beyond 2,000 years ago, paleoclimatologists have discovered several periods of unusually high warmth. The Mid-Holocene Warm Period, observed about 6,000 years ago, was generally warmer than today during summer in the Northern Hemisphere.
This natural warming was caused by slow changes in the Earth’s orbit, which caused shifts in the amount of solar radiation reaching each latitudinal band of the planet. Changes in the Earth’s orbit also caused warming in the Penultimate Interglacial Period about 125,000 years ago. Based on proxy evidence, the global mean annual surface temperature appeared to be higher than pre-industrial by about 1° to 2°C, but this warming was not uniform across the globe. However, this slowly varying climate forcing mechanism cannot be responsible for warming over the last 100 years.
The Early Eocene Period, about 54 to 48 million years ago, stands out as distinctly warmer than today, particularly at high latitudes. The global surface temperature was 9° to 14°C higher than today, and carbon dioxide levels were very high, between 1,000 to 2,000 parts per million (levels in 2021 were 414.27 parts per million). Scientists think that increased volcanic activity was an important cause of these high levels of carbon dioxide. Model simulations support the hypothesis that carbon dioxide concentrations maintained high temperatures in the early Eocene.
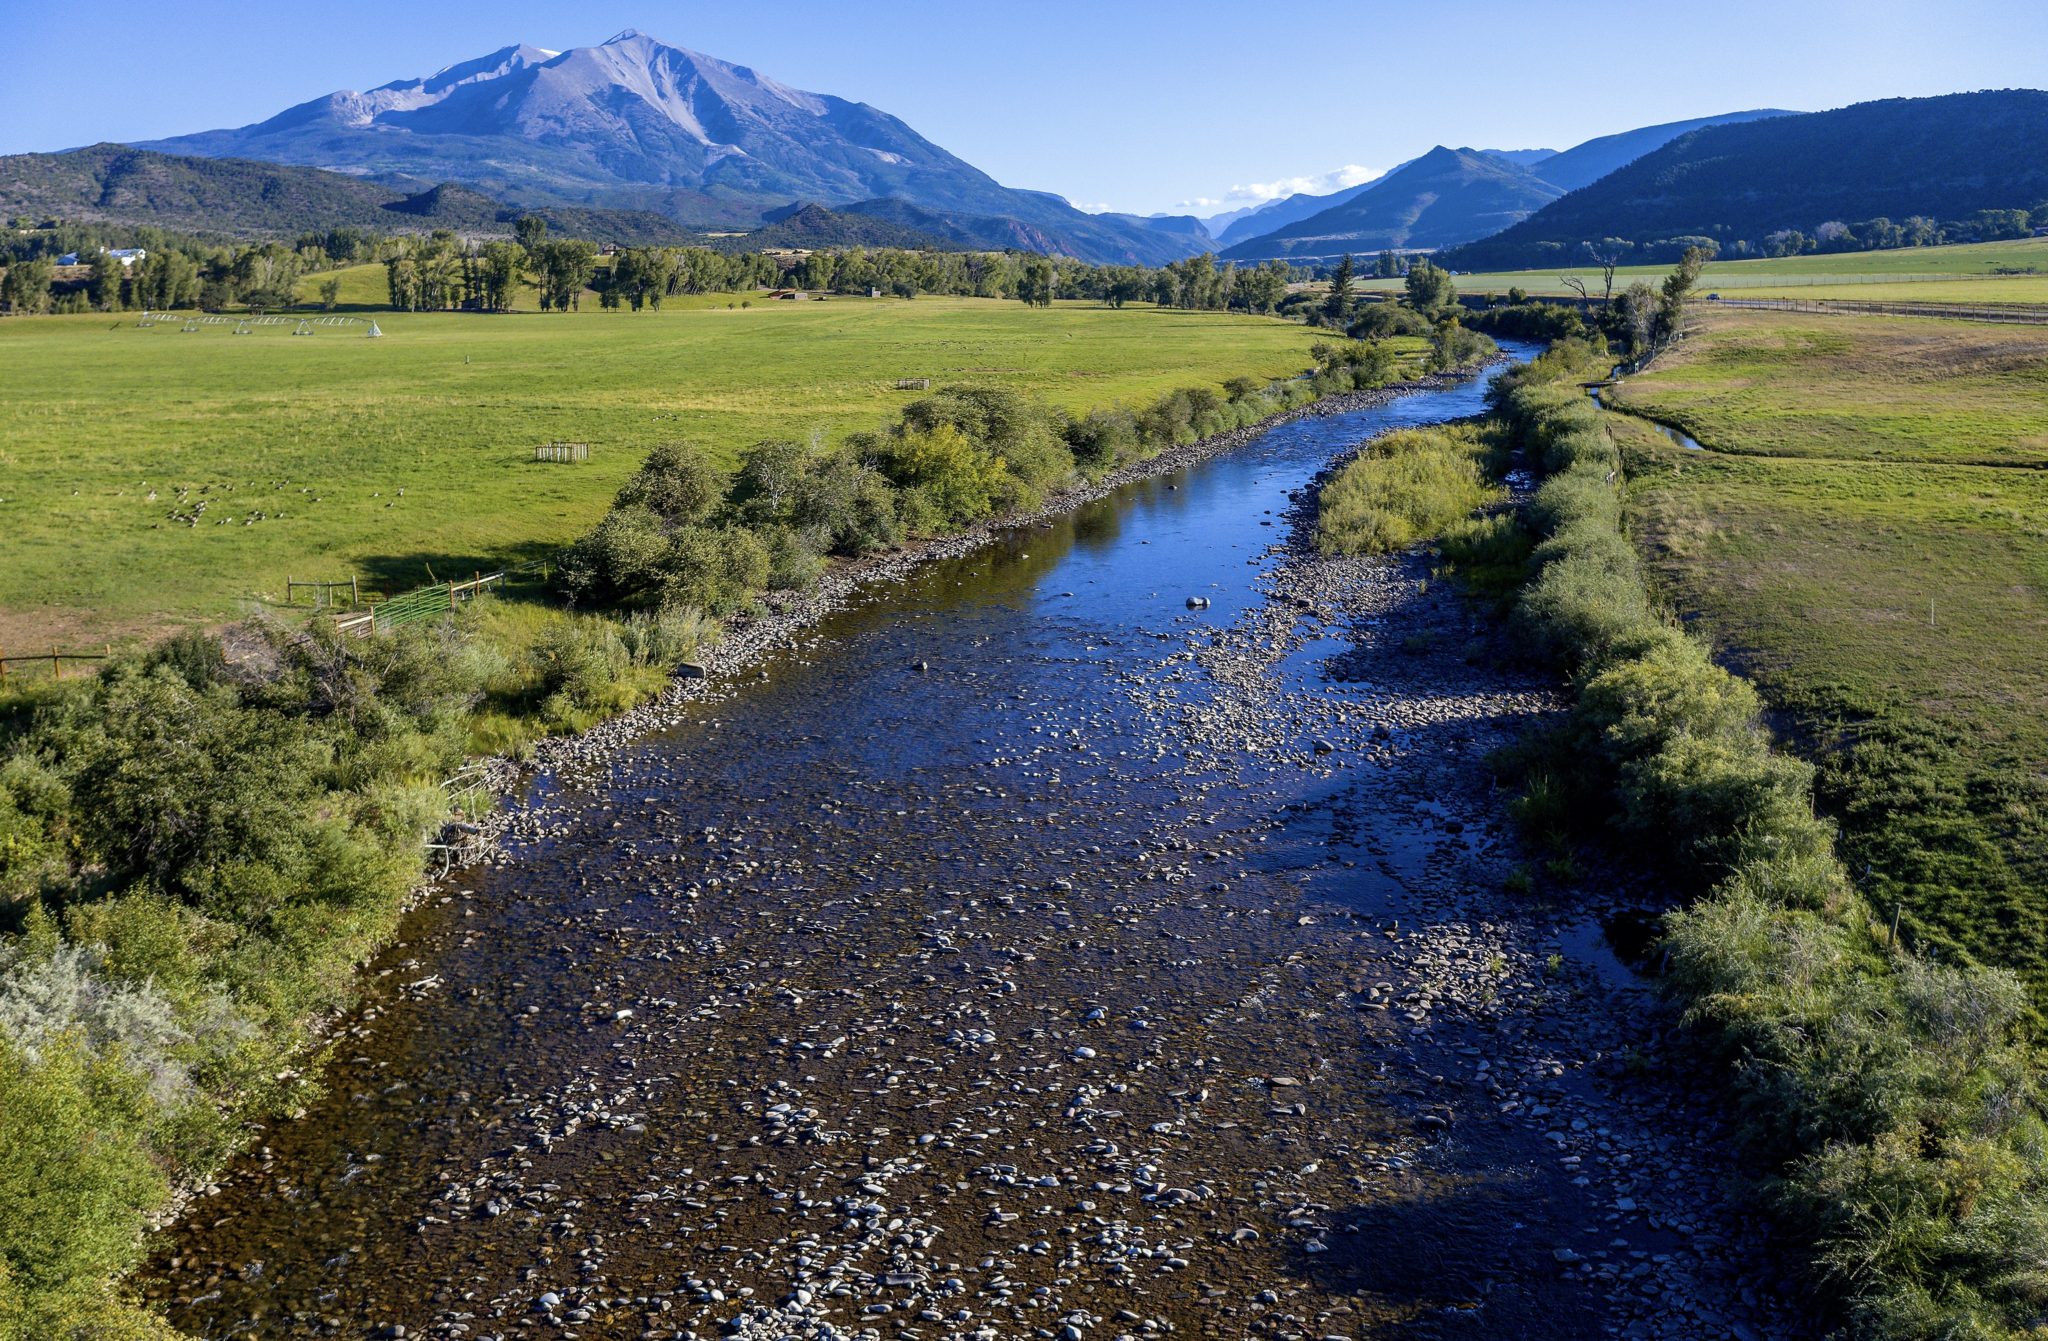
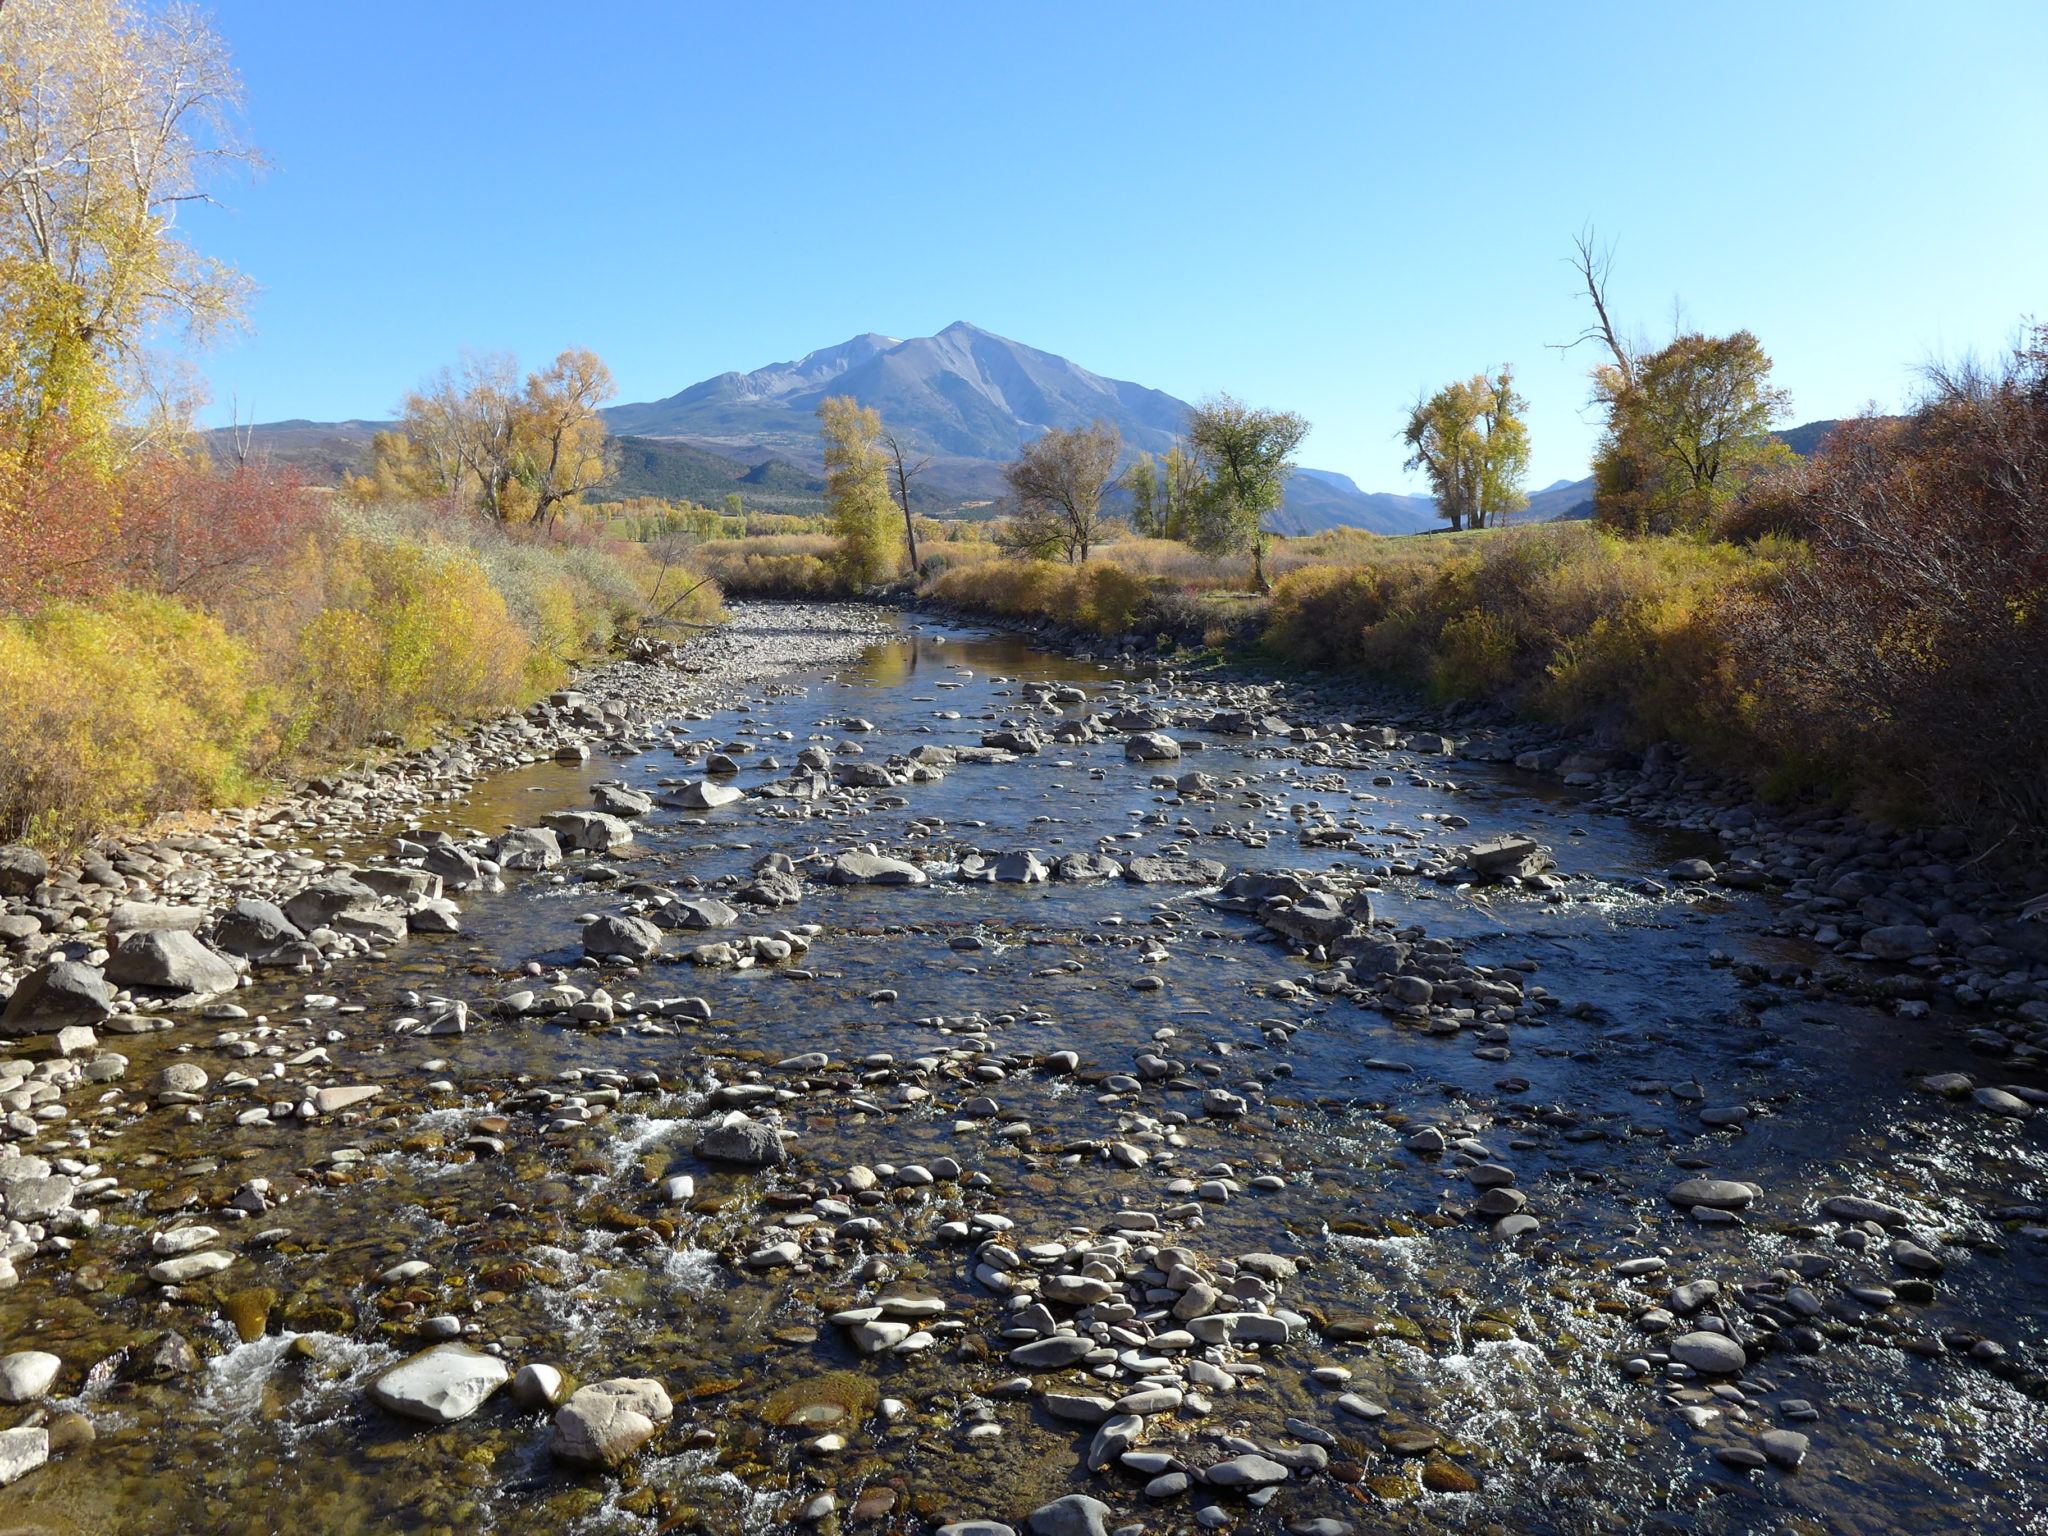
The Crystal River runs low outside of Carbondale on September 1, 2020. With average temperatures warming in summer months by as much as 3.5 degrees since the 1950s in Garfield County, streamflows are trending down as peak runoff comes earlier and more water is sucked up by evaporation and dry soils, stressing available water supplies in late summer and fall. Photo credit: Dan Bayer/Aspen Journalism
A study of a water replacement plan on the Crystal River is looking at nature-based solutions, but experts say some type of storage will also probably need to be built to solve shortages in dry years.
Wendy Ryan, an engineer with Colorado River Engineering who is heading up an analysis of a basin-wide backup water-supply plan, gave a progress update at the Colorado Basin Roundtable meeting this week. The study was funded largely by a state grant and undertaken by the Colorado River Water Conservation District and the West Divide Conservancy District.
“We have a couple landowners near Marble we are working with to see if we can put storage supplies on their properties,” Ryan said in response to a question asking her what solutions she had found. “We don’t have any shovel-ready projects. We did a lot of work upfront, and now it’s simply trying to find what we can build.”
During the hot, dry summer of 2018, the Ella Ditch, which pulls water from the Crystal River and irrigates hayfields south of Carbondale, placed a call for the first time. That means the Ella Ditch wasn’t getting the full amount to which it is entitled and upstream junior water users had to stop taking water so that the Ella could get its full amount.
The Ella Ditch has water rights that date to 1902, and any water rights younger than that — including those held by the town of Carbondale, the Marble Water Company and several residential subdivisions along the Crystal River — were technically supposed to be shut off under a strict administration of the river by the state Division of Water Resources. Under Colorado’s system of water law known as prior appropriation, those with the oldest water rights have first use of the river.
Most junior water rights holders have what’s known as an augmentation plan, which allows them to continue using water during a call by releasing water from a backup source, such as a nearby reservoir. The problem on the Crystal is that several of these residential subdivisions don’t have an augmentation plan.
Engineers from Division 5 of the Colorado Division of Water Resources have said that if water users work together to find solutions and come up with an augmentation plan, they won’t shut off indoor residential water use if the call happens again. Outdoor watering could still be shut off.
The first phase of the study, which River District representatives presented to Pitkin County commissioners in June 2021, was a demand quantification, which put numbers on the amount of water needed at different times of year.
Engineers found 90 structures — many of them wells for in-house water use — that take water from the river system and which would need to be included in the augmentation plan. These structures deliver water to 197 homes; 80 service connections in Marble; about 23 irrigated acres; Beaver Lake and Orlosky Reservoir in Marble; 16,925 square-feet of commercial space; and livestock.
In order for these water users to keep taking water during a downstream call by an irrigator, they would have to replace about 113 acre-feet in the Crystal River per year. (An acre-foot is the amount of water needed to cover an acre of land to a depth of 1 foot and can typically meet the annual needs of one or two families.) The amount of extra flow that would need to be added to the river is small — just .58 cubic feet per second during July, the peak replacement month.
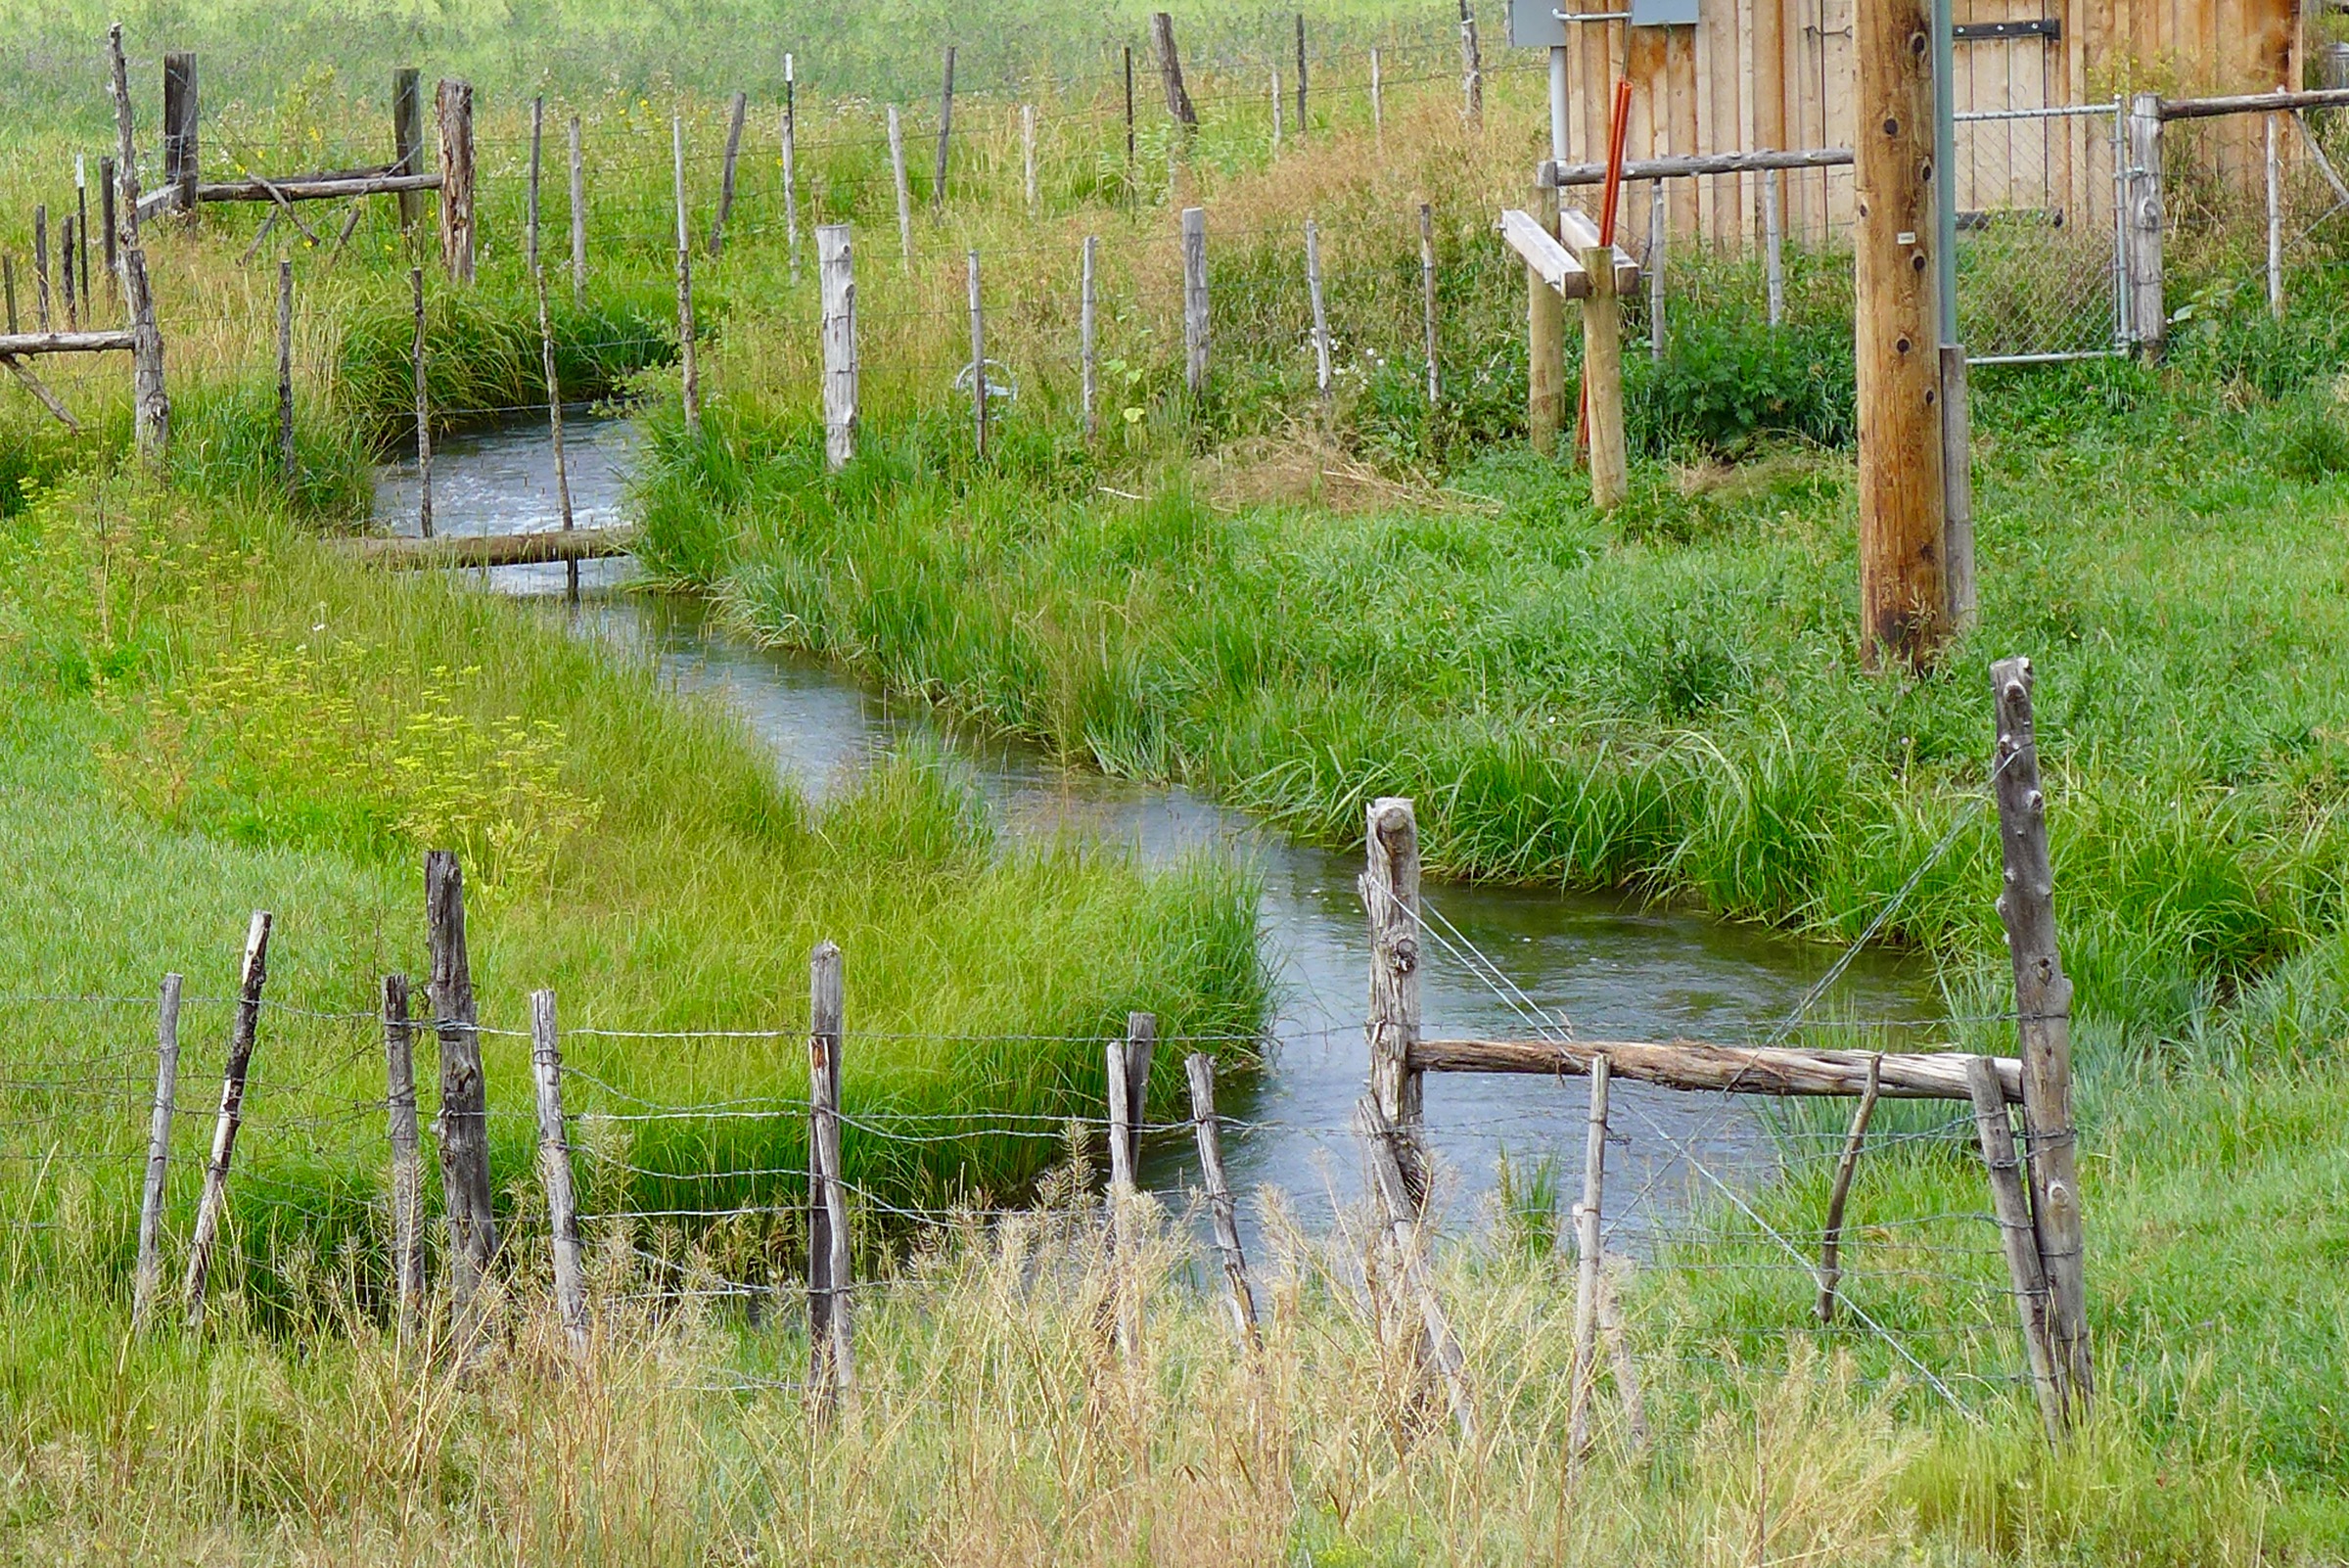
The Ella Ditch, in the Crystal River Valley, placed a call for the first time ever during the drought-stricken summer of 2018. That meant the Town of Carbondale had to borrow water from the East Mesa Ditch under an emergency water supply plan. Photo credit: Brent Gardner-Smith/Aspen Journalism
Wild & Scenic jeopardized?
Ryan and staff from the River District have said they are not considering storage on the mainstem of the Crystal River, which could jeopardize a federal Wild & Scenic designation, a long-sought-after goal of Pitkin County, local environmental groups and some residents. A Wild & Scenic standing would mean no dams or out-of-basin diversions.
“We were never going to consider any mainstem storage on the Crystal River,” Ryan said. “We don’t want to do anything to jeopardize that potential designation on the Crystal, and what we are looking at shouldn’t.”
But Pitkin County Commissioner Kelly McNicholas Kury said it’s hard to see how upstream storage and a Wild & Scenic designation won’t conflict.
“It troubles me to hear the engineers say it’s hard to envision a solution that doesn’t involve storage,” she said. “So that’s just a red flag. It’s always been a red flag for Pitkin County.”
McNicholas Kury and two other roundtable members voted in 2019 against funding the study unless storage was off the table.
The Crystal River at the fish hatchery just south of Carbondale was running at about 10 cubic feet per second on Oct. 13, 2020, much lower than the state’s instream flow standard of 60 cfs. Rivers in the Roaring Fork watershed have seen below-average streamflows in water year 2020, which ended Oct. 1, despite a slightly above-average snowpack. Dry soil conditions threaten to bring a similar scenario in water year 2021. Photo credit: Heather Sackett/Aspen Journalism
Nature-based solutions
A parallel study, undertaken by the River District and environmental-and-recreation advocacy group American Rivers, is looking at nature-based solutions. The idea is that by keeping water on the landscape higher in the basin, it could recharge aquifers and boost river flows in late summer.
“We have been analyzing whether the reconnection of floodplains can assist with aquifer recharge and natural water storage while also improving the resilience of watersheds and potentially contributing to later-season flows,” said Fay Hartman, American Rivers conservation director for the Southwest region.
According to Zane Kessler, the River District’s director of government relations, there are four potential areas for nature-based projects: the Coal Basin area; Avalanche Creek upstream of its confluence with the Crystal; the Janeway area, downstream of the confluence of Avalanche Creek and the Crystal; and the confluence of Thompson Creek and the Crystal. But none of the sites are perfect, Kessler said.
“The River District and American Rivers are partners in this effort investigating whether turning back the clock on past alterations that have degraded the Crystal River can help recapture some of the climate resilience we have lost,” he said. “Improving the storage in floodplains and wetlands I think we see as an innovative and lower-impact approach to meeting late-season water needs than dams or storage in the headwaters.”
Findings and recommendations from the nature-based solutions analysis are expected by the end of the month. But Ryan said some kind of storage is still needed because nature-based solutions will still not be enough to meet the supply-demand gap in dry years, according to her analysis.
“It might meet a portion of our demands, but it’s not going to meet all our demands,” she said.
Twenty-two sanitary pads, panty liners and incontinence pads have detectable levels of fluorine, an indicator of the group of chemicals known as PFAS, according to a new report from Mamavation.
Partnering with EHN.org, the environmental wellness blog and community had 46 pads products tested by a U.S.-Environmental-Protection-Agency-certified lab and found levels of fluorine ranging from 11 parts per million, or ppm, to 154 ppm in 22 of the brands, including 13 advertised as “organic,” “natural,” “non-toxic,” “sustainable” or using “no harmful chemicals.”
Fluorine is a strong indicator of “forever chemicals”— which have been linked to everything from cancer to birth defects to lower vaccine effectiveness.
EHN.org partially funded the testing and Pete Myers, chief scientist of Environmental Health Sciences, which publishes Environmental Health News, reviewed the findings. The report comes just a month after Mamavation found PFAS evidence in popular tampon brands. A past investigation also looked at PFAS indicators in period underwear and found 11 of 17 tested pairs had detectable levels of fluorine.
But it’s not just feminine care products — earlier this year an EHN.org investigation on PFAS found the chemicals in foods, sports clothes, makeup and other products.
While the health impacts of PFAS exposure via skin contact are still somewhat unclear, Linda S. Birnbaum, scientist emeritus and former director of the National Institute of Environmental Health Sciences and National Toxicology Program, told Mamavation “Dermal exposure to PFAS from your menstrual products can be a big problem. Because vaginal skin is so vascular, we can anticipate the internal exposure could be a bit worse. This is a category of products that should NOT have any detectable fluorine.”
Why is fluorine in sanitary products?
It’s not clear how fluorine ends up in sanitary products. However, it’s possibly from trying to achieve moisture-wicking fabric, as PFAS are stain- and water-resistant. Or the contamination could be unintended via lubricants used in production, or manufacturers omitting data on — or simply not knowing — the raw materials.
The testing is part of an ongoing effort by Mamavation and EHN.org to identify PFAS in common consumer products. Follow our PFAS testing project with Mamavationat the series landing page.
San Luis garden. Photo credit: The Alamosa Citizen
Click the link to read the article on the Rocky Mountain PBS website (Sonia Gutierrez, Julio Sandoval). Here’s an excerpt:
The Colorado Department of Agriculture is aiming to address the disadvantages people like [Roberto] Meza face with a pilot lending program. Meza specializes in micro-greens. He says banks didn’t know much about the economics or profitability of said market, so they were denied loans.
“It was really, really hard for us to gain funding as first-time entrepreneurs who had very little collateral and very little business experience,” explained Meza.
To address this need, the Colorado Department of Agriculture launched their first-ever revolving loan program. Colorado’s Commissioner of Agriculture, Kate Greenberg, said the program is a $30 million fund that came out of the state’s recovery efforts. “So, over the last two years Colorado has been successful in getting $96 million for Colorado agriculture. This is a part of that package,” she said. Greenberg said the intention is for the program to live on well beyond this initial loan fund. “As we lend money and get dollars paid back through those loans, we’ll be able to initiate more loans in the future.” This program is meant to be financially inclusive. It targets people in agriculture who have historically been left out of conventional lending…
This loan can be used for conservation efforts, equipment investments and processors. “We also have terms around re-payment schedules,” explained Greenberg. “Knowing that the cashflow bottlenecks within agriculture can make it very difficult to have monthly payments. Because often times during harvest is when you’ll get your cash.”
Greenberg also said the program was perfect for families who want to continue the traditions of farming.
Many of the companies promising “net-zero” emissions to protect the climate are relying on vast swaths of forests and what are known as carbon offsets to meet that goal.
On paper, carbon offsets appear to balance out a company’s carbon emissions: The company pays to protect trees, which absorb carbon dioxide from the air. The company can then claim the absorbed carbon dioxide as an offset that reduces its net impact on the climate.
However, our new satellite analysis reveals what researchers have suspected for years: Forest offsets might not actually be doing much for the climate.
When we looked at satellite tracking of carbon levels and logging activity in California forests, we found that carbon isn’t increasing in the state’s 37 offset project sites any more than in other areas, and timber companies aren’t logging less than they did before.
The findings send a pretty grim message about efforts to control climate change, and they add to a growing list of concerns about forest offsets. Studies have already shown that projects are often overcredited at the beginning and might not last as long as expected. In this case we’re finding a bigger issue: a lack of real climate benefit over the 10 years of the program so far.
But we also see ways to fix the problem.
How forest carbon offsets work
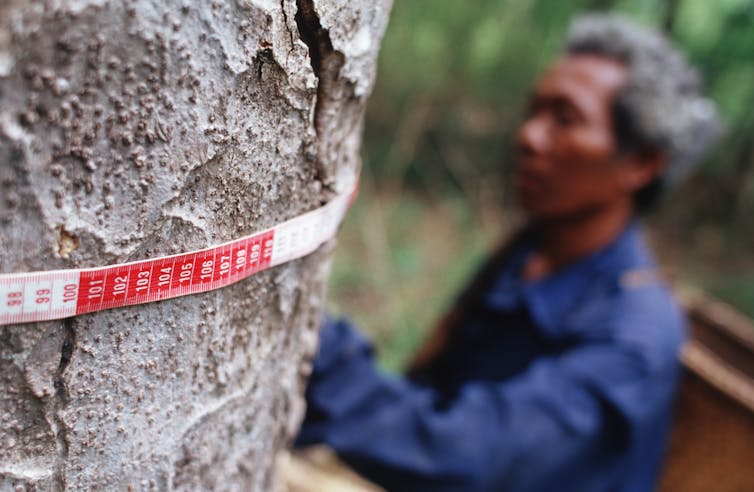
Forest carbon offsets work like this: Trees capture carbon dioxide from the air and use it to build mass, effectively locking the carbon away in their wood for the life of the tree.
In California, landowners can receive carbon credits for keeping carbon stocks above a minimum required “baseline” level. Third-party verifiers help the landowners take inventory by manually measuring a sample of trees. So far, this process has only involved measuring carbon levels relative to baseline and has not leveraged the emerging satellite technologies that we explored.
Forest owners can then sell the carbon credits to private companies, with the idea that they have protected trees that would otherwise be cut down. These include large oil and gas companies that use offsets to meet up to 8% of their state-mandated reductions in emissions.
It’s clear that offsets are playing a large and growing role in climate policy, from the individual to the international level. In our view, they need to be backed by the best available science.
Satellites offer a more complete record than on-the-ground reports collected at offset projects. That allowed us to assess all of California since 1986.
Using satellite data, we can track carbon changes and harvest rates in offset projects (red) compared with other private forests (black and gray). The highlighted example project started in 2014 (dashed vertical line). Adapted from Coffield et al., 2022, Global Change Biology
Carbon isn’t being added to these projects faster than before the projects began or faster than in non-offset areas.
Many of the projects are owned and operated by large timber companies, which manage to meet requirements for offset credits by keeping carbon above the minimum baseline level. However, these lands have been heavily harvested and continue to be harvested.
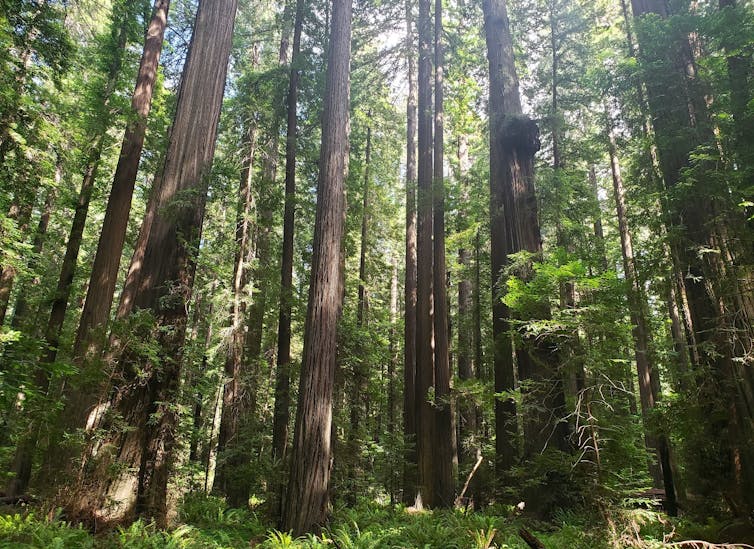
In some regions, projects are being put on lands with lower-value tree species that aren’t at risk from logging. For example, at one large timber company in the redwood forests of northwestern California, the offset project is only 4% redwood, compared with 25% redwood on the rest of the company’s property. Instead, the offset project’s area is overgrown with tanoak, which is not marketable timber and doesn’t need to be protected from logging.
Our research points to a set of recommendations for California to improve its offsets protocols.
One recommendation is to begin using satellite data to monitor forests and confirm that they are indeed being managed to protect or store more carbon. For example, it could help foresters create more realistic baselines to compare offsets against. Publicly available satellite data is improving and can help make carbon offsetting more transparent and reliable.
California can also avoid putting offset projects on lands that are already being conserved. We found several projects owned by conservation groups on land that already had low harvest rates.
Additionally, California could improve its offset contract protocols to make sure landowners can’t withdraw from an offset program in the future and cut down those trees. Currently there is a penalty for doing so, but it might not be high enough. Landowners may be able to begin a project, receive a huge profit from the initial credits, cut down the trees in 20 to 30 years, pay back their credits plus penalty, and still come out ahead if inflation exceeds the liability.
Ironically, while intended to help mitigate climate change, forest offsets are also vulnerable to it – particularly in wildfire-prone California. Research suggests that California is hugely underestimating the climate risks to forest offset projects in the state.
The state protocol requires only 2% or 4% of carbon credits be set aside in an insurance pool against wildfires, even though multiple projects have been damaged by recent fires. When wildfires occur, the lost carbon can be accounted for by the insurance pool. However, the pool may soon be depleted as yearly burned area increases in a warming climate. The insurance pool must be large enough to cover the worsening droughts, wildfires and disease and beetle infestations.
Considering our findings around the challenges of forest carbon offsets, focusing on other options, such as investing in solar and electrification projects in low-income urban areas, may provide more cost-effective, reliable and just outcomes.
Without improvements to the current system, we may be underestimating our net emissions, contributing to the profits of large emitters and landowners and distracting from the real solutions of transitioning to a clean-energy economy.