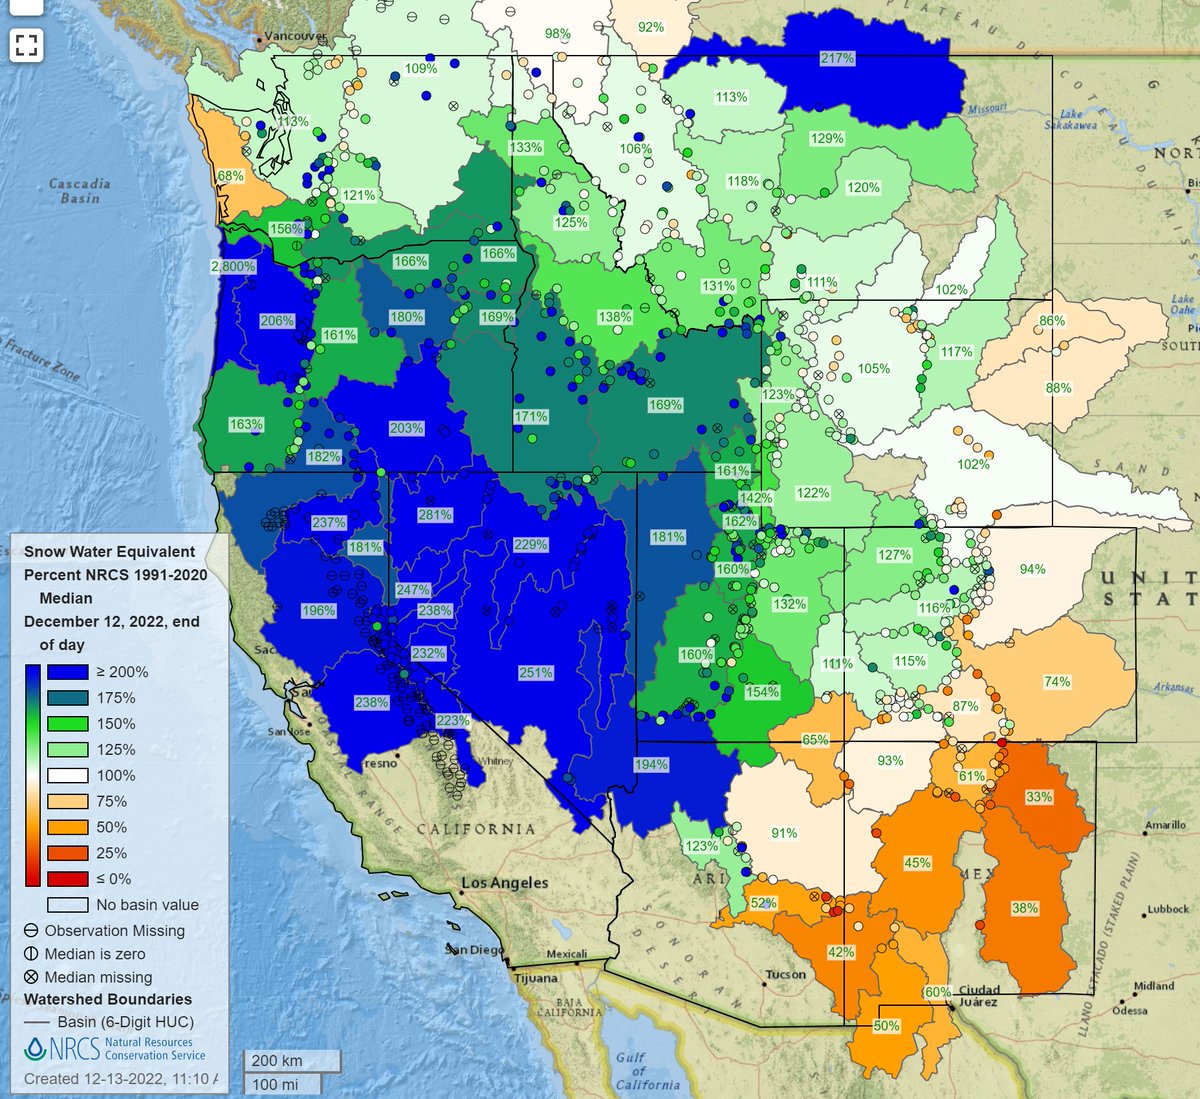
The #snowpack is ample for many parts of the West, but some areas, like #NewMexico and parts of #Arizona and #Colorado, could use more — @DroughtDenise #CRWUA2022

Click the link to read the article on the American Rivers website (Sinjin Eberle):
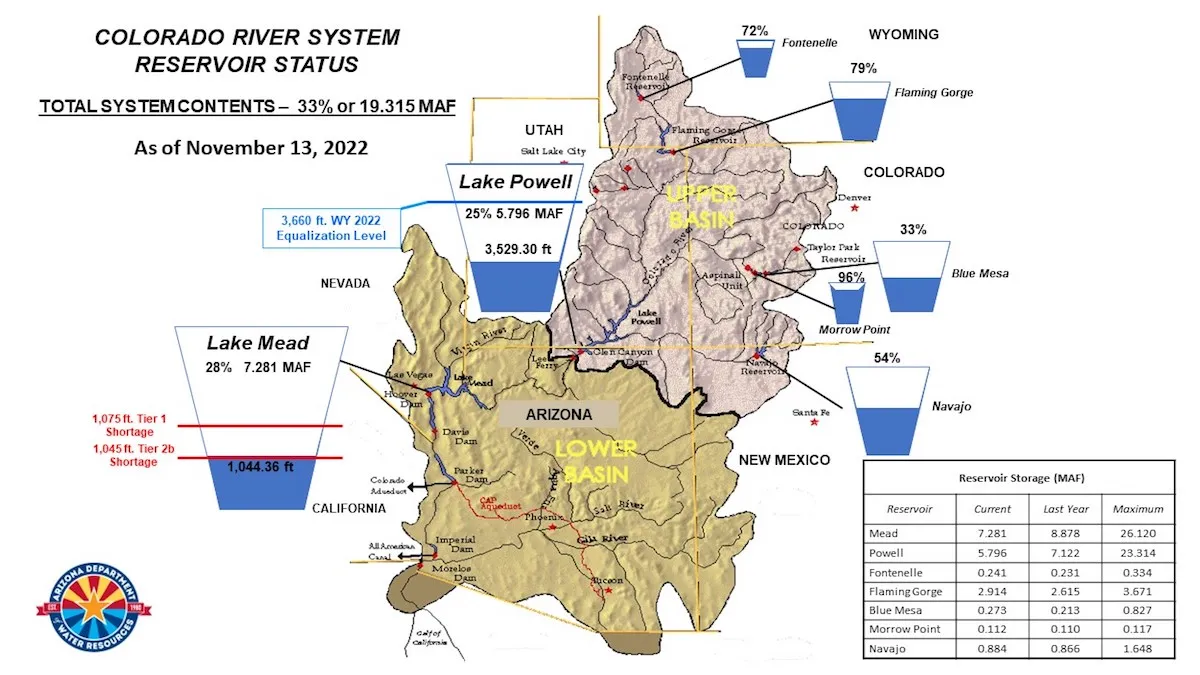
The situation on the Colorado River continues to get worse. For months, there has been abundant news about falling lake levels (Lake Powell is below 25% full, and Lake Mead is hovering below 30% full) and while some areas of the west had a terrific monsoon, other areas were left high and dry. Now consider a forecasted La Nina winter (could be the third in a row,) which generally features a warmer and dryer season and reduced snowpack throughout the West, including the Rockies; the confluence of a grim water year is staring at us in the face.

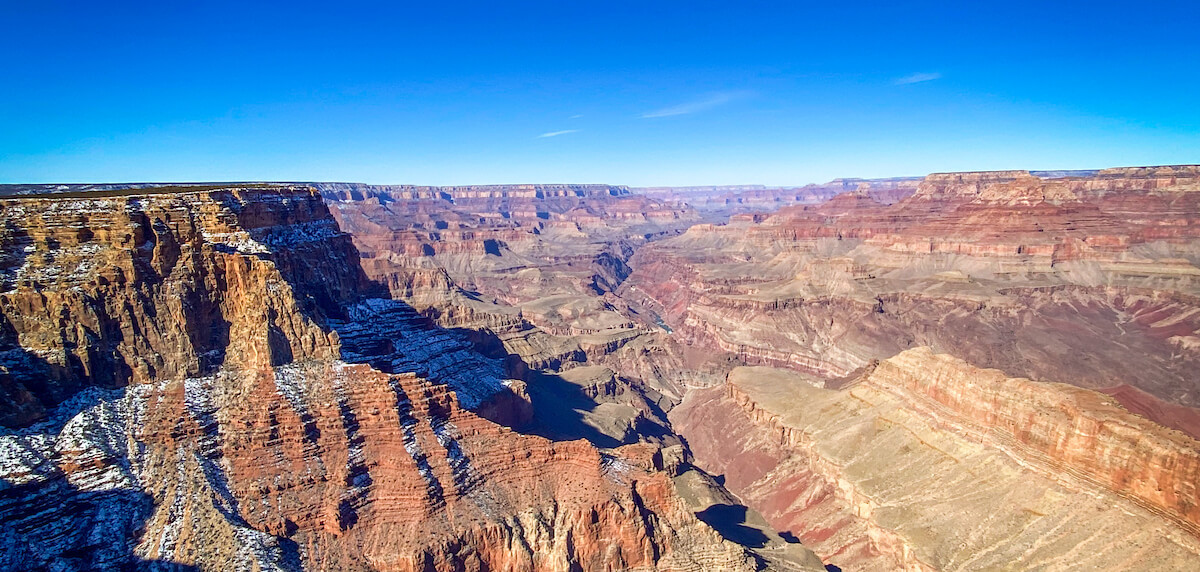
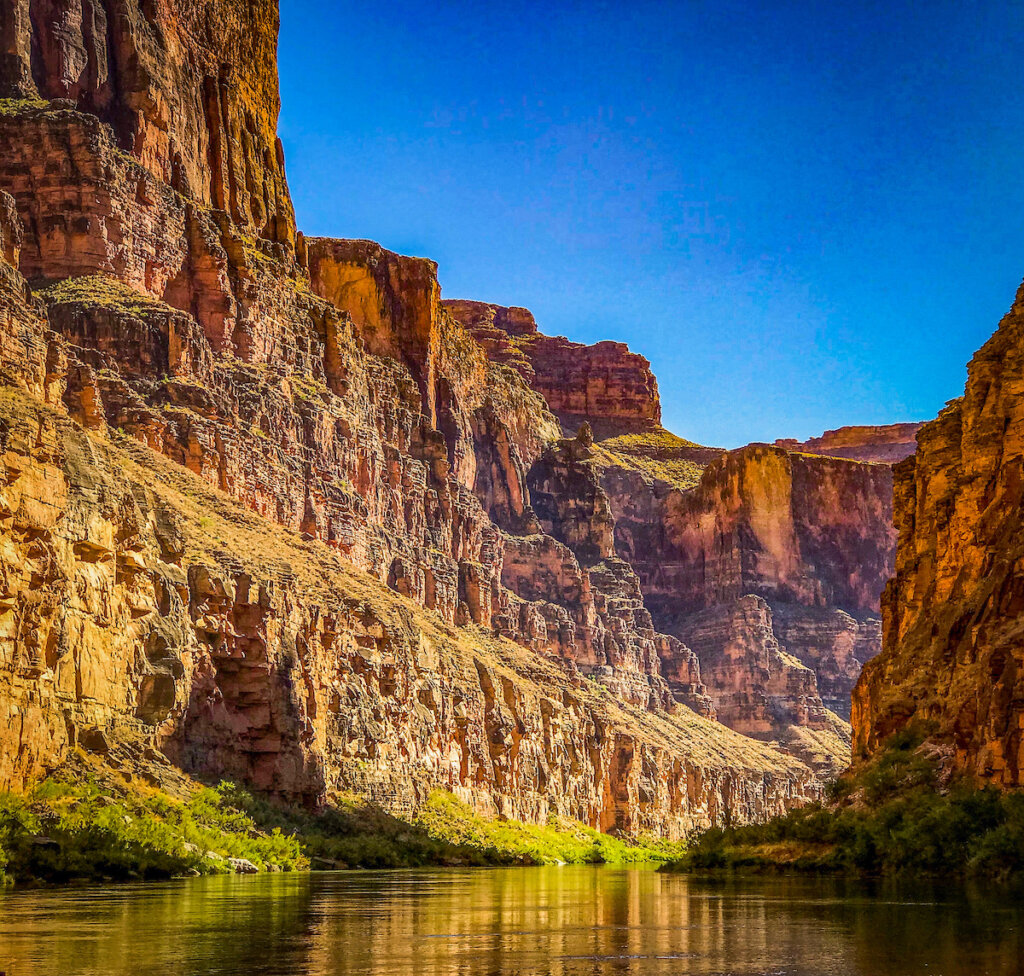
Without being overly melodramatic, the reality is that unless some serious decisions are made, and fast, we could be facing the difficult reality of very little to no water being able to pass through Glen Canyon Dam, in essence creating a Grand Canyon without the guarantee of a flowing Colorado River. For anyone who has been on the river, whether on a raft trip or hiking to Phantom Ranch or trout fishing at Lee’s Ferry, this is a frightening vision. But what would someone who simply peers over the edge of the Canyon at the South Rim, enjoying the expanse and color and light of the distant rocks and buttes – does it matter to them that the small, silver ribbon in the distance is actually dry, rather than wet? Does it matter to people that the very thing that helped create, and certainly supports the web of life, culture, and connection of one of the grandest landscapes in the world, could be reduced to a mere trickle if we don’t take action – and soon? Are we ok with that scenario?
Let’s review what all this means in a practical sense. You may know that the Bureau of Reclamation, the Federal government agency that oversees/manages many of these big reservoirs and the Colorado River system overall, publishes a set of forecasts periodically to try to “project” what lake levels might be – usually up to two years into the future. These are called “24-month studies” and they take scores of different scenarios into account to forecast where the lake levels might be given varying amounts of runoff, soil moisture, snowpack, different temperature possibilities, and how much water is being used in different places across the entire basin. This all feeds into planning how much water needs to be stored, or how much can be released and when, for Lake Powell, Grand Canyon, and Lake Mead, among other federal facilities within the system. These predictions impact millions of people across the Southwest, and across the country when we start to consider that the vast majority of vegetables grown for our winter food supply rely on Colorado River water.
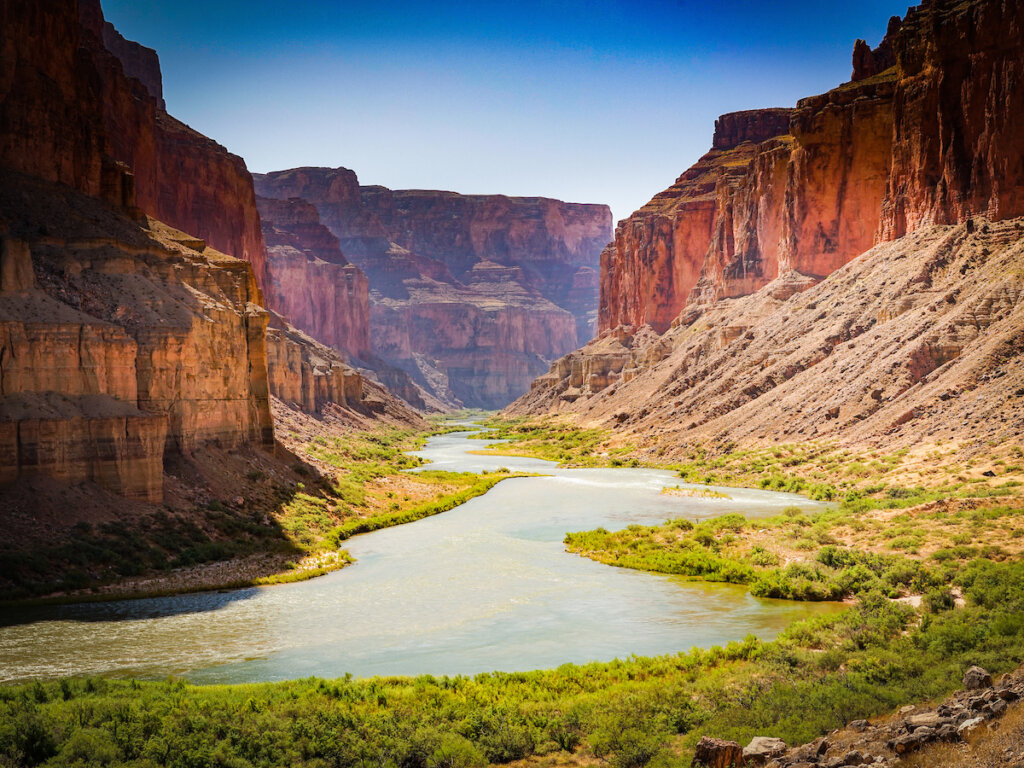
On average, about 8 million acre-feet of water (just one acre-foot is a football field of water, one foot deep, or just over 326,000 gallons) flows from Lake Powell to Grand Canyon in a normal year. But what happens if that number is drastically reduced, or water can’t safely flow through the dam at all? What happens then? Already this year, nearly a million-acre feet has both been sent downstream (from storage in Wyoming’s Flaming Gorge Reservoir) and held back in Lake Powell to slow the fall of the lake. Right now, there is only about 7 million acre-feet flowing into the Canyon in 2022. But levels are still declining, and we are getting closer to the point where Glen Canyon Dam cannot generate electricity, and potentially even worse, where water really can’t safely flow through the dam at all. What if those flows ultimately consisted of about 10% of what flows today – and all from seepage and springs dotting the length of the canyon itself?

Now back to the most recent 24-month study, where Reclamation projects through what they call the “minimum, most, and maximum probable” hydrology projections. For the first time in the history of these projections, the minimum probable projection indicates that Lake Powell could decline to a level where no electricity can be generated (below elevation 3,490ft) by as early as December of 2023. But that says nothing about the efficiency of that power, since the lower the lake gets, the weaker the power generation capability is.
Below that, water would need to be released through tubes that have never been tested for sustained use. Limited space exists where water can still flow through the dam, supplying water to Grand Canyon and Lake Mead, but not generating any power. Overall, this space is only 120 feet, then the lake would be at “dead pool” (at elevation 3,370 ft.) which is in essence exactly how it sounds – a pool of water not flowing through the dam at all.)
So how much more water needs to be held back in order to keep Lake Powell on life support? John Fleck, Eric Kuhn, and Jack Schmidt contemplate that very question as they set forth the rationale for doing keeping Lake Powell functional in an article they authored last week. We know that the Federal government has emphatically said that they will protect “critical infrastructure” which means Glen Canyon Dam and both the hydropower and water supply systems that depend upon it. We also know that there are many rules that dictate how this whole system is managed. The Colorado River community is comprised of 7 states, as well as the Republic of Mexico and the Department of Interior, along with stakeholders that include municipalities, irrigators, hydropower customers, recreationalists, and environmentalists. Each hold varying interests in different parts of the Basin, but all must find a way to participate as a whole within the Basin that sustains us all. Critical to considering the Basin going forward also requires recognition of the 30 Federally recognized Tribal nations which have long been left out of the decision-making process around the river. Their rights and role as it relates to the river can no longer be overlooked. Their opportunities to participate are gaining and they should be even more deeply included in decisions going forward. In short, nobody can go it alone, and everyone needs water security and predictability to plan for the future.
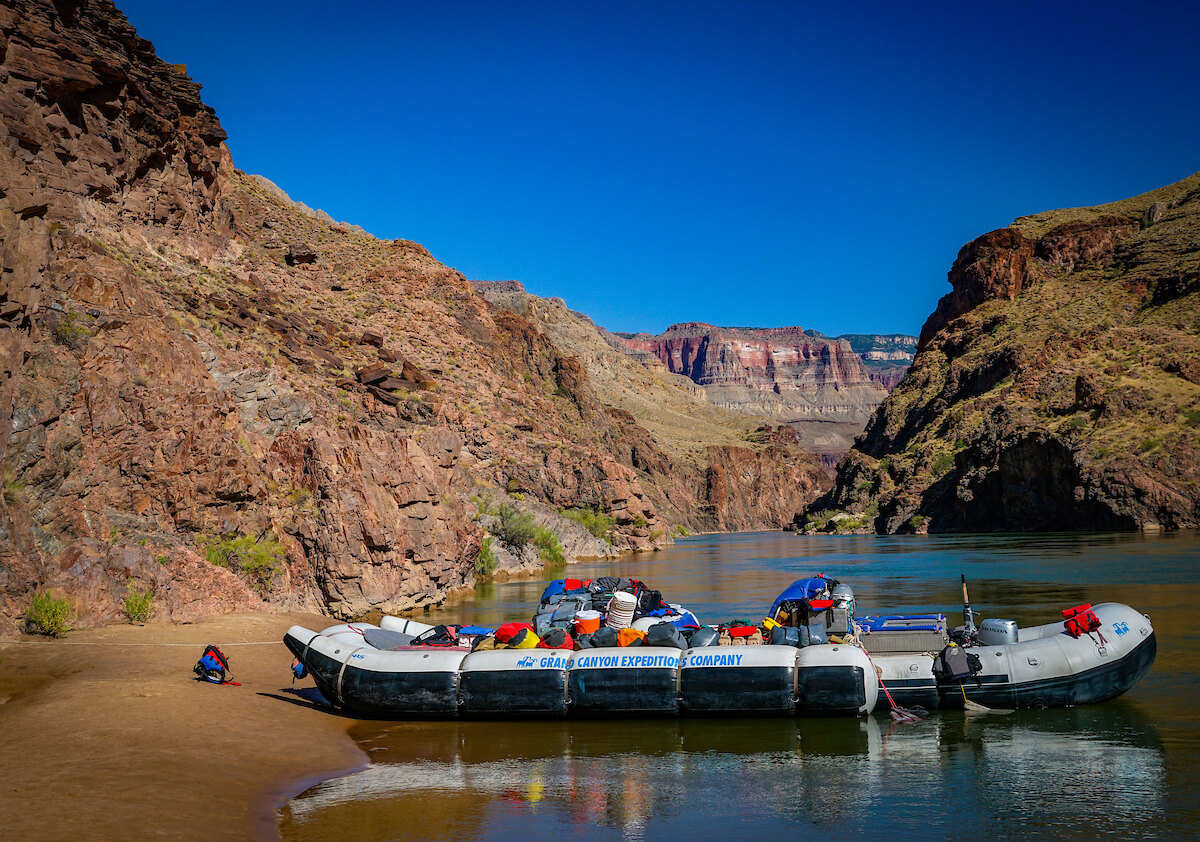
Fleck, Kuhn, and Schmidt argue that now might be the time for Reclamation to impose a restricted flow through the dam of only 5.5MAF – ~ 30% less than “normal” flows and still another 13% less water than is flowing into Grand Canyon today. And last week, the Bureau of Reclamation proposed “Moving forward with administrative actions needed to authorize a reduction of Glen Canyon Dam releases below seven million acre-feet per year, if needed, to protect critical infrastructure at Glen Canyon Dam.” This proposal would attempt to keep at least some water flowing through the hydropower turbines (and further lower the levels at Lake Mead) but would keep electricity flowing in both. But what impact would this have on the Grand Canyon ecosystem, including the four species of native fish, the coldwater fishery above Lee’s Ferry, and the amazing diversity of plant, animal, and bird life throughout the Canyon? What would happen to the vibrant and sought-after rafting industry, which between both private and commercial trips, ferry’s more than 26,000 people per year through one of the most amazing, humbling, and majestic landscapes on earth? And maybe most importantly, where does this leave the cultural and spiritual considerations that water flowing through the Canyon has for the various Tribal communities that consider the Colorado River and Grand Canyon sacred places – essential to their way of life?
Can everyone come together with a solution to at least hold the river and the two reservoirs it feeds to a level that would at least triage the situation? If not, what then? While hypothetical, we need to recognize that a nearly dry or severely depleted Grand Canyon in a few short years is more plausible than ever. For anyone who has ever done a river trip leaving at Lee’s Ferry, you know that the Paria River comes in just a mile or so below the put-in, but that is a highly unpredictable river – often either pretty small or nearly dry much of the year, or a raging torrent during the monsoon season. The next “reliable” water coming into the Canyon is at the Little Colorado River, 75 miles from the dam – and 75 miles is a long way when there is so much riding on the health and sustainability of this ecosystem. Some water from seepage around the dam does occur, but with lowering lake levels, does that seepage get reduced as well? So many unknowns are staring us all in the face.

The upshot is that this is a scary time in the Colorado River system, with many options to consider – rules and laws, and treaties to follow (or change) and lots of people depending on getting it right. And increasingly important in all this, is that getting it right means getting it right together – the possibility of litigation or other legal action would define the worst-case scenario, as any opportunity for compromise and collaboration and finding solutions together instantly stops the minute the first lawsuit is filed.
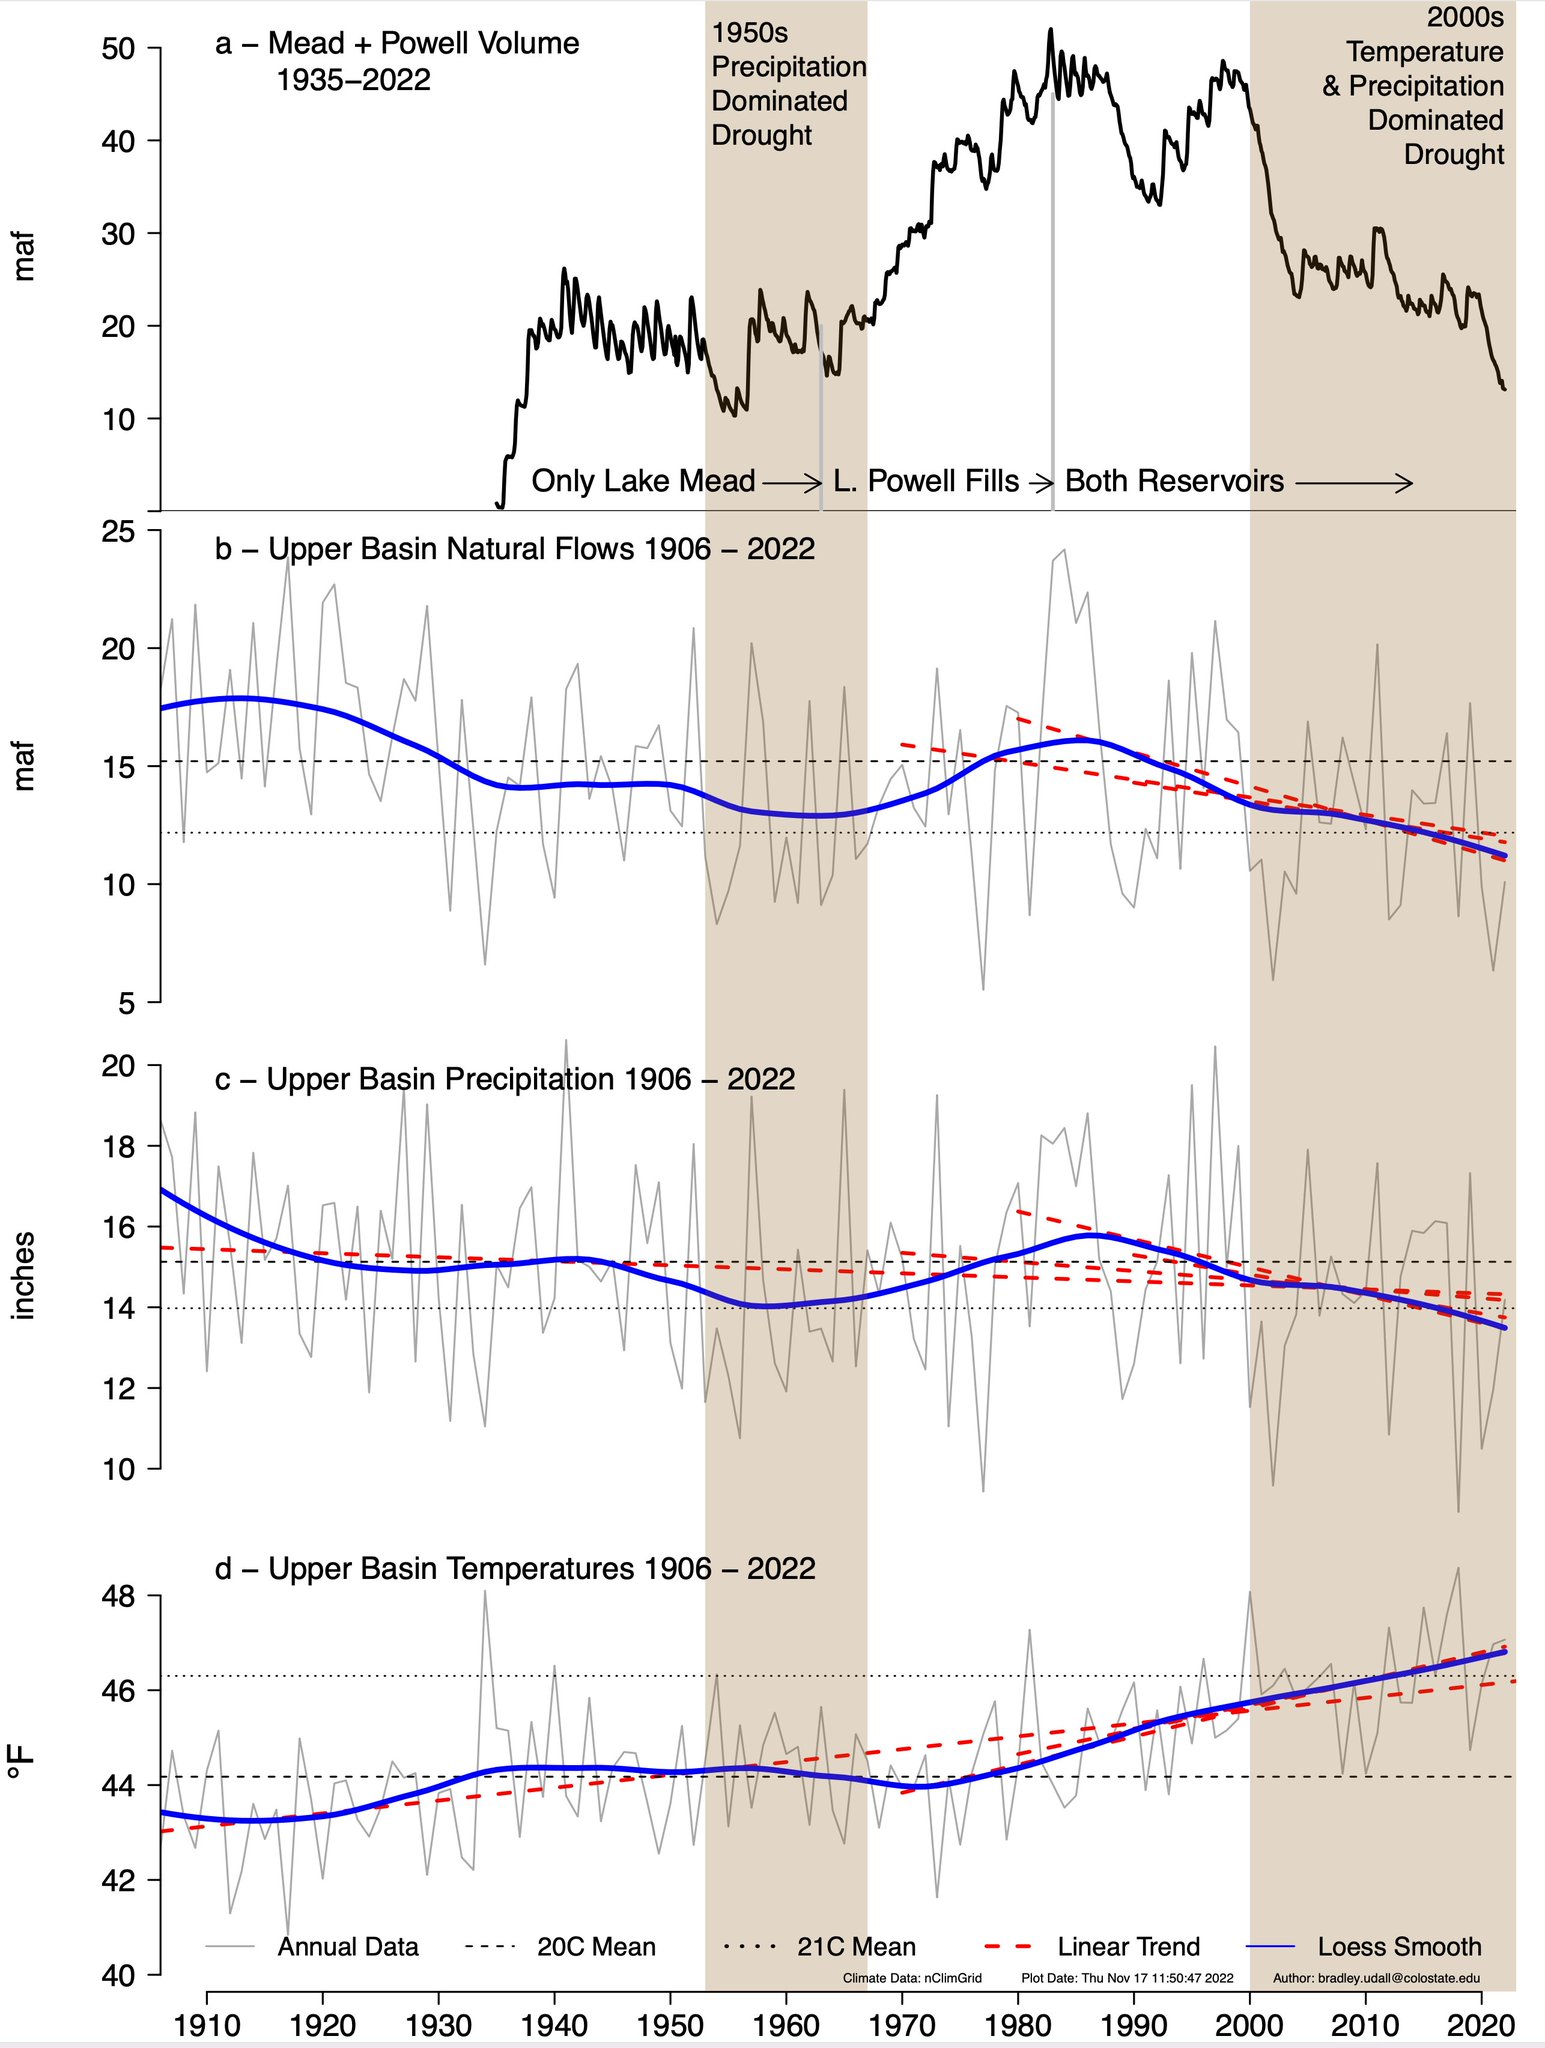
The 22-year drought and its associated aridification of soils and plants, the exposure of more than 40 million people to water shortage, the whole country being impacted by the potential of reduced food production, and in the middle of all this, one of the seven wonders of the world and the ecosystem, and people, who are deeply connected to this place. Where do we go from here?
Click the link to read the article on the ENSO blog website (Emily Becker):
As our regular readers will be very aware, La Niña has been rolling along in the tropical Pacific for many months, and our third La Niña winter in a row is under way. La Niña is the cool phase of the El Niño-Southern Oscillation (“ENSO” for short) climate pattern. The current forecast is for La Niña to continue into the winter, with 50-50 chances for La Niña and neutral in the January–March average.
Conditions in the tropical Pacific ocean-atmosphere system have been consistent with La Niña for long enough that, in November, one of our frequent readers commented—accurately—that they might as well have just re-read the October post! However, while La Niña seems stuck in a rut right now, the last thing we want is to give the impression that ENSO is boring! So this month, I’ll do a quick recap of current conditions before looking into a question I’ve been curious about for a while now: how does ENSO affect daily temperatures during winter?
Current events
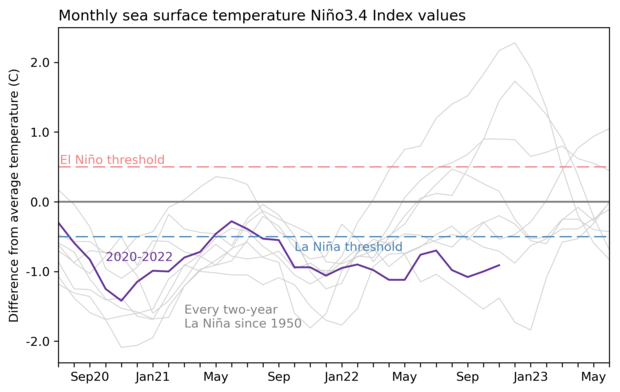
The sea surface temperature in the tropical Pacific is still well within La Niña territory, at about 0.9 °C cooler than the long-term average in November, according to ERSSTv5, our favorite sea surface temperature dataset. This anomaly—the difference from the long-term average—has been gradually warming up over the past few months, since reaching -1.1 °C in September.
The atmosphere also continues to reflect La Niña’s amped-up Walker circulation, with more rain than average over Indonesia, drier-than-average conditions over the central Pacific, and stronger winds, both near-surface and high in the atmosphere, all observed during November. The near-surface winds—the east-to-west trade winds—fluctuated a bit, slowing a little in mid-November. Since these winds cause upwelling, their slow-down may have contributed to the slight weakening in the sea surface temperature anomaly.
What’s next?
Forecasters are very confident that La Niña will continue in the short term, followed by a transition to neutral conditions. The exact timing of the transition is not clear, with equal chances of both La Niña and neutral for the January–March average. Confidence that La Niña will have exited by the February–April period, however, is fairly high, with a 71% chance of neutral. This forecast indicates that we can expect La Niña to influence our winter climate conditions this year. Check out the September post for a round-up of La Niña’s typical effects on winter temperature, rain and snow, and other weather and climate.

Speaking of La Niña impacts…
When we talk about the expected La Niña influence on seasonal temperature, we almost always talk about how the seasonal average is shifted during ENSO events. For example, during La Niña, winter in the northern U.S. tends to be cooler than average. The seasonal average temperature is very important, with implications for the amount of energy used for heating, and so on. Also, looking at seasonal averages means that we are filtering out short-term fluctuations and can be more confident that the shifts in climate are truly linked to ENSO.
However, you and I generally experience weather from a day-to-day perspective. We’ll notice big shifts in temperature from one day to the next, or unusually warm or cold days. To get an idea of how ENSO affects daily temperatures, I’ll start by looking at the range of daily average temperature within each winter. How much does the temperature normally vary from day to day? Then we can ask, for example, do La Niña winters have a wider range of daily temperatures in some locations than average? Narrower? No change? This is just a starting place, but we have to start somewhere!
The footnote has details about the calculations and data I used for the maps I show below. Also, I’m far from the first person to look at ENSO’s impact on daily characteristics of temperature, of course, and the footnote includes some information on earlier studies.
Free range
The standard deviation is a common statistic to understand the spread of a set of numbers. For example, if most of your daily winter temperatures occur in the range of 40–50 °F, the standard deviation will be smaller than if most of your daily temperatures are in the range of 35–55 °F, even though the average temperature may be the same at both locations. This statistic is widely employed in weather and climate science, and it’s what I use here.
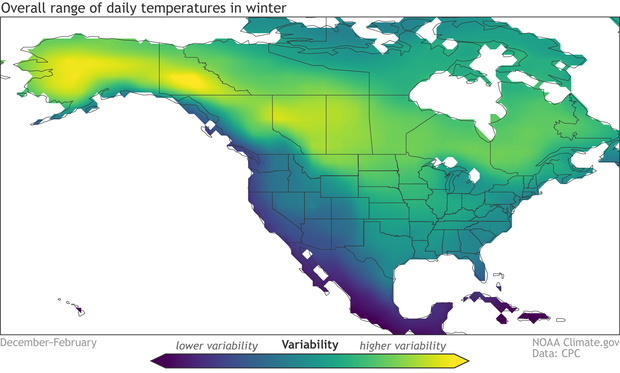
First, let’s see what the typical range of daily winter temperature is across North America. The central regions of the continent have the greatest variability on average, while the Pacific coast has a relatively narrow range of daily winter temperatures, modulated by the nearby ocean. The very moist climate of the tropics features the least daily variability.

El Niño’s effect on the range of daily temperatures in winter is generally opposite to La Niña’s, with mostly decreased variability when compared to average, especially across the western half of North America.
Overall, I think this is an interesting result: La Niña makes daily temperatures in winter more variable in most places, and El Niño makes them less variable. But it presents an incomplete picture, of course. These maps show the average changes during El Niño and La Niña—to understand how consistent this effect is, we could illustrate each winter separately like in Nat’s post last month that shows every winter’s precipitation and temperature patterns. What does a wider range of daily average temperature really mean? Why are we seeing these patterns? Would we expect to see the same patterns in the daily high or daily low temperature? These and other questions will have to wait for future posts…
Footnote
Details on the analysis:
- ENSO criteria: Any year with the December–February Oceanic Niño Index (ONI) greater than 0.5 °C was included in the “El Niño” sample, and any year with ONI less than -0.5 °C was included in La Niña. Not including ONI equal to 0.5 °C or -0.5 °C means I excluded the very weakest events, as well as borderline not-quite-ENSO years.
- The El Niño maps show the standard deviation averaged over the resulting 20 El Niño winters divided by the overall average winter standard deviation. The La Niña maps show the average during the 18 La Niña winters divided by the overall winter average.
- Daily temperature data: I used Berkeley Earth daily average temperature dataset. It’s also available here.
- Years included: 1950–2019. Berkeley Earth is available through near-present, but the data I downloaded ended in 2019. I’ll update with 2020–2022, but don’t expect the overall results to change.
- Programming language: I used Python. Jupyter notebook available upon request.
- Earlier studies: The most cited paper on this topic is Smith and Sardeshmukh 2000. My results mostly reproduced theirs, with the expected differences because we used different temperature data, they looked at 1959 to 1998, and we even had different criteria for defining ENSO events. Also, there’s a recent study, Yang et al. 2022 (Nat is a co-author) that my results agree with. I’m going to discuss that paper a little more next month… stay tuned!
Click the link to read the article on the WyoFile website (Dustin Bleizeffer):
Lower water levels at Flaming Gorge Reservoir, which have left several boat ramps and docks high and dry, are likely the “new normal” for years to come, according to federal officials.
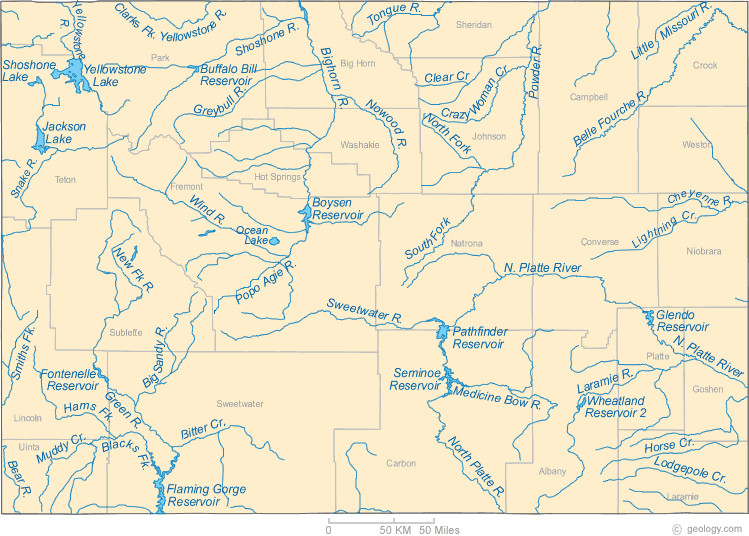
The Bureau of Reclamation’s most recent water-balancing adjustment under the Colorado River drought contingency plan, announced this month, maintains current plans at Flaming Gorge Reservoir on the Wyoming-Utah border. Those plans entail releasing an extra 500,000 acre-feet of water through April as per actions implemented in May. However, Flaming Gorge — along with two other major Upper Colorado River Basin reservoirs, Blue Mesa in Colorado and Navajo in New Mexico — remains a primary backup water source and may likely be tapped for more water, according BOR officials.
The BOR, meanwhile, will reduce releases from the Glen Canyon Dam at Lake Powell by 523,000 acre-feet of water from December through April, then allow that same volume to flow downstream to Lake Mead during the summer months. Future adjustments will likely include siphoning more water from Flaming Gorge, according to BOR officials.
Ongoing incremental adjustments are intended to sustain hydropower generation at the Glen Canyon and Hoover dams as a 22-year drought — exacerbated by human-caused climate change — continues to push the Colorado River Basin into a water scarcity crisis.
Taken all together, that means the bathtub rings of exposed shoreline at Flaming Gorge represent what is likely a “new normal” for the reservoir, Drought Response Operations program manager for the Upper Colorado Basin Region Dale Hamilton told WyoFile.
“We will continue to work with our Basin partners to consider additional releases implemented under the Upper Basin [drought contingency plan] from the upstream Colorado River Storage Project initial units, which includes Flaming Gorge,” Hamilton said.
Much depends on winter precipitation and spring runoff, Hamilton added, so any decision regarding further actions at Flaming Gorge is likely months away. “Those actions are still being discussed,” he said.
New normal
After decades of relatively steady water levels at Flaming Gorge, the reservoir is undergoing unprecedented changes as water managers release extra water in an attempt to to help balance water levels among major downstream storage reservoirs along the Colorado River.
The BOR released an extra 125,000 acre-feet of water from the reservoir in 2021 as part of the Colorado River drought contingency plan, dropping the surface level by about 5 feet. The current “extra” release of 500,000 acre-feet of water, combined with lower-than-average natural infill (just 57% of average from April through July) diminished the reservoir to 72% capacity in November, according to the BOR.
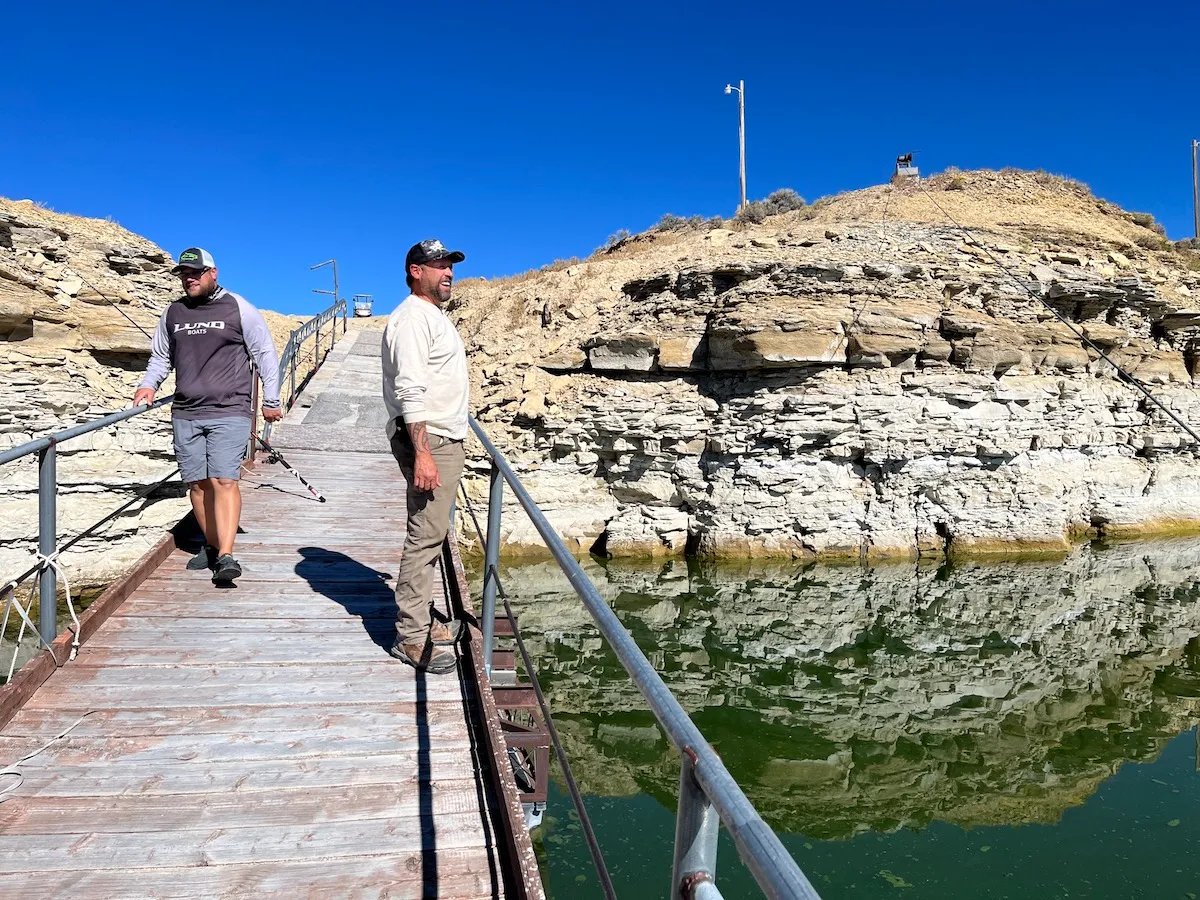
The reservoir has dropped by about 9 feet this year, exposing vast areas of lakebed at the upper reaches and water-ring patterns on canyon walls in some areas.
Recon Angling fishing guide Shane DuBois tried his luck ice-fishing Monday in 7 feet of water where, normally, the water depth should be nearly 40 feet, he said.
“A lot of [fishermen] have been fishing different spots for burbot,” DuBois told WyoFile. “I think [lower water levels are] going to start messing up everything, especially with all the sediment that’s pushed up on the rocks where [fish] usually spawn. It’s not going to be conducive for successful spawning for, really, any fish.”
Recreational access is becoming increasingly difficult, as water recedes from boat ramps. The ramp at the Anvil boat launch area on the west side of the reservoir in Wyoming was closed recently, DuBois said, while the Buckboard Marina in Wyoming continues to try to keep boat docks in the water.
“We’re not naive,” DuBois said. “Even if we have a big-snow year, they’re probably just gonna take all that water right back out.”
Click the link to read the post on the InkStain website (John Fleck):
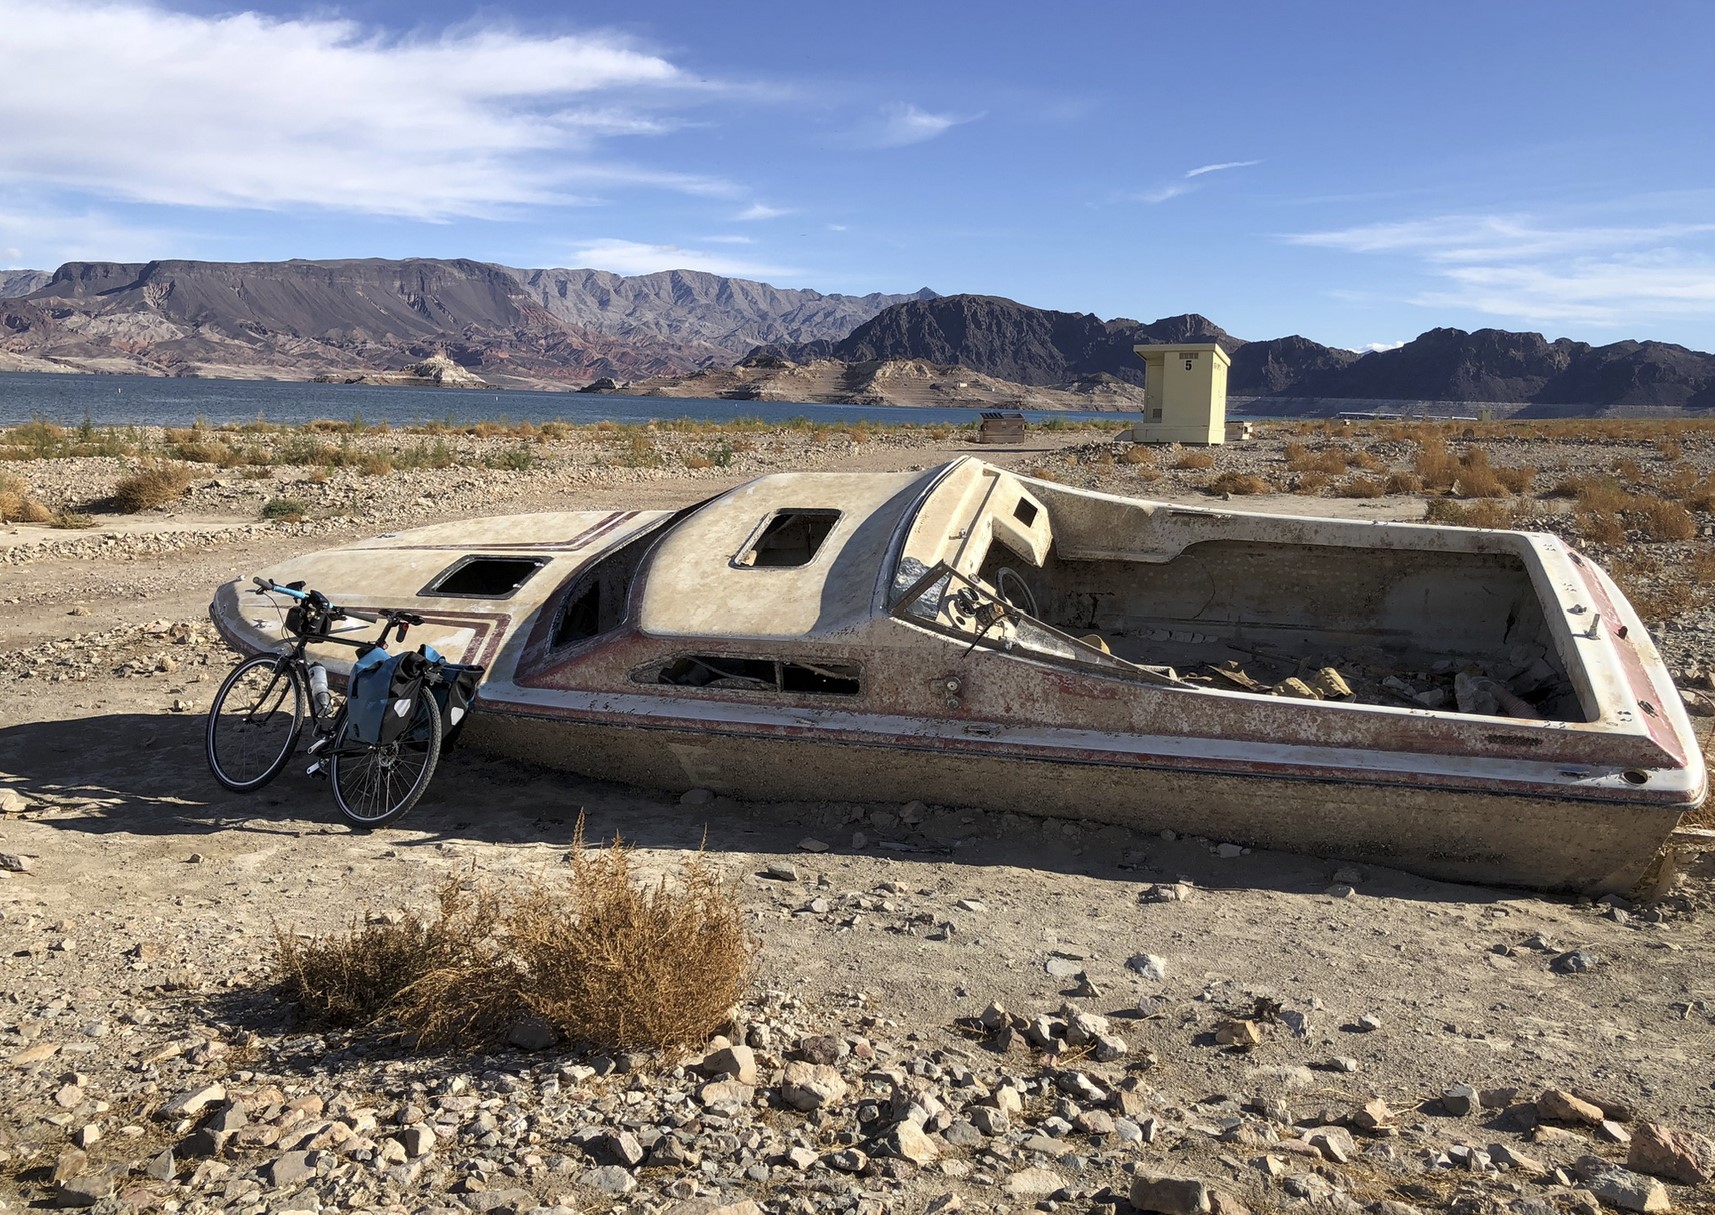
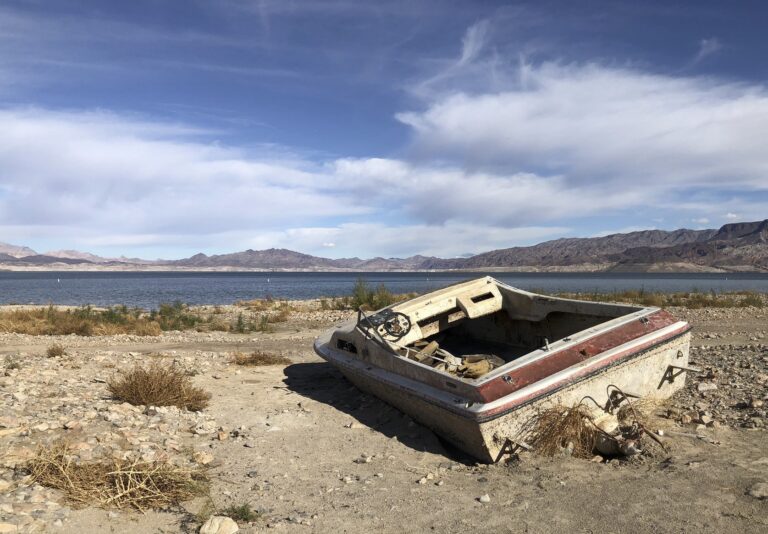
The Park Service has cut a raggedy new dirt road (“4×4 recommended”) north of Hemenway Harbor along Lake Mead’s receding shoreline so you can still get in to go fishing and do the beach thing.
Mead was at elevation 1,043 and change as I rode it on my bike yesterday afternoon, with lunch and time on my hands to ponder the stakes. You could see the uppermost Las Vegas water pipe, exposed to the winter air, and the stranded intake from the World War II-era Basic Magnesium factory.
I passed three Lake Mead shipwrecks, the media icons of the great collapse, ruin porn of the Colorado River. I was happy, I guess, to finally bag the pictures for myself. I guess?
It was my annual pre-Colorado River Water Users Association Lake Mead visit – a bike ride along the reservoir, a trip to Hoover Dam, some quiet time in Boulder City before heading into the madhouse of Las Vegas and CRWUA and a Colorado River in crisis.
MANAGING IN CRISIS MODE
The challenge right now is a very practical one. We’ve no longer time the sort of vague generalizations I got when I turned to ChatGPT for help – “Implementing stricter water usage regulations and reducing water waste can help bring the supply and demand of the Colorado River into balance.” Great. Thanks. How we gonna do that?
The Colorado River brain trust has to write new rules, and it has to write them now, in a very specific way, with little time or room for error.
I have long had a dodge when reporters or my students or whoever asked me what I think we should do: It doesn’t matter what I think we should do, I would tell them. What matters, I would say, is what emerges from the seven states and the federal government, and increasingly the Tribes and others who who now, rightly, find themselves at the negotiating table(s).
Unfortunately, what has emerged from that process is shipwrecks emerging from Lake Mead.
So I’ve dropped the shield and begun thinking about how I would rewrite the rules, if anyone asked me. Come to think of it, the Federal Government has asked me, along with all the rest of you, via this Federal Register notice. You’ve got a week left before your assignment is due.
Basically, we need to do two things.
First, we need to rewrite the rules governing releases from Glen Canyon Dam to protect Lake Powell from reaching critically low levels that, by forcing the use of the dam’s lower outlet works, might threaten the structural integrity of the dam. We do this by setting a maximum release from Powell based on the current year inflow.
Second, we need rules to cut far more deeply into Lower Basin water use, like right now – far deeper than the rules we’ve got now. They’re just not sufficient. We have to include evaporation and system losses as part of each Lower Basin state’s allocation.
SAVING GLEN CANYON DAM

Section 6C and 6D of the 2007 Interim Guidelines is the critical first step.
This is where the current rules lay out how much water is to be released each year from Glen Canyon Dam. Note the quaintly anachronistic “Lake Powell Active Storage” column on the right, with “dead pool” – zero active storage – at elevation 3,370.
If Reclamation decides it doesn’t trust the dam’s outlet works, which sit down there, then suddenly “active storage” doesn’t start until elevation 3,490, the level of the power plant intakes.
For now at least, 3,490 is the new dead pool.
That would mean that at elevation 3,525, rather than having 5.93 million acre feet of “active storage” – the amount of water above “dead pool” – we’ve really got less than 2 million acre feet of really actually usable, releasable water in Powell. The whole notion of “balancing” active storage in Mead and Powell, so central to the ’07 Guidelines, now has to look completely different.
When you get close to dead pool, you’ve got a “run of the river” system, which means that the only water that leaves a reservoir is the amount that comes in. Given that we’re apparently redefining that for Powell on the fly, the new versions of 6C and 6D somehow have to restrict releases from Powell to not much more than comes in. Basically starting now, and for the foreseeable future, until we can begin to refill Powell or drill some new tubes at the bottom that we trust.
A simple approach to the new rule here might be rewrite the release rules when you’re in the “Mid-Elevation Release Tier” (below 3,575) and the “Lower Elevation Release Tier” (below 3,525) to cap releases to inflow minus evaporation. That would set a sort ratchet that would prevent a further decline in Lake Powell below its current dangerously low levels.
You could start the year by capping Powell releases at the 24-month study’s “minimum probable” unregulated Powell inflow level, with the option of raising the release an April review based on the “most probable” unregulated inflow. Minus evaporation. You’d have to subtract evaporation from that.
Other than that, the 6C and 6D rules could stay the same.
SAVING LAKE MEAD
As the modeling presented by Reclamation in its webinars two weeks ago shows, if you operate Powell the way I describe under low flow scenarios, you can crash Mead in a hurry. We need rules that are ready for that.
Taking evaporation and system losses off the top before we begin handing out water is a start. The “structural deficit” is real, it’s a result of not taking evaporation and system losses into account, and it’s written in shipwrecks emerging from the depths of Lake Mead.
Right now evaporation and system losses are in the ballpark of 1 million acre feet per year, but to be on the safe side, let’s set them at the 1.2 million acre foot per year level in the classic Reclamation “structural deficit” Powerpoint slide.
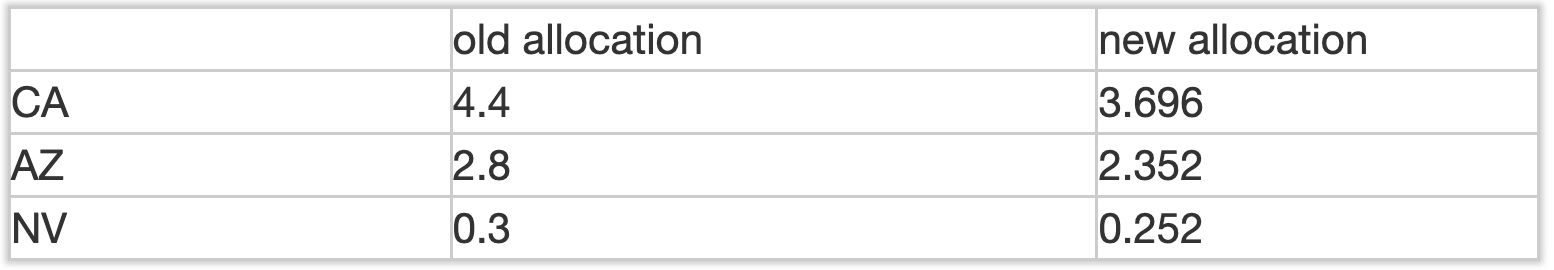
So the cuts in section 2D of the Interim Guidelines would have to be rewritten, with Arizona, Nevada, and California taking a proportional share of system losses right off the top.
You can do this some really complicated ways, based on the distance downstream of each user’s intake – so Imperial and Yuma would take a bigger system losses hit, and Las Vegas (pulling straight out of Lake Mead) would only suffer evaporative loss.
That seems like a recipe for scientized litigation, so my proposal is simple: Everyone shares this equally (sorry, Nevada friends).
That would leave us with a base allocation that looks something like this:
The cuts in the big ’07 Guidelines/DCP allocation tables would then be deducted from these numbers. So under this scenario, if we drop into the Mead elevation 1,040-1,045 tier, the total allocations would be:
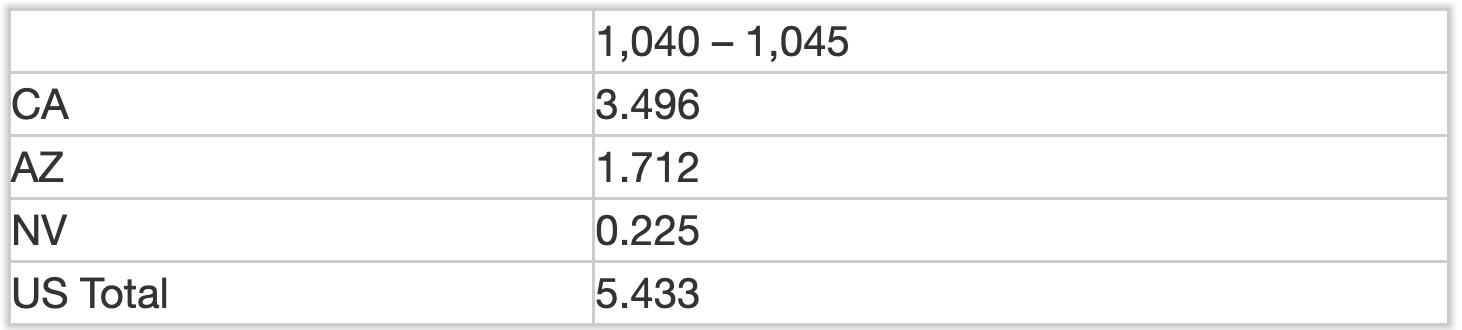
Notably, this gets us to the 2 million acre of cuts Reclamation Commissioner Camille Touton said we need in her testimony to Congress last summer.
UPPER BASIN
This obviously doesn’t touch the Upper Basin. The process Interior is using for this round of crisis management – a straight up revision to the ’07 Guidelines – doesn’t seem to offer a clear path to force the Upper Basin to come up with contributions of their own. For now, I’m OK with that. Since the ’07 Guidelines were signed, the Upper Basin has delivered more than 10 million acre feet of water above the required 8.25 million acre foot annual requirement. Despite that, the Lake Mead shipwrecks are emerging from the shallows. The key here is clearly to get Lower Basin overuse under control.
But I don’t think in the longer term the Upper Basin is off the hook. Reclamation’s modeling clearly shows a risk of the Upper Basin slipping below its 82.5×10 obligation if we have a few more bad years. We need a plan to deal with that. And it’s also a matter of fairness, in my view. We all have to contribute.
My scheme for Upper Basin contributions involves the next wet year – figuring out how to forego some of the Upper Basin storage we’ve got and get that water into Lake Powell instead. Suggestions for how to write that rule are welcomed – bonus if anyone can figure out how to fit that into the rewrite of the ’07 Guidelines currently underway.

COLLABORATION
I still believe in the power of the collaborative governance framework we’ve developed in the Colorado River Basin. As Assistant Secretary of Interior Tanya Trujillo told me when I was moderating her appearance at last summer’s Getches-Wilkinson Center conference, we’d be in a lot worse shape without it.
For what it’s worth, ChatGPT agrees: “Collaboration and cooperation among states and water users is crucial in finding solutions to the supply-demand imbalance on the Colorado River.”
