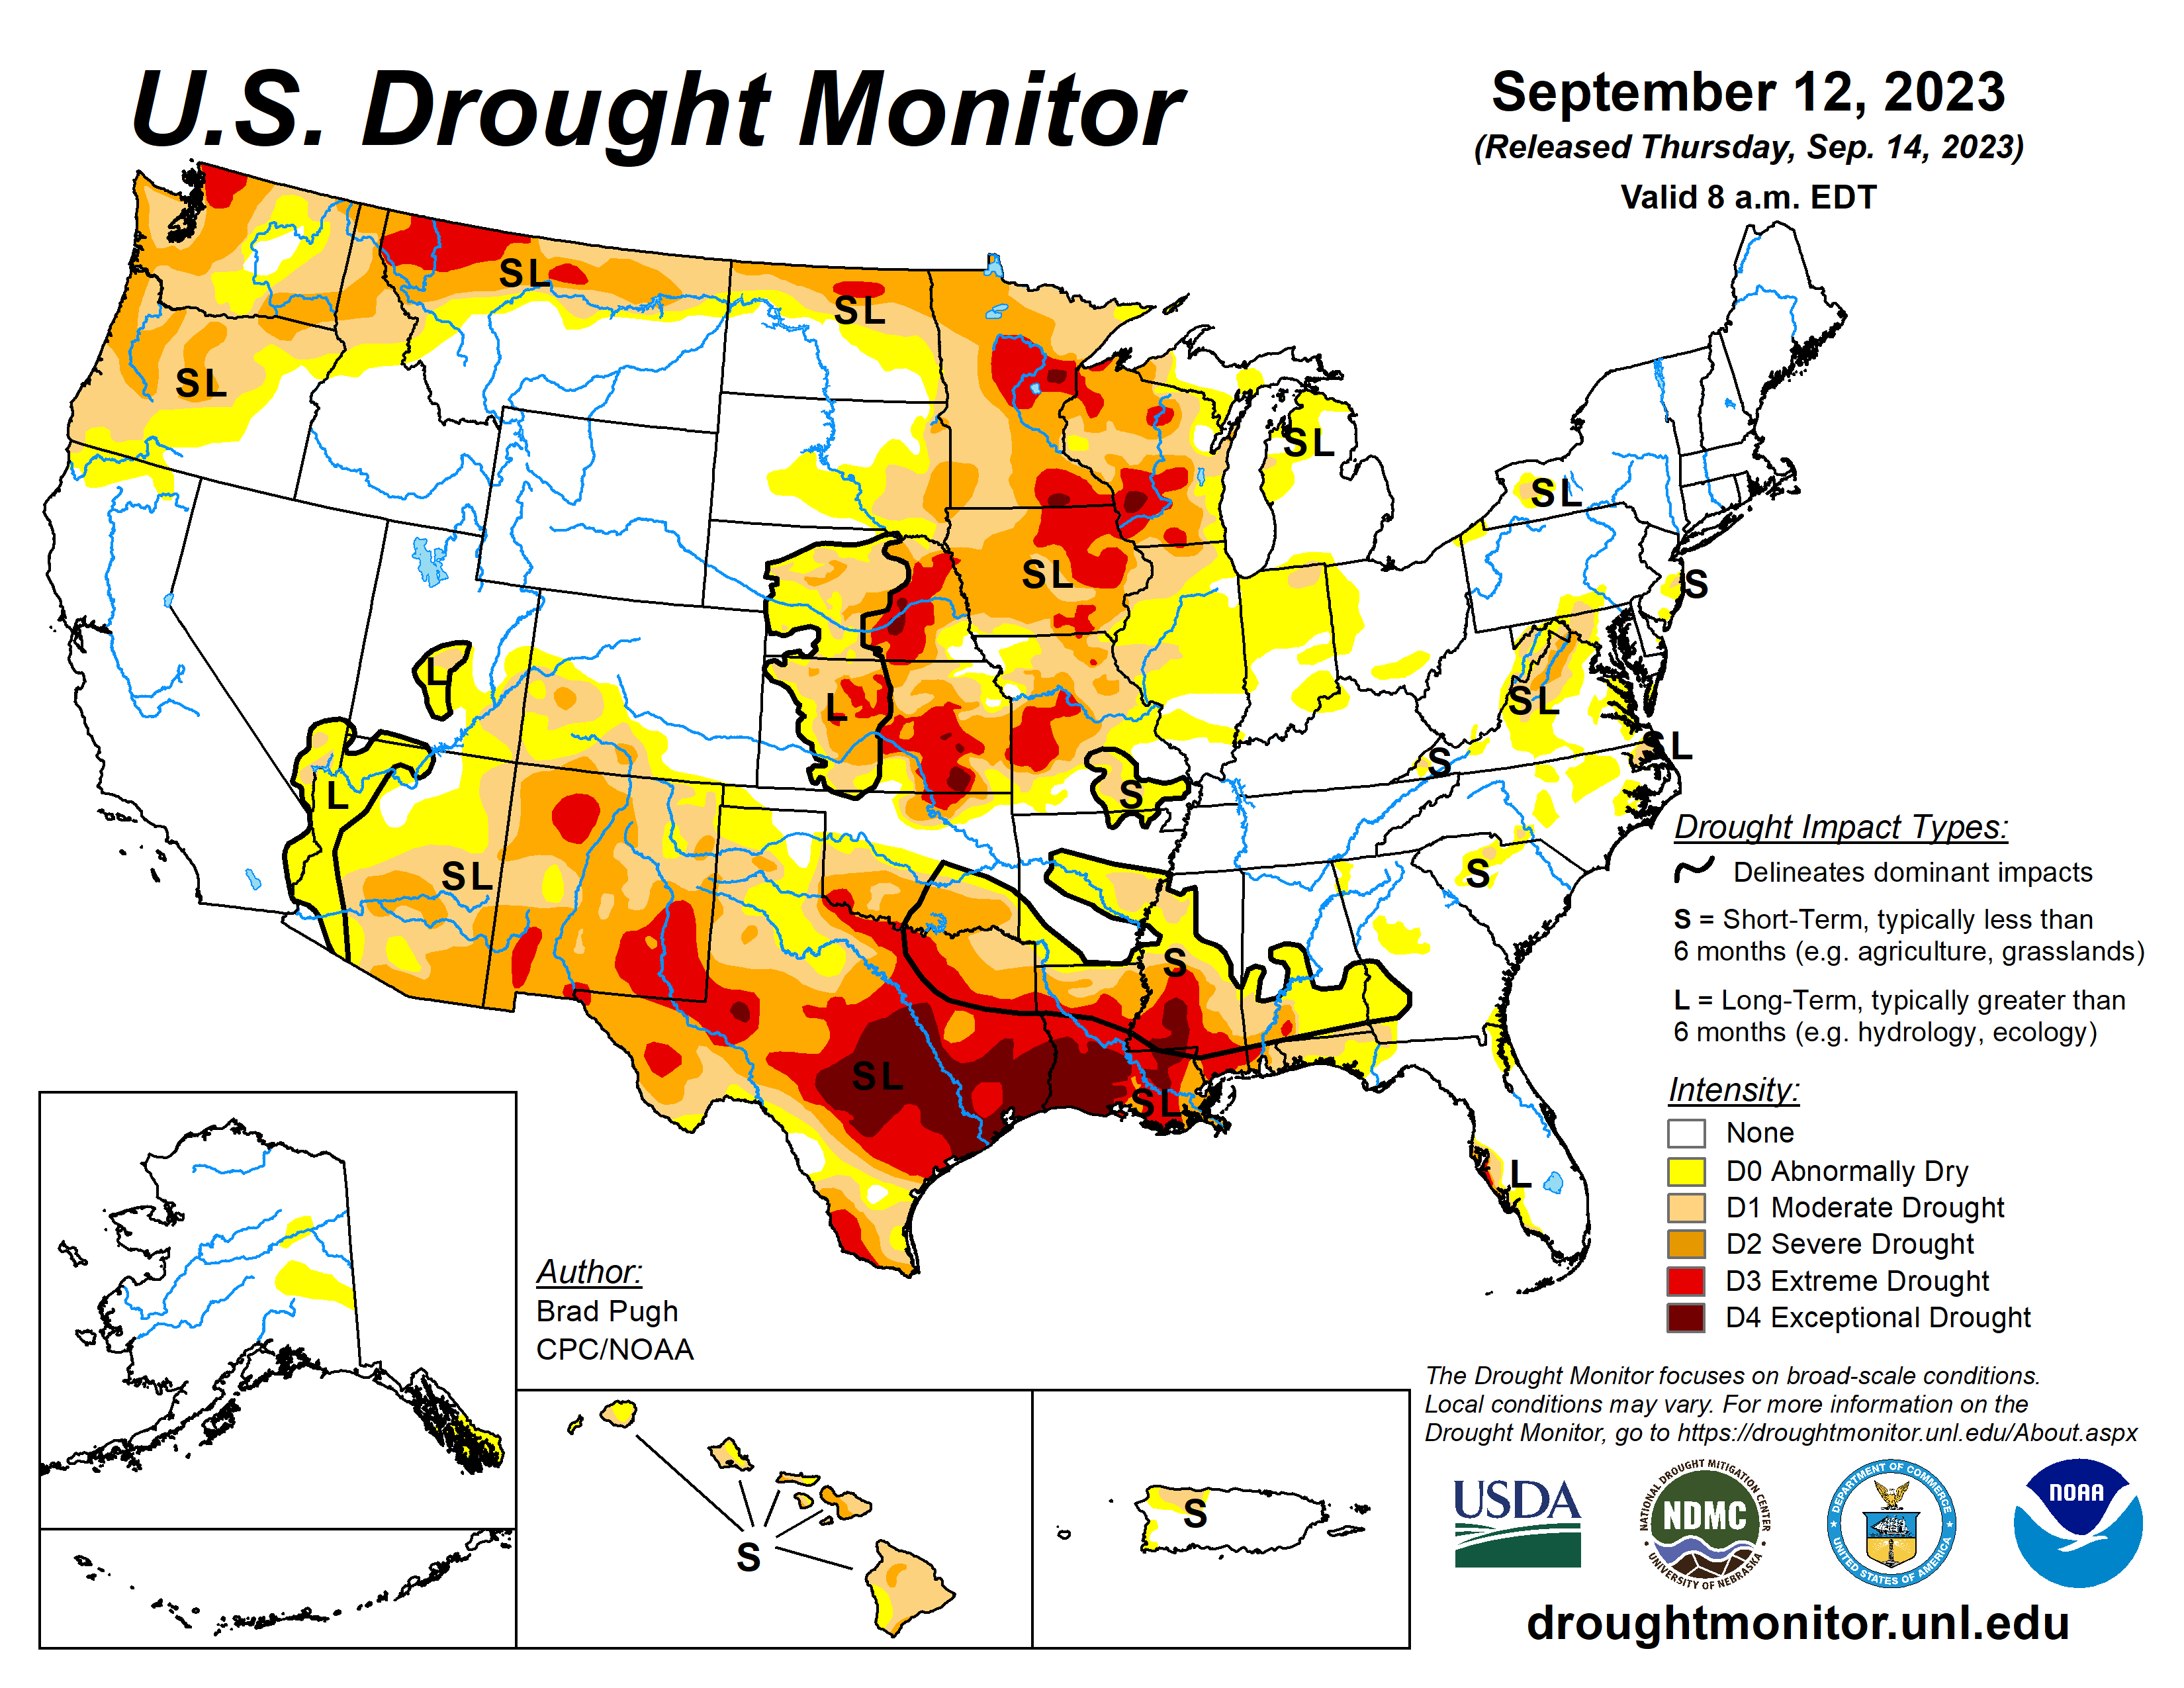
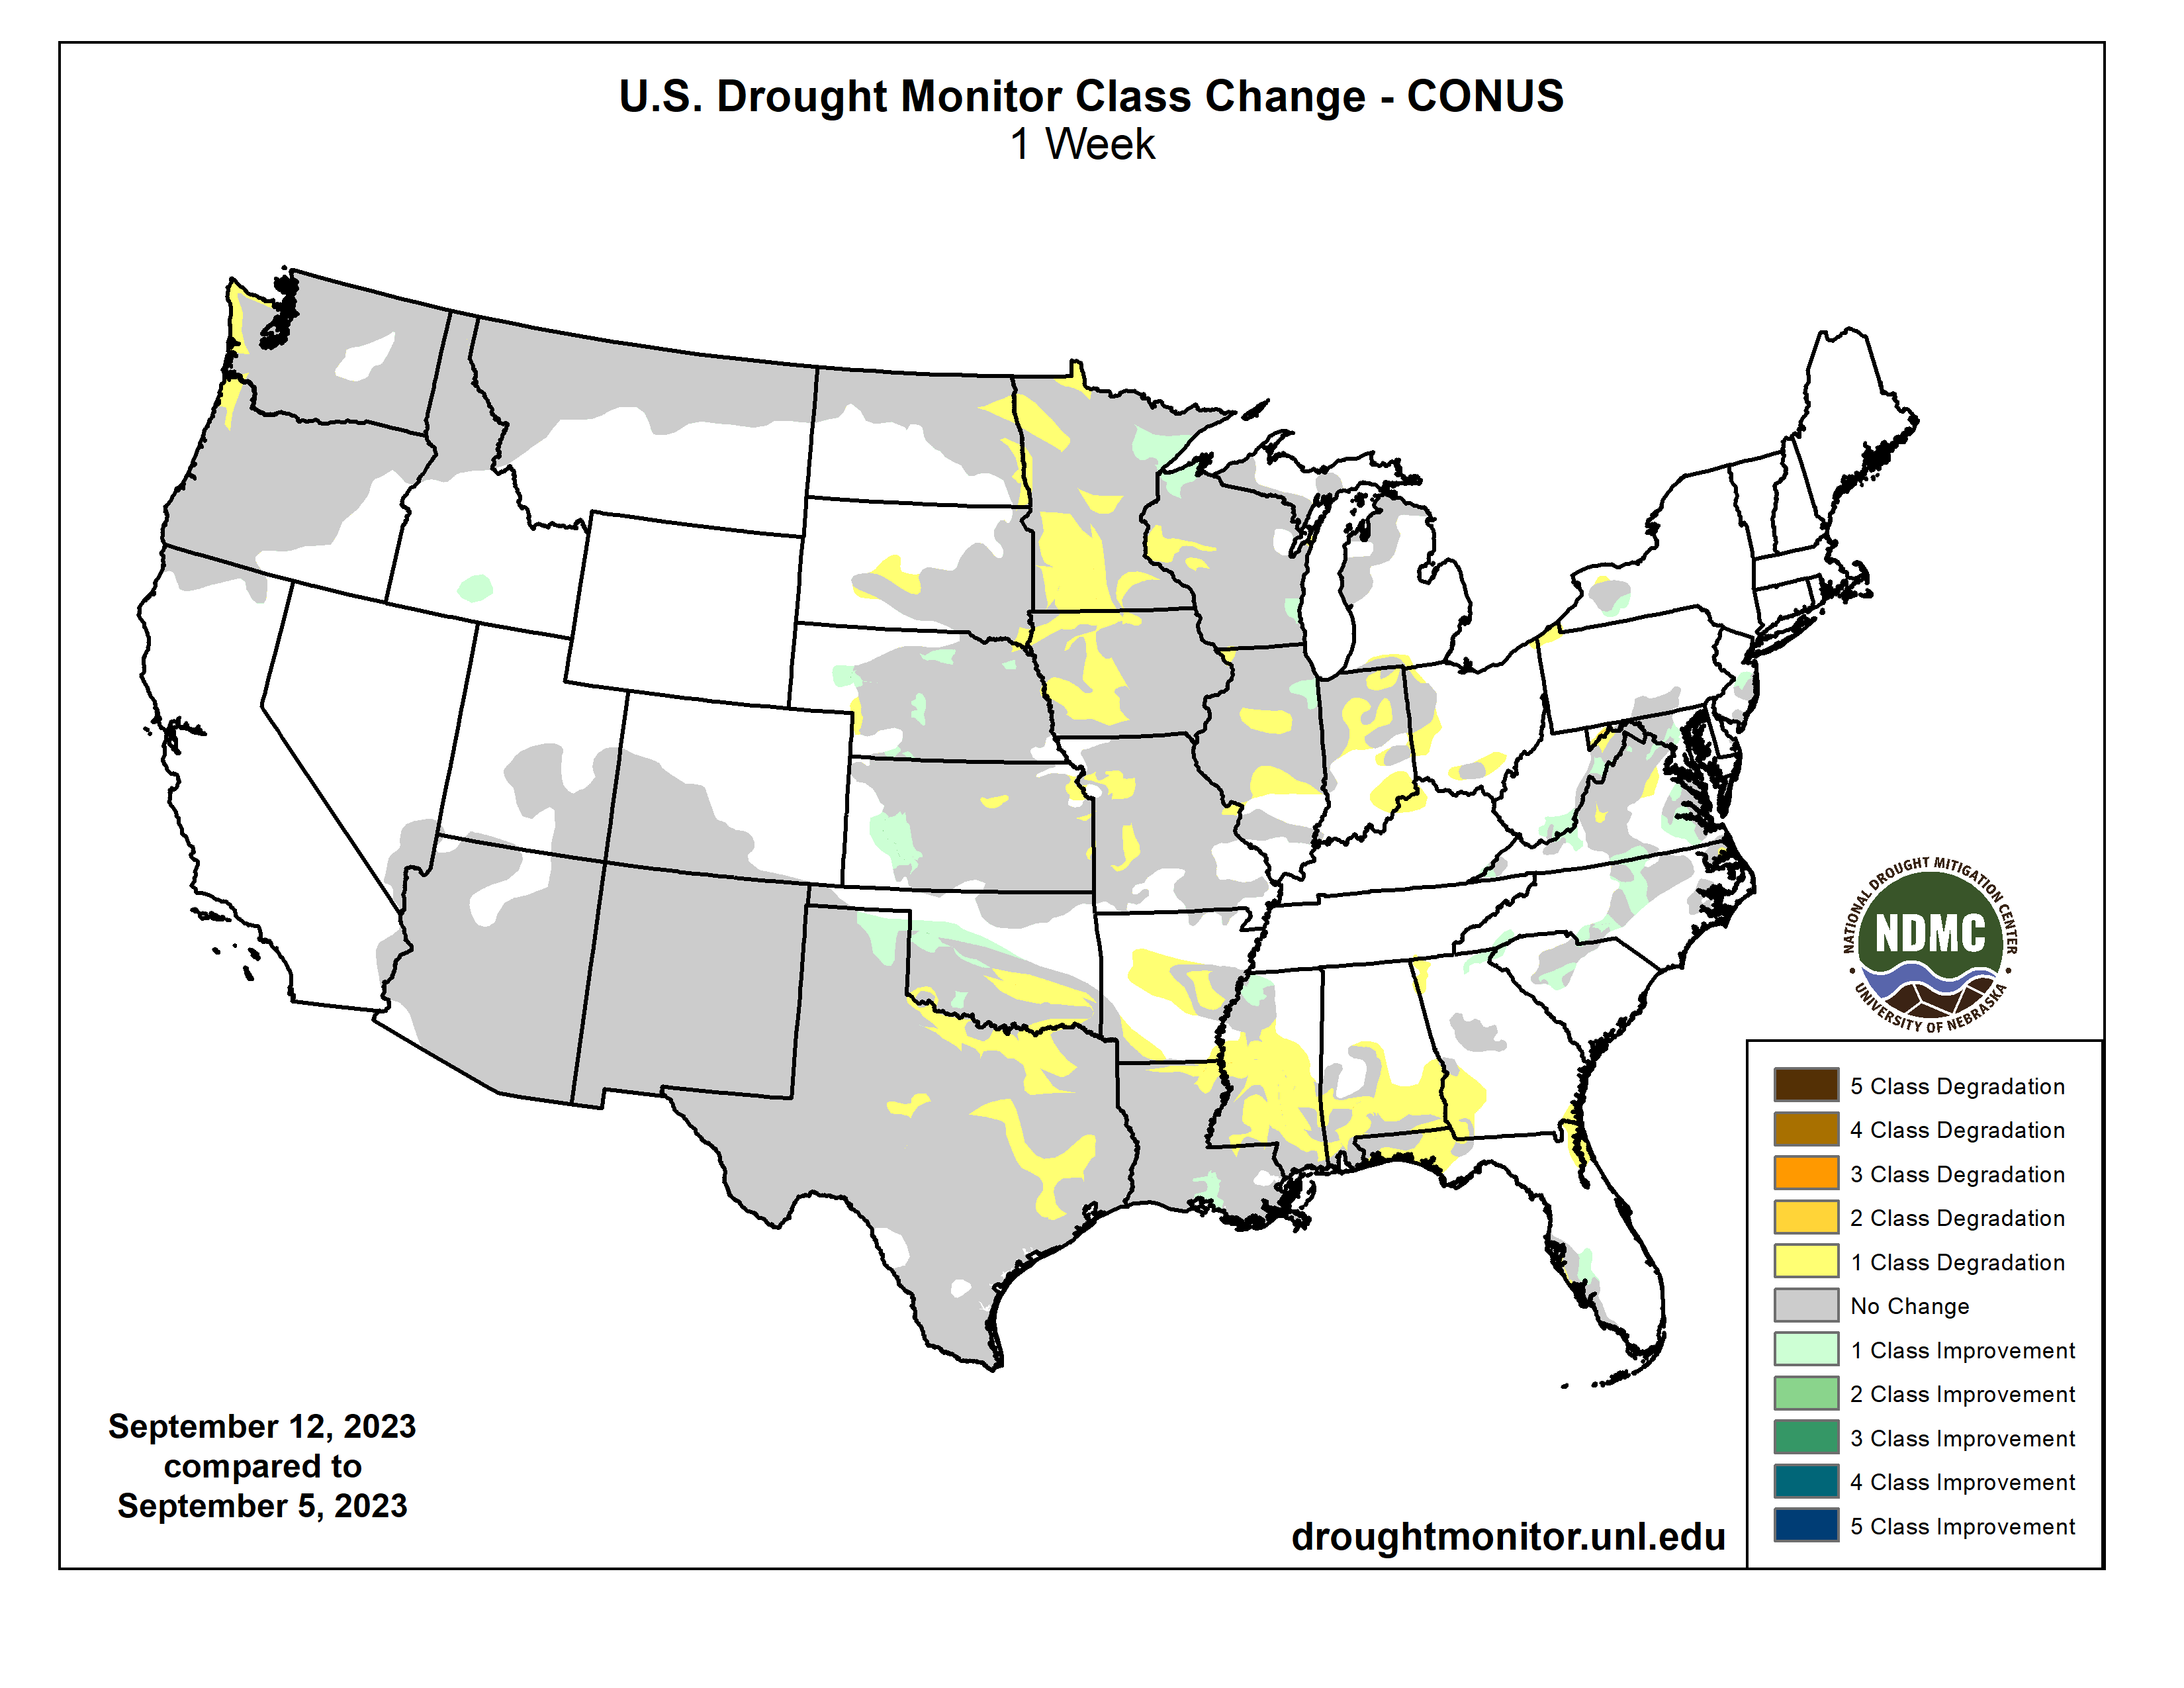
Widespread precipitation amounts of 0.5 to 2 inches (locally more) were observed across much of the Great Plains, Upper Mississippi Valley, and East. Improvements were made to areas that received the heaviest amounts. In the wake of a cold front, 7-day (September 5 to 11) temperatures averaged near to slightly below normal for the Northern Great Plains and Upper Midwest. Farther to the south, above-normal temperatures continued across the southern Great Plains and western Gulf Coast. Since early August, persistent excessive heat coupled with a lack of adequate rainfall led to a rapid onset and intensification of drought from Texas eastward to the Lower Mississippi Valley and parts of the Southeast. Monsoon rainfall began to decrease throughout the Four Corners region and Southwest during early September, while seasonal dryness prevailed along the West Coast…
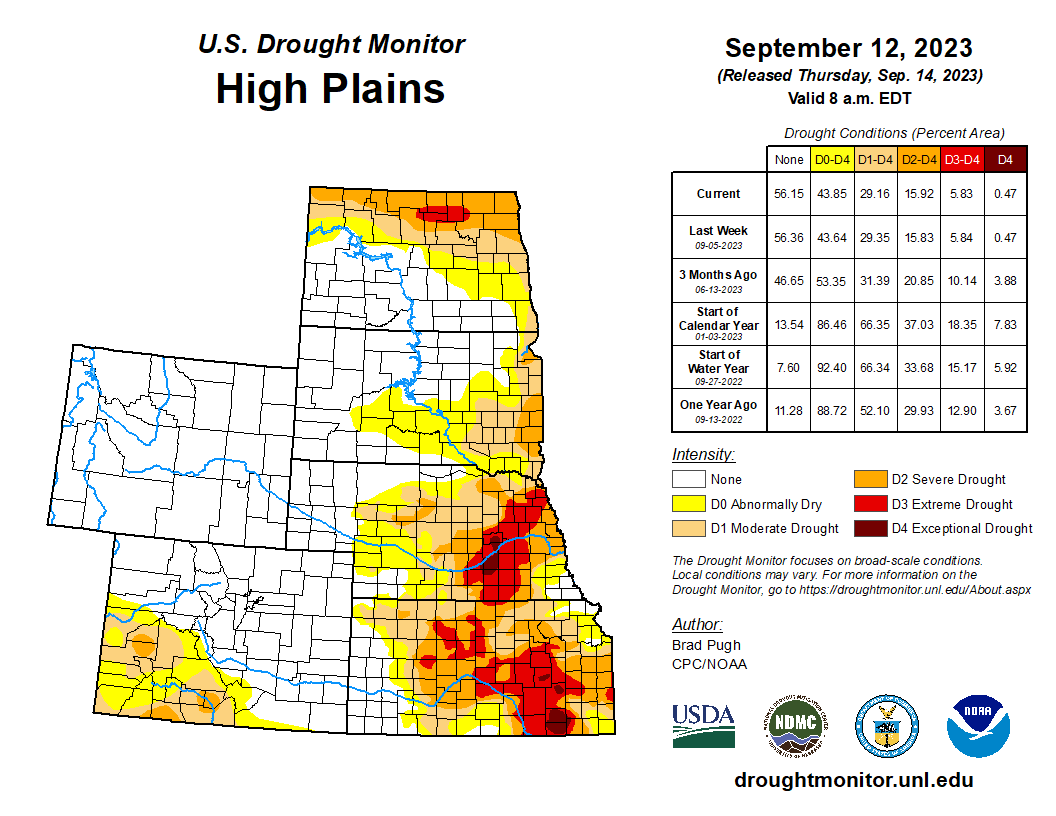
Heavy rainfall (1.5 to 3 inches, locally more) prompted a 1-category improvement to southwestern Kansas along with parts of Nebraska. Also, NDMC’s drought blends were a factor in these improvements. Conversely, 30-day SPEI and soil moisture supported small degradations across eastern parts of Kansas. Worsening soil moisture indicators led to an expansion of severe drought (D2) across northeastern North Dakota…
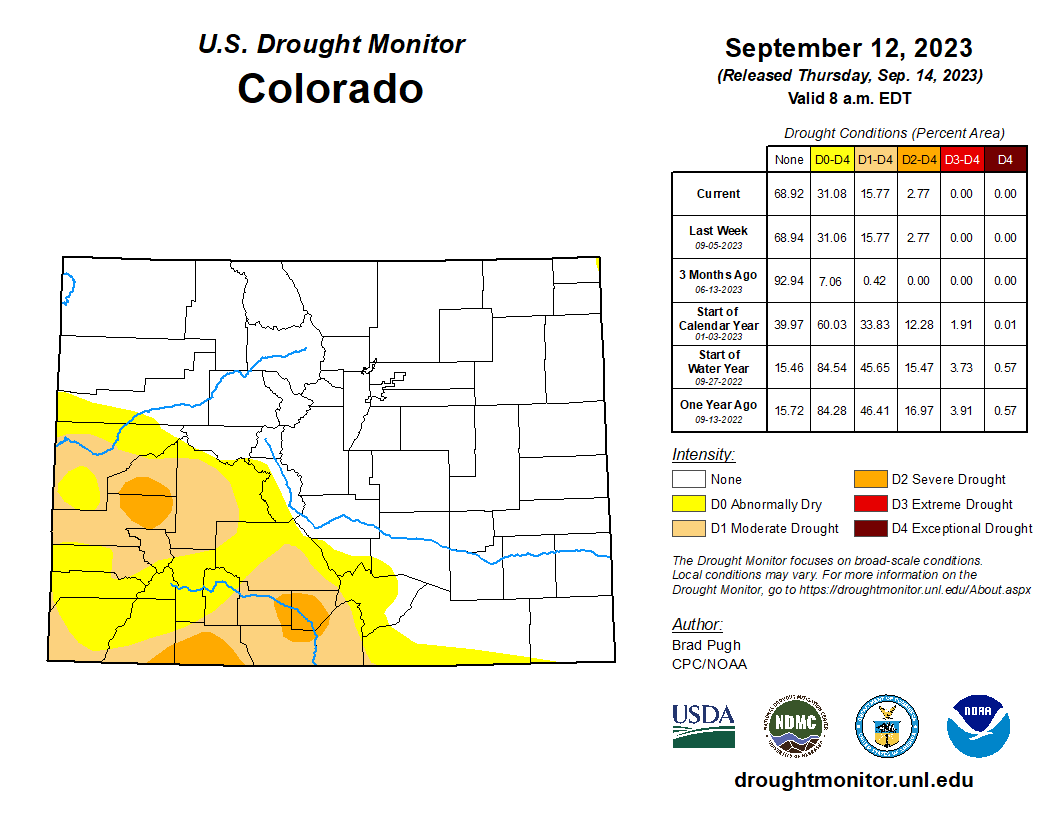
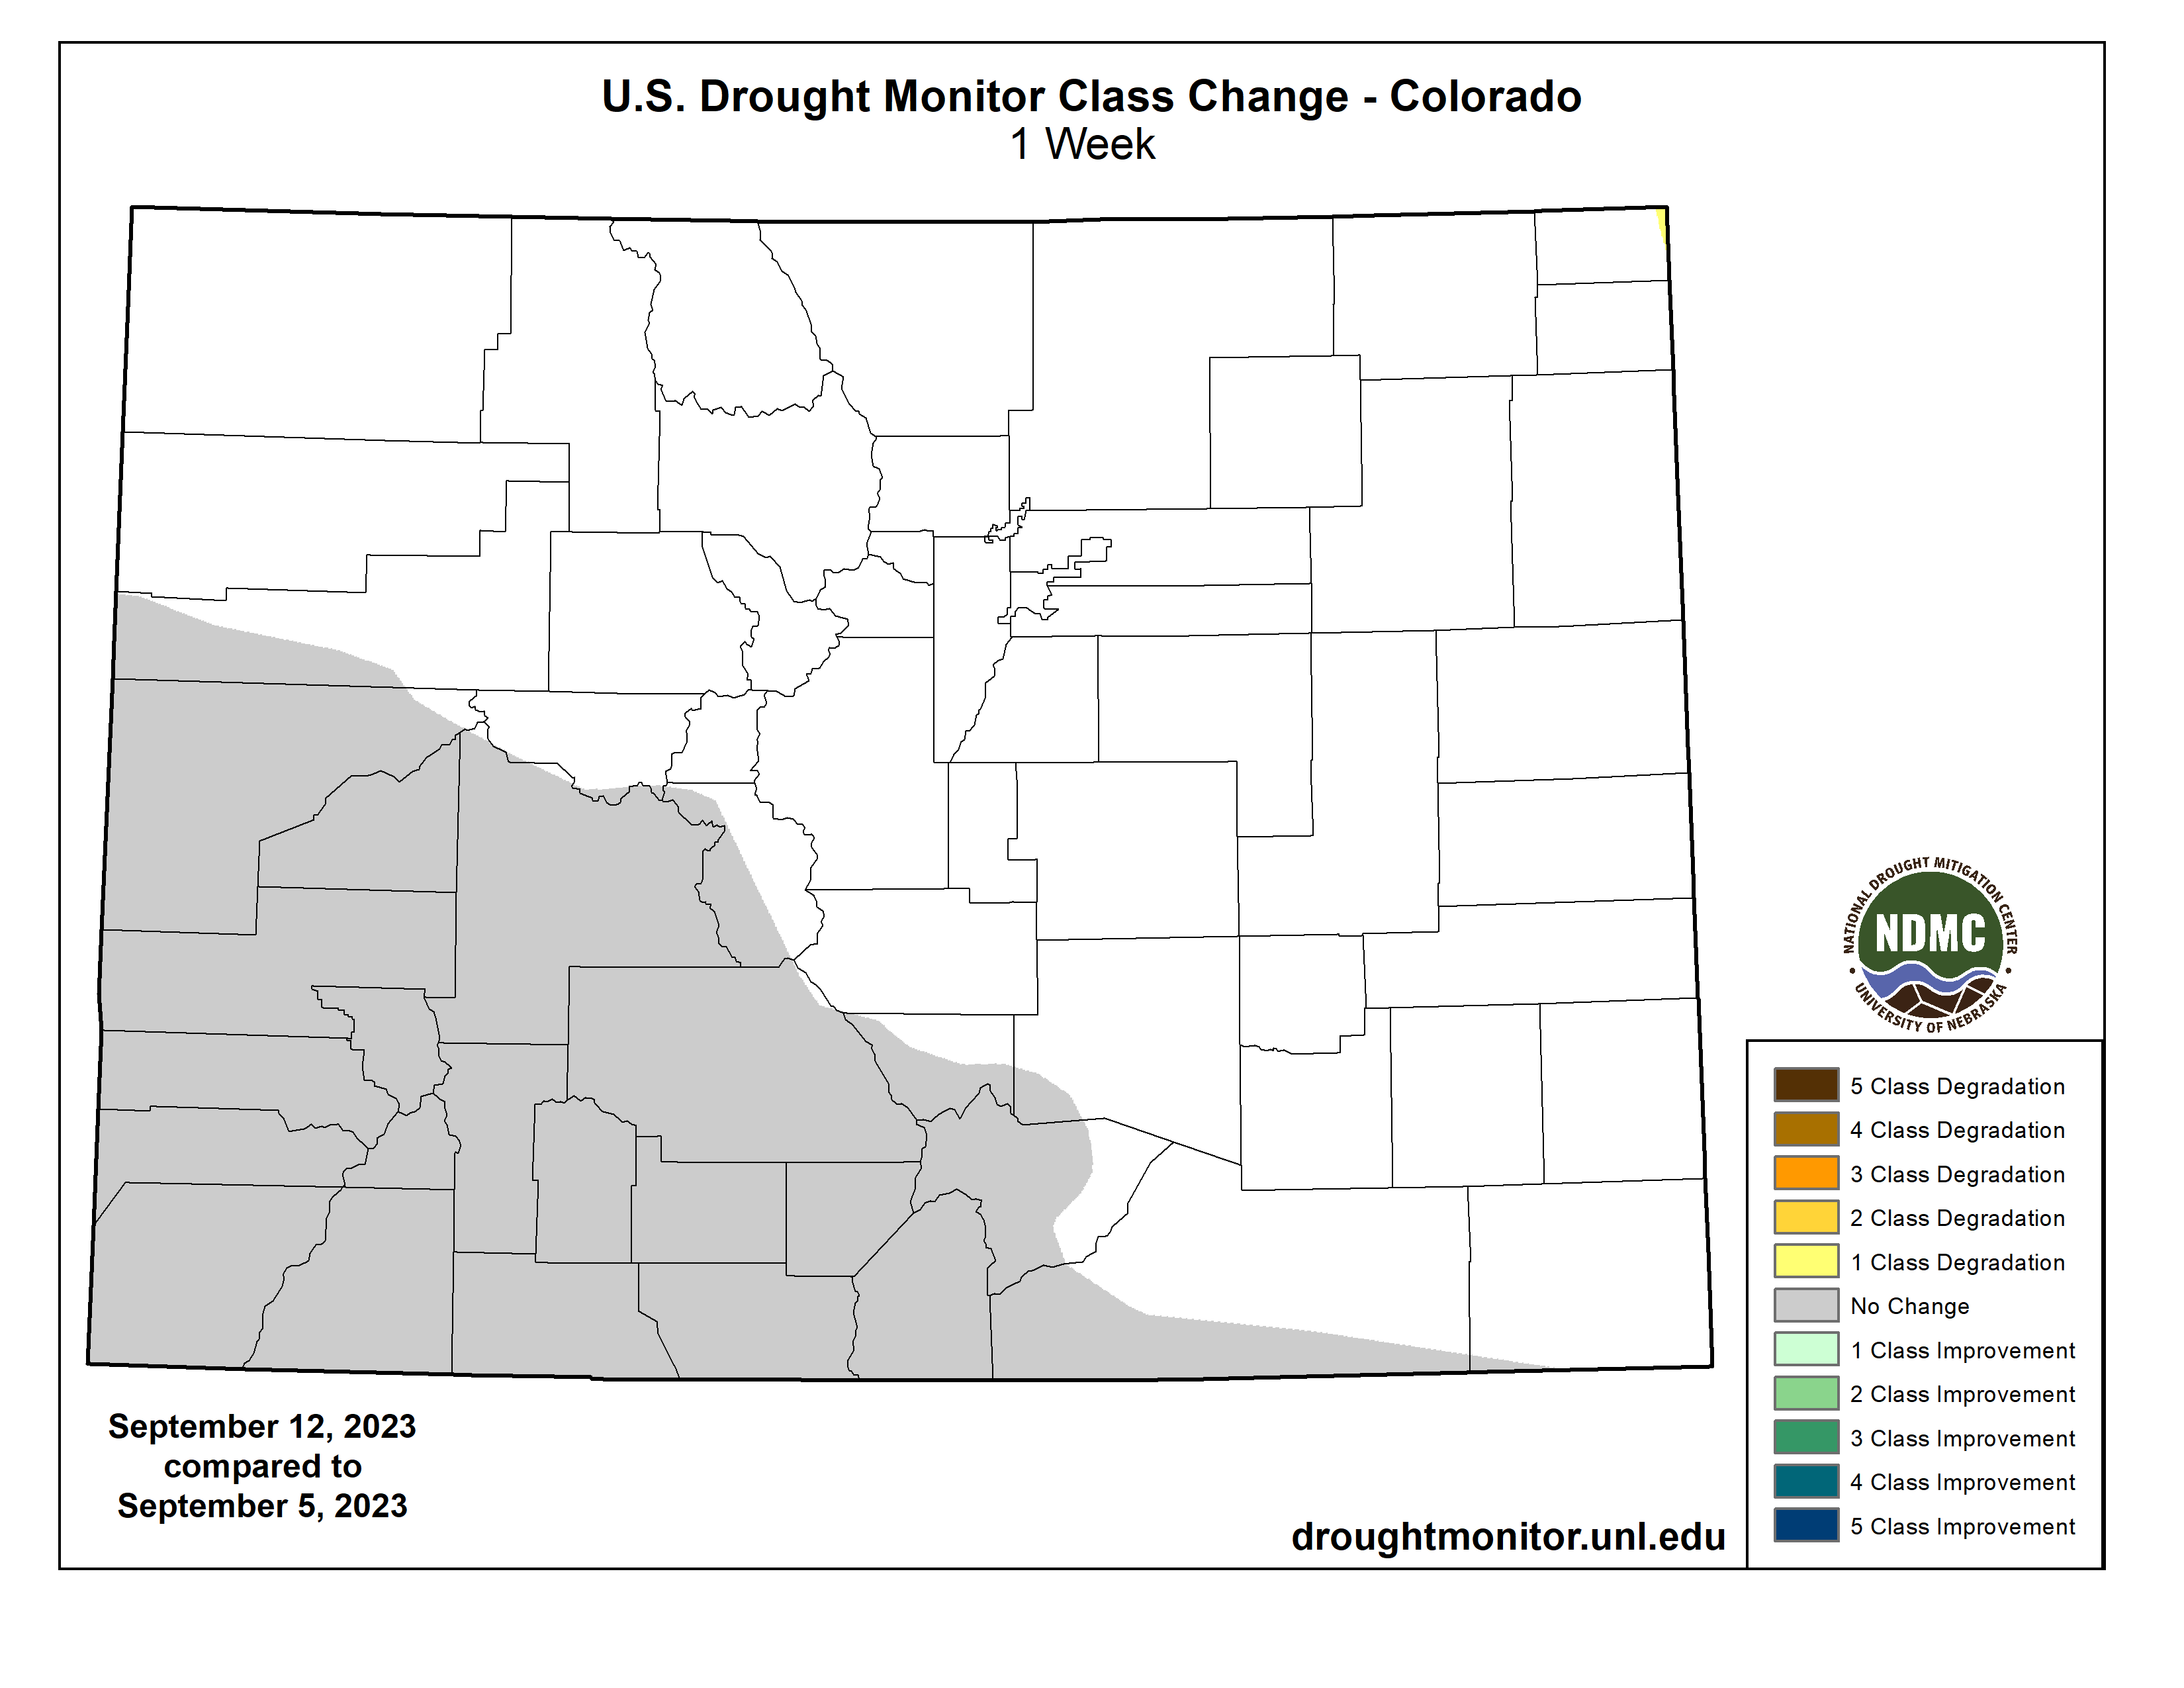
Colorado Drought Monitor one week change map ending September 12, 2023.
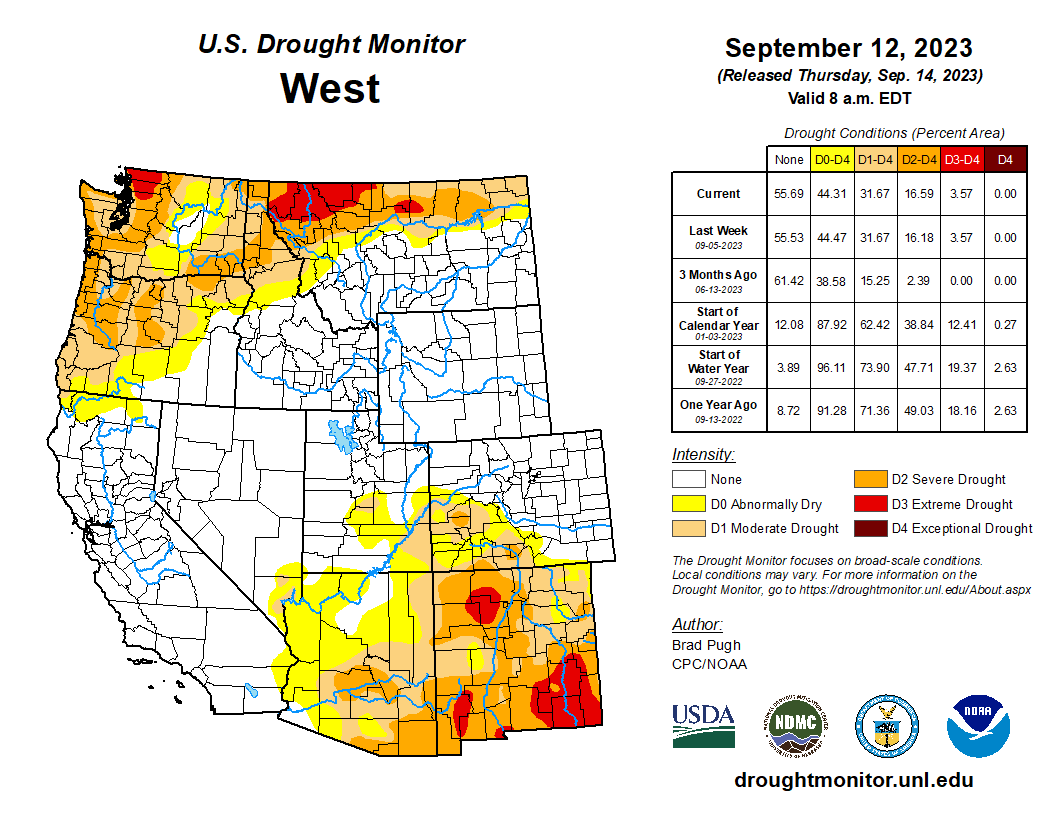
Much of the West was status quo this week as Monsoon rainfall begins to decrease during September and this is a drier time of year for California and the Pacific Northwest. However, low 28-day streamflows and SPEI at various time scales led to an expansion of severe drought (D2) across coastal Washington and northwestern Oregon…
The rapid onset and intensification of drought continues throughout central and southern Mississippi. According to the NCEI, numerous counties in the southern half of Mississippi had their driest August on record and many of those counties have received less than 0.5 inch of precipitation during the first ten days of September. Along with this dryness, persistent above-normal temperatures have led to high evapotranspiration rates and worsening impacts to agriculture and high fire danger. Little change was made to Louisiana this week since the previous USDM map matches up well with the indicators (NDMC short-term blend and soil moisture) and many areas received at least a 0.5 inch of precipitation this past week. A 1-category degradation was warranted for southeastern Oklahoma and parts of Texas due to the prolonged excessive heat this summer and lack of adequate precipitation. The expansion of extreme (D3) to exceptional (D4) drought across central and eastern Texas was based largely on the 90-day SPEI and soil moisture indicators. Despite heavier rainfall (more than 1 inch) across west-central Texas, soil moisture indicators, 90-day SPEI, and NDMC’s drought blends support a continuation of D2+ levels of drought. More than 1.5 to 2 inches of precipitation prompted a 1-category improvement to northwestern Oklahoma and the northeastern Texas Panhandle…
US Drought Monitor one week change map ending September 12, 2023.
I suppose it goes without saying, but just in case you haven’t noticed: We live in interesting times climate- and water-wise. And by interesting I mean whiplash-inducing and uncertain; downpour mingled with drought; massive flash-floods in the same region as dried out river beds.
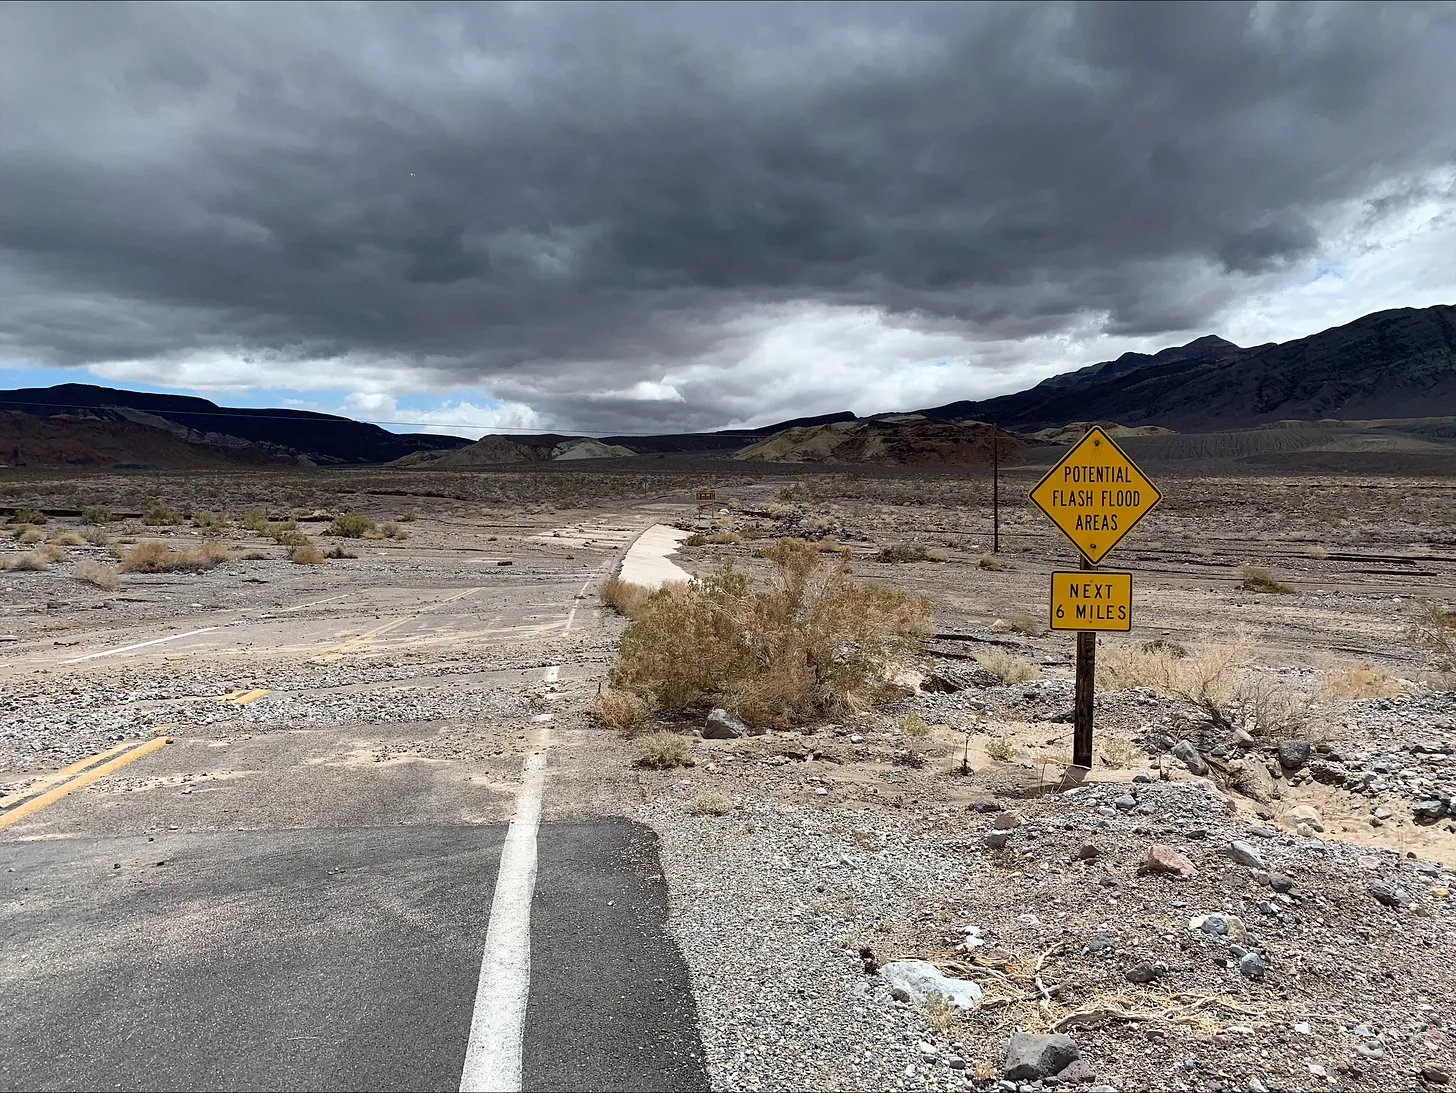
Tropical storm Hillary wreaked havoc in southern and central California even as massive wildfires burned through tens of thousands of acres in the north. Flash flooding caused so much damage in Death Valley that the entire national park remains closed, weeks later.
Flood damage in Death Valley National Park, which remains closed weeks after Hurricane Hilary brought widespread flooding and damage to the park. Source: NPS
A successive wave of storms brought more rain to Nevada, turning Burning Man into a mud-and-poop fest from which celebrants couldn’t escape (God’s punishment, according to Rep. Marjorie Taylor Greene, who is not exactly the sharpest tool in the shed). Las Vegas Wash, which carries treated wastewater from Las Vegas back into Lake Mead (credited against Nevada’s Colorado River allocation), swelled up to 14,100 cubic feet per second on Sept. 2, the second highest flow since 1957.
A woman and her dog were caught in a flash flood in Mary Jane Canyon near Moab and was swept about 200 feet downstream before escaping the rushing, muddy waters. She lost her shoes, was covered with mud, but otherwise escaped mostly unharmed, according to reports.
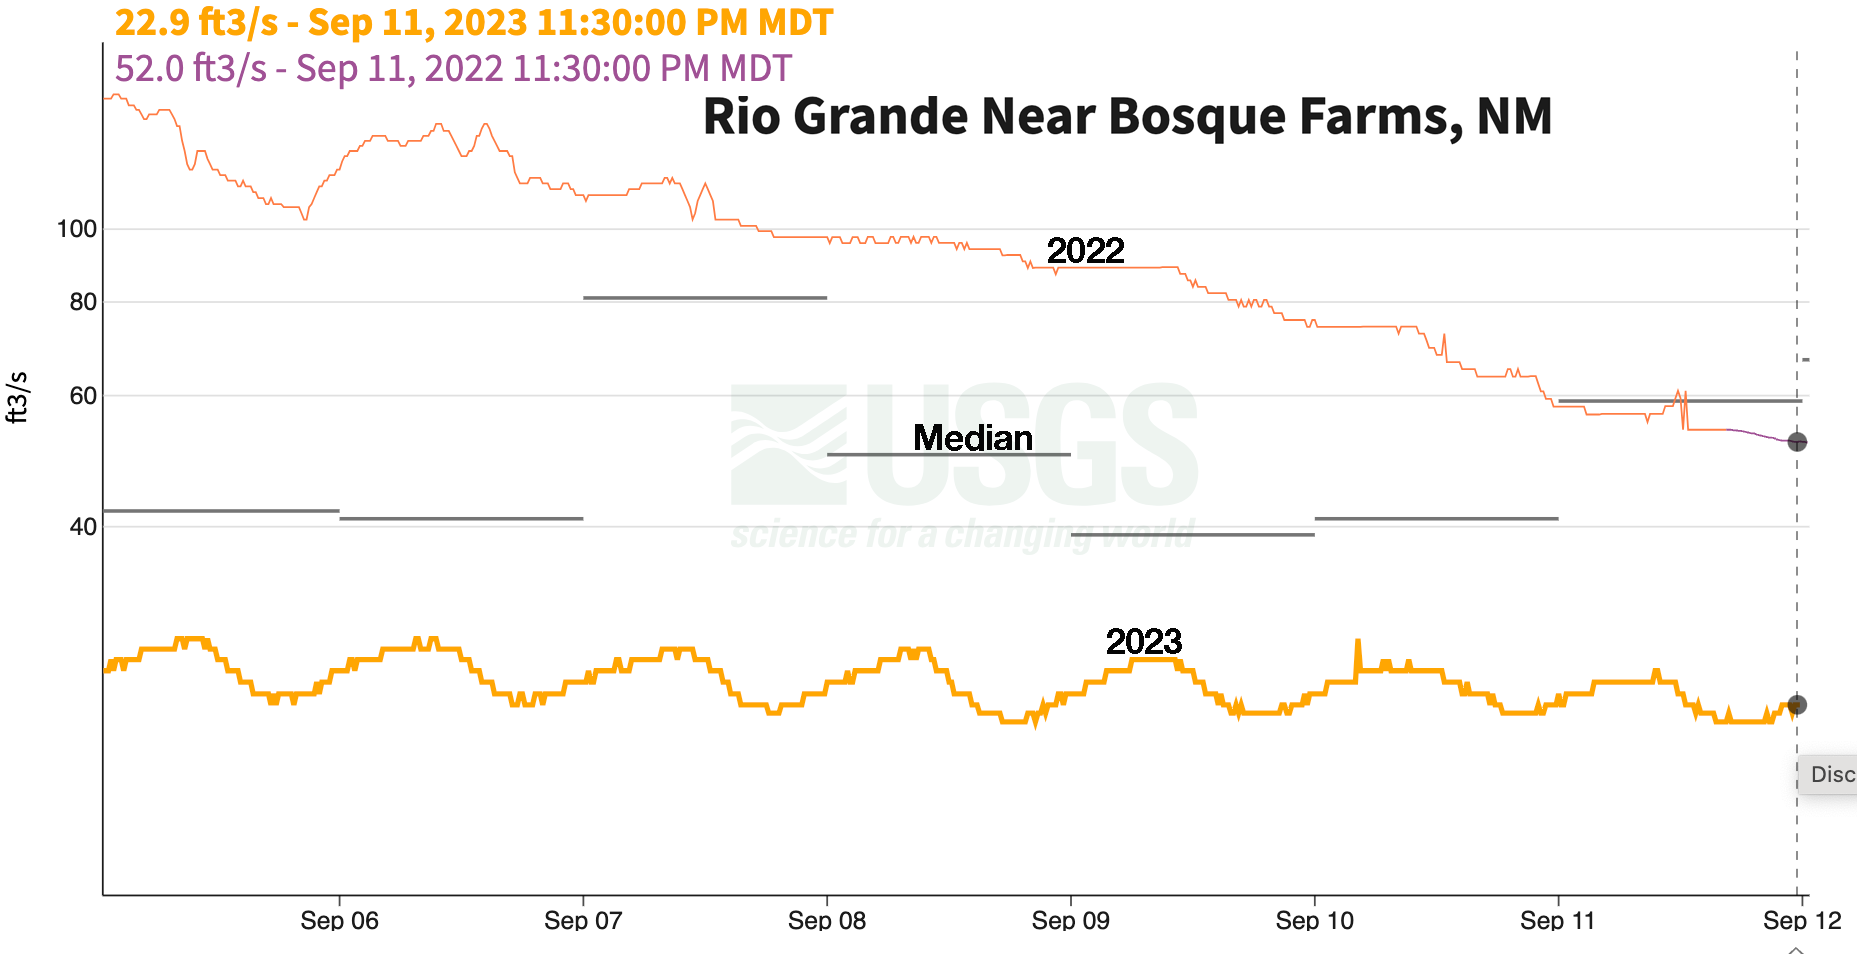
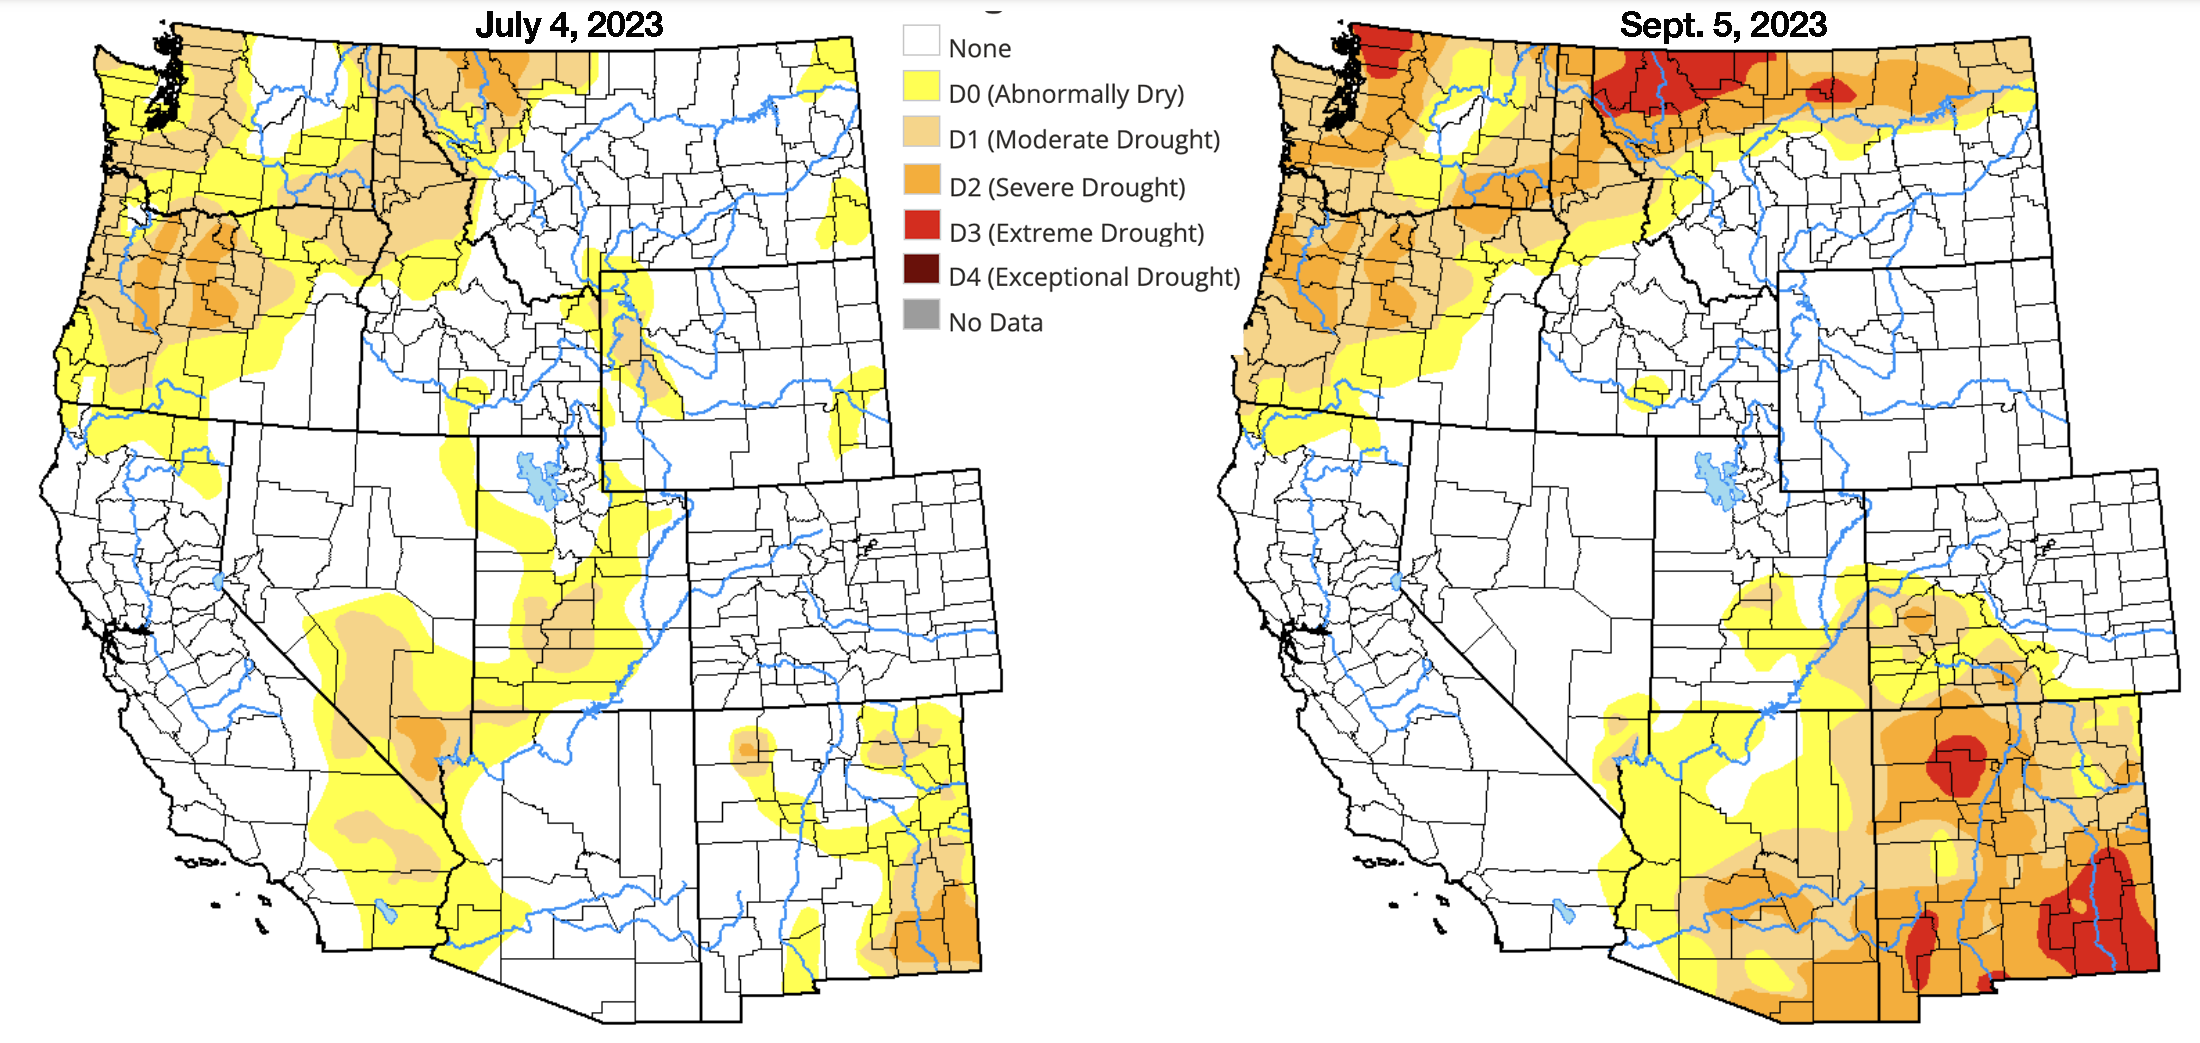
The southern San Juan Mountains and headwaters of the Rio Grande have received about 40% more precipitation than normal this water year. And yet the Rio is nearly dry through Albuquerque. In early July, about 44% of New Mexico was in moderate drought; today the entire state is gripped by drought, with 20% at extreme levels.
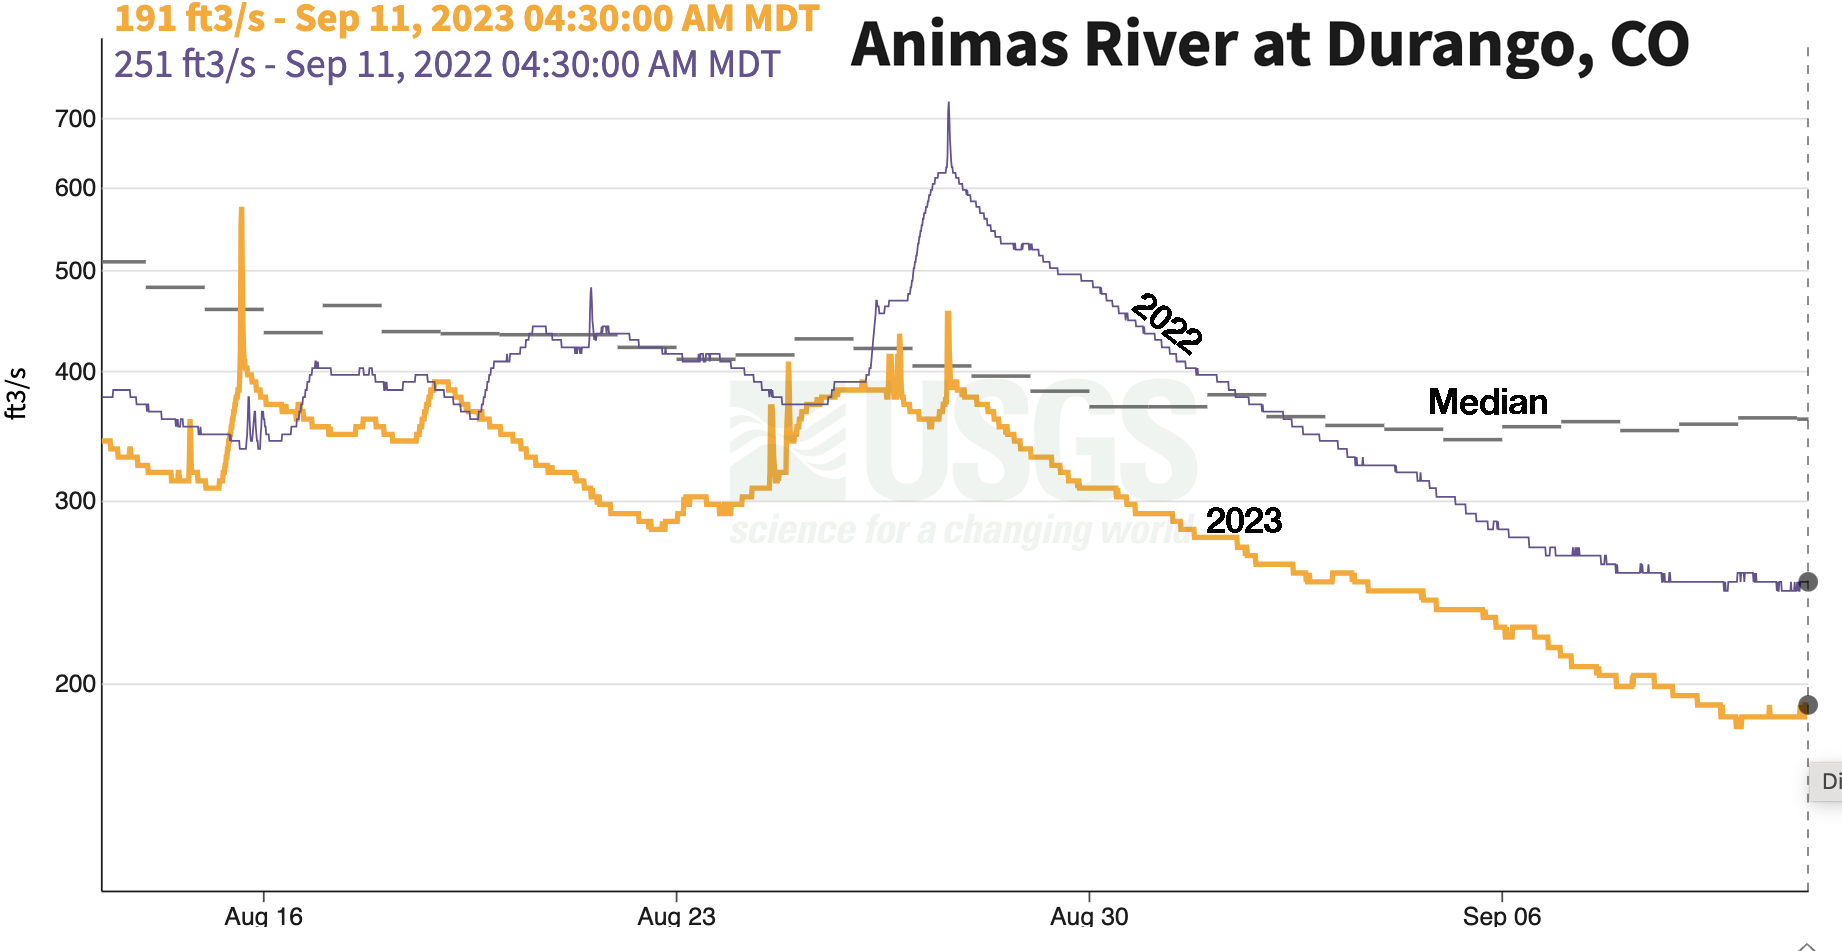
It’s a similar story on the Animas River in southwestern Colorado, which had its healthiest spring runoff in years, only to see flows drop below median levels in August and September as the monsoon failed to deliver its usual deluges. Inflows into Lake Powell were far above average this spring, but in August they were back down to the median levels and on a par with last year. The surface level is now sitting at about 3,573 feet above sea level. That’s a lot better than last year at this time (3,530), but still 43 feet below what it was on Sept. 12, 2019.
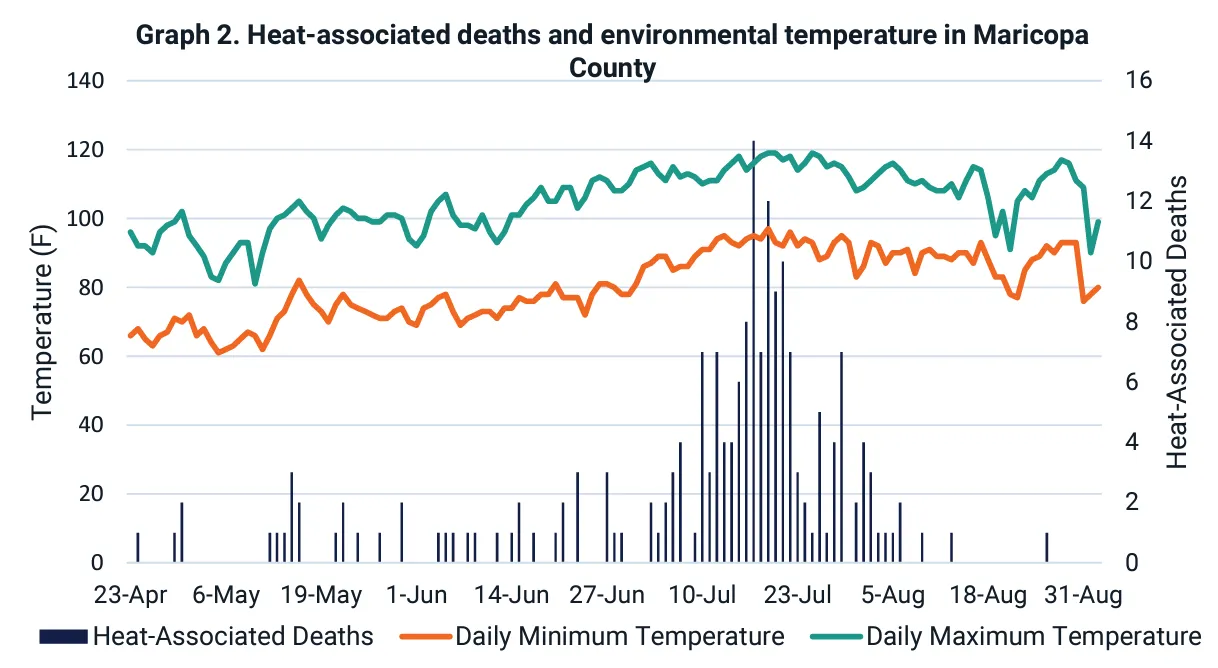
Phoenix’s high temperature has reached 110 degrees Fahrenheit or hotter on 55 days so far this year, breaking the 2020 record. And at least 194 people have died from heat-related causes in the metro area this year, with 351 fatalities still being investigated. Pikes Peak experienced its first snow of the year, with a few inches accumulating on top.
Things might get even crazier. Forecasters say there is a greater than 95% chance that the El Niño climate pattern will continue through the winter. Typically that means more moisture than normal for the Southwest, less for the Northwest, and about average in between. But what does “typical” even mean in these climate-crazy days, anyway?
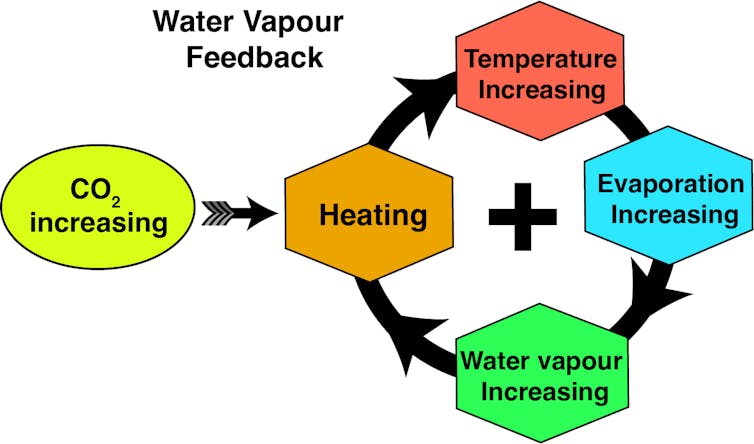
And it is. But not only because greenhouse gas emissions continue to rise. What we are also observing is the long-predicted water vapour feedback within the climate system.
Since the late 1800s, global average surface temperatures have increased by about 1.1℃, driven by human activities, most notably the burning of fossil fuels which adds greenhouse gases (carbon dioxide and methane) to the atmosphere.
As the atmosphere warms, it can hold more moisture in the form of water vapour, which is also a greenhouse gas. This in turn amplifies the warming caused by our emissions of other greenhouse gases.
Some people mistakenly believe water vapour is a driver of Earth’s current warming. But as I explain below, water vapour is part of Earth’s hydrological cycle and plays an important role in the natural greenhouse effect. Its rise is a consequence of the atmospheric warming caused by our emissions arising especially from burning fossil fuels.
Water vapour: the other greenhouse gas
For every degree Celsius in warming, the water-holding capacity of the atmosphere increases by about 7%. Record-high sea temperatures ensure there is more moisture (in the form of water vapour) in the atmosphere, by an estimated 5-15% compared to before the 1970s, when global temperature rise began in earnest.
Water vapour is a powerful greenhouse gas. Since the 1970s, its rise likely increased global heating by an amount comparable to that from rising carbon dioxide. We are now seeing the consequences.
In many ways, water vapour is the most important greenhouse gas as it makes Earth habitable. But human-induced climate change is primarily caused by increases in the long-lived greenhouse gases carbon dioxide, nitrous oxide, methane and chlorofluorocarbons (CFCs).
As a general rule, any molecule with three or more atoms is a greenhouse gas, owing to the way the atoms can vibrate and rotate within the molecule. A greenhouse gas absorbs and re-emits thermal (infrared) radiation and has a blanketing effect.
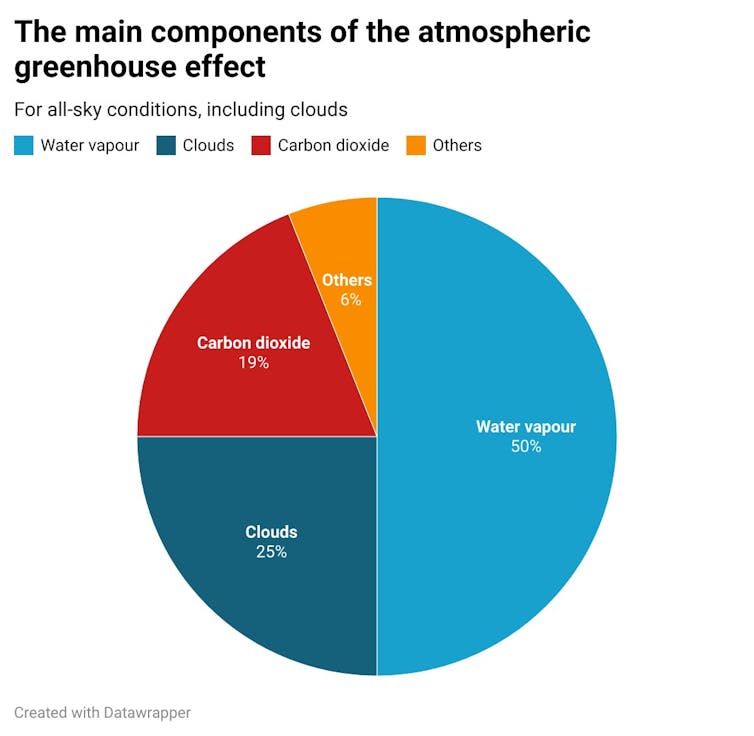
Clouds have a blanketing effect similar to that of greenhouse gases but they are also bright reflectors of solar radiation and act to cool the surface by day. In the current climate, for average all-sky conditions, water vapour is estimated to account for 50% of the total greenhouse effect, carbon dioxide 19%, ozone 4% and other gases 3%. Clouds make up about a quarter of the greenhouse effect.
Water vapour plays a significant role in Earth’s natural greenhouse effect, and it amplifies current, human-induced warming. Adapted from Trenberth (2022), CC BY-SA
Why is water vapour different?
The main greenhouse gases – carbon dioxide, methane, nitrous oxide and ozone – don’t condense and precipitate. Water vapour does, which means its lifetime in the atmosphere is much shorter, by orders of magnitude, compared to other greenhouse gases.
On average, water vapour only lasts nine days, while carbon dioxide stays in the atmosphere for centuries or even millennia, methane lasts for a decade or two and nitrous oxide a century. These gases serve as the backbone of atmospheric heating, and the resulting rise in temperature is what enables the observed increase in water vapour levels.
The rise in carbon dioxide doesn’t depend on weather. It comes primarily from the burning of fossil fuels. Atmospheric carbon dioxide has increased from pre-industrial levels of 280ppmv to 420ppmv (an increase of 50%) and about half of that increase has happened since 1985.
This accounts for about 75% of the anthropogenic heating from long-lived greenhouse gases. The rest of human-induced atmospheric warming mainly comes from methane and nitrous oxide, with offsets from pollution aerosols.
The extra heating from water vapour has been on a par with that from increased carbon dioxide since the 1970s.
The water vapour feedback: increased heating promotes increased evaporation and higher atmospheric temperatures, which in turn lead to higher levels of atmospheric water vapour. Author provided, CC BY-SA
Water vapour and the water cycle
Water vapour is the gaseous form of water and it exists naturally in the atmosphere. It is invisible to the naked eye, unlike clouds, which are composed of tiny water droplets or ice crystals large enough to scatter light and become visible.
The most common measure of water vapour in the atmosphere is relative humidity.
During heatwaves and warm conditions, this is what affects human comfort. When we sweat, the evaporation of moisture from our skin has a cooling effect. But if the environment is too humid, then this no longer works and the body becomes sticky and uncomfortable.
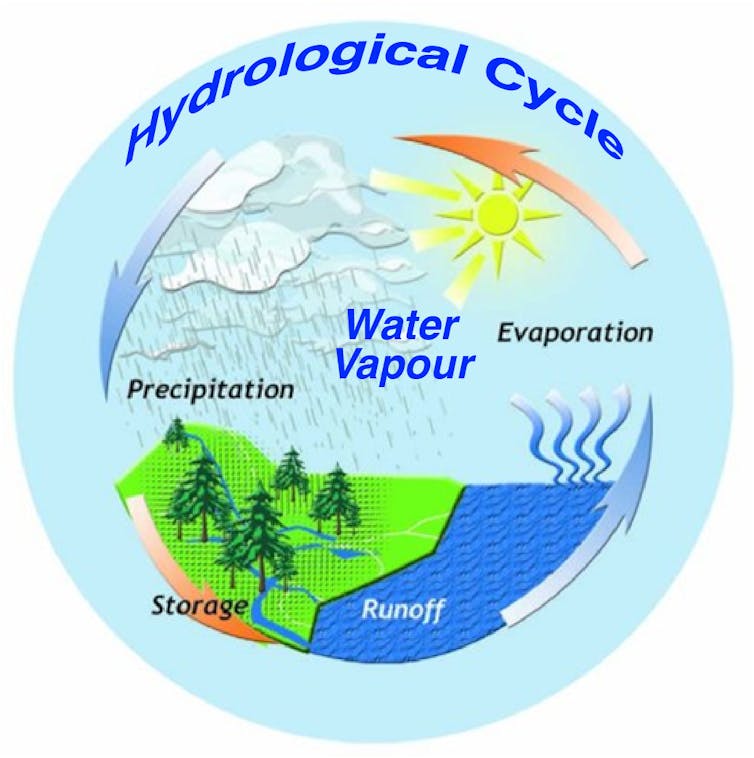
This process is important for our planet, too, because about 70% of Earth’s surface is water, predominantly ocean. Extra heat generally goes into evaporating water. Plants also release water vapour through a process called transpiration (releasing it through tiny stomata in leaves as part of photosynthesis). The combined process is called evapotranspiration.
Water vapour is part of Earth’s hydrological cycle, Author provided, CC BY-SA
The moisture rises into the atmosphere as water vapour. Storms gather and concentrate the water vapour so that it can precipitate. As water vapour has an exponential dependence on temperature, it is highest in warm regions, such as the tropics and near the ground. Levels drop off at cold higher latitudes and altitudes.
The expansion and cooling of air as it rises creates clouds, rain and snow. This vigorous hydrological cycle means water vapour molecules only last a few days in the atmosphere.
Water is the air conditioner of the planet. It not only keeps the surface cooler (albeit at the expense of making it moister) but rain also washes a lot of pollution out of the atmosphere to everyone’s benefit.
Precipitation is vitally important. It nourishes vegetation and supports various ecosystems as long as the rate is moderate. But as the climate warms, higher moisture levels increase the potential for heavier rainfall and the risk of flooding.
Moreover, the latent energy that went into evaporation is returned to the atmosphere, adding to heating and causing air to rise, invigorating storms and making weather extremes greater and less manageable.
These changes mean that where it is not raining, drought and wildfire risk increase, but where it is raining, it pours.