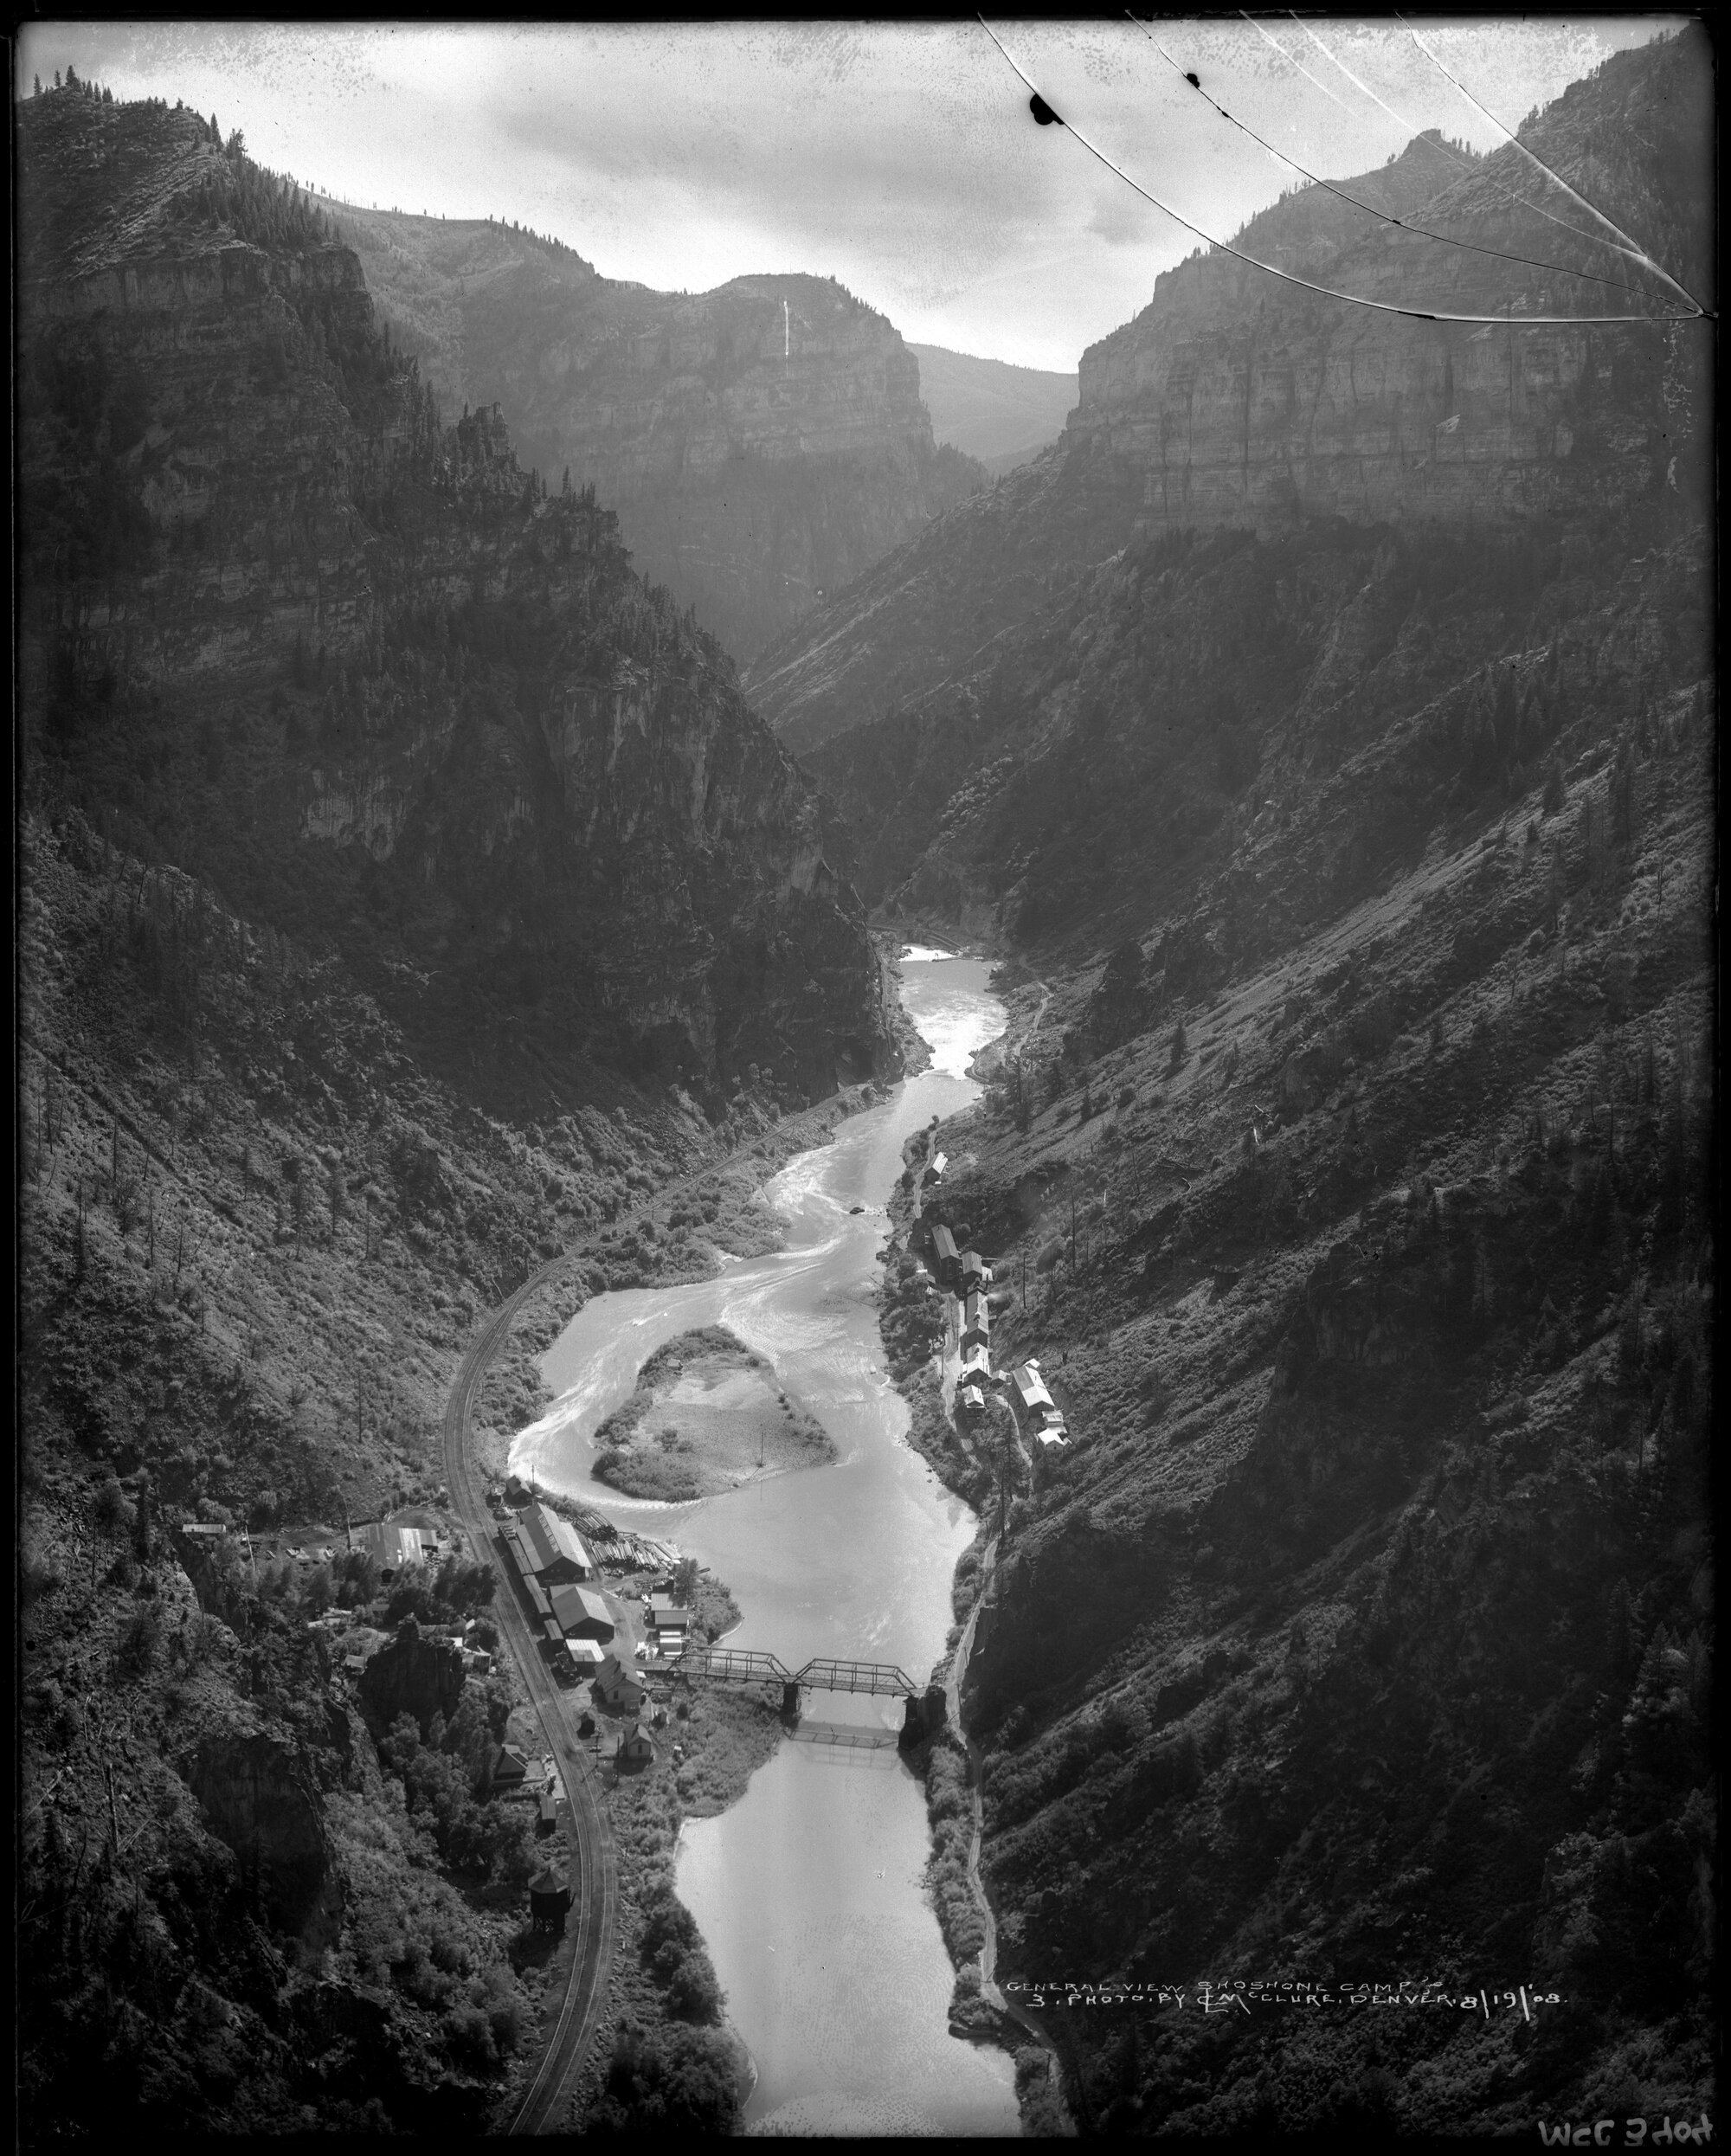
View of Shoshone Hydroelectric Plant construction in Glenwood Canyon (Garfield County) Colorado; shows the Colorado River, the dam, sheds, a footbridge, and the workmen’s camp. Creator: McClure, Louis Charles, 1867-1957. Credit: Denver Public Library Digital Collections
The San Miguel Board of County Commissioners (BOCC) voted on Wednesday, July 24, to sign onto the Western District (Colorado Counties) letter to preserve Shoshone water rights. The letter, addressed to Colorado Senators Michael Bennet and John Hickenlooper, is in support of the Colorado River Water Conservation District’s aim to acquire and permanently protect the Shoshone water rights. The Shoshone Power Plant, off Interstate 70 near Glenwood Springs, possesses the oldest senior water rights directly on the Colorado River in Colorado. The plant generates 15 megawatts of electricity. This flow from Shoshone is critical in helping avoid low water levels further down the river…
The Colorado River Water Conservation District has spent more than 20 years fighting to permanently preserve the Shoshone water flow along with a coalition of western Colorado governments and water entities.
At the end of 2023, the Colorado River Water Conservation District and Xcel Energy formalized an agreement for the district to buy water rights for the Shoshone Power Plant from Xcel if the group was able to secure $99 million in funding. The agreement is part of a decades-long effort to help establish stable water flows below the power plant and to the Utah border…With the agreement, Colorado River Water Conservation District will own the water rights and lease them back to Xcel to create hydroelectric power…Colorado River Water Conservation District is also working to ensure that Shoshone’s water stays in the river and is not diverted even when the power plant is not generating hydropower. The district is in negotiations with the Colorado Water Conservation Board. Even after reaching an agreement between the district, the board and Xcel Energy, the case will still have to go through court to legally update the water rights.
Water from the Roaring Fork River basin heading east out of the end of the Twin Lakes Tunnel (June 2016), which is operated by the Twin Lakes Reservoir and Canal Co., a member of the Front Range Water Council. Photo: Brent Gardner-Smith/Aspen Journalism
Click the link to read the article on the Aspen Daily News website (Austin Corona). Here’s an excerpt:
July 28, 2024
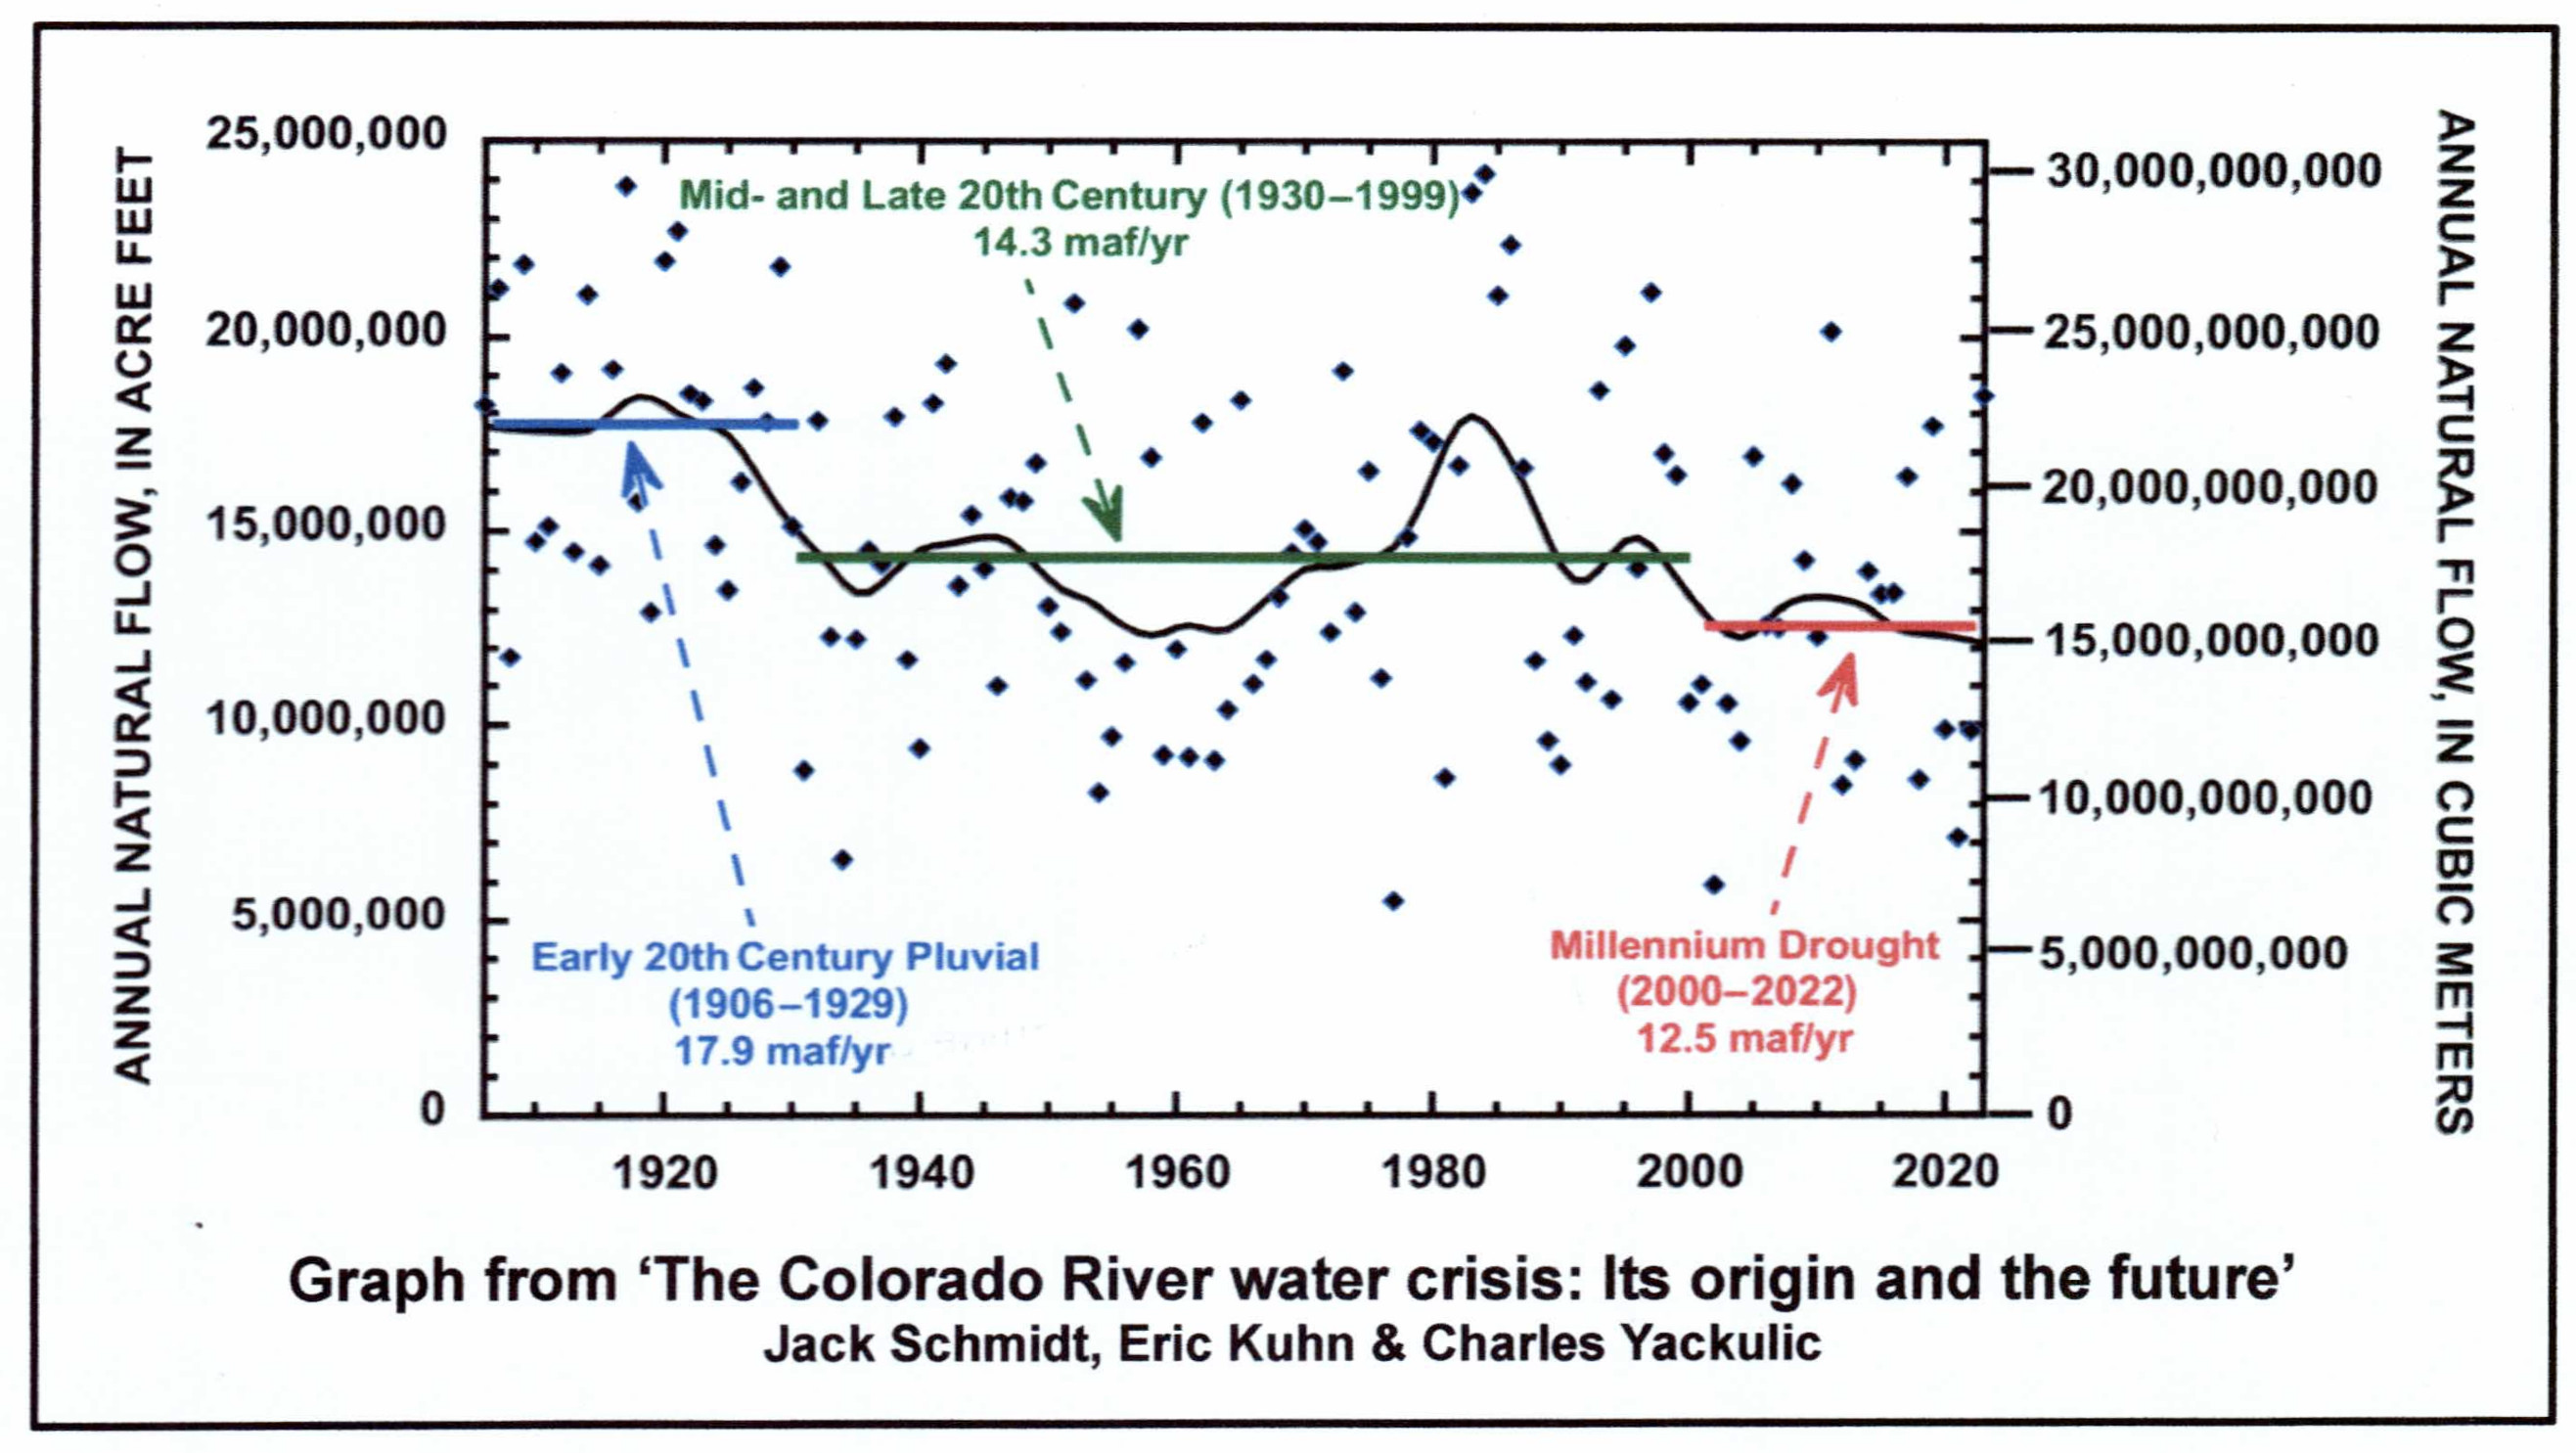
Two prominent water researchers and the state of Colorado disagree on the significance of new water use data published by the federal government in June. The state claims the data confirms its argument that headwaters states use less Colorado River water during dry years. Meanwhile, former Colorado River Water Conservation District general manager Eric Kuhn and Utah State University professor Jack Schmidt say the data paints a more complex picture.
“Reclamation has worked extremely hard to bring the best cutting-edge science they can to a better and more accurate estimate of agricultural water use,” Schmidt said. “It’s just that the relationships that arise from better data are just as murky.”
The June data details the “consumptive” water use by “Upper Basin” states (Colorado, New Mexico, Utah and Wyoming) since 1971. It is meant to quantify all the water those four states have consumed in that period (see footnote * at story’s end). The Bureau of Reclamation, the federal agency that manages most of the large dams on the Colorado River, has updated the data in five-year reports since 1971, but June’s report is different. This time, the bureau collected the data using a new methodology. The results are notable — past data seemed to indicate that Colorado and other Upper Basin states used more Colorado River water during dry years, directly contradicting Colorado’s arguments about its use. According to the state, the new data corrects that inconsistency. This conclusion could be vitally important for Upper Basin states. The relationship between the Upper Basin’s water use and the natural water supply is a central component of its position in interstate negotiations over the river…
Located at the river’s headwaters, Colorado and other Upper Basin states argue that they already take “natural” water cuts in dry years. Without a large upstream reservoir to fall back on, these states say they rely heavily on yearly precipitation for their water supply, meaning drought years are already tough…The argument foundered on the fact that the reclamation bureau’s consumptive use data didn’t support it. In 2022, three notable water researchers — Kuhn, Schmidt and University of New Mexico professor John Fleck — published a blog post laying out the disconnect between the federal government’s numbers and Colorado’s claims. In their piece, the three researchers wrote that while certain parts of the Upper Basin certainly cut their use in dry years, the basin’s overall use did not reflect that anecdotal reality…
*** One way for the Upper Basin states to make their case stronger is to change the way the Bureau of Reclamation accounts for consumptive use in transmountain diversions, or TMDs — the tunnels that carry water from inside the Colorado River Basin to cities and farms outside the basin (there are two that take water out of the Roaring Fork watershed and send it to the Front Range). There is a gray area in which the actual “consumption” takes place for TMDs that have storage reservoirs at their intakes. Colorado and Upper Basin states would like to say consumption occurs when they take water from the river system and put it in the reservoirs while the reclamation bureau currently sees consumption occurring when the water leaves the reservoir and enters the tunnel. Using the Upper Basin states’ preferred method, the basin’s consumptive use changes to 4.5 million acre-feet in wet years, 4.1 in average years and 3.9 in dry years, making a much stronger case for the argument that the basin uses less in dry years.
In certain parts of the city, Denver residents face temperatures up to twelve degrees higher than they should be, according to the Urban Heat Island index released this month. The index from Climate Central estimates how much additional heat different areas experience based on their built environments. On average, Denver is 7.84 Fahrenheit degrees hotter than air temperatures just outside of the city, according to the index, with the temperature boosts ranging from as high as 12.5 degrees to as low as 4.9 degrees per census block group — more than a seven-degree difference. By neighborhood, the averages range from 10.95 to 5.50 degrees hotter. The index analyzes 65 major cities across the country, with Denver ranking 48th for overall average temperature increase. However, the Mile High City jumps to 17th place for most residents living in areas that are at least nine degrees warmer. Over 49,000 Denver residents live in such areas, according to the index…
All five of Denver’s hottest neighborhoods are located downtown and border one another. The top three coolest neighborhoods are all on the far northeastern edge of the city, nearing Aurora and Commerce City. The only centrally located neighborhood to crack the top-coolest list houses the 160-acre Washington Park. The Urban Heat Island index estimates that Denver’s temperature increases by census block groups. Westword combined the data for each of the city’s 78 neighborhoods, averaging the temperatures of the census block groups as they fall within neighborhood boundaries. Here are the top five hottest and coolest neighborhoods in Denver, so you know where to seek relief during the next heat wave:
Hottest Neighborhoods
5. Civic Center 9.13 degrees hotter Bounded by West Colfax Avenue to the north, Broadway to the east, and Speer Boulevard to the southwest. Includes the Denver Art Museum and part of Civic Center Park featuring the City and County Building.
4. North Capitol Hill 9.66 degrees hotter Bounded by East 20th Avenue to the north, Park Avenue and North Downing Street to the east, East Colfax Avenue to the south, and Broadway to the west. Includes the Fillmore Auditorium and the Cathedral Basilica of the Immaculate Conception.
3. Auraria 9.70 degrees hotter Bounded by Cherry Creek to the northeast, West Colfax Avenue to the south, and the South Platte River to the northwest. Includes the Auraria campus, housing the University of Colorado Denver, Community College of Denver and Metropolitan State University.
2. Central Business District 10.85 degrees hotter Bounded by 20th Street to the northeast, Broadway to the east, West Colfax Avenue to the south, Cherry Creek to the west, and Lawrence Street to the northwest. Includes the Colorado Convention Center and part of the 16th Street Mall.
1. Union Station 10.95 degrees hotter Bounded by 20th Street to the northeast, Lawrence Street to the southeast, Cherry Creek to the southwest, and the South Platte River to the northwest. Includes Union Station, Commons Park and part of the 16th Street Mall.
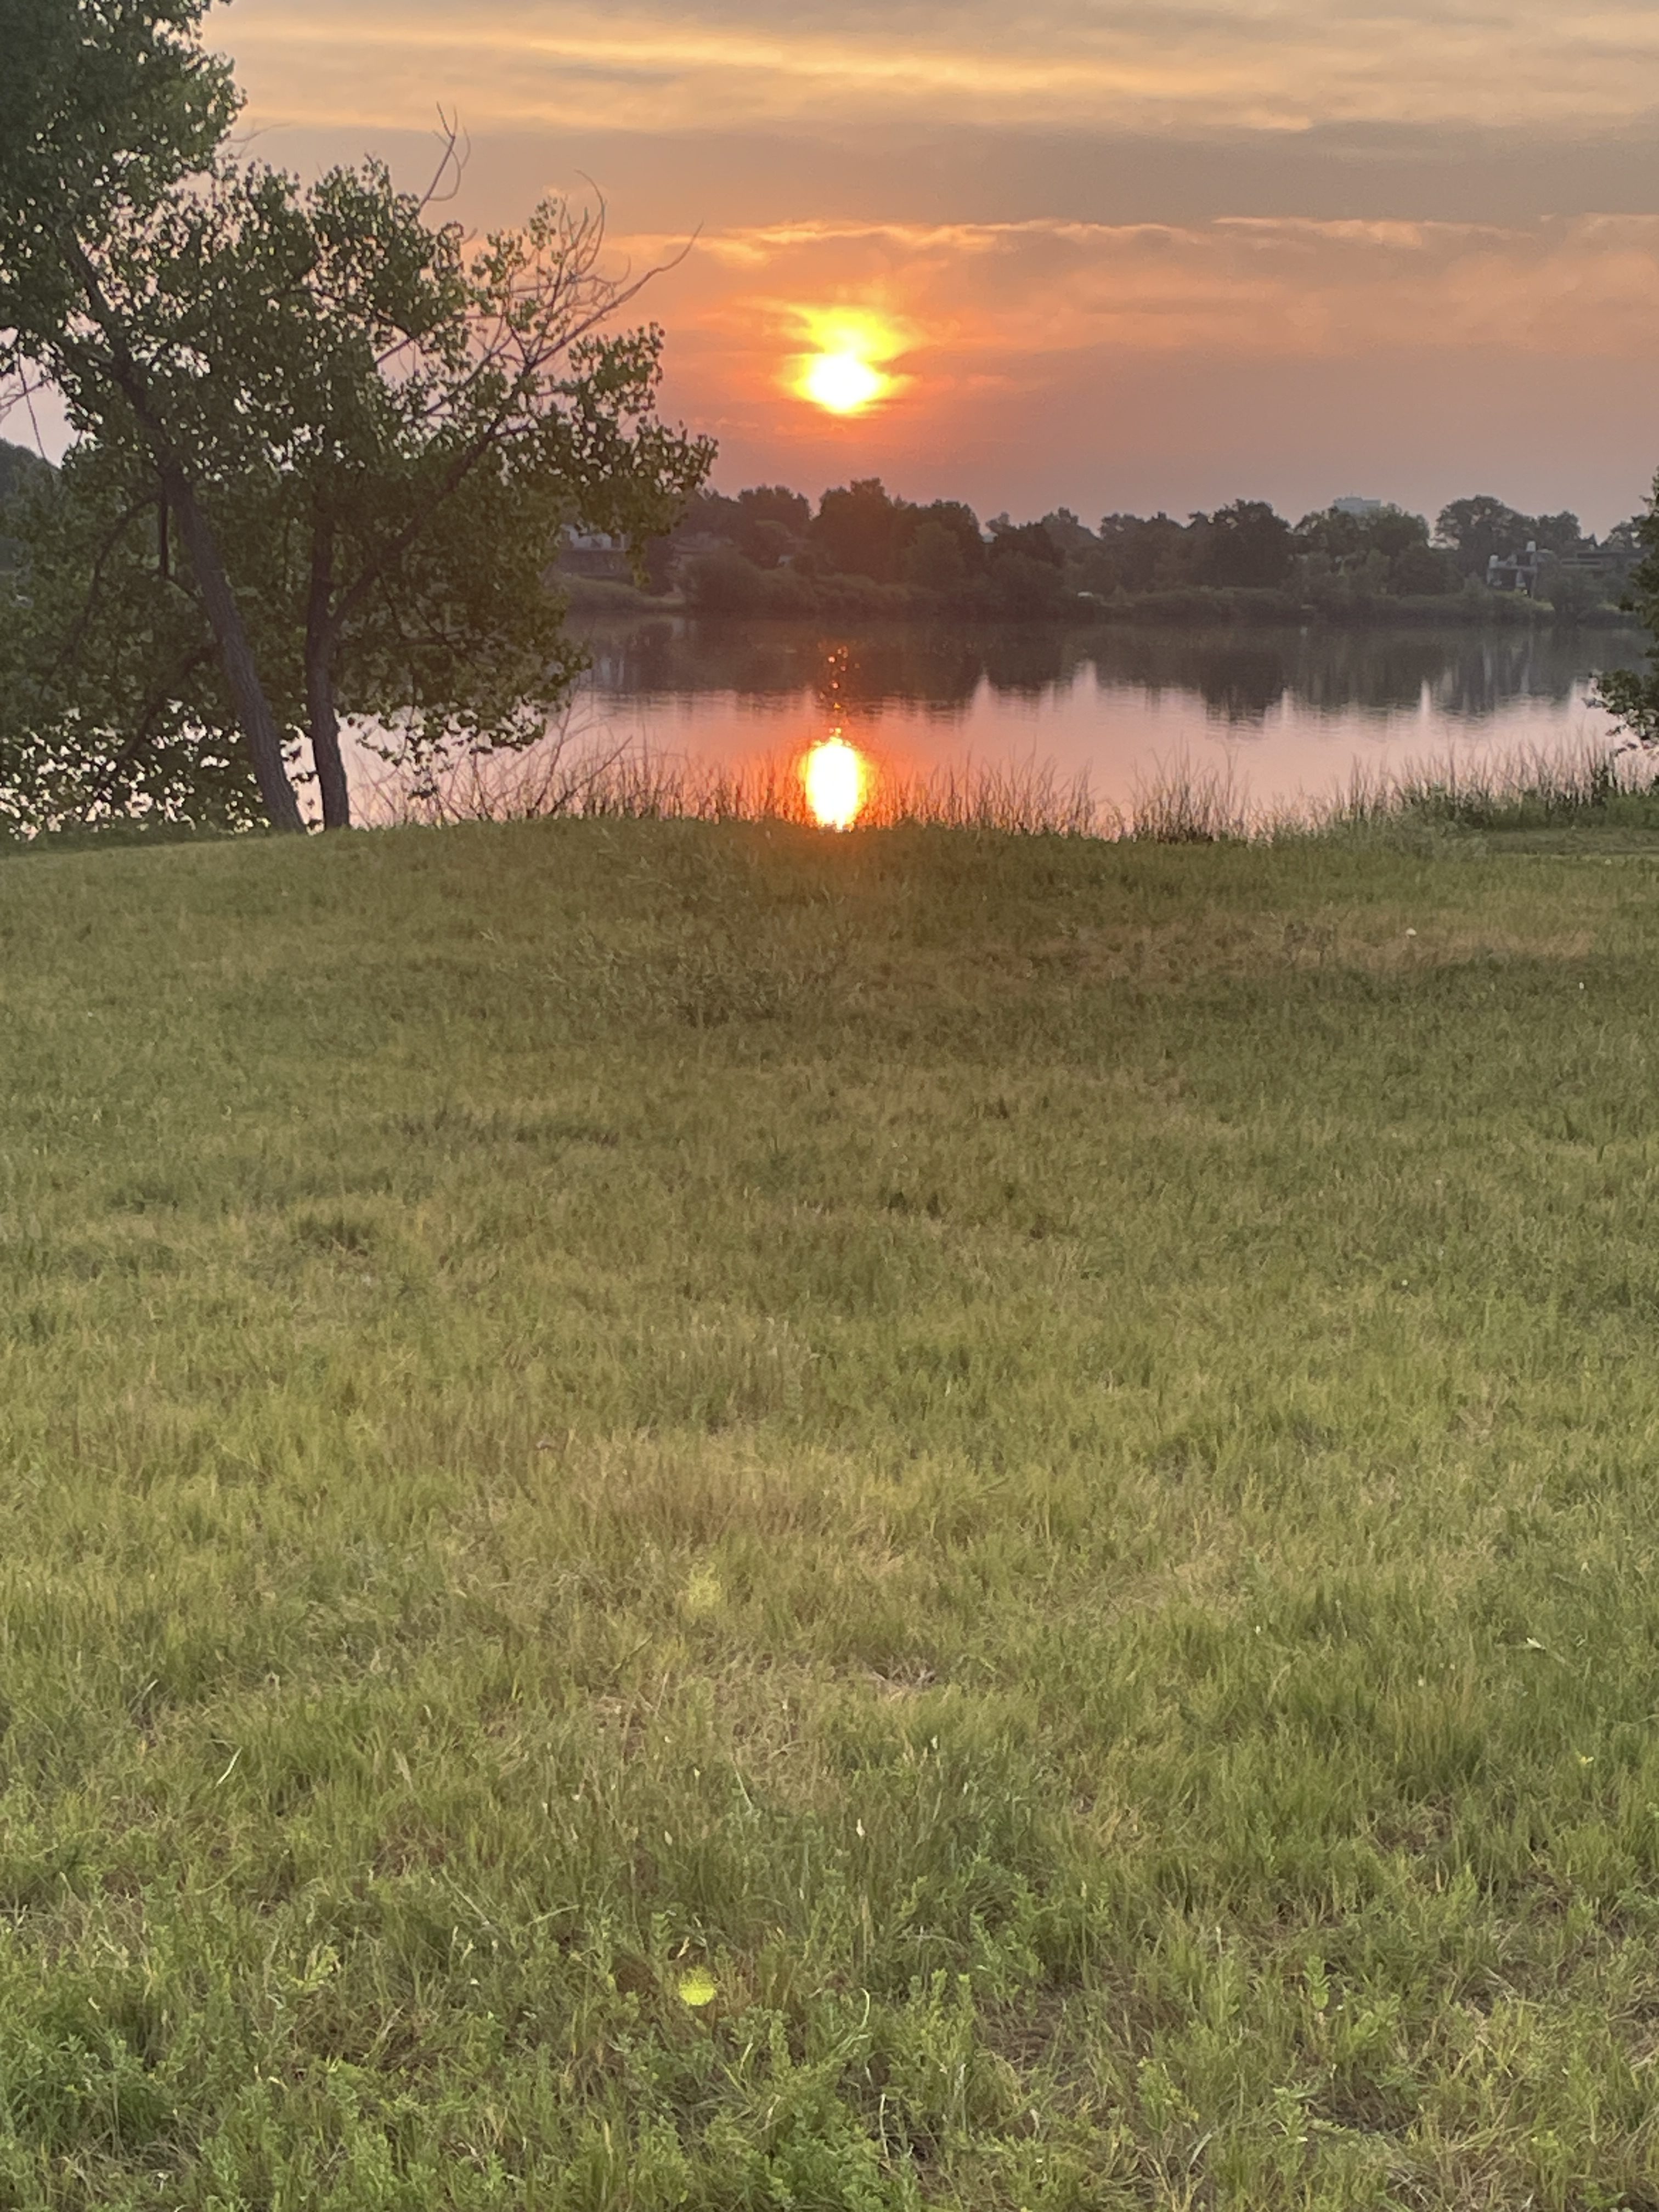
Sunrise over Sloan’s Lake in Denver July 27, 2024. Wildfire smoke creating the colors.
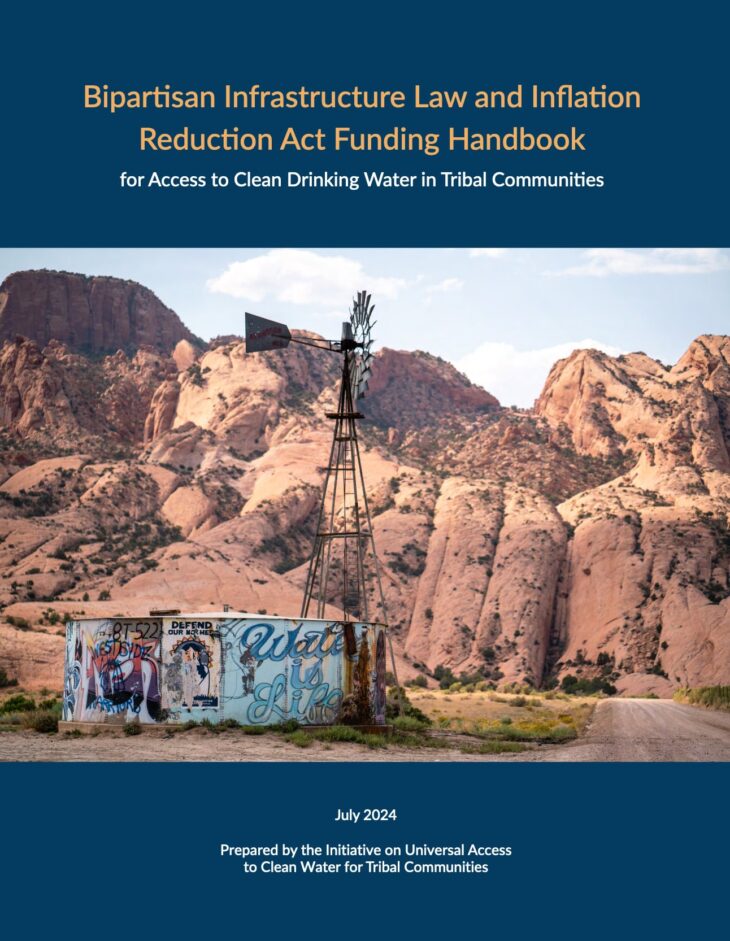
Bipartisan Infrastructure Law and Inflation Reduction Act Funding Handbook
Click the link to read the article on the InkStain website (John Fleck):
Congress set aside substantial sums of money in 2021 and ’22 in the Bipartisan Infrastructure Law and the Inflation Reduction Act to address needs for access to safe, clean drinking water. But, as John Echohawk puts it:
“While the appropriation of funding for infrastructure is a critical first step, it is only that – continuing and concerted efforts must be made to ensure that Tribal communities are able to access and deploy this funding and that meaningful gains are made in reducing the water access gap in Indian country.”
Echohawk makes those comments in the introduction to the new Handbook from the Universal Access to Clean Water for Tribal Communities project, out today. The challenge now is for Tribal communities to navigate the complexities of federal funding process which are, to see the least, a significant challenge.
We’ve written about this challenge before in this space – a staggering 48 percent of tribal homes, according to the Universal Access project’s analysis, lack access to reliable water sources, clean drinking water, or basic sanitation. Money helps, but getting the money to the communities that might benefit requires negotiating a maze of federal process.
The new handbook (link to the handbook and a summary document here) outlines the many different pathways and requirements to translate Congressional intent to water projects on the ground.
The report is crucial for helping move down the path. Also, bonus points to the team that put it together for the stunning Tara Kerzhner photos.
Reclamation will be fulfilling a request to release the first block of the Jicarilla Apache Nation (JAN) subcontracted water that has been leased to the New Mexico Interstate Stream Commission (NMISC) and The Nature Conservancy (TNC) for calendar year 2024.
The subcontracted water released from the Navajo Unit will augment the current release of 700 cfs by 250 cfs (for a total of 10 days) and 500 cfs (for a total of 5 days) as requested by the NMISC and TNC. The table below shows the release schedule. Any changes to this schedule will be sent out in subsequent notices. The total volume of JAN subcontracted water for this release is 10,000 acre-feet. An additional 10,000 acre-feet will be released later this calendar year with the same augmentation pattern.
Date
Day
4:00 AM Release (cfs)
7/31/2024
Wed
950
8/1/2024
Thu
950
8/2/2024
Fri
950
8/3/2024
Sat
950
8/4/2024
Sun
950
8/5/2024
Mon
1200
8/6/2024
Tue
1200
8/7/2024
Wed
1200
8/8/2024
Thu
1200
8/9/2024
Fri
1200
8/10/2024
Sat
950
8/11/2024
Sun
950
8/12/2024
Mon
950
8/13/2024
Tue
950
8/14/2024
Wed
950
Following this operation, the release will return to 700 cfs, or whatever is required to maintain the target baseflow through the endangered fish critical habitat reach of the San Juan River (Farmington to Lake Powell). The San Juan River Basin Recovery Implementation Program recommends a target base flow of between 500 cfs and 1,000 cfs through the critical habitat area. The target base flow is calculated as the weekly average of gaged flows throughout the critical habitat area from Farmington to Lake Powell.
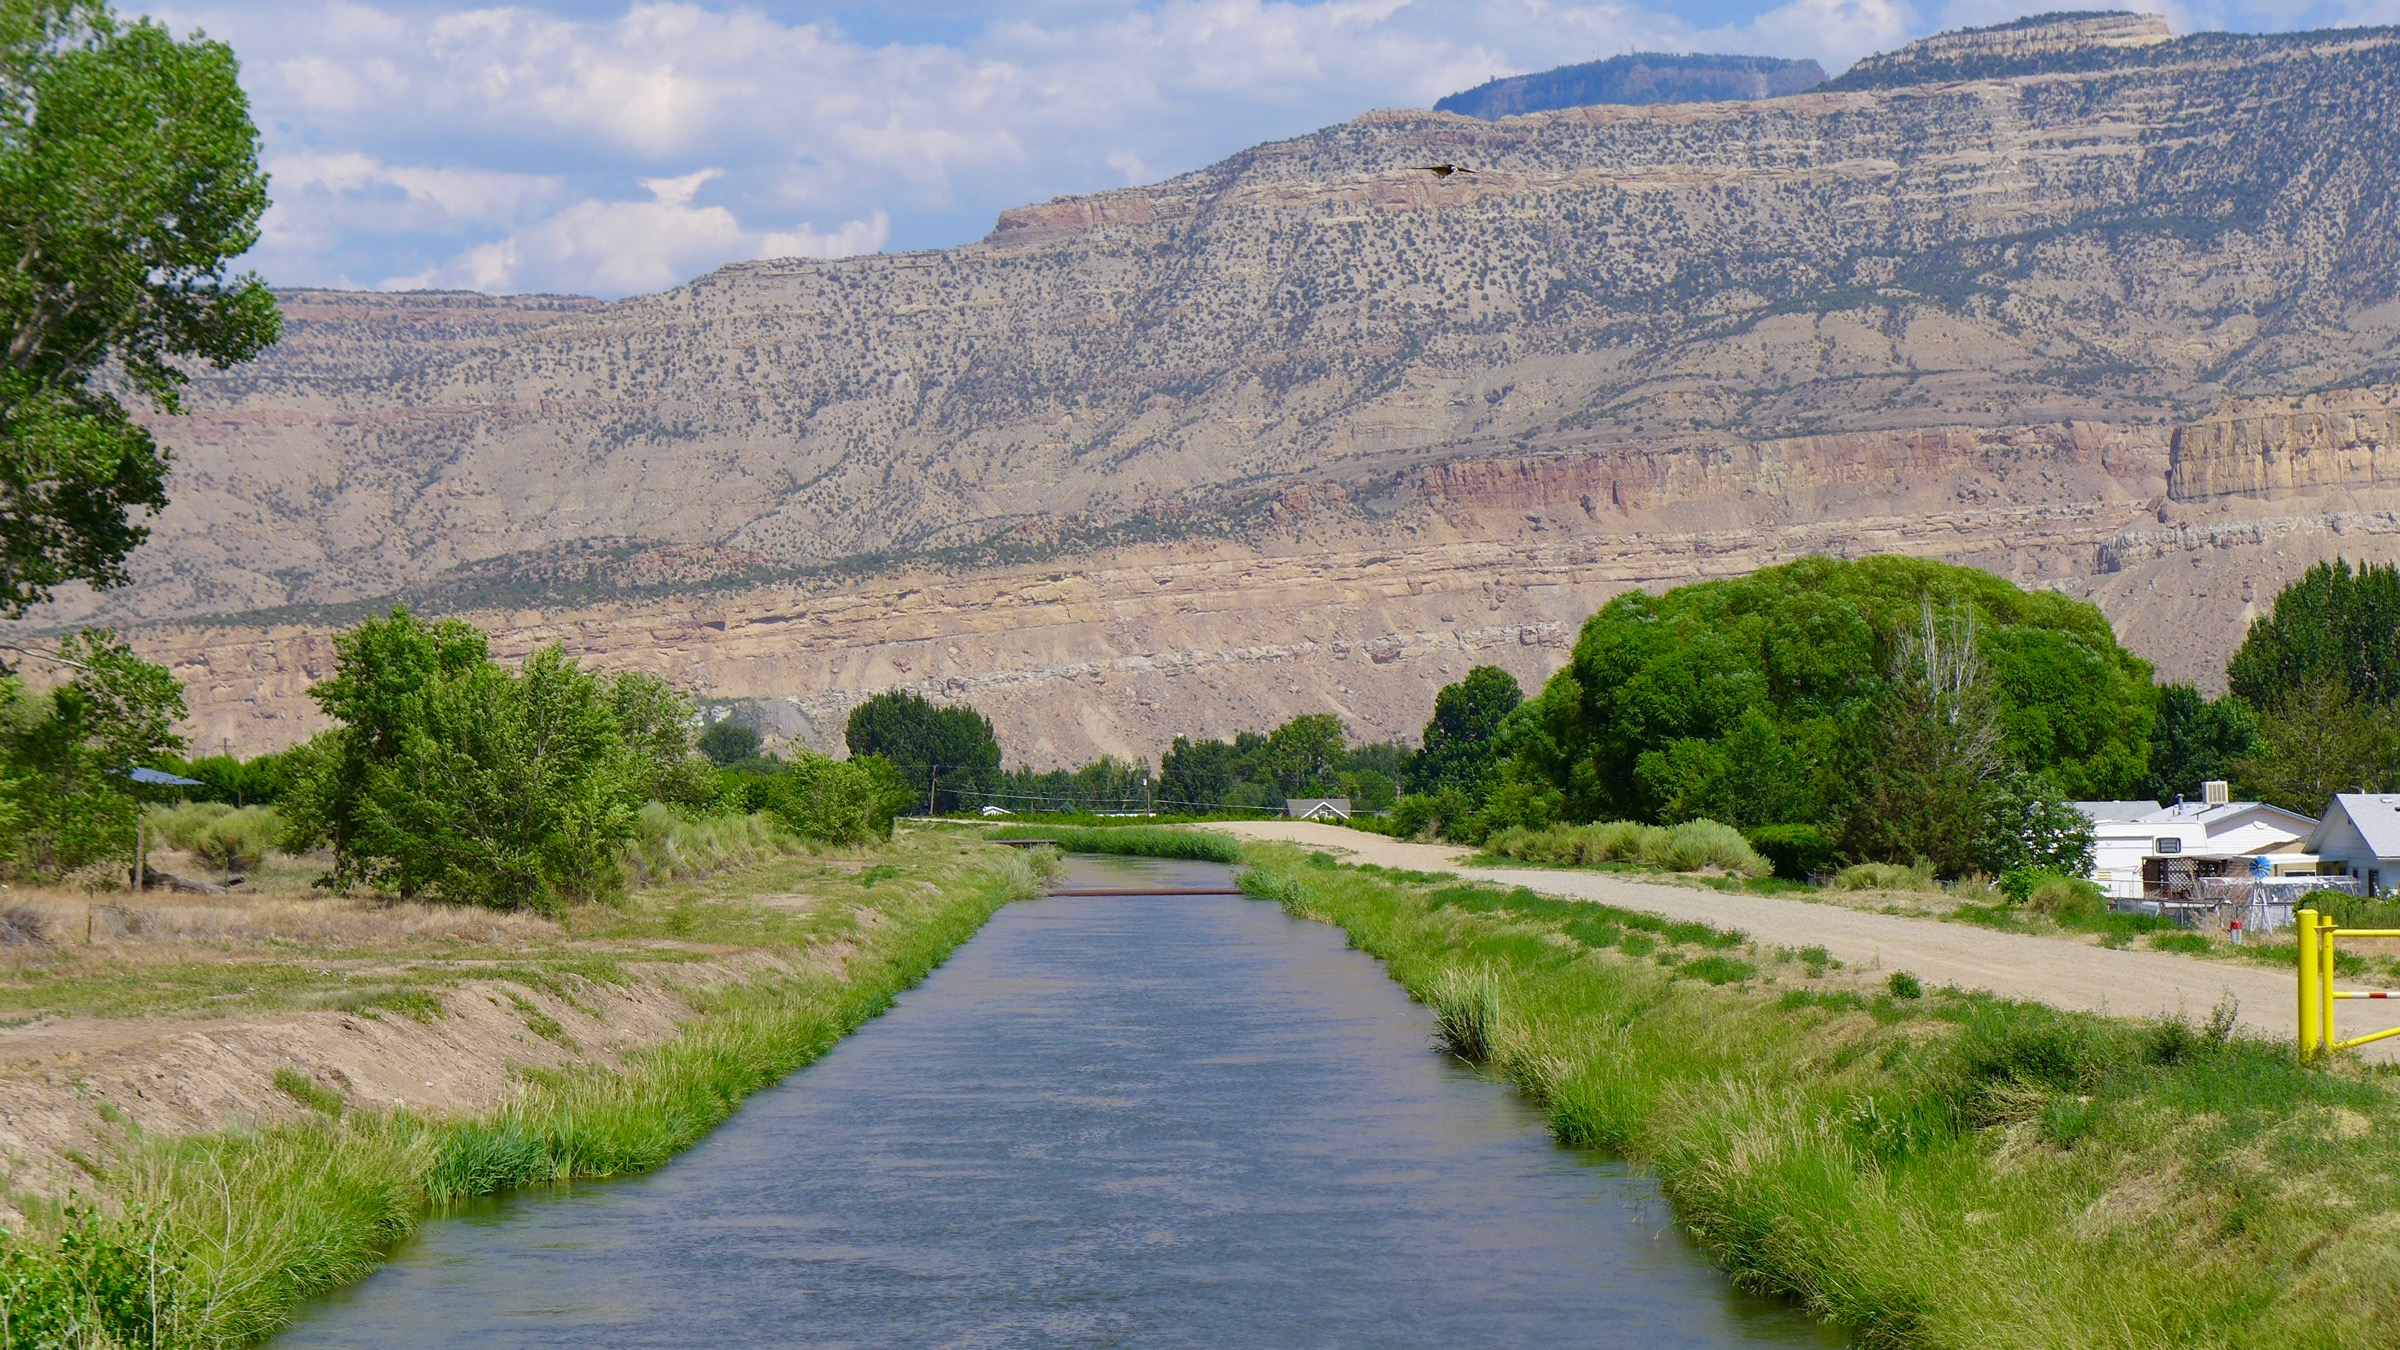
Colorado Parks and Wildlife isn’t wasting any time since the detection of zebra mussel veligers (larva stage) in the Colorado River and Government Highline Canal in Mesa County in getting the word out to boaters to clean, drain and dry their boats after being in the river. A mobile waterless boat cleaning station made by the company CD3 is now parked in Palisade’s Riverbend Park near Harky’s Launch Boat Ramp. CPW also has a stationary cleaning station at the Loma Boat Ramp.
“We started rolling out our education plan for zebra mussels and this is on top of all the sampling and things we’re doing as well,” said Northwest Region Public Information Officer Rachael Gonzales. “We are, throughout the Grand Valley, taking out our CD3, which is our waterless (boat cleaning station).”
The waterless cleaning stations have compressed air and a vacuum to help people clean smaller watercraft like kayaks and paddleboards, Gonzales said. There is a more elaborate system at Highline Lake State Park that uses hot water, but is intended for larger craft with motors. This year, Highline Lake is only allowing non-motorized craft. CPW shut down Highline to boaters after the decision was made to drain down the lake to attempt to eradicate its mussels infestation. Previous efforts using chemicals were unsuccessful after mussels were first discovered in Highline Lake in the fall of 2022. In addition to the new watercraft cleaning stations, Gonzales said CPW will have people out around the valley talking one-on-one with boaters and people using the river to explain the importance of cleaning everything from boats to fishing gear that go into the Colorado River.
At the July 11 meeting of the Upper Arkansas Water Conservancy District, the board of directors selected Gregory W. Felt to become the District’s next general manager. Felt will assume this position on January 1, 2025. He will be replacing long-time manager Ralph “Terry” Scanga, who is retiring at the end of 2024, and will be only the third general manager of the UAWCD in its 45-year history. Founded in 1979, the District serves the Upper Arkansas Basin by protecting water rights and working to maintain and increase the beneficial use of water in the basin.
Felt, an 18-year member of the Board of Directors, arrived in Chaffee County in 1985 to work as a guide on the Arkansas River. He earned a bachelor’s degree from Yale University while guiding rafting and fishing trips each summer. Felt and his wife Susan went on to start their own rafting company, Canyon Marine, and to co-found ArkAnglers with Rod and Connie Patch. His early years in business led Felt to take a strong interest in the hydrology and water management of the river.
John Brumwell MayallOBE (29 November 1933 – 22 July 2024) was an English blues and rock musician, songwriter and producer. In the 1960s, he formed John Mayall & the Bluesbreakers, a band that has counted among its members some of the most famous blues and blues rock musicians. A singer, guitarist, harmonica player, and keyboardist, he had a career that spanned nearly seven decades, remaining an active musician until his death aged 90. Mayall has often been referred to as the “godfather of the British blues“, and was inducted into the Rock and Roll Hall of Fame in the musical influence category in 2024…
Mayall died at his home in California on 22 July 2024, at the age of 90.
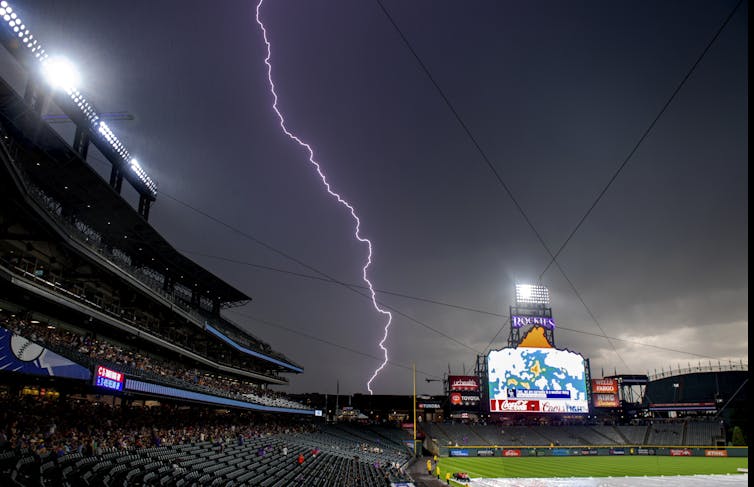
As the weather warms, people spend more time outdoors, going to barbecues, beaches and ballgames. But summer isn’t just the season of baseball and outdoor festivals – it’s also lightning season.
For as often as lightning occurs – there are only a few days each year nationwide without lightning – there are still a lot of misunderstandings about nature’s largest spark. Because of this, a lot of people take unnecessary risks when thunderstorms are nearby.
I am a meteorologist who studies lightning and lightning safety, and a member of the National Lightning Safety Council. Here are some fast facts to keep your family and friends safe this summer.
What is lightning, and where does it come from?
Lightning is a giant electric spark in the atmosphere and is classified based on whether it hits the ground or not.
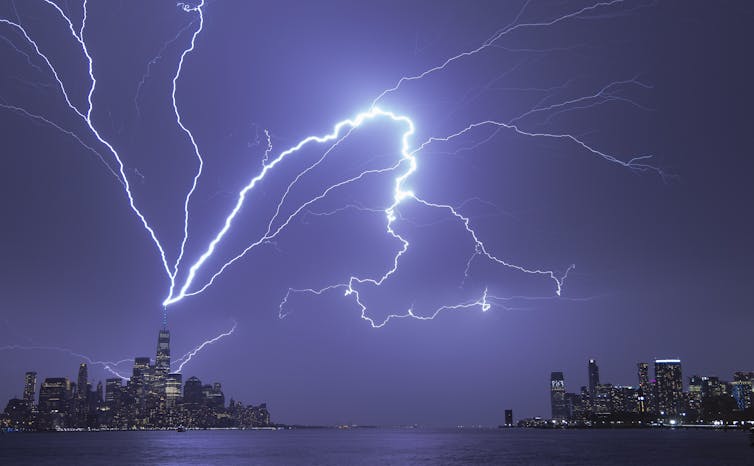
In-cloud lightning is any lightning that doesn’t hit ground, while cloud-to-ground – or, less commonly, ground-to-cloud – is any lightning that hits an object on the ground. Cloud-to-ground lightning accounts for only 10% to 50% of the lightning in a thunderstorm, but it can cause damage, including fires, injuries and fatalities, so it is important to know where it is striking.
Lightning strikes One World Trade Center in New York City and carries through clouds over the Hudson River in April 2023. Gary Hershorn/Getty Images
When these precipitation particles collide, they exchange electrons, which creates an electric charge in the cloud. Because most of the electric charge exists in the clouds, most lightning happens in the clouds. When the electric charge in the cloud is strong, it can cause an opposite charge to build up on the ground, making cloud-to-ground lightning possible. Exactly what initiates a strike is still an open question.
When and where does lightning happen?
Lightning can happen any time the conditions for thunderstorms – moisture, atmospheric instability, and a way for air to rise – are present.
There is a seasonality to lightning: Most lightning in the United States strikes in June, July or August. In just those three months, more than 60% of the year’s lightning typically occurs. Lightning is least common in winter, but it can still happen. About 2% of yearly lightning occurs during winter.
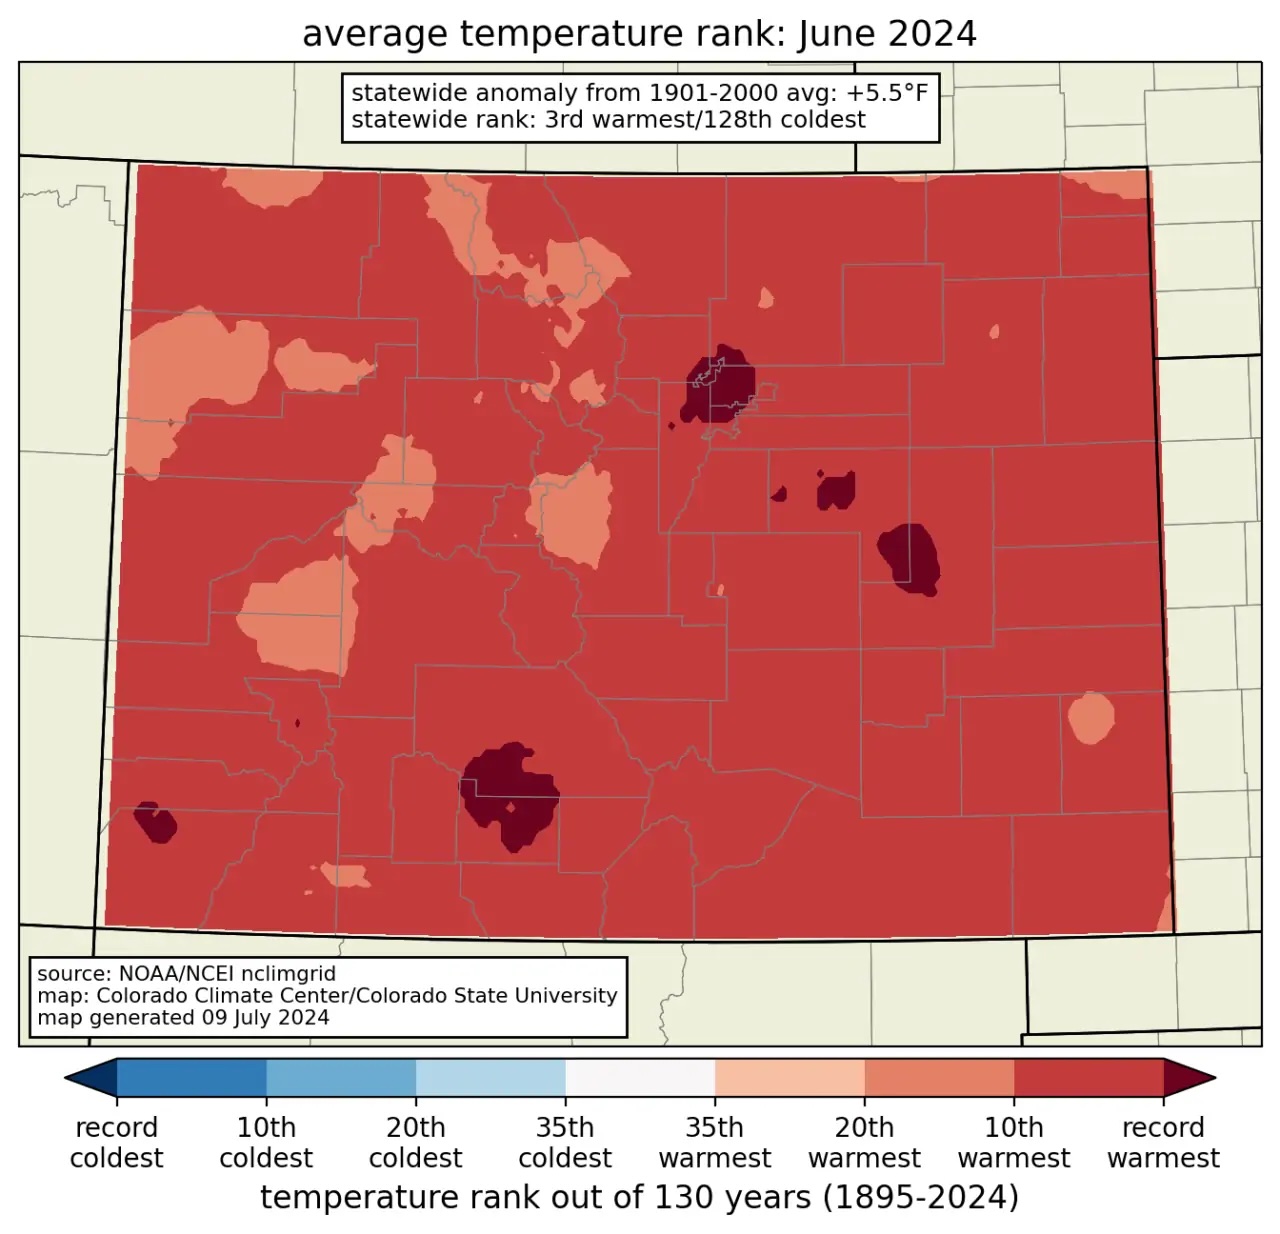
Leading up to the weekend of July 12-14, weather forecasts were indicating the potential for extreme heat in parts of Colorado. I was getting messages from people saying that their weather apps were showing that all-time records would be broken by multiple degrees (which mostly warranted an eye-roll.) On both Saturday the 13th and Sunday the 14th, there were just enough afternoon clouds and showers to keep the temperatures from reaching historic highs. But it was still a noteworthy heat wave, especially along the Front Range. Fort Collins reached a high of 102°F on Friday the 12th, one degree shy of the all-time record, and only the 7th time in over 130 years of records it had been that warm. That same day, Colorado Springs reached 100°F for only the 12th time, also one degree shy of the all-time record.
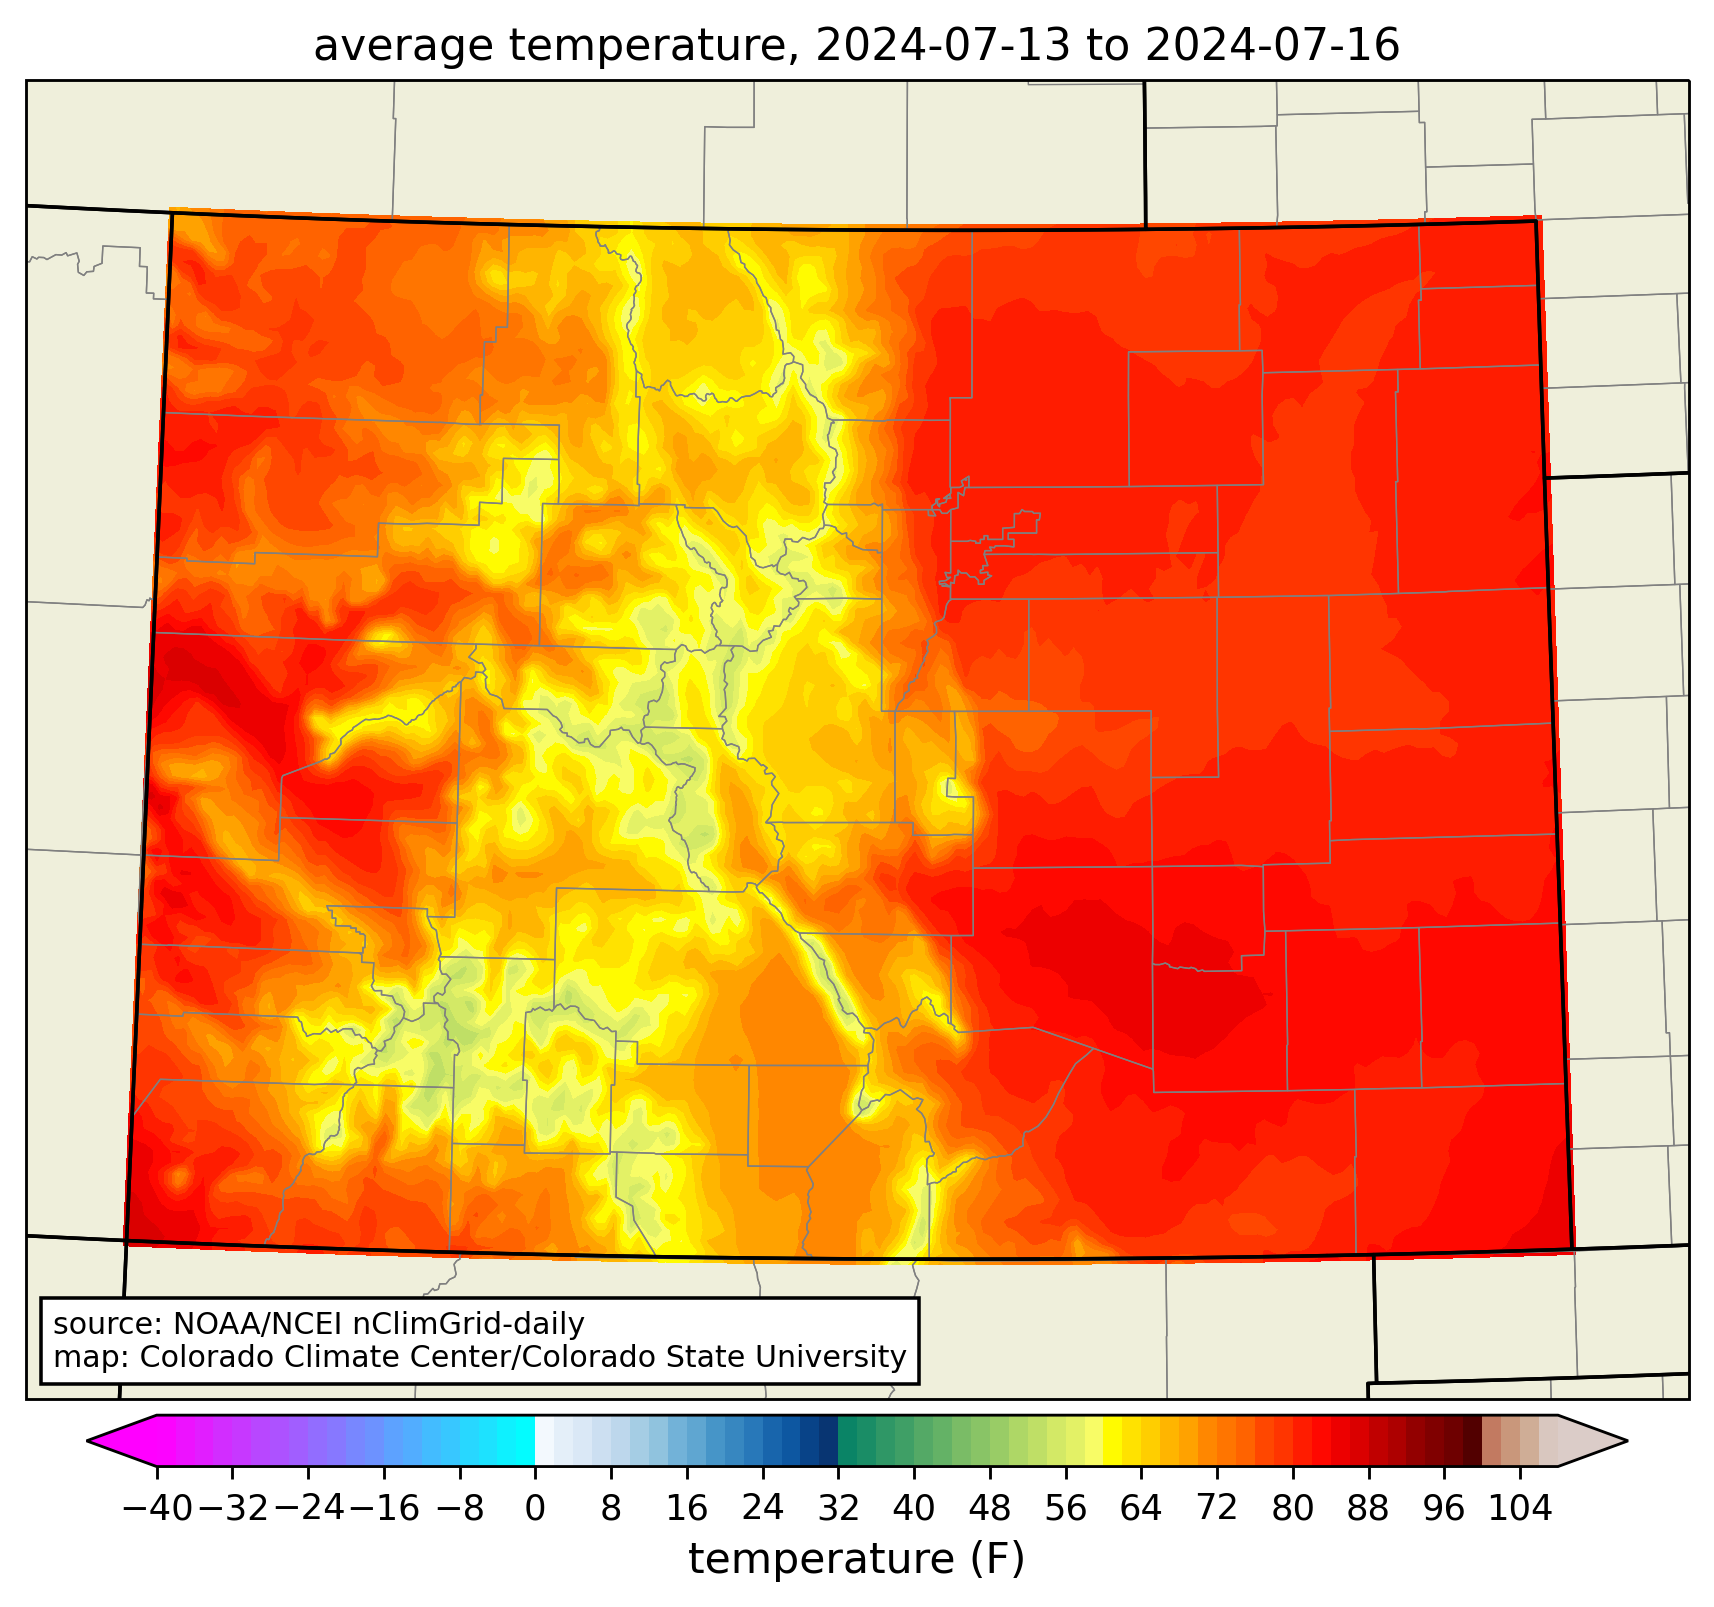
Below are maps of the average temperature for the four-day period from the morning of Friday the 12th through the morning of Tuesday the 16th, and how it compares to the 30-year “normal” for those four days.
Average temperature from NOAA’s nClimGrid dataset, for 13-16 July 2024. nClimGrid defines days as ending in the early morning, so this includes the period from the morning of the 12th through the morning of the 16th. Credit: Russ Schumacher/Colorado Climate Center
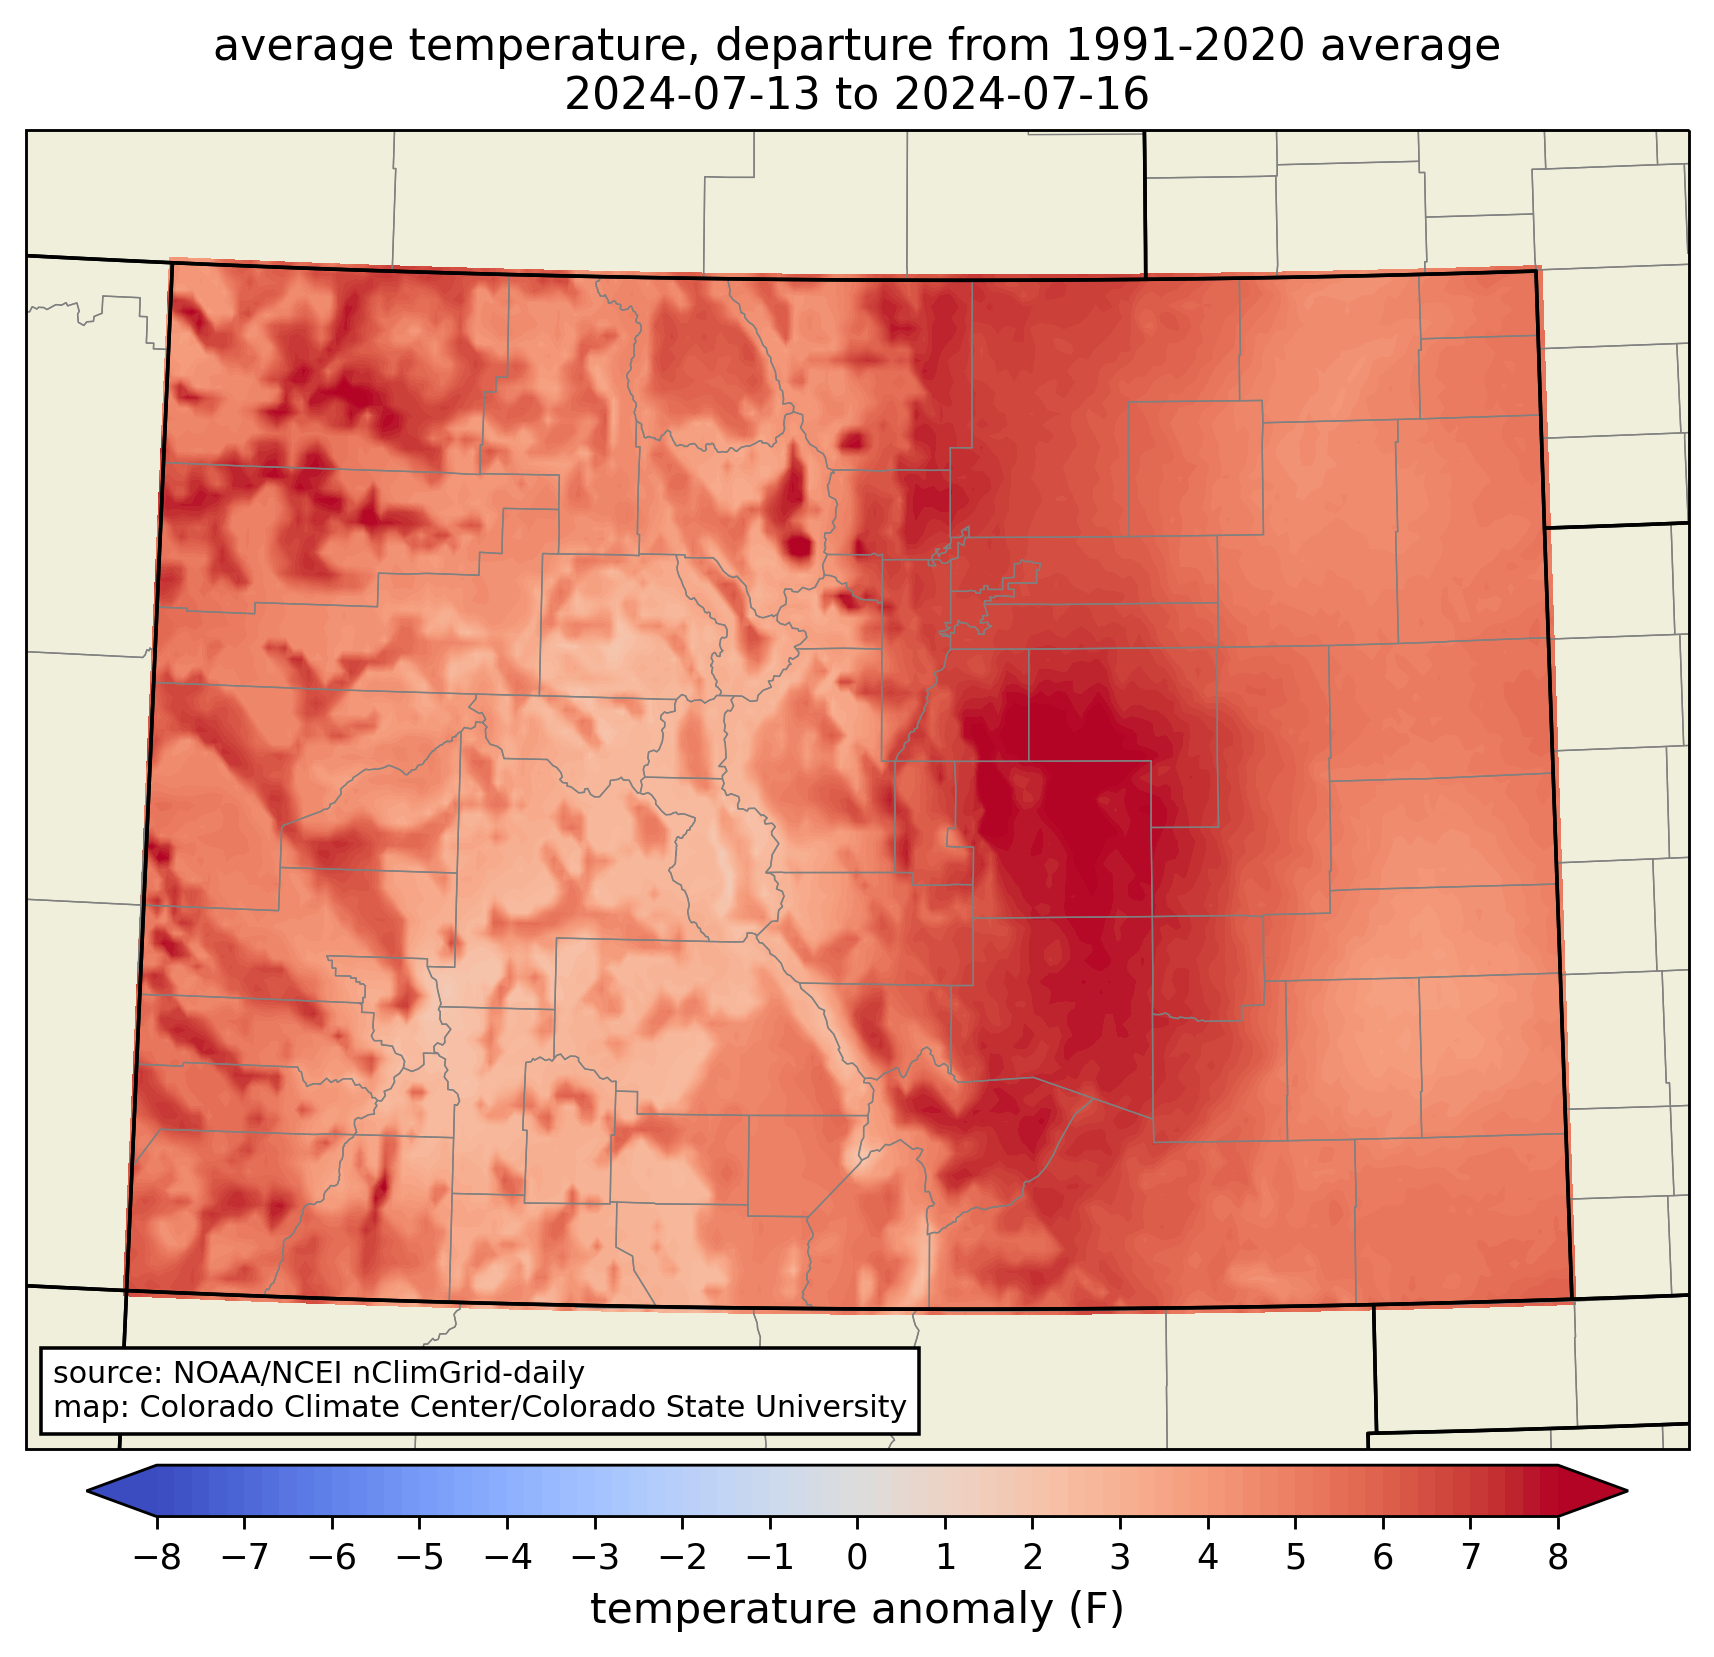
Temperature departure from average from NOAA’s nClimGrid dataset, for 13-16 July 2024. nClimGrid defines days as ending in the early morning, so this includes the period from the morning of the 12th through the morning of the 16th. Credit: Russ Schumacher/Colorado Climate Center
The very highest temperatures over this period were in some of the usual places at lower elevations, like the Arkansas Valley in southeast Colorado, and the Grand Valley on the western slope. But because these are Colorado’s usual hot spots, the heat wave wasn’t as extreme compared to average in those areas. The mountains provided their usual respite from the heat. (The long-term station at Dillon made it up to 84°F, which is pretty warm for a location that has never recorded a 90-degree day.) The temperature anomaly map shows that the Urban Corridor saw the most unusually hot conditions. From the Palmer Divide down through Pueblo County, most locations were more than 8°F above average over these four days.
How does this compare to past heat waves?
To address this question, we will build upon the analysis in the Climate Change in Colorado report, which looked at trends in four-day heat waves using NOAA’s nClimGrid-daily dataset, which goes back to 1951. In that analysis, we divided up Colorado into 11 alternate climate divisions, which better represent climate variability than the official divisions that are defined by river basins. (Interested in the details on this? We just had a paper published describing the method and results.) The map below shows where this heat wave ranked in those alternate climate divisions.
Map showing the ranking of the mid-July 2024 heat wave in different regions of Colorado, based on the nClimGrid-daily dataset going back to 1951. Overlapping time periods have been removed. If no ranking is shown in a region, the mid-July 2024 heat wave did not rank in the top 15. Credit: Colorado Climate Center
It wasn’t a record-breaker in any of the regions, but in the Northern Front Range and Pikes Peak regions, it was a top-10 four-day heat wave. Averaged across the entire state, it ranked as the 14th hottest 4-day heat wave since 1951. So, perhaps not one for the history books, but still worthy of the attention it received. You might then wonder, when were the heat waves that ranked at the top?
Rankings of the top 15 four-day heat waves for Colorado statewide, and for the Pikes Peak and Northern Front Range climate divisions. Based on NOAA nClimGrid-Daily, with overlapping periods removed. Credit: Colorado Climate Center
Pretty much everywhere in the state, the top-ranked four-day heat wave was from June 24-27, 2012. During this time period, multiple intense wildfires were raging across the state, including the Waldo Canyon fire that devastated neighborhoods on the west side of Colorado Springs. In second place statewide and in both the Pikes Peak and Northern Front Range climate divisions was in July 2005. Fort Collins set its all-time record high of 103°F during this heat wave. Mid-July of 1954 also shows up on these lists: many Front Range stations had their longest streaks of 100-degree days during that heat wave, although the nighttime lows were a bit cooler than the others so it doesn’t rank at the top overall.
What about the 1930s? What about climate change?
The nClimGrid-daily dataset, which features consistent data processing to allow for analysis of long-term changes, only goes back to 1951, which means it does not include the “dust bowl” era of the 1930s, during which intense heat and drought afflicted the Great Plains. At some individual long-term stations on Colorado’s eastern plains, heat waves in July of 1934 and 1936 still rank as hotter than those in more recent years (although at other stations, those records were surpassed by the June 2012 heat wave.) Grand Junction’s hottest 4-day period came in late July of 1931. Bob Henson and Jeff Masters at Yale Climate Connections recently published an insightful article on why the 1930s were so hot in North America, which includes the effects of poor soil management practices in the Great Plains.
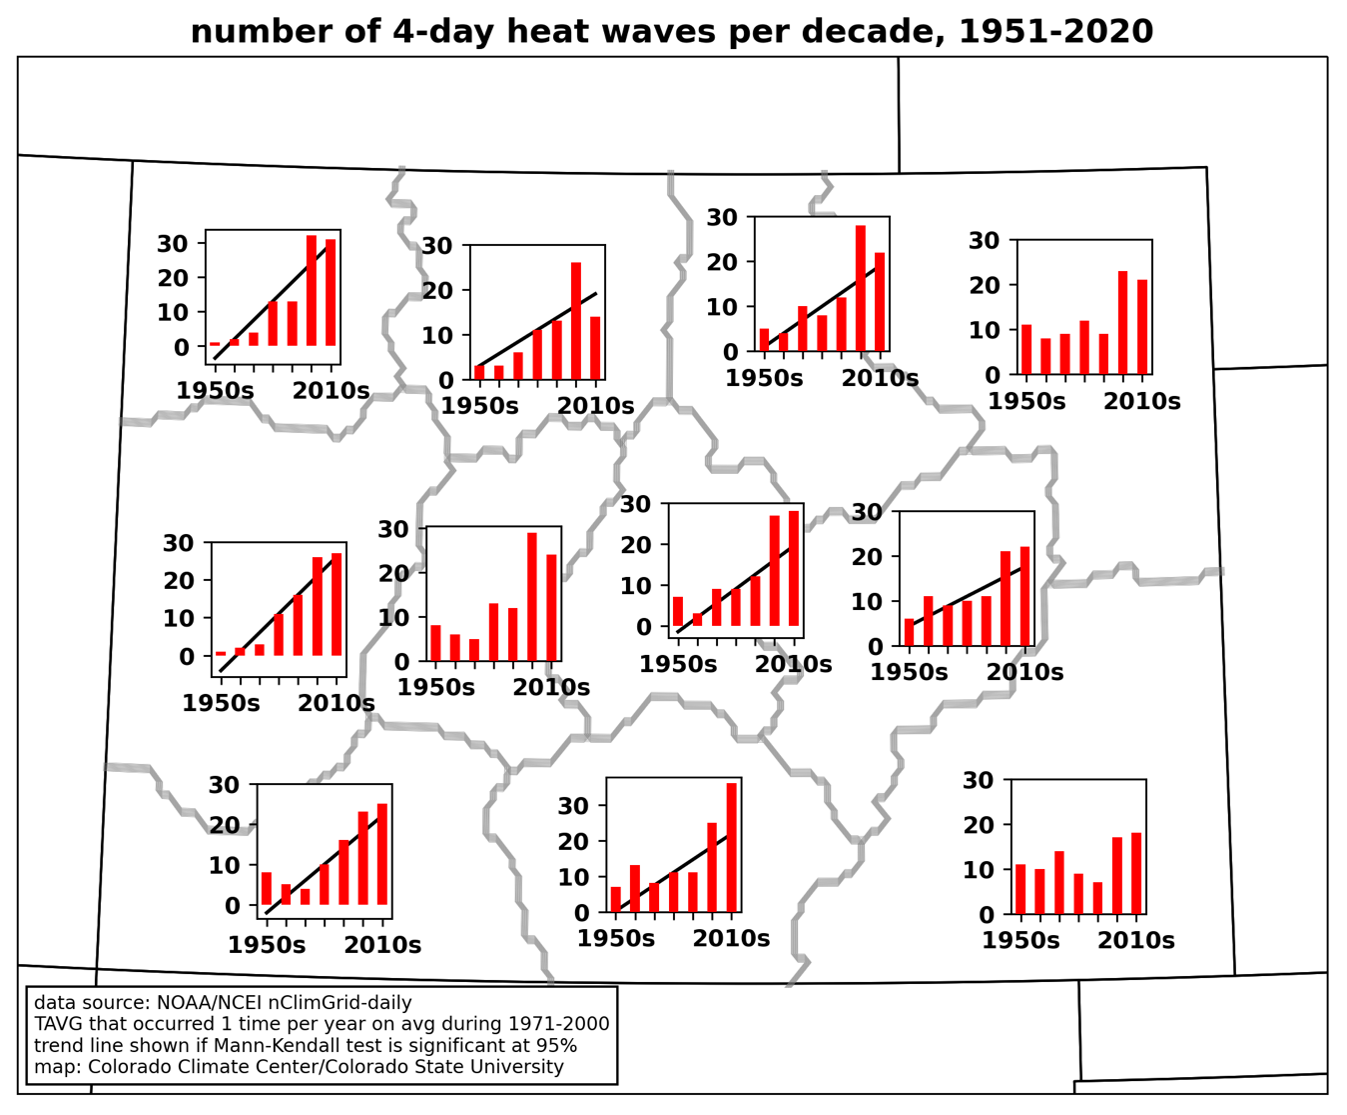
We also know that the climate is warming, and that the frequency of heat waves is increasing in the western US. Most regions of Colorado saw significant increases in the number of heat waves from 1951-2020 (the exceptions being the central mountains, and the northeastern and southeastern plains). And these trends continue: the right panel below shows an updated graph for the Pikes Peak region through the present. The first 3+ years of the 2020s already had 12 heat waves in this region, which is more than than any full decade between the 1950s and 1990s. Future climate projections show that the frequency of heat waves is expected to increase much more, even in a moderate-emissions scenario.
Figure 4.2 of Climate Change in Colorado. Time series of the number of 4-day heat waves per decade from 1951-2020 for each climate division. Heat waves are defined as a 4-day period in which the daily mean temperature (the sum of the daily maximum and minimum temperatures divided by two), averaged over the four days, exceeds the 4-day average temperature that was exceeded on average once per year during 1971-2000. Credit: Colorado Climate Center
Updated version for the Pikes Peak region through the mid-July 2024 heat wave. Note that the rightmost bar represents less than 4 years (2021-present) while the other bars are full decades. Credit: Colorado Climate Center
Overall, what we’ve seen in Colorado isn’t that the most-extreme heat waves are getting more extreme. Record-smashing events are very rare even in a warming climate, and when air masses are hot enough aloft to have the potential for record-breaking heat, they often have just enough moisture to produce clouds and storms that reduce the surface temperature by a degree or two. Instead, what we’re seeing is a steady increase of heat: heat waves that would have been few and far between in the 20th century are now becoming commonplace. (I was able to do an extended interview on this topic on Colorado Public Radio’s Colorado Matters program that you can listen to here.)
A concluding note is that even with this heat wave in the middle of the month, July as a whole has not actually been especially warm across Colorado. Many stations are near to even a little below normal for temperature for the month, with the refreshing weather around the 4th of July and the cooler, wetter conditions this past weekend. However, the last week of the month looks like it will bring more hot, dry weather. This may end up putting July above average for temperature when the month concludes, and could add to the tally of heat waves in Colorado as well.
Click the link to read the article on the NOAA website (Derek Lemoine):
July 26, 2024
This is a guest post by Dr. Derek Lemoine, who is APS Professor of Economics at the University of Arizona’s Eller College of Management and a Research Associate of the National Bureau of Economic Research. Dr. Sarah Kapnick, currently the NOAA Chief Scientist, collaborated with Dr. Lemoine on NOAA CPO-funded research while at the NOAA Geophysical Fluid Dynamics Laboratory.
As regular readers of the ENSO blog know, the National Oceanic and Atmospheric Administration (NOAA) issues forecasts of the large-scale climate patterns that we may see many months later. But they may not know that the El Niño Southern Oscillation (ENSO) Outlook is but one of the seasonal climate outlooks that NOAA produces. Creating and disseminating these outlooks requires a large investment in monitoring and forecasting systems, scientists, forecasters, and, of course, climate.gov bloggers. Do these outlooks matter in the financial world?
In a new paper published in Nature Communications, Dr. Sarah Kapnick and I (an atmospheric scientist and economist odd couple, in work done before she became NOAA Chief Scientist) show that they matter to investors in financial markets. And, importantly, some matter more than others.
But first…options!
To test whether seasonal outlooks influence the market, we examined how the prices of options on stocks changed when a seasonal outlook was released. Why test option prices rather than stock prices? We have a clear prediction for how option prices should move on average when an outlook is released, whereas we lack this clear prediction for stock prices (footnote #1).
An option gives you the right—but not the obligation—to either buy or sell a particular company’s stock at a predefined “strike” price by a predefined “expiration” date. Let’s imagine that you’ve bought an option to buy stock and the expiration date is upon you. Should you exercise the option? If the stock’s price is now above the strike price, then yes: you get to buy the stock cheaply and can, if you want, immediately sell it at the market price for a profit. If the stock’s price is below the strike price, then no: just buy the stock on the open market if you want it, since you would pay more than necessary by exercising the option.
Earlier on, before the expiration date draws nigh, you have a lot of upside from holding the option because the actual stock price could end up way above your strike. And you have no corresponding downside because you can always walk away and let your option expire unexercised if the stock price ends up below your strike. Who doesn’t like upside risk when it’s not contaminated with downside risk?
So, you like holding an option. Now consider how much you would pay to acquire it. You tend to be willing to pay more to buy an option when you are more uncertain about what the stock’s price on the expiration date will be, because you get more of that sweet upside risk still without bitter downside risk. Conversely, the more certain you are about the future price of the stock, the less you are willing to pay for the option. So, the current price of an option tells us how uncertain investors must be about the future stock price. This measure of uncertainty is called “implied volatility,” as it is implied by market data. All else equal, higher prices for options imply more expected volatility; lower prices imply less.
This cartoon shows a case where the investor made a profit, but a different pathway is plausible as well. It is possible when the expiration date arrives, it turns out the investor paid too much for the option and the strike price is larger than the price of the fishing stock. In which case the investor may decide to not exercise the option. Cartoon Credit: Anna Eshelman, climate.gov.
You too can bet on outlooks
Our work shows that, on average, the implied volatility will fall when a seasonal outlook is released, but ONLY IF investors think that the seasonal outlook might say something relevant to the firm’s stock price (footnote #2). If investors think the seasonal outlook is either worthless as a forecast or irrelevant to a particular firm, then the firm’s stock and option prices will not be affected by the outlook. If they instead believe the outlook is both skillful and potentially relevant to that firm, then, before the outlook is released, the firm’s stock and option prices should reflect investors’ expectations of what the outlook will say.
Once a relevant outlook is released, the firm’s stock and option prices change to reflect the new information in the outlook. A particular outlook could increase uncertainty about the company’s future stock price by forecasting an especially unpredictable climate. However, once we average over many outlook releases, uncertainty about the company’s future stock price (in the form of implied volatility) falls upon the release of outlooks, simply because investors are no longer uncertain about what an outlook will say once they have the outlook in hand.
An example
Imagine that you are investing in a fishing company whose profits are affected by the state of ENSO. Its stock price should already incorporate investors’ expectations about what NOAA’s upcoming ENSO Outlook will say. For instance, they may already think an El Niño is coming, based on past months’ outlooks. If you think that an upcoming monthly update is unlikely to have much new to say, then that upcoming monthly update does not make you willing to pay much more for an option on the firm’s stock. But what if, instead, you think that an upcoming monthly update could offer additional news about how strong that El Niño will be? The greater the potential for news that is relevant to the value of the fishing company, the more uncertain you are about what its stock price will be once the monthly update is released. You are then willing to pay more for an option to take advantage of uncertainty about the firm’s stock price induced by the ENSO Outlook.
Once the seasonal outlook is released, uncertainty about the outlook’s contents vanishes. You may still be uncertain about what the seasonal climate will be, but you are no longer uncertain about what the outlook will say about it or how the outlook will affect the company’s stock price. If the outlook did not contain much new information about the coming El Niño, then you are now not willing to pay as much as before for the option on the fishing company. If other investors make similar assessments, the price of the option will fall.
Our study tested whether the degree of uncertainty implied by option prices (“implied volatility” again!) did indeed fall on average when seasonal outlooks were released from 2010–2019. If implied volatility did tend to decline, then some fraction of investors must have judged these climate outlooks to be skillful at forecasting patterns that are relevant to firms’ valuations—and thus to their stock prices.
June ENSO Outlook affects option prices throughout the economy
We find that, across approximately three thousand firms traded in U.S. markets, implied volatility does fall when NOAA releases the ENSO Outlook in June and the Winter Outlook in October. Investors do not know what the ENSO and Winter Outlooks will say ahead of the release, but they apparently believe they could say something relevant to firms’ stock prices. We do not detect a response to NOAA’s May Hurricane Outlook or to two less skillful outlooks: Colorado State University’s April Hurricane Outlook or the Farmers’ Almanac’s August Winter Outlook (footnote #3).
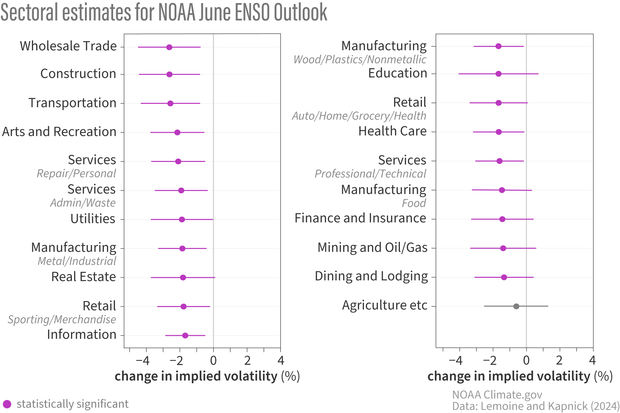
Because options are tied to particular companies, we can drill down on how broadly outlooks matter to different parts of the economy. When finely classifying firms into “industry groups”, we find that around 90% of industry groups see their implied volatility fall when NOAA releases the June ENSO Outlook. When we aggregate these industry groups into 21 broader “sectors”, we find significant effects of the June ENSO Outlook in an amazing 20 of them.
How much the June ENSO outlook matters to different sectors of the economy. Purple lines indicate a statistically significant change. Credit: Climate.gov, adapted from original by Lemoine and Kapnick.
Whether these economy-wide effects represent broad impacts of ENSO or instead represent impacts to particular firms rippling through trade networks, investors apparently believe ENSO has broad reach (footnote #4).
Overall, the June ENSO Outlook affects firms worth $13 trillion. An upcoming June ENSO Outlook incentivizes traders to pay an extra $12 million [95% confidence interval: $3.6–$20 million] to hold options. Traders seem to find this spending worth it in order to hedge the risk of what the outlook may say.
But what about other months’ ENSO Outlooks? The June ENSO Outlook was of most interest to us because it is the month when we’re most sure to be past the spring barrier and the accuracy of the ENSO Outlook increases. When we test each month’s ENSO Outlook, we indeed find that implied volatility falls by the largest amount upon the release of the June ENSO Outlook. In fact, that is the only month’s outlook for which the change in implied volatility is statistically significant.
Showing the change in implied volatility (%) by calendar month as a response to the ENSO outlook. The range shown in purple is statistically significant because all values of the 95% confidence interval (from top whisker to bottom whisker) are less than zero. The other months have ranges that overlap into positive values and, therefore, positive or zero change cannot be ruled out. Credit: Climate.gov, adapted from original by Lemoine and Kapnick.
We calculate how much traders value the increase in skill from the May to June Outlooks. We find that the more skillful June outlook carries an option market premium that is $9.4 million [95% confidence interval: -$1.6–$20.5 million] larger than the May outlook. Combining this additional premium with the difference in skill from this paper, we infer that a 1% improvement in ENSO prediction skill induces traders to spend an additional $1.8 million [95% confidence interval: -$0.31–$3.9 million] annually hedging news about seasonal climate.
Adaptation must not be a silver bullet
In practice, seasonal outlooks are even more valuable than what we estimate here. Traders have access to earlier forecasts of seasonal climate from forecasters besides NOAA and also from prior ENSO outlooks. This pre-existing information waters down the value of any specific month. Moreover, any value we do estimate remains only that from the financial sector (footnote #3 again).
It is important to understand what our estimates mean. We do not measure the impact of exposure to seasonal climate. We instead capture exposure to the forecasted portion of seasonal climate. If firms could costlessly and perfectly adjust to seasonal outlooks, then their stock and option prices would not be affected by the outlook’s contents. But this is not what we see. Therefore, adaptation based on these outlooks must be incomplete and/or costly: firms are exposed to the seasonal climate despite the early warning (perhaps because the information in the outlook is not actionable), and/or firms do adjust their exposure but only at some nontrivial cost that affects their value on the stock market. Seasonal outlooks are valuable, but they transform risk rather than eliminate it.
Lead Editor: Michelle L’Heureux (NOAA CPC)
Footnotes:
To test whether the outlooks influence the market, you might think about looking at stock prices and seeing whether they move when a seasonal outlook is released. However, if you look at only one year’s outlooks this way, then you couldn’t be sure that stock prices did or didn’t move due to some other news released that day. If you instead look at the average movement over many years’ releases, then (in theory) you should not find any average change in stock prices, even if the market did respond to the outlooks. Sometimes an outlook’s news goes in one direction, and sometimes it goes in the opposite direction. If investors form proper expectations of what the outlook will say, then these two types of news should cancel each other over time, leaving no net effect on average.
Technical point: Options’ prices and their implied volatilities are closely linked, but there is a subtle difference when talking about average changes in prices or implied volatilities. Ignoring one wrinkle that reflects aversion to risk, investors should never expect the price of an asset to move on average. Otherwise, they could make money on average by buying or selling it just before that movement, and such free opportunities to make money should not persist in a liquid market. It is possible for an option’s implied volatility to decline on average without its price changing on average because the level of the price reflects other factors that change over time, such as the price of the underlying stock and the time to expiration. This logic is why we test for changes in implied volatility, not in raw option prices.
This is not to say that these other outlooks do not matter or are worthless. We estimate only the value broadly reflected in financial markets. These outlooks may matter to smaller sets of firms, may matter to firms not traded in financial markets, and may matter for people in all sorts of ways that do not show up in stock prices.
Interestingly, the only sector for which we find no effect is agriculture, which is the sector one might have expected to be most exposed to weather. This exception may reflect ENSO being primarily linked to winter weather in the Northern Hemisphere and thus maybe not strongly linked to growing season weather (but see this post for a finer discussion) for the firms we study, which are listed in U.S. markets.
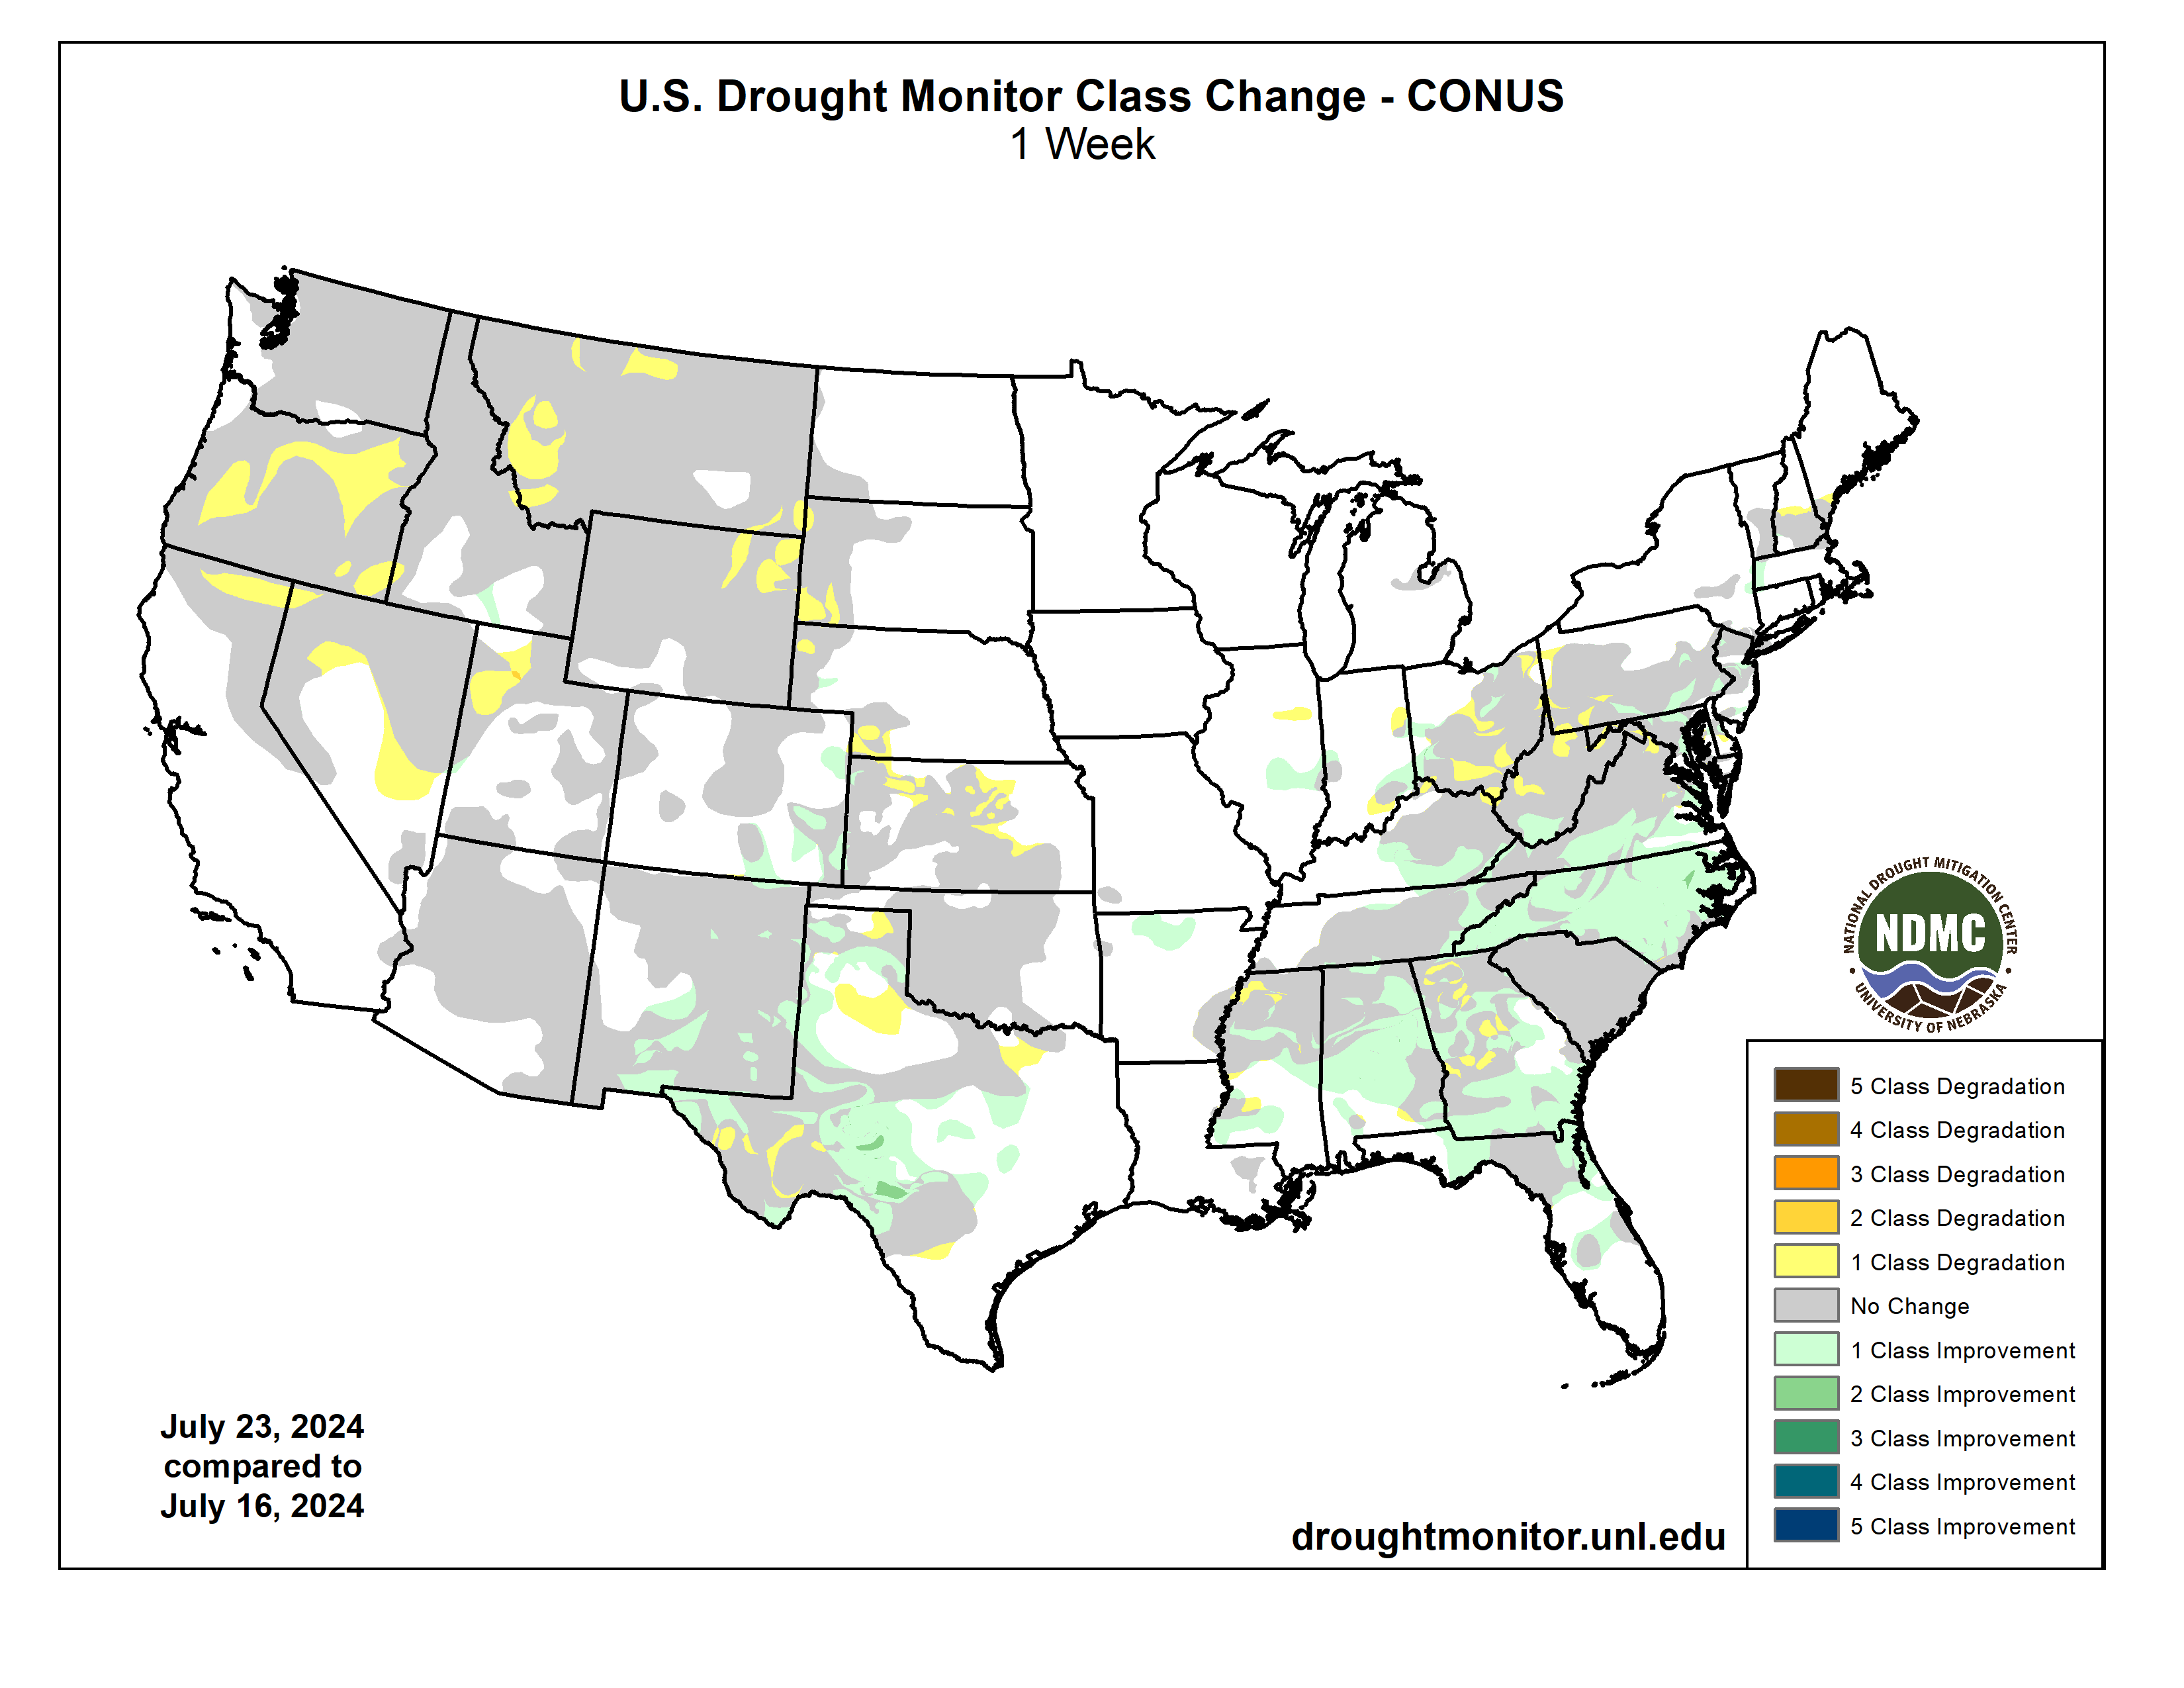
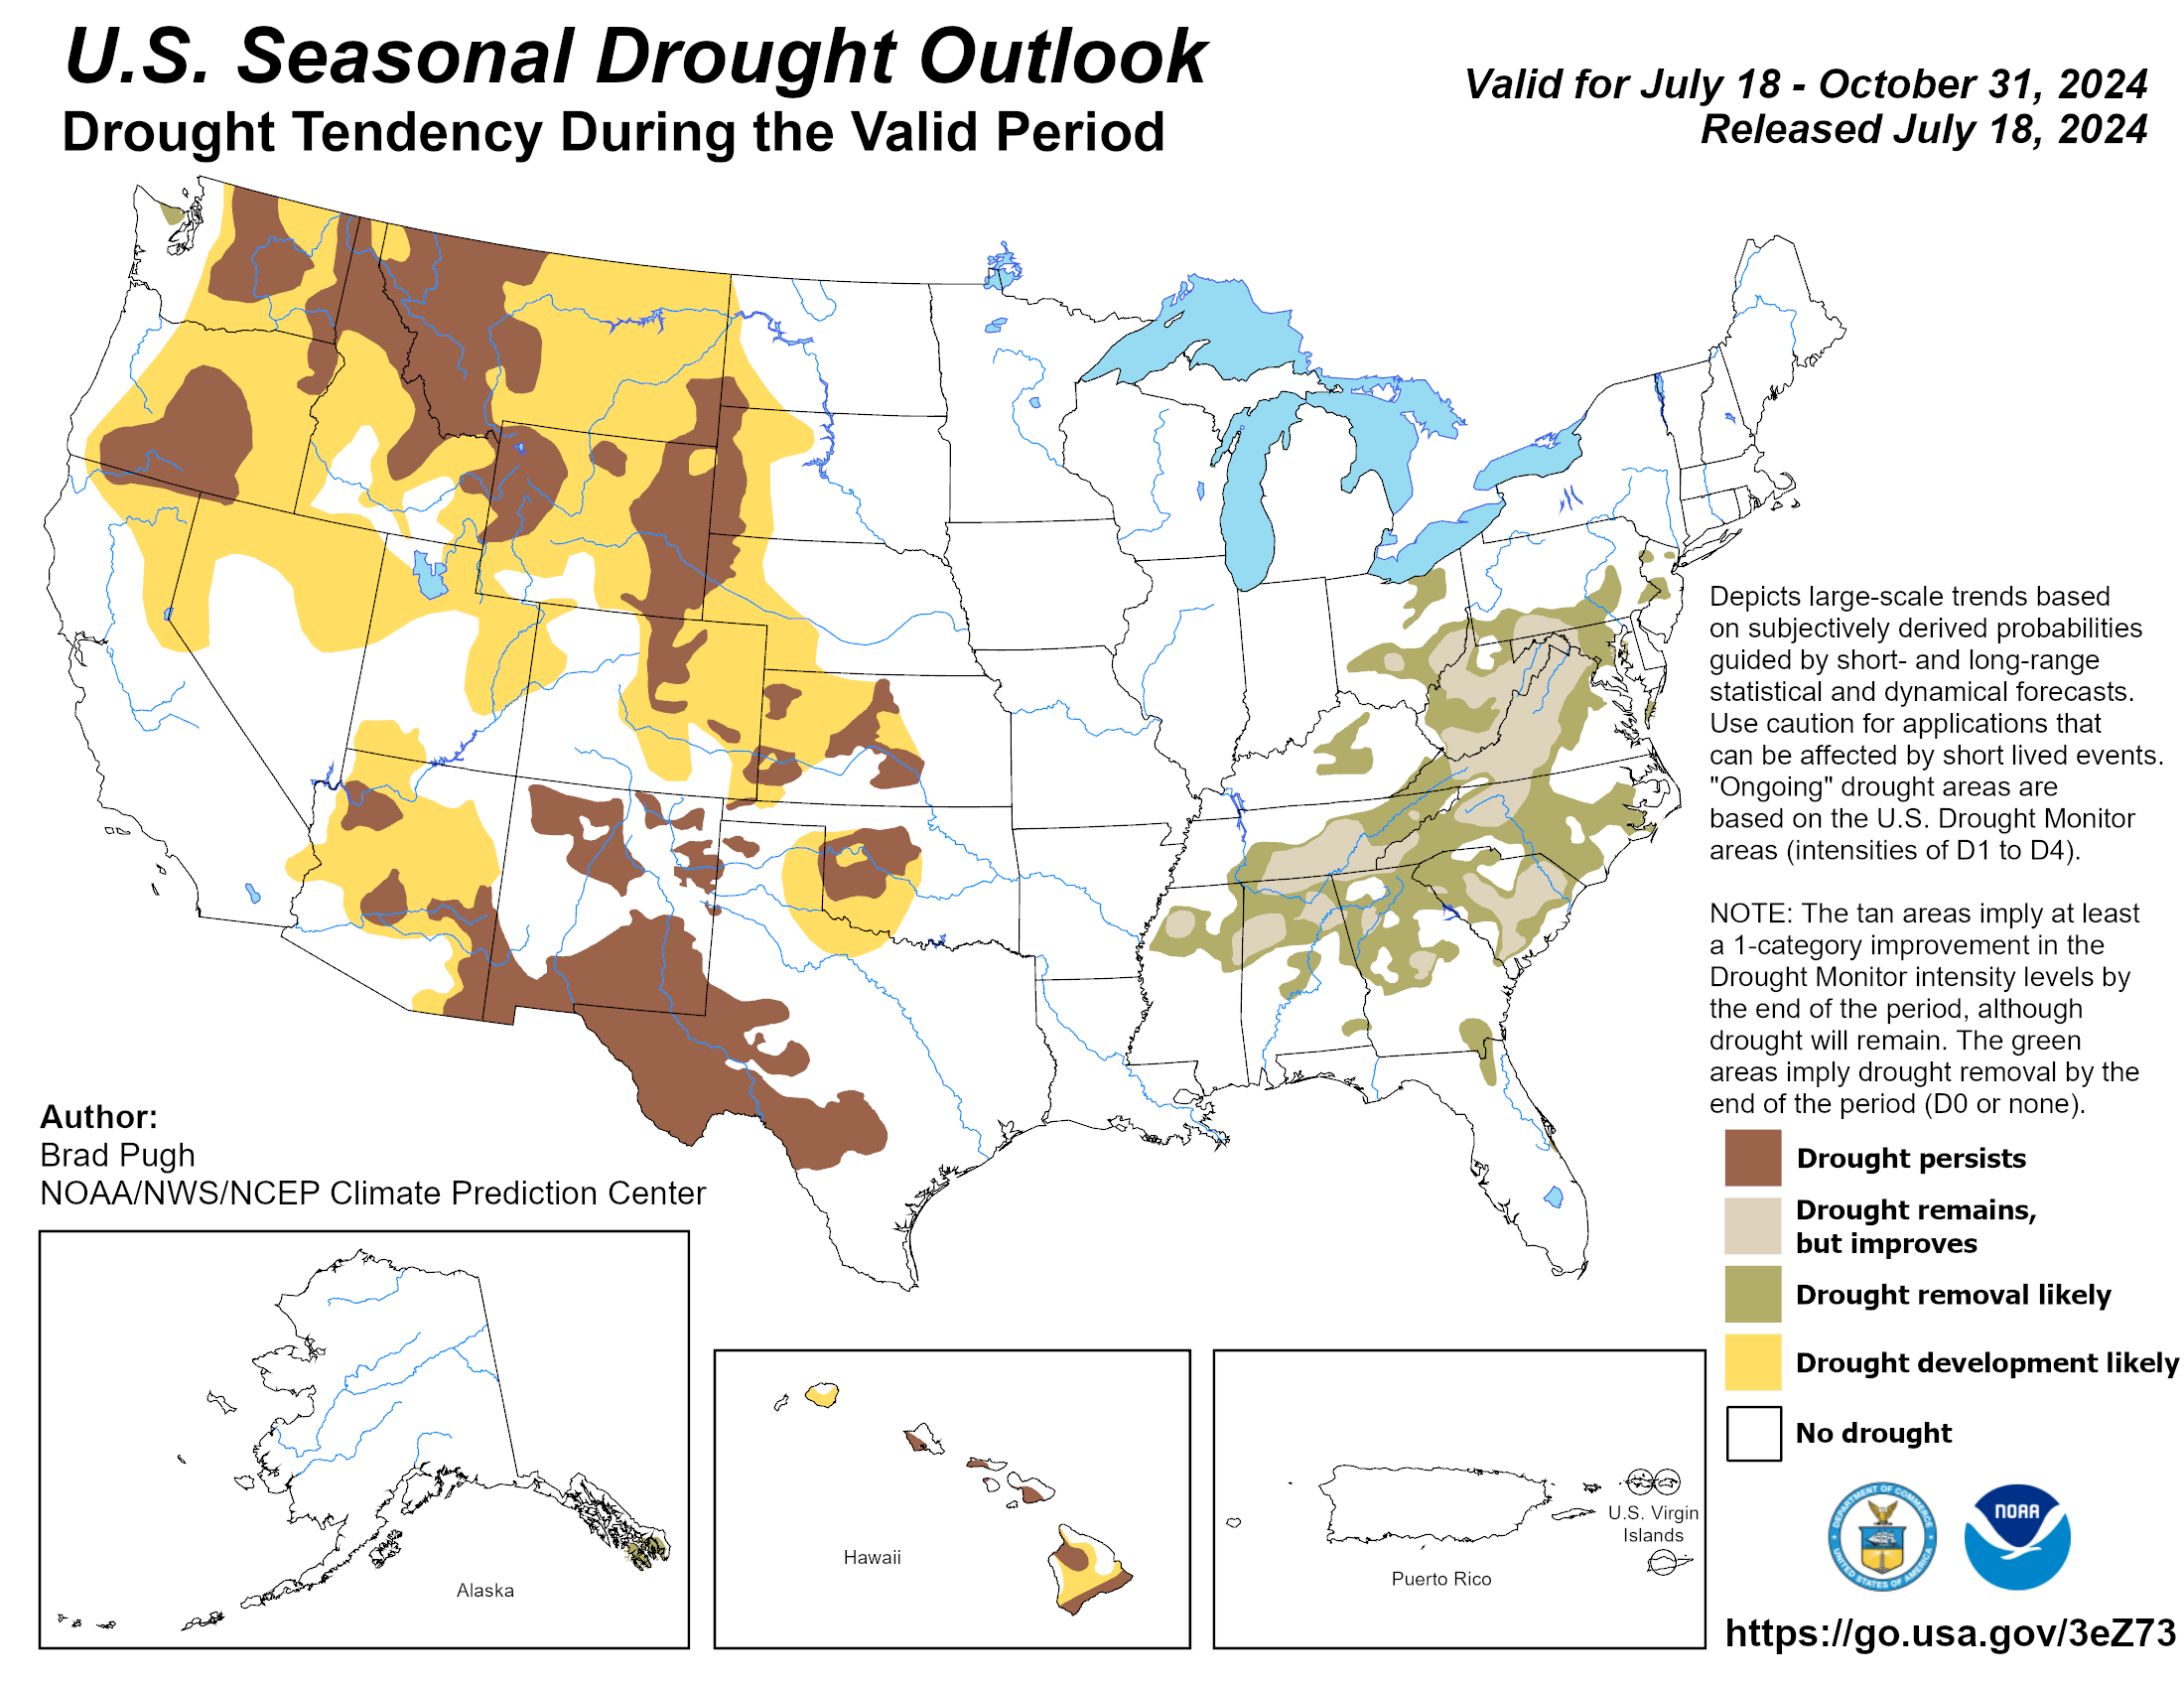
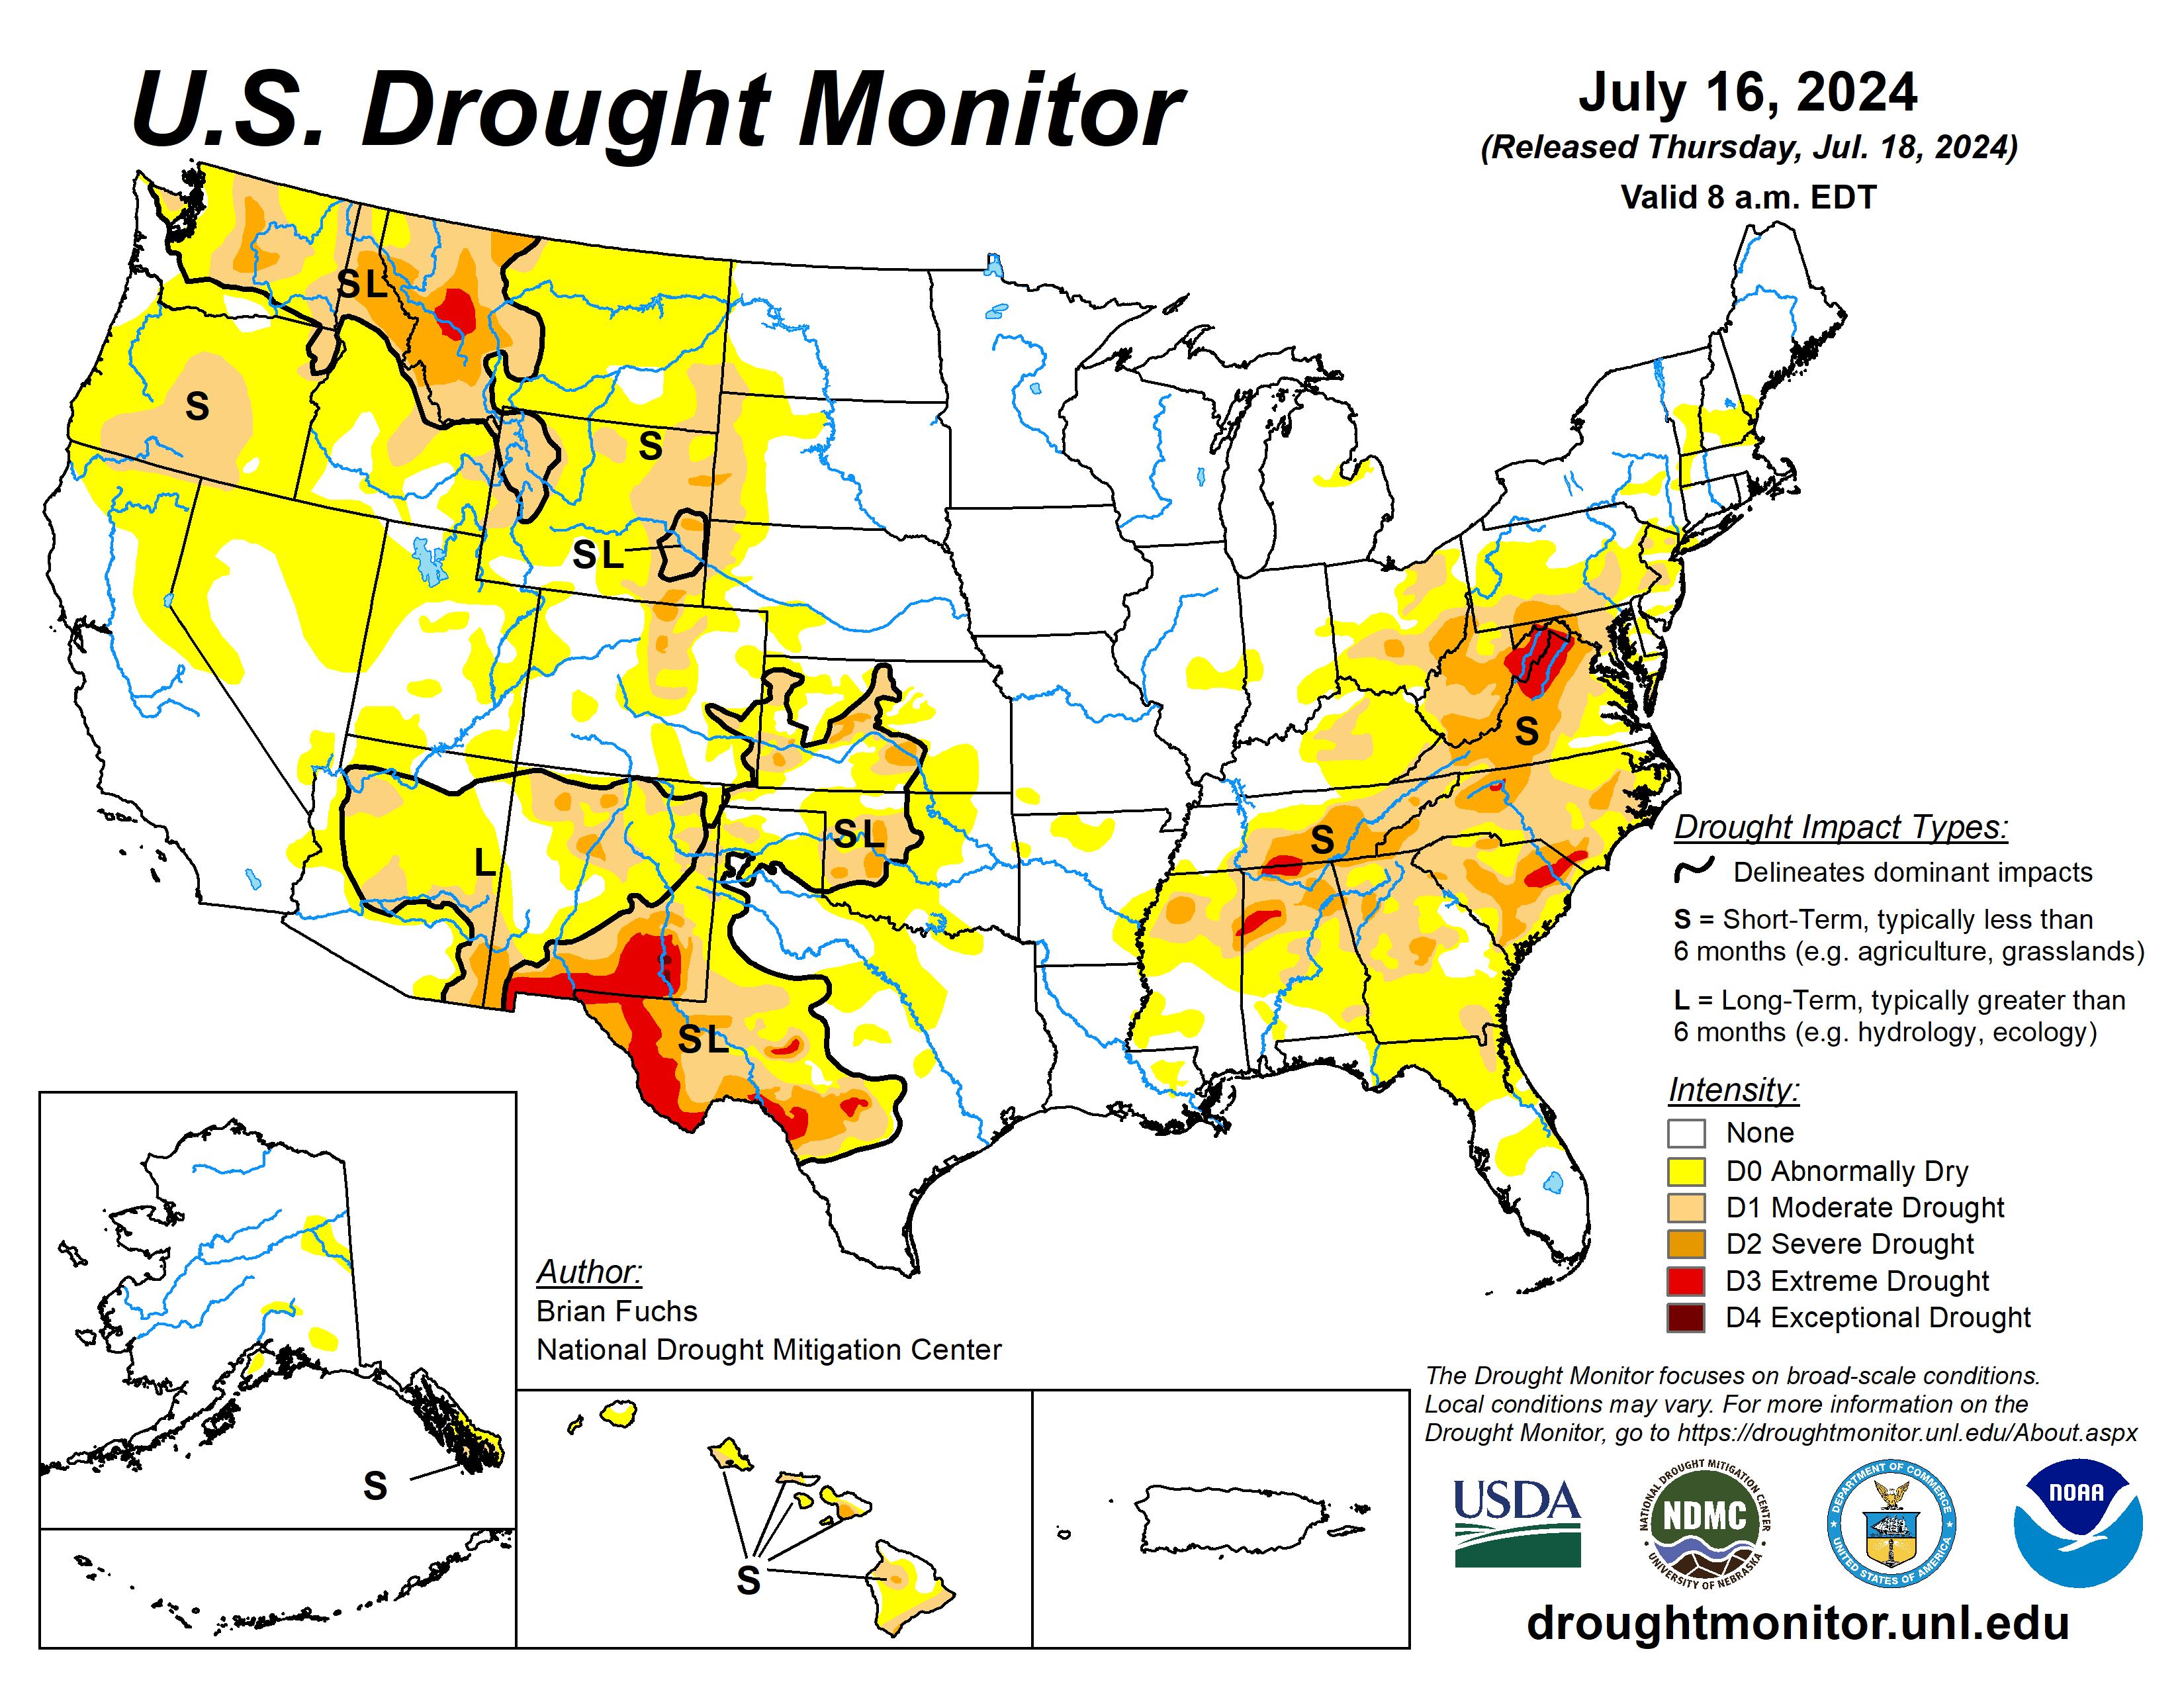
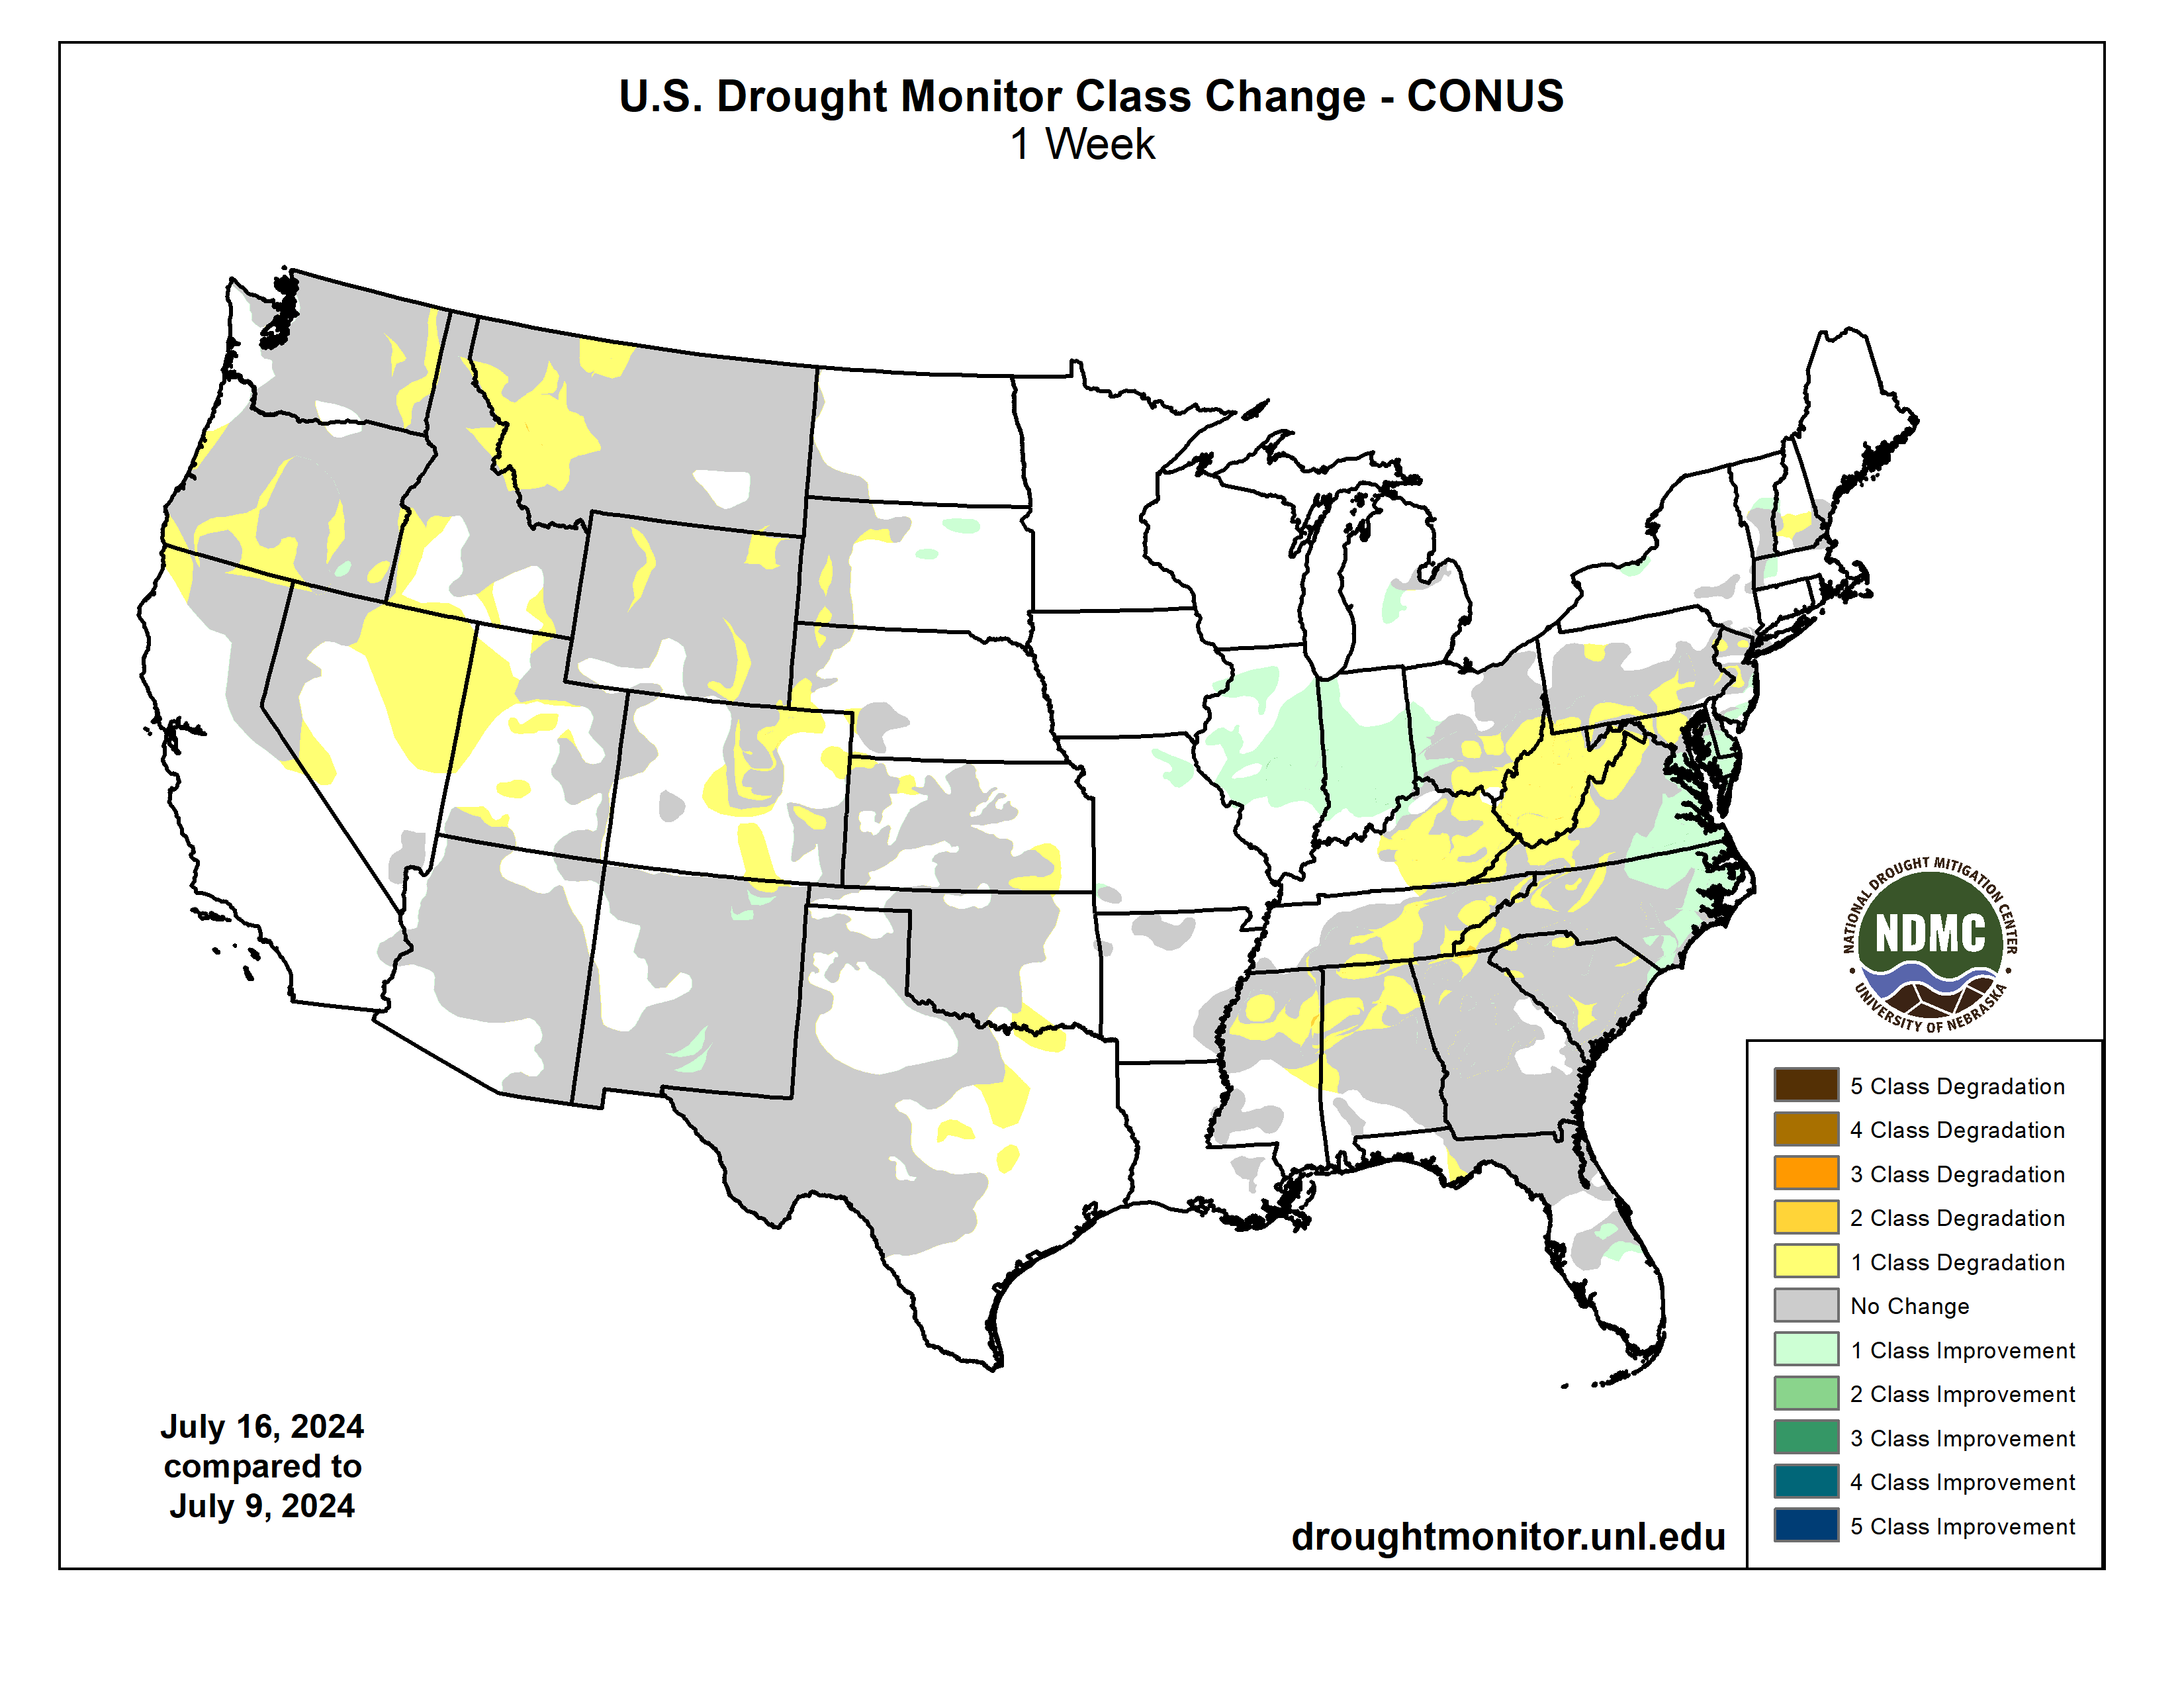
Over the past week, a major heatwave brought warmer-than-normal temperatures to much of the West, with departures ranging between 3 to 12 degrees F above normal across much of the region. Near-normal to cooler-than-normal temperatures were observed from the central Rockies to the Great Lakes, with departures ranging between 3 to 9 degrees F below normal. Precipitation varied across the contiguous U.S. this week. Monsoonal moisture brought heavy precipitation and flash flooding to parts of the Southwest, while a lingering frontal boundary brought daily thunderstorms, heavy rainfall and flash flooding across much of the Southeast and Mid-Atlantic. The most widespread improvements were made in the Southeast, as well as eastern portions of the Southwest and across much of western Texas, where above-normal precipitation amounts were observed this past week. Conversely, dry conditions resulted in degradations across much of Hawaii and the Pacific Northwest, as well as southern portions of the Northeast and in parts of the central Plains, and other parts of the West. Drought and abnormal dryness also expanded or intensified in the Ohio Valley, western High Plains, and in New England. In Hawaii, dry conditions coupled with warmer temperatures resulted in the expansion and intensification of drought across the state this week…
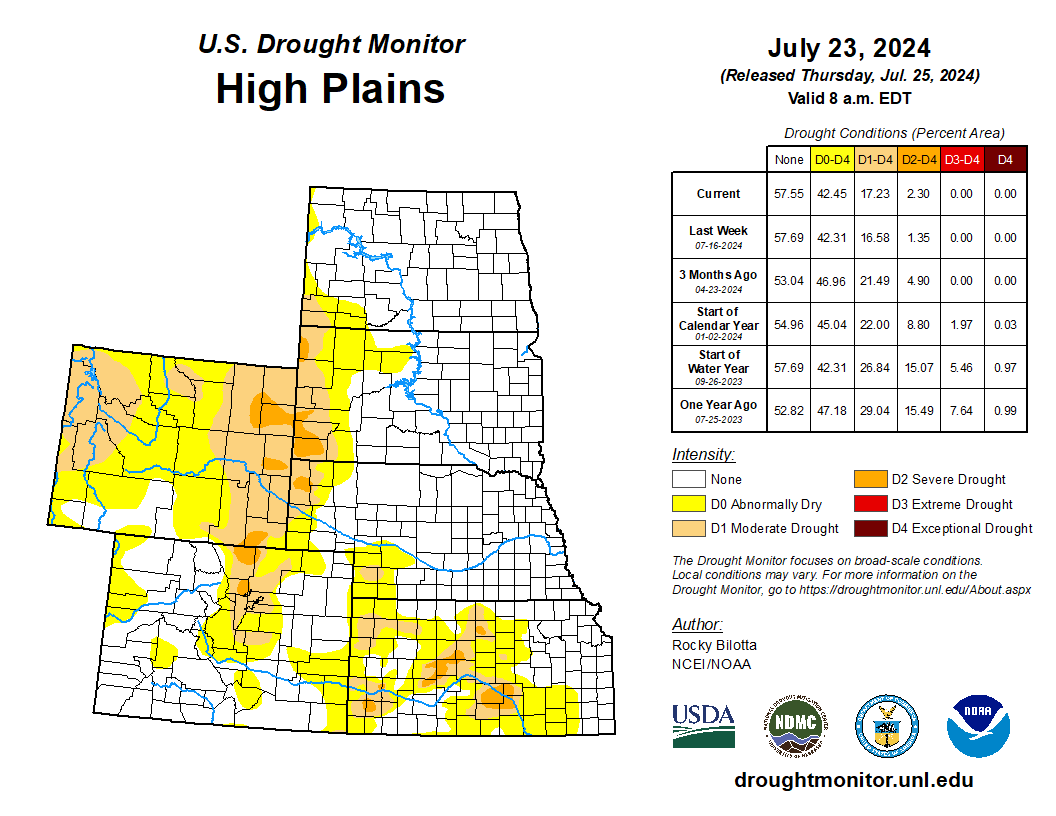
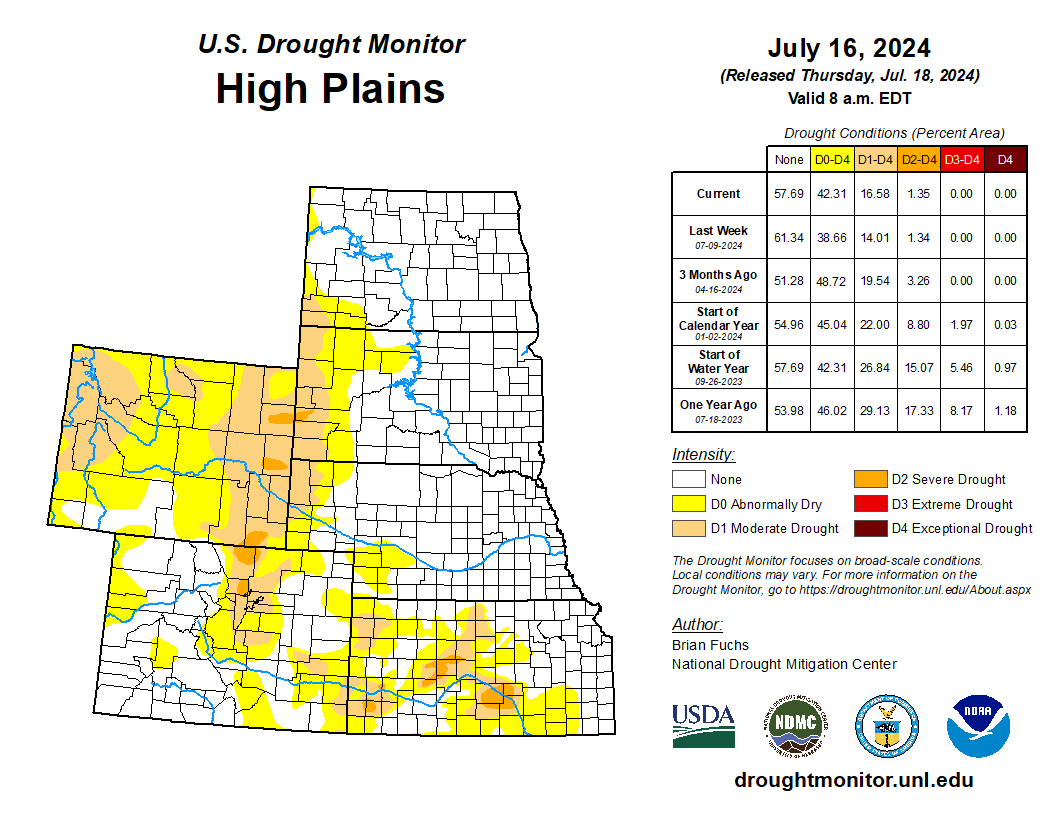
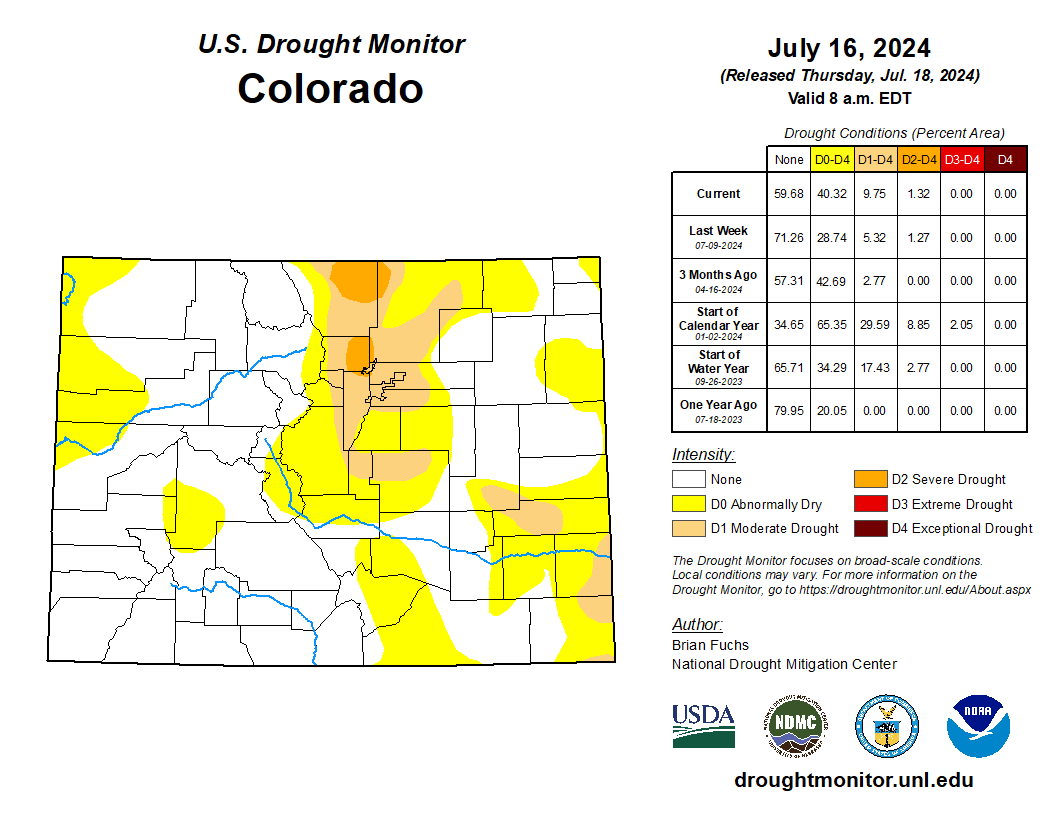
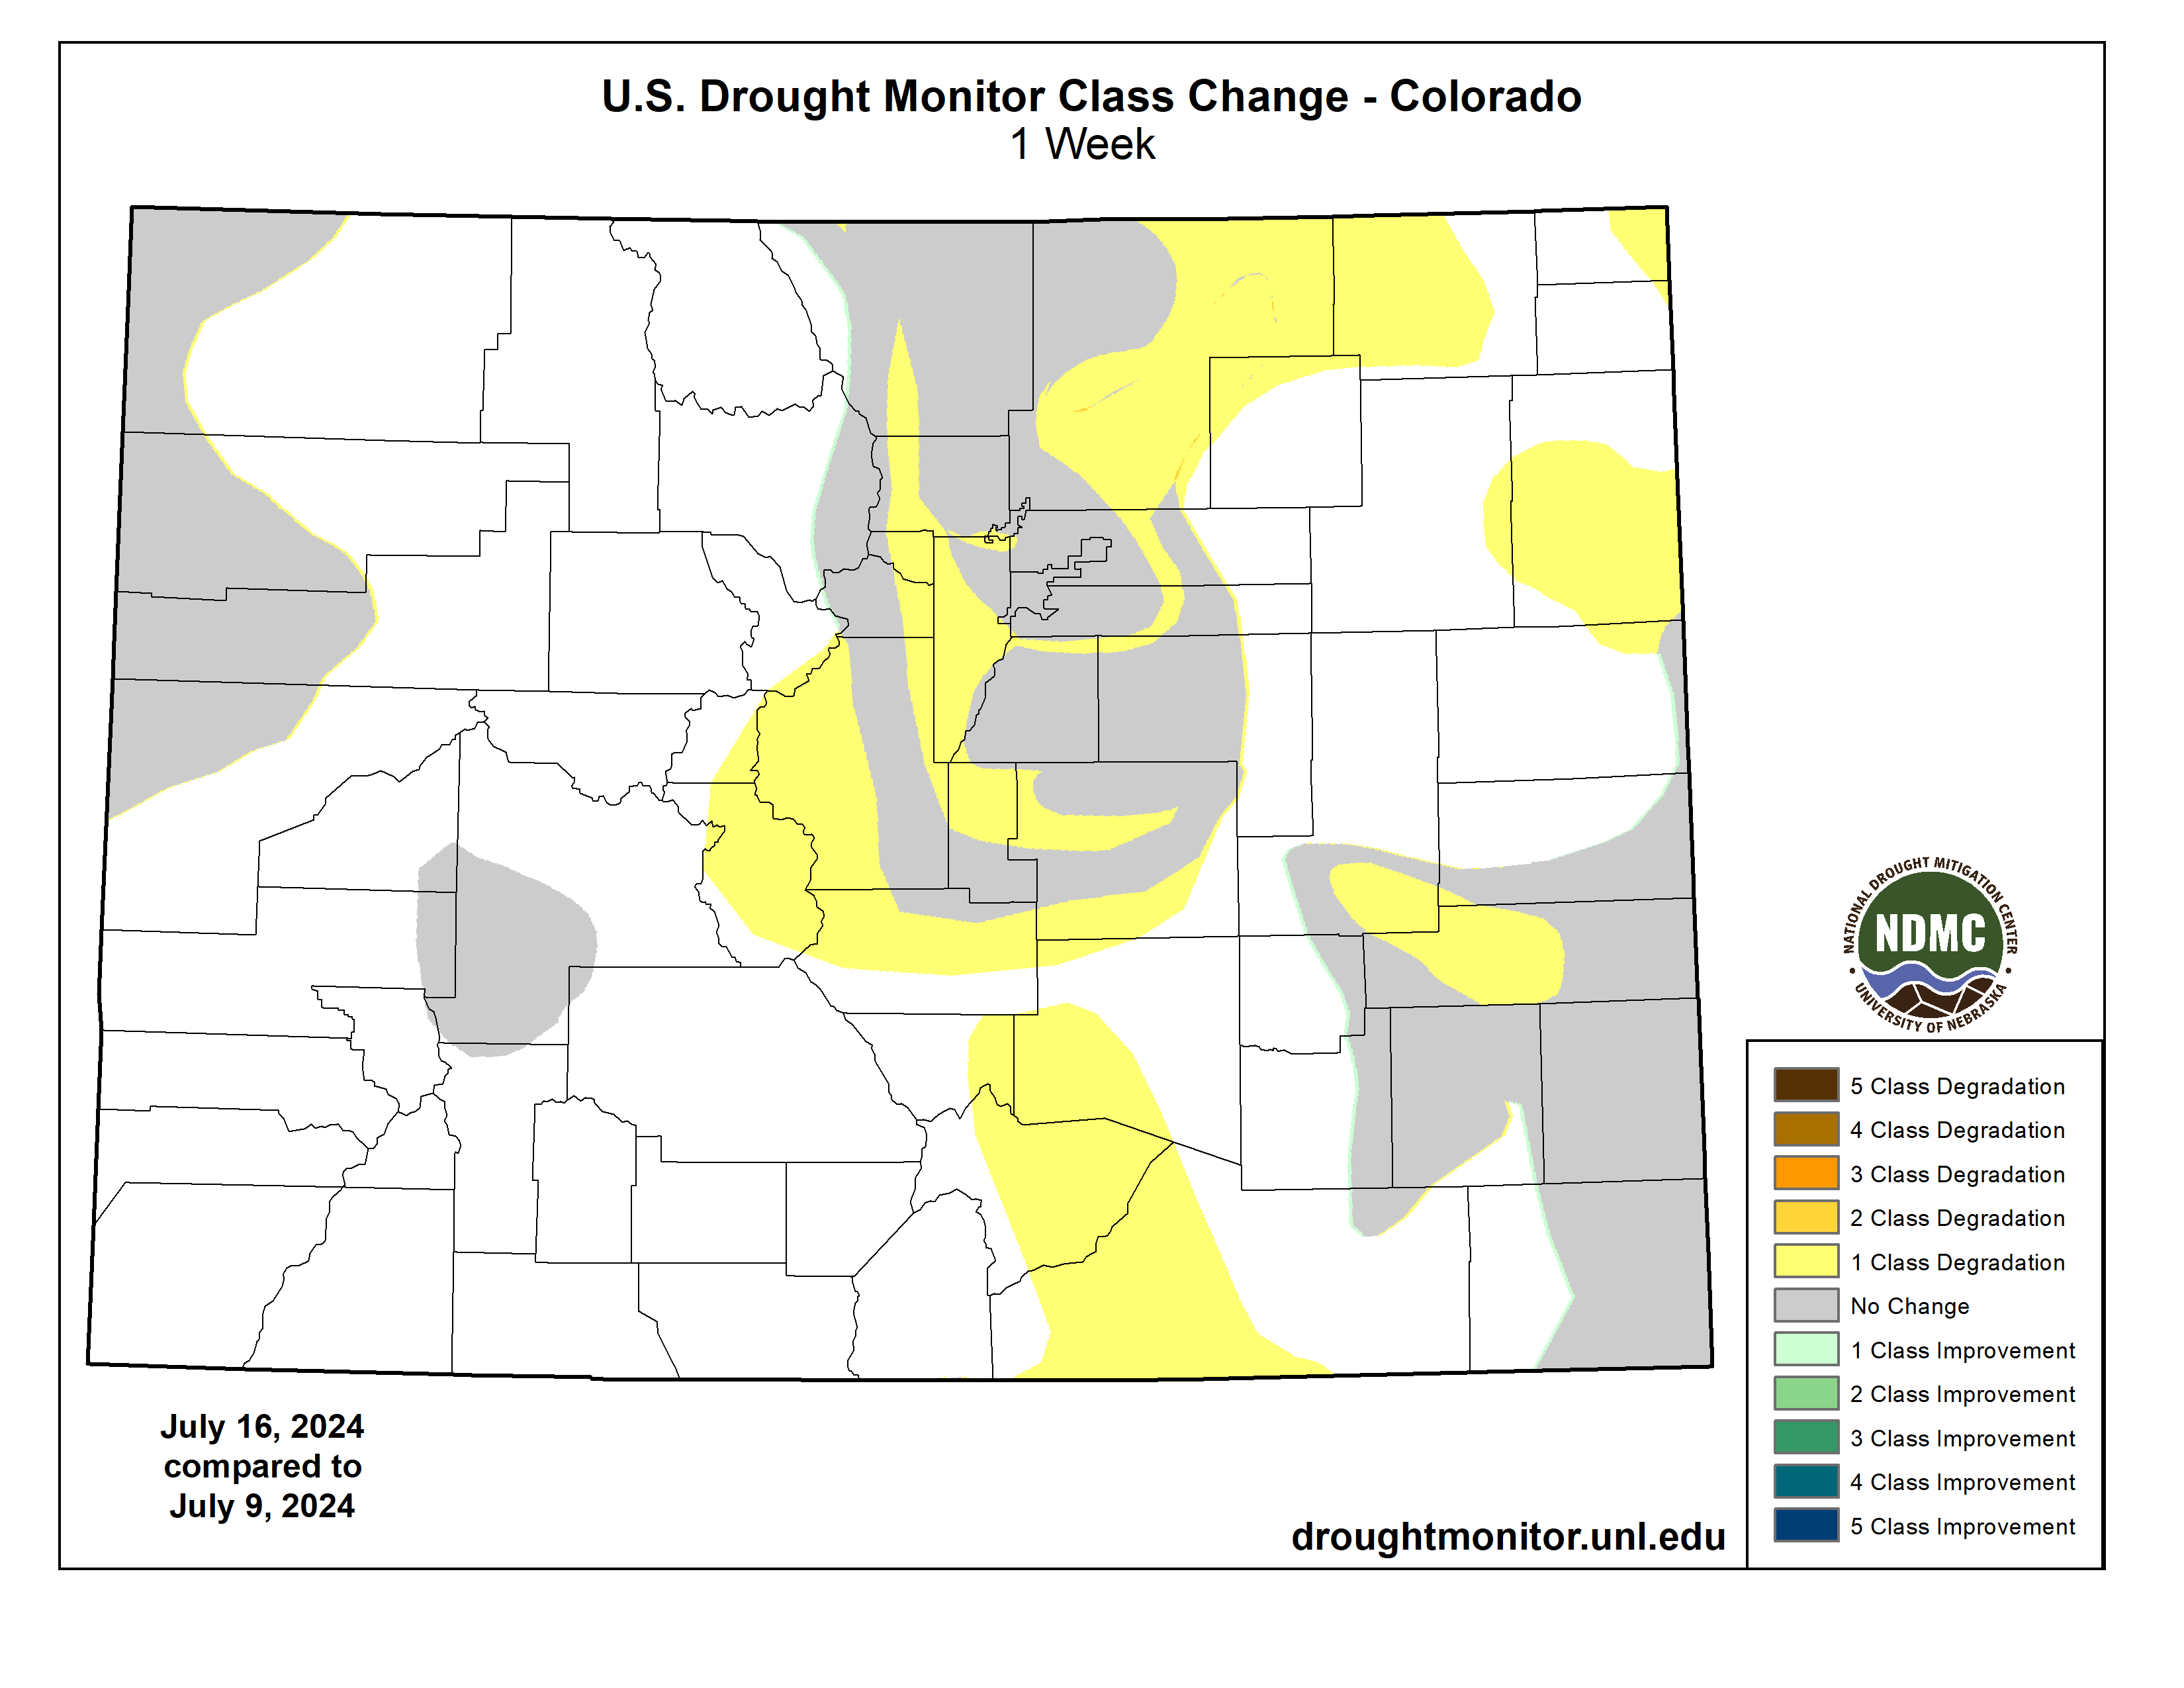
Precipitation fell across much of the region this week, which was enough to prevent large areas of degradation but not enough to warrant large improvements. The heaviest rainfall amounts fell across much of eastern Colorado, reporting rainfall totals up to 400% of normal, resulting in the improvements of abnormal dryness and the removal of moderate drought from the region. Heavy precipitation amounts were also reported in central Nebraska and central South Dakota but were already free of drought and abnormal dryness this week. Precipitation was below-normal across the western portions of the region, resulting in the expansion and intensification of drought. Severe drought was added western South Dakota and Nebraska, and expanded in eastern Wyoming. Moderate drought also introduced in southwest Nebraska this week, while abnormal dryness was expanded in the area. Much of the region remains free of drought and abnormal dryness this week…
Colorado Drought Monitor one week change map ending July 23, 2024.
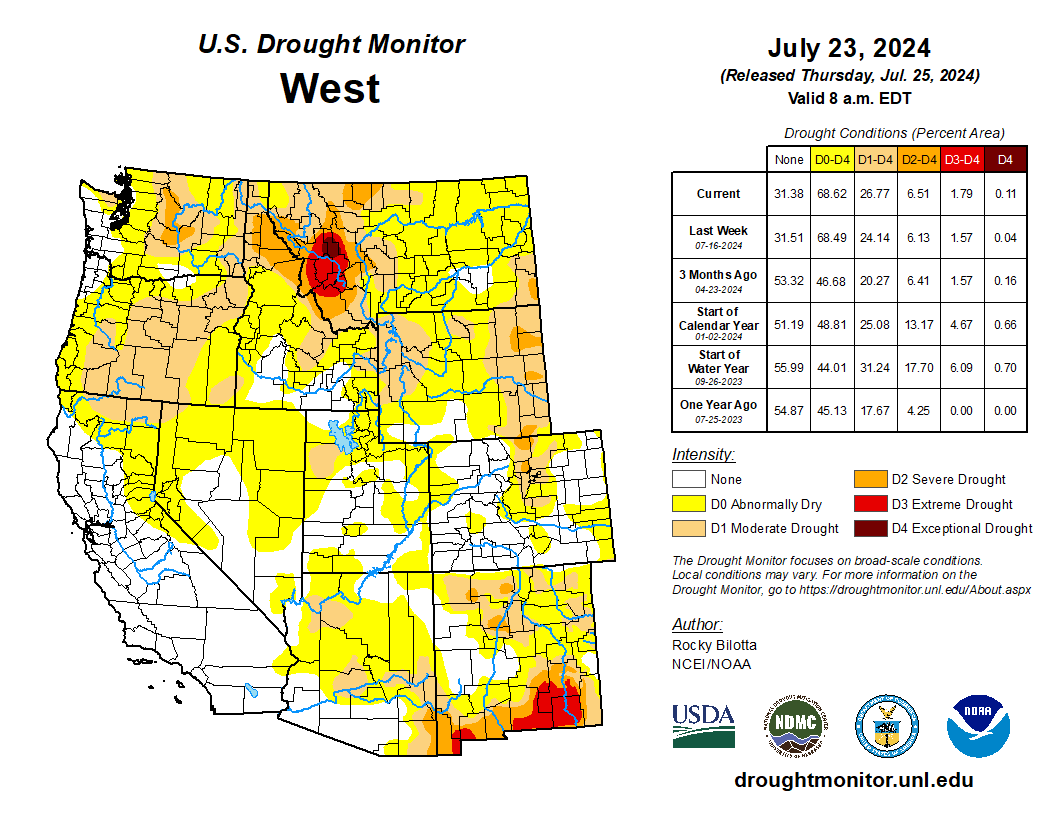
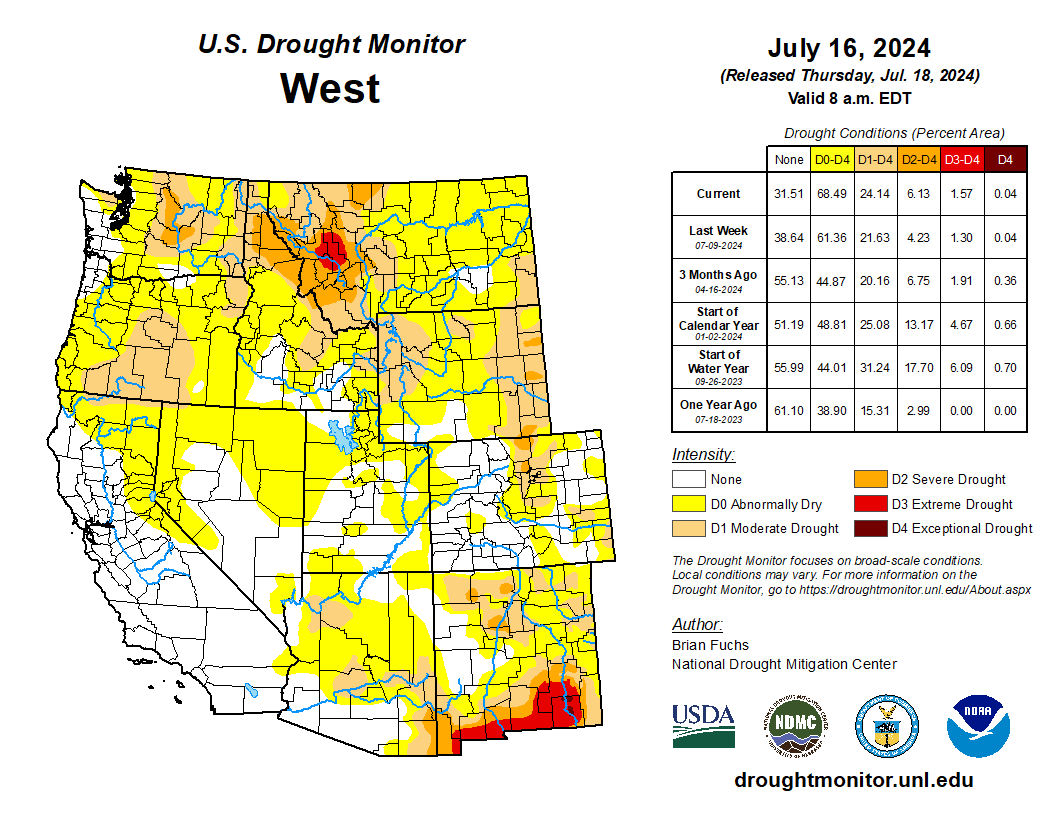
Average temperatures were well above normal across much of the West this week. Temperatures ranged between 3 to 9 degrees F above normal across much of the region, while northern portions of the region observed temperatures up to 12 degrees F above normal this week. Precipitation fell across much of the region but amounts were mostly below-normal for the region. The heaviest precipitation amounts were measured over parts of New Mexico. Above-normal precipitation (up to 6 inches), along with cooler temperatures, resulted in the removal of exceptional drought from southeast New Mexico and improvements to extreme drought, severe drought, moderate drought and abnormal dryness across eastern and southern portions of the state. Conversely, warmer-temperatures and below-normal precipitation resulted in the introduction of exceptional drought in western Montana, as well as the expansion of drought in other parts of Montana, across much of Oregon into northern California, while moderate drought was introduced in northwest Utah. The expansion of abnormal dryness occurred in parts of Nevada, which missed out on some of the beneficial rains resulting in the expansion of moderate drought in the area. Conditions remained dry in the interior parts of Washington, resulting in expansion of moderate drought and abnormal dryness based on short-term SPI/SPEI data, as well as low soil moisture and streamflow…
Dry conditions continued across much of the northern portions of the South this week, while heavy precipitation fell across much of central Texas and in parts of northern Arkansas, with areas reporting rainfall totals greater than 600% of normal. Abnormal dryness was removed from northern Arkansas, while moderate to extreme drought were improved across much of central Texas. Improvements were also made to parts of northern and eastern Tennessee where spotty showers brought much needed relief, returning areas back to their 30-day precipitation normals. Conversely, conditions continued to deteriorate in parts of northern Kansas and parts of western Texas, where precipitation totals were 5% to 25% of normal for the past month. Moderate to severe drought were expanded into central Kansas, while extreme drought was expanded and exceptional drought was introduced into the Trans-Pecos region of Texas this week. Temperatures were below-normal across much of the South, while departures of 1 to 6 degrees F above normal were observed across parts of western Texas. The expansion and intensification of drought categories were based on short-term SPI/SPEI, reservoir levels, streamflow and soil moisture data…
Looking Ahead
During the next five days (July 23–27, 2024), dangerous heat is expected to continue through the midweek across much of the West, with high temperatures reaching the 90s and 100s and ranging between 5-15 degrees above normal. The strong ridge, extending from the Southwest U.S. into west-central Canada, which produced hazardous heat from the West into the northern High Plains, should begin to weaken and begin to push eastward ahead of a Pacific upper low tracking into western Canada and trailing trough that will settle near the West Coast. Monsoonal conditions will promote daily episodes of showers and storms over the Four Corners states and into the Great Basin under and near upper ridging over that part of the country. Meanwhile, one or more wavy fronts will be on the leading side of Great Lakes into southern Plains mean troughing aloft, leading to multiple days of rain and thunderstorms with areas of heavy rainfall from the southern Plains into the Mid-Atlantic and parts of New England. The Great Lakes and Northeast should eventually trend drier late week as the northern part of the trough moves eastward. Consensus still shows the Atlantic upper ridge building into the Southeast for a time, peaking in strength around Wednesday-Thursday.
The Climate Prediction Center’s 6-10 day outlook (valid July 28–August 1, 2024) favors above-normal precipitation along much of the eastern contiguous U.S. and Alaska, as well as parts of Northwest, with below-normal precipitation across most of the interior West and in parts of New England. Increased probabilities for above-normal temperatures are forecast for much of the contiguous U.S., while below-normal temperatures are likely across the state of Alaska and in southern parts of California and Texas.
US Drought Monitor one week change map ending July 23, 2024.
Sunrise at Ruedi Reservoir October 20, 2015. Photo via USBR.
From email from Reclamation (Anna Perea):
July 24, 2024
The Bureau of Reclamation has scheduled the annual public meeting to discuss the Ruedi Reservoir Water Operations for the 2024 water year. The meeting will be held on Wednesday August 7, 2024, from 6:00 p.m. – 8:00 p.m. at the following location:
Roaring Fork Conservancy River Center 22800 Two Rivers Road Basalt, CO 81621
Topics will include:
Reservoir operations update (Reclamation)
Colorado River 15-Mile Reach endangered fish update (U.S. Fish and Wildlife)
Fryingpan River projects (Roaring Fork Conservancy)
Updates on Ruedi water leases (Colorado Water Conservation Board)
Overview of East Slope Fryingpan-Arkansas Project (Reclamation)
Public question and answer session
For more information, please contact Tim Miller, Hydrologist, Eastern Colorado Area Office, by phone or e-mail: (970) 461-5494, or tmiller@usbr.gov.
Media inquiries or general questions about Reclamation should be directed to Anna Perea, Public Affairs Specialist, at 970-290-1185 or aperea@usbr.gov. If you are deaf, hard of hearing or have a speech disability, please dial 7-1-1 to access telecommunications relay services.
Click the link to read the release on the NRCS website:
June 11, 2024
USDA also signs agreement with Western Governors to strengthen shared efforts to protect communities and resources
During a meeting of the Western Governors Association today, Deputy Secretary of Agriculture Xochitl Torres Small announced that USDA is investing nearly $66 million for projects to reduce wildfire risk, protect water quality and improve forest health across the nation as part of President Biden’s Investing in America agenda.
Deputy Secretary Torres Small also signed a Memorandum of Understanding (MOU) with the Western Governors’ Association, reestablishing the framework for cooperatively responding to the many challenges faced across western landscapes. The MOU, signed on behalf of the USDA alongside Governors Brad Little of Idaho, Joe Lombardo of Nevada, Michelle Lujan Grisham of New Mexico, Doug Burgum of North Dakota, and Mark Gordon of Wyoming, amplifies the scale of shared stewardship work between participating states and the USDA. It also fosters better integration of forest and rangeland health and wildfire risk reduction projects across different land ownerships.
“People across rural America face growing wildfire threats to their homes, business, infrastructure, and resources,” said Deputy Secretary Torres Small. “Through the investments announced today, President Biden is investing in state and local governments, Tribal partners, and private landowners to ensure our landscapes are healthy, our infrastructure is strong, and our communities stay safe.”
Of the total investment announced, $12 million is being provided through the USDA Forest Service’s Good Neighbor Authority, allowing the agency to collaborate with state forestry agencies, Tribes and counties to mitigate wildfire risk and enhance forest, rangeland and watershed health. This funding will support 22 projects across 13 states, thanks to funding from President Biden’s Bipartisan Infrastructure Law. Nearly $9 million of the total funding will be allocated to support projects in several states that are part of the Western Governors Association member states, including Arizona, California, Idaho, Montana, Oregon, Utah, Washington and Wyoming.
The Department is also investing nearly $55 million of the total funding to reduce wildfire risk, and improve water quality and forest health through the Joint Chiefs’ Landscape Restoration Partnership. This collaborative effort between USDA’s Natural Resources Conservation Service (NRCS) and Forest Service aims to work with private, state, and Tribal landowners to conserve forests and agricultural lands alongside federally managed lands while safeguarding communities. The $55 million investment will support 41 projects — including 10 new projects — across 11 states.
This program advances President Biden’s Justice40 Initiative, which sets a goal that 40% of the overall benefits of certain federal climate, clean energy, and other investments flow to disadvantaged communities that are marginalized by underinvestment and overburdened by pollution.
The NRCS and Forest Service are also now accepting proposals for Joint Chiefs’ Landscape Restoration Partnership projects for fiscal year 2025 projects. Applications are due on September 13, 2024.
“These projects are indicative of a growing movement of cooperation around natural resource issues for the betterment of us all,” said Forest Service Chief Randy Moore. “A keystone of the Joint Chiefs’ projects is the people and the understanding that the healthier our forests, the healthier our nation.”
“The Joint Chiefs’ Landscape Restoration Partnership enables NRCS and the Forest Service to collaborate with agricultural producers and forest landowners to invest in conservation and restoration at a big enough scale to make a difference in their communities,” said NRCS Chief Terry Cosby. “Working with federal, state and local agencies at this scale, helps reduce wildfire threats, protect water quality and supply, improve wildlife habitat for at-risk species, and ultimately combat climate change.”
Since 2014, USDA has invested more than $423 million in 134 projects in 42 states as well as Guam and Puerto Rico through the Joint Chiefs’ Landscape Restoration Partnership. This program focuses on areas where national forests and grasslands intersect with privately-owned lands.
Good Neighbor Authority
Established by Congress in 2014, Good Neighbor Authority provides the Forest Service a straightforward way to enter into management agreements with states, Tribes and counties. The Good Neighbor Authority pools federal, state, Tribal, and county resources to complete more forest, rangeland, and watershed restoration work on national forests and grasslands. President Biden’s Bipartisan Infrastructure Law authorizes $160 million over five years for states and Tribes to implement restoration projects on federally managed lands through the Good Neighbor Authority and the Tribal Forest Protection Act.
USDA touches the lives of all Americans each day in so many positive ways. In the Biden-Harris administration, USDA is transforming America’s food system with a greater focus on more resilient local and regional food production, fairer markets for all producers, ensuring access to safe, healthy and nutritious food in all communities, building new markets and streams of income for farmers and producers using climate smart food and forestry practices, making historic investments in infrastructure and clean energy capabilities in rural America and committing to equity across the department by removing systemic barriers and building a workforce more representative of America. To learn more, visit usda.gov.
Click the link to read the release on the CIRES website (Ben Livneh, Nels Bjarke, Parthakumar A. Modi, Alex Furman, Darren Ficklin, Justin M Pflug, and Kris Karnauskas):
June 25, 2024
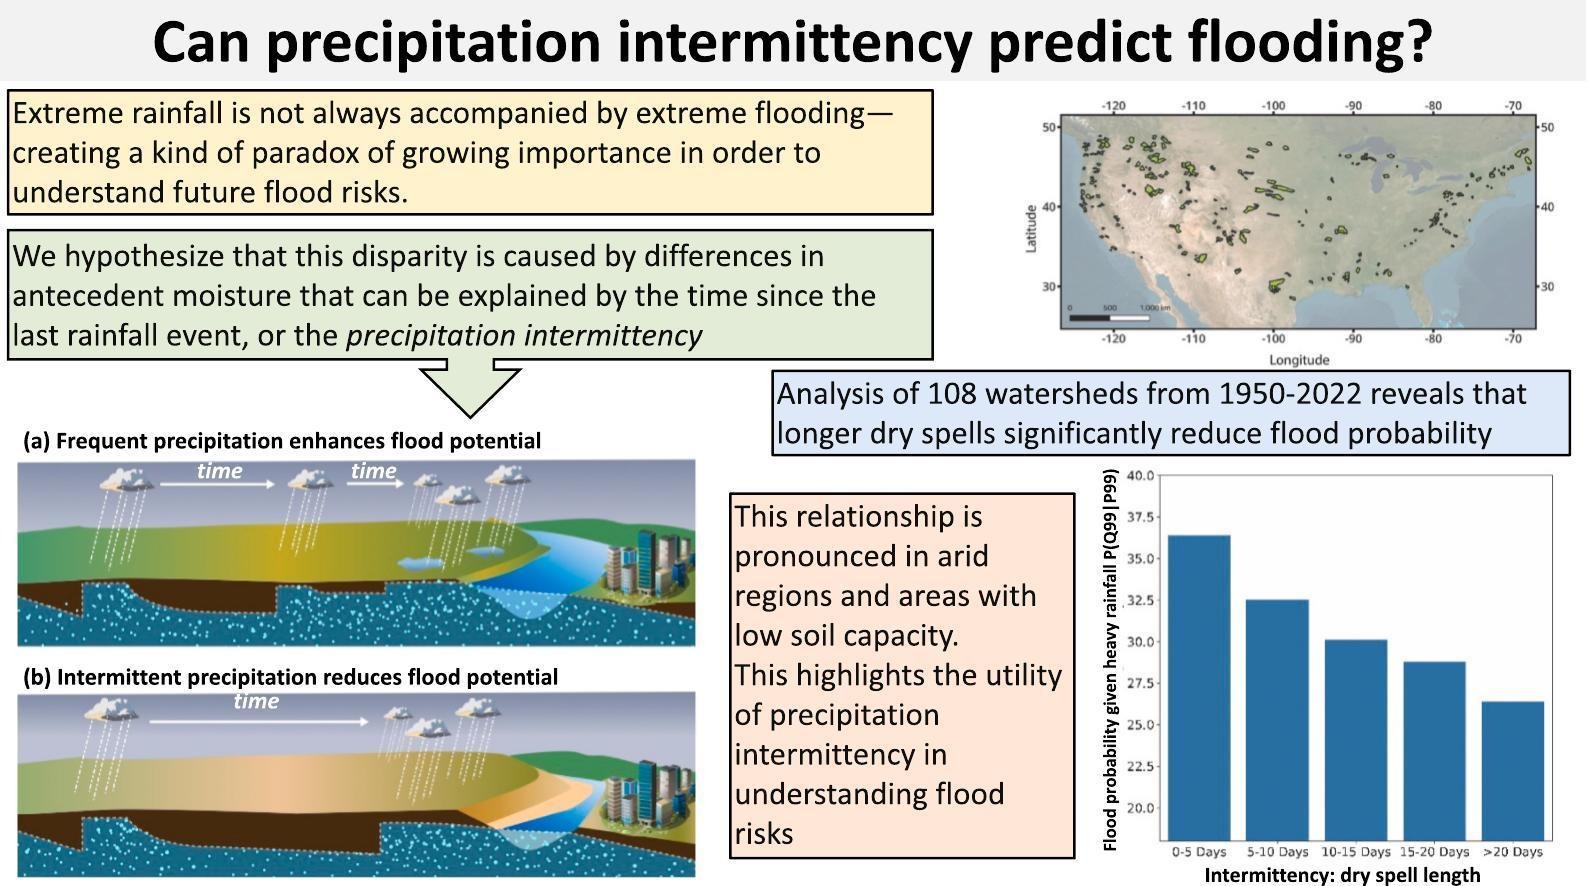
With record rainfall projected to continue into the future, many worry extreme flooding will follow suit. But a new CIRES-led study published today in Science of the Total Environment found an increase in precipitation alone won’t necessarily increase disastrous flooding — instead, flood risk depends on how many days have passed between storms.
Credit: CIRES
In the study, CIRES Fellow and Western Water Assessment director Ben Livneh and his colleagues, including CIRES Fellow Kris Karnauskas, looked for a new way to understand soil moisture and how it impacts flooding. The research team knew soil moisture is important when understanding floods, but measuring soils effectively is challenging.
So they found a proxy for soil moisture: precipitation intermittency, the length of a dry spell between precipitation events. Simply put: after a prolonged time since the last rain, it takes a larger storm to generate flooding; with fewer days between storms, a wider range of conditions can lead to flooding.
“We can actually understand changes in flood risk based on the number of days since the last rain event,” Livneh said. “We wanted to make it straightforward because soil water is hard to predict.”
The research focused on semi-arid and arid regions and looked at rain as a form of precipitation rather than snow. To create a value for precipitation intermittency, researchers looked at historical observations of 108 watersheds around the U.S. from 1950-2022. Through analysis of these observations, the goal was to understand whether wet or dry soils preceded heavy rain events — and how that influenced floods.
Soil moisture is notoriously difficult to estimate or simulate, results can vary from one person’s backyard to their front yard, and understanding how soil moisture influences flood events is even harder. Nels Bjarke, a Western Water Assessment postdoctoral researcher, ran the analysis for the study.
“We don’t have comprehensive observations of soil moisture that are continuous over space or continuous through time,” said Bjarke. “Therefore, it can be difficult to apply some sort of predictive framework for flooding using just soil moisture because the data are sparse.”
Yet, precipitation is widely measured, so the team tested precipitation as a proxy for soil moisture by looking at the timing of rain, rather than the amount.
Through analysis, the team created a timescale as a meaningful value for precipitation intermittency. They categorized intermittency into segments of five days. Ten days or less indicated low intermittency, when a high range of storms could produce floods. Drier periods with 20 days or more between storms defined high intermittency, and only serious storms could produce floods. Overall, flood probabilities are 30 percent lower following long periods of dry spells.
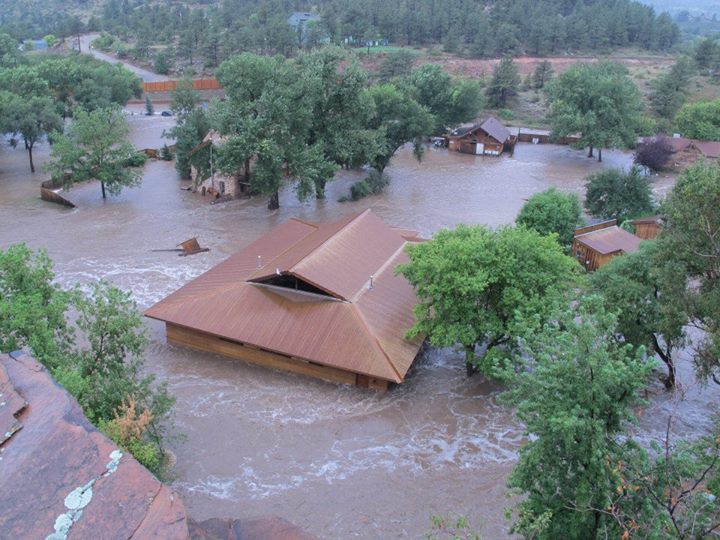
Planet Bluegrass during the September 2013 flood. The Wildflower Pavilion is the building at center. (Courtesy of town of Lyons)
The 2013 floods in Boulder are a real-life example of how precipitation intermittency is applied to flood projections. Seven days of heavy rain nearly doubled the previous record for rainfall. The event displaced hundreds and caused $2 billion in property damage, according to NOAA.
Forecasters and emergency managers could use the paper’s findings to anticipate very real flooding risks. Since wide-ranging observations of precipitation exist, forecasters can take the findings of this paper and use intermittency to help predict the likelihood of a flood.
“As we enter the era of big data, we can benefit from simple proxies like the dry-spell length as a way to more intuitively understand extreme events,” said Livneh.
Authors of the paper “Can precipitation intermittency predict flooding” in Science of the Total Environment are: Ben Livneh, Nels Bjarke, Parthakumar A. Modi, Alex Furman, Darren Ficklin, Justin M Pflug, and Kris Karnauskas (CIRES Fellow).
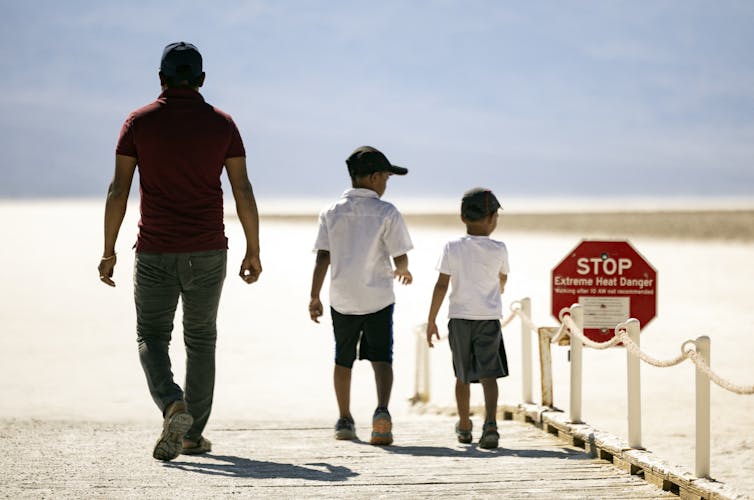
Visitors walk past a sign reading ‘Stop: Extreme Heat Danger’ in Death Valley National Park during a heat wave on July 7, 2024. Etienne Laurent/AFP via Getty Images
A month into summer 2024, the vast majority of the U.S. population had already experienced at least one extreme heat wave, and millions of people were under heat alerts, with forecasts warning of more ahead.
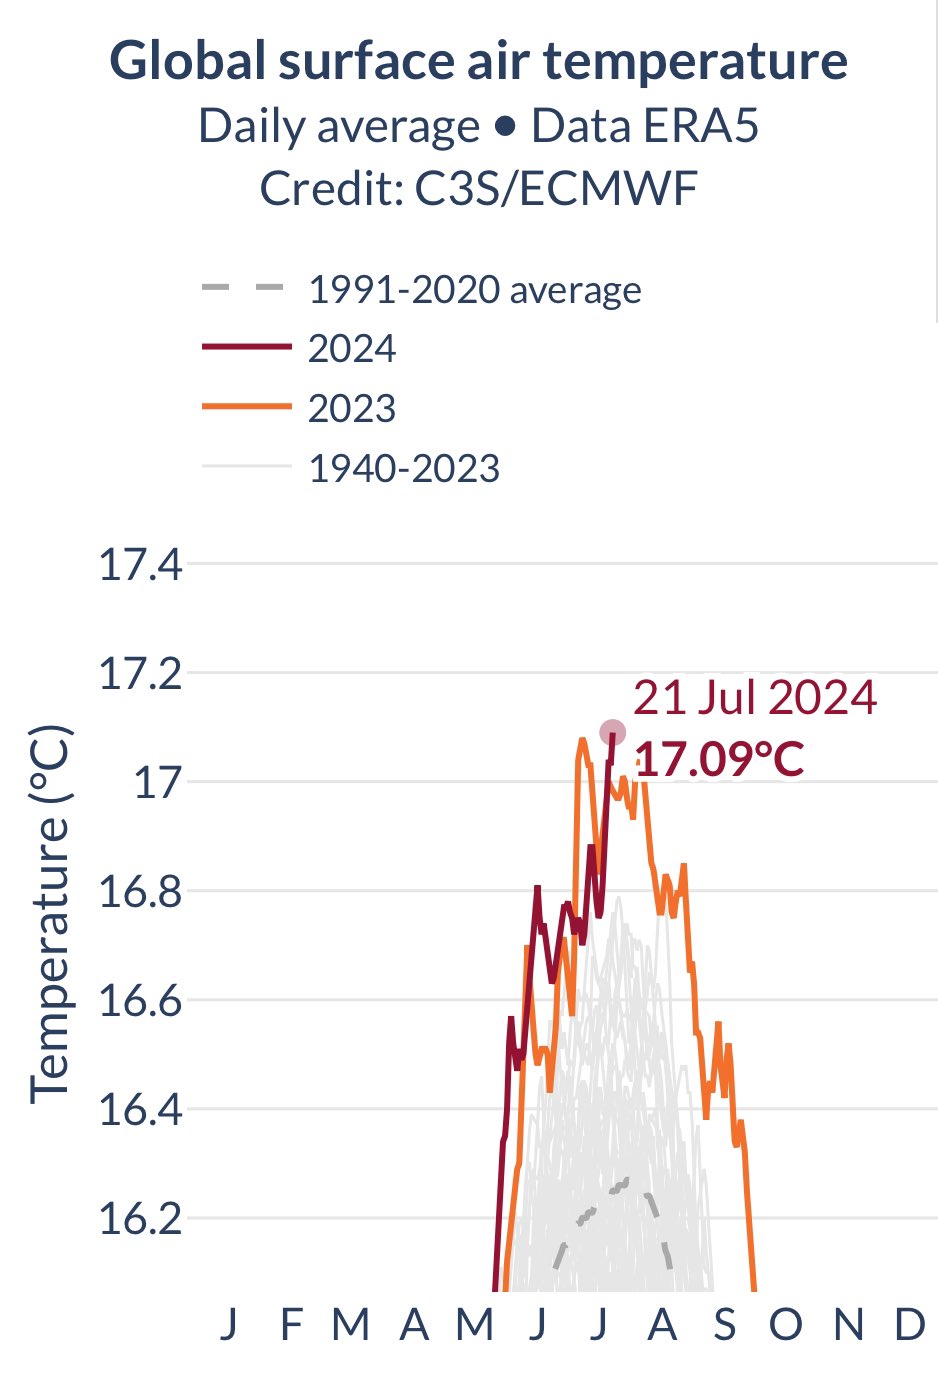
Globally, the planet had its hottest day in at least eight decades of recordkeeping on July 21 – and then broke the record again on July 22, according to the European Union’s Copernicus Climate Change Service.
The extreme heat is part of a longer trend: Each of the past 13 months has been the hottest on record for that month globally, including the hottest June, the EU service reported in early July. It also found that the average temperature for the previous 12 months had been at least 1.5 C (2.7 F) warmer than the 1850-1900 pre-industrial average.
The 1.5 C warming threshold can be confusing, so let’s take a closer look at what that means. In the Paris climate agreement, countries worldwide agreed to work to keep global warming under 1.5 C, however that refers to the temperature change averaged over a 30-year period. A 30-year average is used to limit the influence of natural year-to-year fluctuations.
So far, the Earth has only crossed that threshold for a single year. However, it is still extremely concerning. We study weather patternsinvolving heat. The world appears to be on track to cross the 30-year average threshold of 1.5 C within 10 years.
Heat is becoming a global problem
Several countries have experienced record heat across the Americas, Africa, Europe and Asia in 2024. In Mexico and Central America, weeks of persistent heat starting in spring 2024 combined with prolonged drought led to severe water shortages and dozens of deaths.
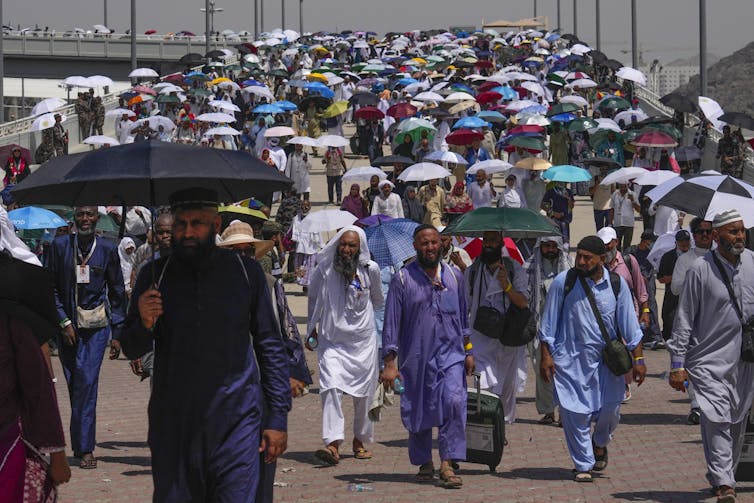
Muslim pilgrims spent hours in extreme temperatures and humidity during the Hajj in June 2024 in Saudi Arabia. Over 1,000 people died in the heat. AP Photo/Rafiq Maqbool
Hospitals in Karachi, Pakistan, were overwhelmed amid weeks of high heat, frequent power outages, and water shortages in some areas. Neighboring India faced temperatures around 120 F (48.9 C) for several days in April and May that affected millions of people, many of them without air conditioning.
Although heat waves are a natural part of the climate, the severity and extent of the heat waves so far in 2024 are not “just summer.”
A scientific assessment of the fierce heat wave in the eastern U.S. in June 2024 estimates that heat so severe and long-lasting was two to four times more likely to occur today because of human-caused climate change than it would have been without it. This conclusion is consistent with the rapid increase over the past several decades in the number of U.S. heat waves and their occurrence outside the peak of summer.
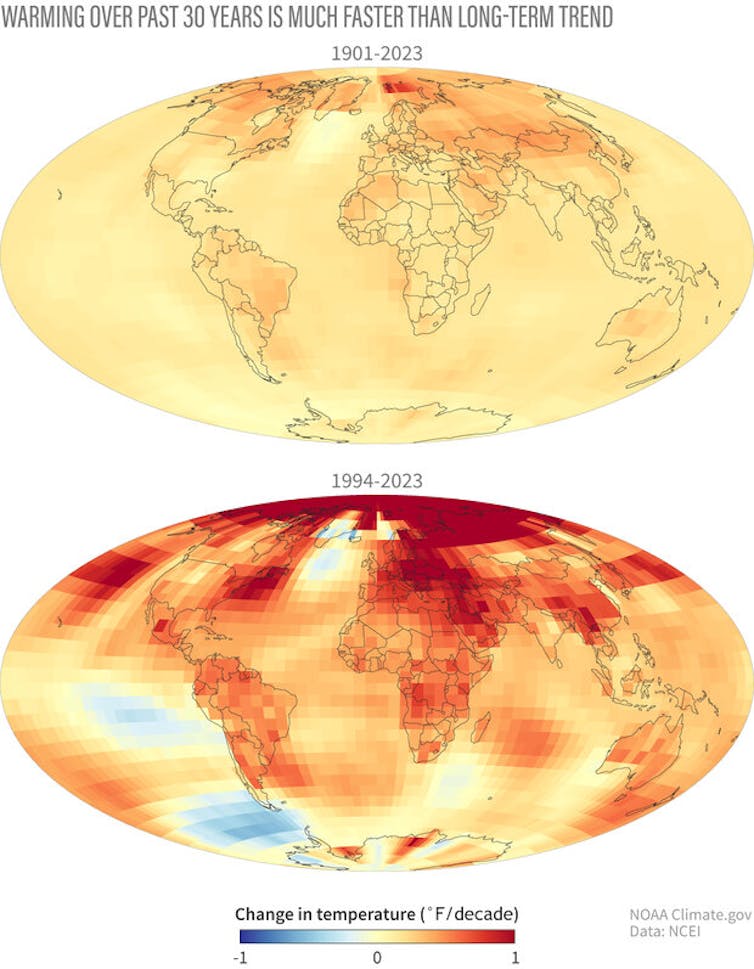
These record heat waves are happening in a climate that’s globally more than 2.2 F (1.2 C) warmer – when looking at the 30-year average – than it was before the industrial revolution, when humans began releasing large amounts of greenhouse gas emissions that warm the climate.
Global surface temperatures have risen faster per decade in the past 30 years than over the past 120. NOAA NCEI
While a temperature difference of a degree or two when you walk into a different room might not even be noticeable, even fractions of a degree make a large difference in the global climate.
At the peak of the last ice age, some 20,000 years ago, when the Northeast U.S. was under thousands of feet of ice, the globally averaged temperature was only about 11 F (6 C) cooler than now. So, it is not surprising that 2.2 F (1.2 C) of warming so far is already rapidly changing the climate.
If you thought this was hot
While this summer is likely be one of the hottest on record, it is important to realize that it may also be one of the coldest summers of the future.
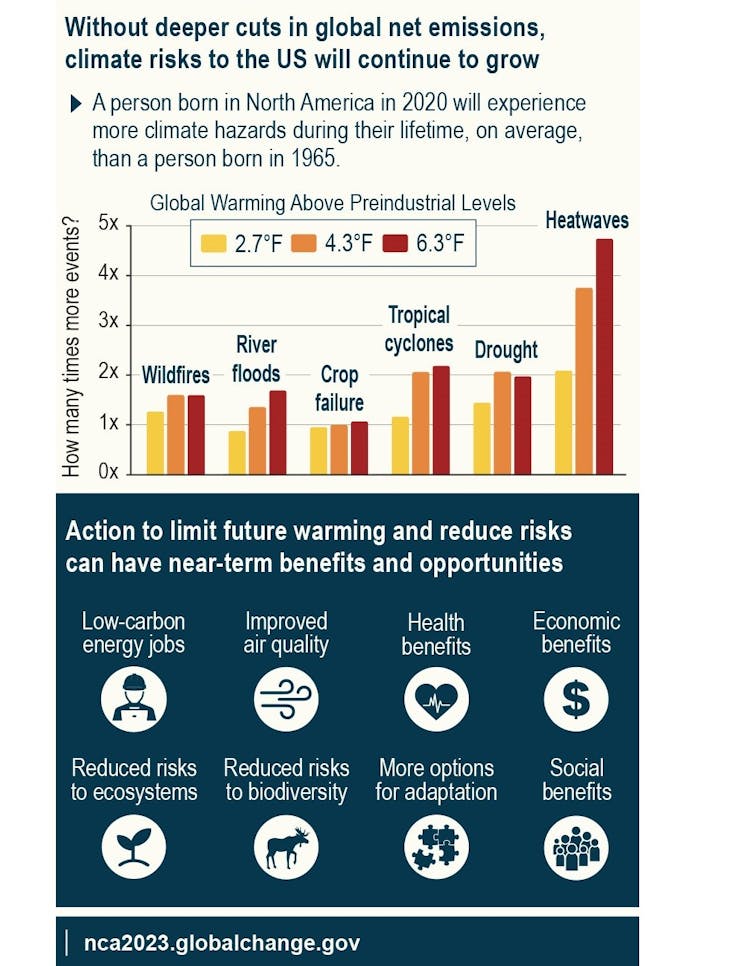
Actions to reduce warming can limit a wide range of hazards and create numerous near-term benefits and opportunities. National Climate Assessment 2023
There is much that humanity can do to limit future warming if countries, companies and people everywhere act with urgency. Rapidly reducing fossil fuel emissions can help avoid a warmer future with even worse heat waves and droughts, while also providing other benefits, including improving public health, creating jobs and reducing risks to ecosystems.
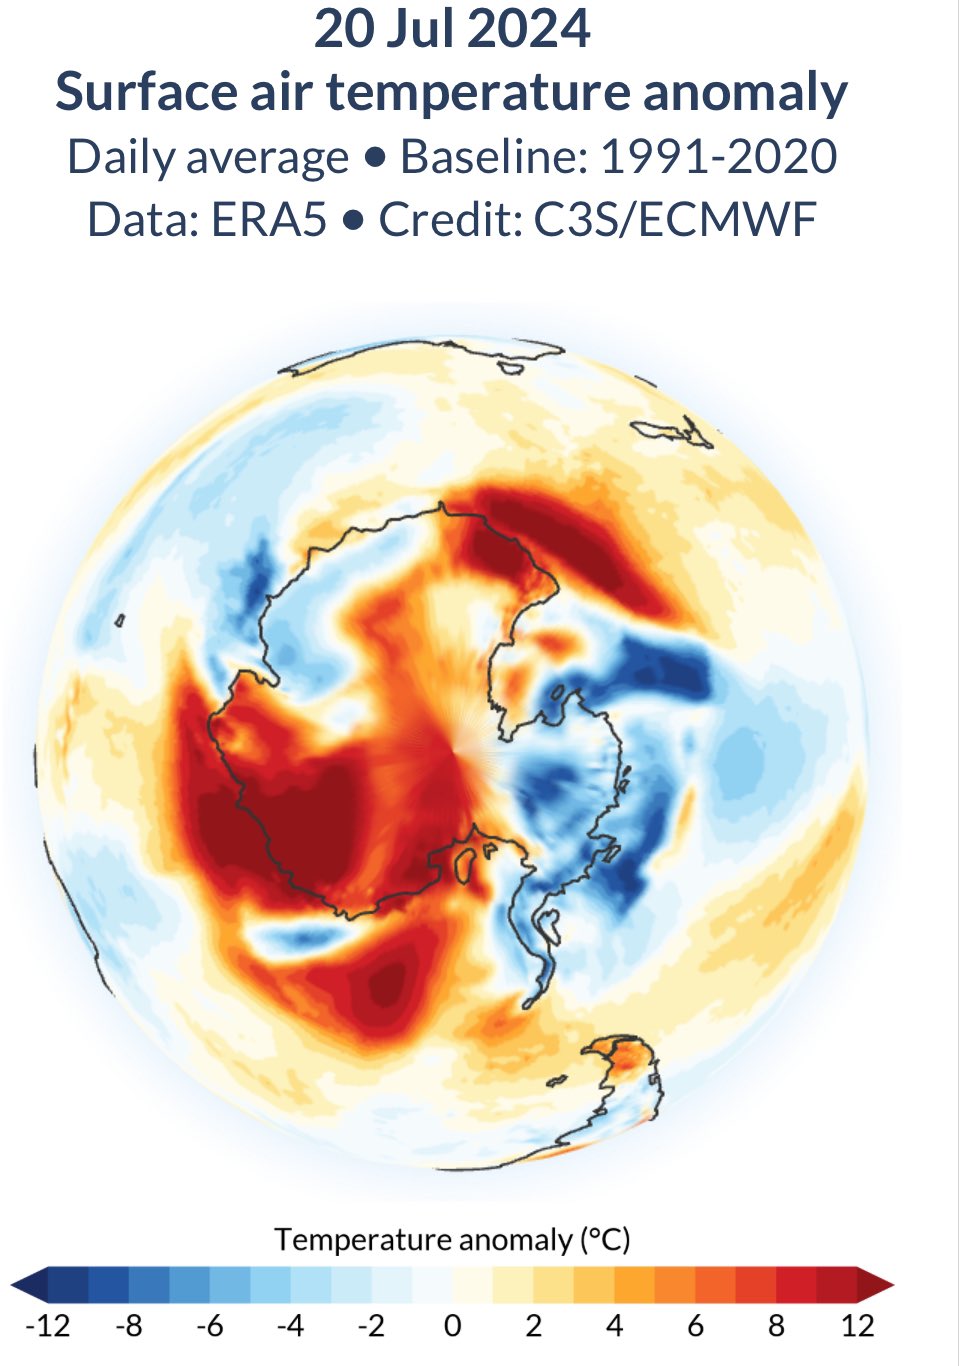
The most anomalously warm places were Antarctica and Western Canada where several hundred wildfires blaze, many out of control. July 20th pictured on the map (21st not available yet via Copernicus)
Click the link to read “Sunday was the hottest day ever recorded on Earth, scientists say” on The Washington Post website (Sarah Kaplan). Here’s an excerpt:
July 23, 2024
The historic day comes on the heels of 13 straight months of unprecedented temperatures and the hottest year scientists have ever seen.
Global temperatures hit the highest levels in recorded history on Sunday, according to preliminary data from Europe’s top climate monitor — another worrying sign of how human-caused climate change is pushing the planet into dangerous new territory. The results from the Copernicus Climate Change Service show the planet’s average temperature on July 21 was 17.09 degrees Celsius (62.76 degrees Fahrenheit) — breaking a record set only last year. The historic day comes on the heels of 13 straight months of unprecedented temperatures and the hottest year scientists have ever seen.
“We are in truly uncharted territory,” Copernicus director Carlo Buontempo said in a statement. “And as the climate keeps warming, we are bound to see records being broken in future months and years.”
[…]
Though Sunday was only slightly warmer than the world’s previous hottest day, Copernicus researchers noted, it was extraordinarily hotter than anything that came before. Before July 2023, Earth’s daily average temperature record — set in August 2016 — was 16.8 degrees Celsius (62.24 degrees Fahrenheit). But in the past year, the global has exceeded that old record on 57 days.
“What is truly staggering is how large the difference is between the temperature of the last 13 months and the previous temperature records,” Buontempo said.
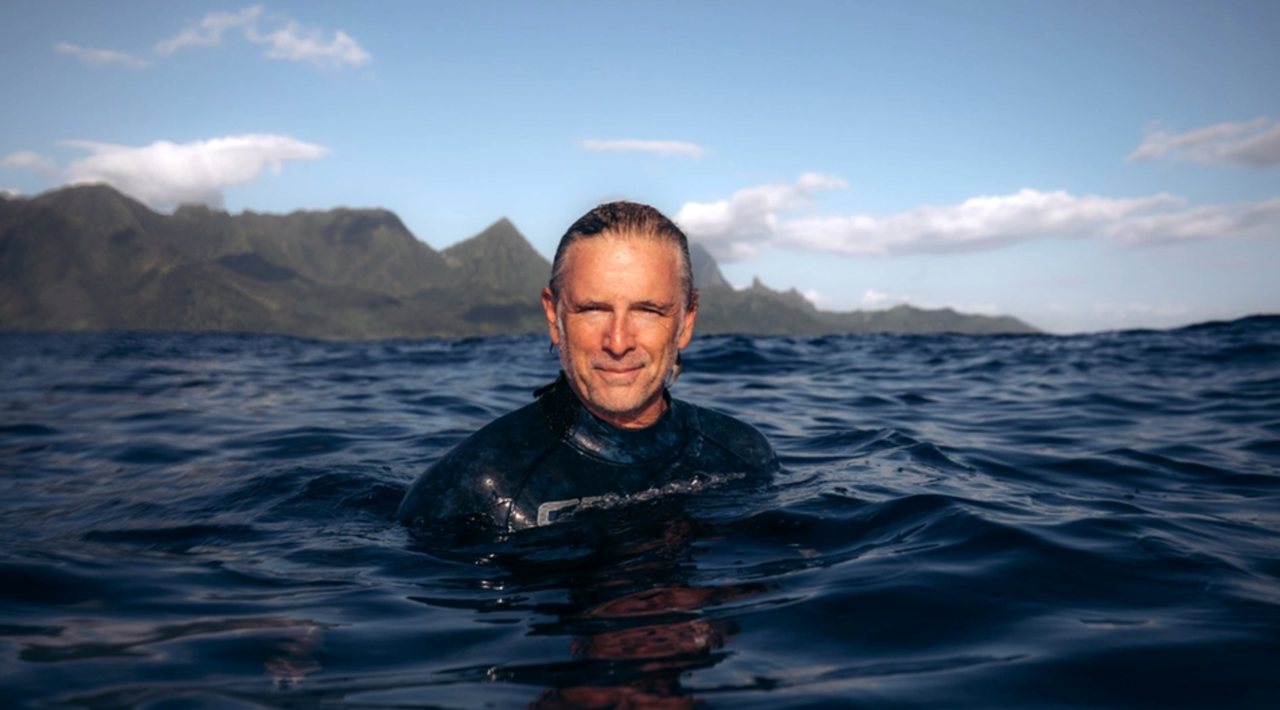
By now, you’ve likely heard the news of J’s passing. We want to thank you for your outpouring of love and support over the past few weeks.
I also want to thank Outside Magazine for its tribute to my husband, which was published earlier this month. And Plastic Pollution Coalition, who published this blog to honor him and his work.
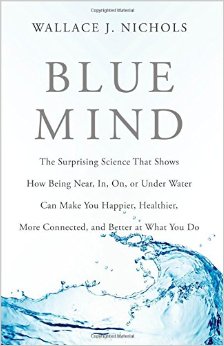
J dedicated his life to understanding how our connection to water and wildlife has the power to change our health and well-being. He worked tirelessly to share his findings with the world – from his best-selling book Blue Mind, to countless environmental organizations and movements that he founded and supported.
We are currently in the process of turning the Dr. Wallace J. Nichols Memorial Fund into a foundation. Our goal is to continue J’s important work, complete unfinished projects, and support causes he was passionate about, including:
The Blue Mind Movement reconnects people to water by linking ocean and waterway exploration, restoration, and conservation with neuroscience, psychology, public health, and well-being. This involves an annual summit, workshops, research collaborations and a small grants program through The Ocean Foundation.
Billion Baby Turtles Project was founded by J and Brad Nahill to increase the number of baby sea turtles in oceans around the world. To date, we have saved nearly 1 million hatchlings at nesting beaches in El Salvador, Mexico, Nicaragua, Costa Rica, and elsewhere.
Blue Marbles Project has a goal of passing a marble through every person’s hand on earth, with a simple message of gratitude. Since our launch in 2009, millions around the world have joined hands to create a blue global community.
Force Blue unites the community of Special Operations veterans with the world of marine conservation, for the betterment of both. J was deeply passionate about Force Blue’s mission and loved supporting the project with his time and energy.
Plastic Pollution Coalition is a non-profit communications and advocacy organization that collaborates with an expansive global alliance of organizations, businesses, and individuals to create a more just, equitable, regenerative world free of plastic pollution and its toxic impacts. J was a longtime friend and founding advisor to the Plastic Pollution Coalition.
Thank you to everyone who has contributed to the fund thus far. We are grateful for your generosity and deeply moved by your stories of J’s impact on all our lives.
If you’re interested in helping with the foundation and preserving J’s legacy, please contact me directly at legacy@wallacejnichols.org.
We wish you water,
Dana Nichols
Blue Mind can be a life-changing read, wholeheartedly recommended by Coyote Gulch.
One year ago, the Supreme Court issued its sweeping decision in the case Sackett v. EPA, which invalidated federal Clean Water Act protections for most streams and wetlands in the United States. Since then, the fight for clean water protections has been at the state level. This report outlines the state of clean water protections one year out from the Sackett decision and why federal protections for our critical waters is vital in the face of worsening climate change and other threats.
In the year since the Supreme Court ruling, two states passed or introduced legislation to create new permitting programs to fill the gap in federal protections and eight states passed or introduced stronger laws and policies to strengthen state protections. Two states passed legislation weakening state-level protections, while efforts to weaken state protections failed in four other states.
The Importance of Wetlands and Streams
Wetlands and streams are the livers and heart of our ecosystems. These critical waters prevent flooding, filter pollution, store carbon, and provide critical habitat for wildlife. According to the Environmental Protection Agency (EPA), ”Wetlands are among the most productive ecosystems in the world, comparable to rain forests and coral reefs.”
Similarly, streams that flow only part of the year play a critical role in maintaining the quality and supply of our drinking water and aid water conservation.
Our lakes and rivers depend on these critical waters, which in turn depend on the Clean Water Act (CWA or the Act) for protections to keep them healthy for fishing and swimming, agriculture and other business uses, and as a source for drinking water. In many cultures, particularly Indigenous cultures, water has a deep religious and spiritual element, and water is seen as life — waters are considered sacred places to cherish and protect. To limit their protection under the CWA could degrade the quality of water in waterways that people and wildlife depend on.
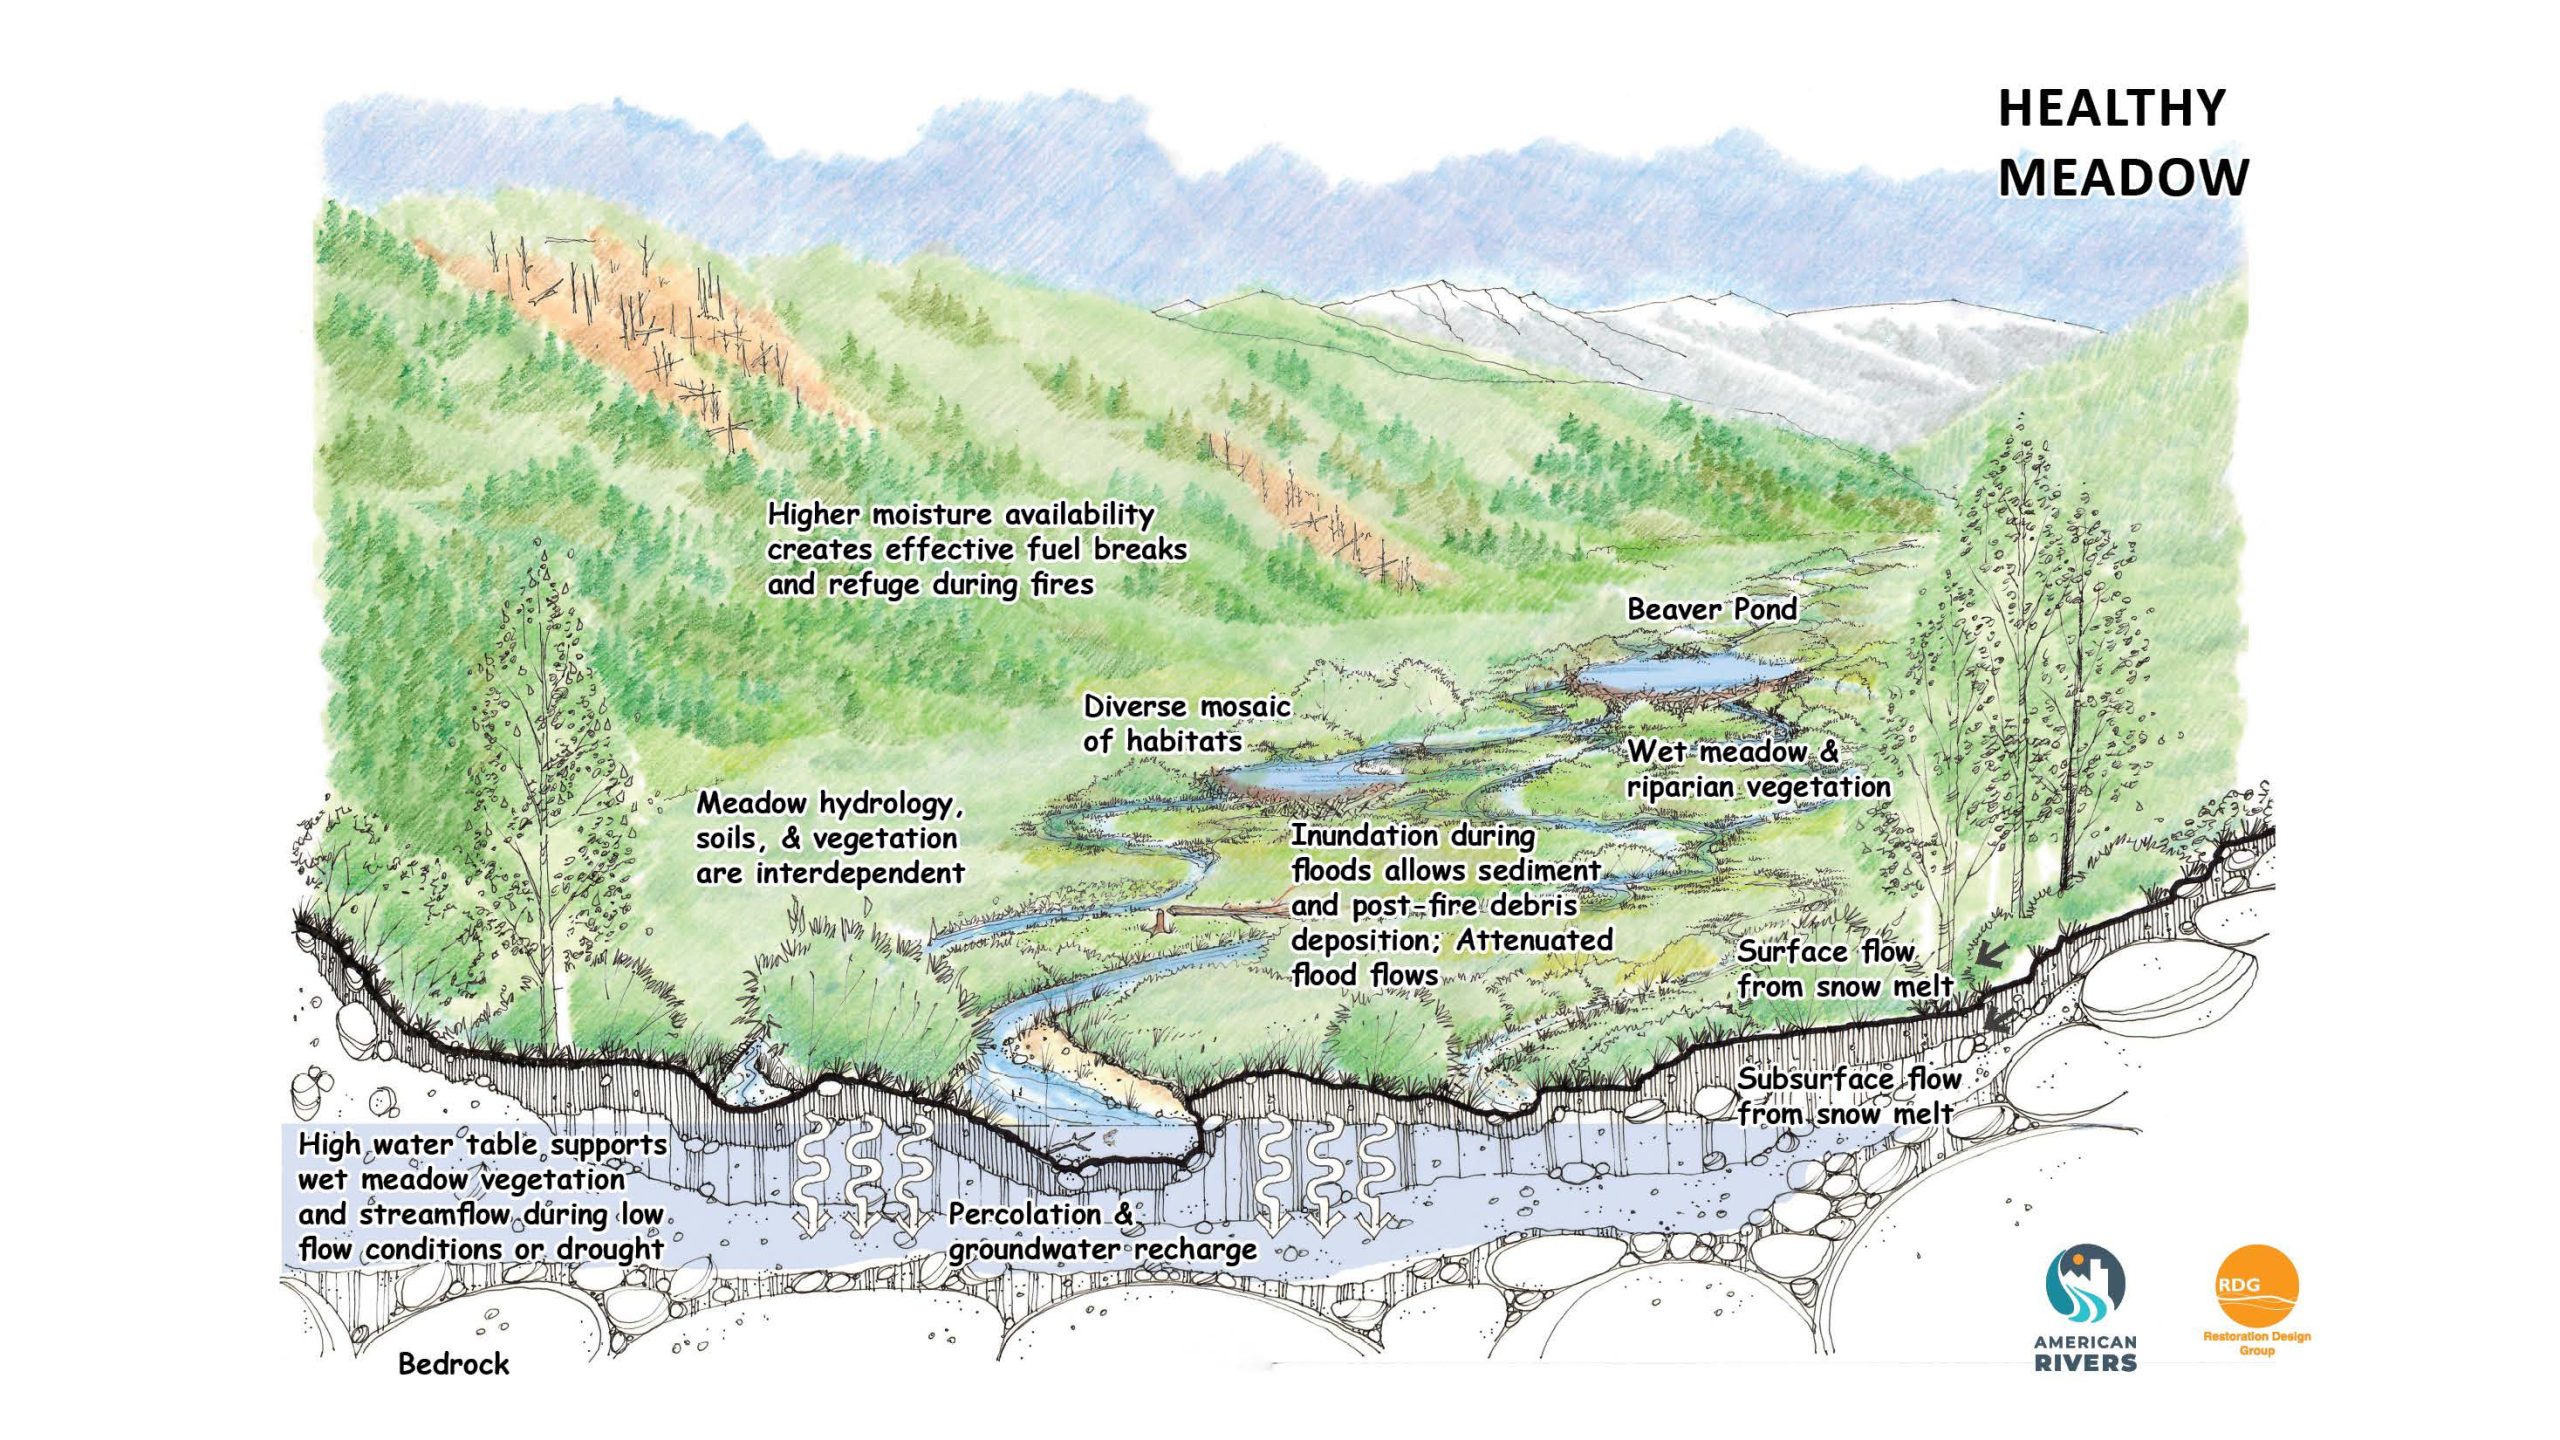
Healthy mountain meadows and wetlands are characteristic of healthy headwater systems and provide a variety of ecosystem services, or benefits that humans, wildlife, rivers and surrounding ecosystems rely on. The complex of wetlands and connected floodplains found in intact headwater systems can slow runoff and attenuate flood flows, creating better downstream conditions, trapping sediment to improve downstream water quality, and allowing groundwater recharge. These systems can also serve as a fire break and refuge during wildfire, can sequester carbon in the floodplain, and provide essential habitat for wildlife. Graphic by Restoration Design Group, courtesy of American Rivers
Oregon silverspot butterfly (Argynnis zerene hippolyta). Photo credit: Oregon Department of Fish & Wildlife
Click the link to read the release on the USFWS website (Marylin Kitchell):
The U.S. Fish and Wildlife Service today announced $48.4 million in grants to 19 states and Guam to support land acquisition and conservation planning projects on over 23,000 acres of habitat for 80 listed and at-risk species through the Cooperative Endangered Species Conservation Fund (CESCF). The grants will be matched by more than $27.75 million in partner funds.
“Thanks to the Endangered Species Act, this critical funding will help in conserving our nation’s most imperiled wildlife and vital habitat while fostering partnerships between federal, state and local governments, private landowners and communities,” said Service Director Martha Williams. “These grants support the Biden-Harris administration’s America the Beautiful initiative goal to conserve, connect and restore 30 percent of the Nation’s lands and waters by protecting biodiversity, slowing extinction rates and facilitating collaborative restoration efforts.”
Authorized by Section 6 of the Endangered Species Act and partly funded through the Land and Water Conservation Fund, CESCF grants contribute millions annually to support the implementation of state and territorial programs that conserve and recover federally listed and at-risk species on non-federal lands. This approach to conservation, done in cooperation with states, territories, willing landowners and local partners, furthers species conservation and facilitates compatible economic development.
CESCF land acquisition funding to states is awarded through two nationally competitive grant programs: the Recovery Land Acquisition Grant Program, which provides funds for the acquisition of habitat in support of Service-approved recovery plans, and the Habitat Conservation Plan Land Acquisition Grant Program, which provides funds to acquire habitat for listed and at-risk species to complement conservation strategies of approved HCPs. This year’s awards, totaling more than $41.4 million, will fund the acquisition and permanent protection for 21 projects over 23,000 acres of habitat across 16 states for the benefit of 40 listed and at-risk species, including the Indiana bat, wood stork, gopher tortoise, Oregon silverspot butterfly and speckled pocketbook mussel.
The Service also approved more than $6.9 million in grant awards to five states and Guam under the Conservation Planning Assistance Grant Program. Funding awarded through this program may be used to support the development, renewal or amendment of voluntary landowner agreements, i.e., HCPs and conservation benefit agreements. Eligible activities include document preparation, public outreach, baseline species surveys, habitat assessments, inventories and environmental compliance. This year’s awards will support nine conservation planning efforts covering 51 listed, candidate and at-risk species, such as the western snowy plover, Mariana fruit bat, San Joaquin kit fox and Everglade snail kite.
For a full list of awards and to learn more about the CESCF grant programs, please visit the Service’s program page.
The ESA provides a critical safety net for North America’s native fish, wildlife and plants. The Service is working to actively engage conservation partners and the public in the search for improved and innovative ways to conserve and recover imperiled species. Learn more online about our endangered species efforts.
Snowy plover (Charadrius nivosus) at Bon Secour National Wildlife Refuge. By U.S. Fish and Wildlife Service Southeast Region – Snowy Plover (Charadrius nivosus)Uploaded by AlbertHerring, Public Domain, https://commons.wikimedia.org/w/index.php?curid=29813304
FPV system sited on a non-powered reservoir Illustration by Besiki Kazaishvili, NREL
Click the link to access the report on the NREL website (Aaron Levine, Taylor L. Curtis, Ligia E.P. Smith, and Katie DeRose). Here’s the executive summary:
June 2024
Executive Summary
To meet the nation’s decarbonization goals, the U.S. Department of Energy’s Solar Futures study forecasts that installed solar photovoltaic (PV) capacity must increase nearly tenfold, from 80 gigawatts (GW) in 2020 to approximately 760 GW cumulative installed capacity by 2035 (DOE 2021). Ground-mounted PV is expected to dominate future solar deployment and will require more than 3.5 million acres of land to meet annual demand projections (of nearly 45 GW) by 2030 (DOE 2021). However, various competing demands for land (e.g., agricultural production, conservation) and high land acquisition costs in specific locations could be challenges to meeting future PV demand solely with ground-mounted PV deployment (Wood MacKenzie 2023; DOE 2021; Oliveira-Pinto and Stokkermans 2020). Floating photovoltaics (FPV) may be an alternative in locations where ground-mounted PV is not feasible and aid in reaching the nation’s PV deployment and decarbonization goals (DOE 2021; Oliveira-Pinto and Stokkermans 2020; Hooper, Armstrong, and Vlaswinkel 2020; Gallucci 2019).
FPV is a newer siting approach in which a PV array is affixed to a floating apparatus and sited on a water body like a reservoir behind a dam. FPV systems may be stand-alone or co-located a new or existing hydroelectric facilities or pumped storage hydropower (PSH) facility reservoirs. Co-located FPV systems may or may not be operationally paired and work in tandem with the hydroelectric or PSH facility (Gadzanku and Lee 2022; Gadzanku et al. 2021a, 2021b; Lee et al. 2020; Oliveira-Pinto and Stokkermans 2020; Spencer et al. 2018).
Although FPV deployment in the United States is nascent with less than 30 projects installed, significant potential has been identified at existing U.S. reservoirs (Chopra and Garasa Sagardoy 2022). A 2018 National Renewable Energy Laboratory (NREL) study identified more than 24,000 manmade reservoirs (with a total surface area of more than 2 million hectares) in the United States with technical FPV potential; the largest opportunities were found at reservoirs owned by the U.S. Army Corps of Engineers (USACE) and the Bureau of Reclamation (Reclamation). The NREL study estimated that, if fully realized, FPV systems on U.S. water bodies could have produce almost 10% of the nation’s electricity generation in 2018 (approximately 786 terawatt-hours) (Spencer et al. 2018). A follow-on study completed by NREL in 2024 identified between 861 GW and 1,042 GW (corresponding to 1,221 terawatt- hours and 1,476 terawatt-hours) of technical resource potential across USACE, Reclamation, and Federal Energy Regulatory Commission (FERC)-licensed reservoirs.
Current U.S. domestic FPV development is mostly limited to small-scale projects of less than 1 megawatt (MW) sited on closed-loop water bodies such as wastewater treatment plants, drinking water ponds, and irrigation water storage ponds (Chopra and Garasa Sagardoy 2022). Nevertheless, the versatility, potential benefits, and resource potential of FPV have led to growing investment in recent years, which is expected to continue as PV developers look to alternatives like FPV to meet growing demand (Wood MacKenzie 2023; Chopra and Garasa Sagardoy 2022).
This report provides novel analysis to understand the opportunities and challenges associated with developing stand-alone and co-located FPV projects on Reclamation reservoirs, USACE reservoirs, and FERC-licensed reservoirs in the United States. Specifically, the report explores potential environmental and energy benefits and environmental impacts associated with the siting, construction, and operation of FPV projects. The report also identifies and analyzes U.S. federal- and state-issued permits and authorizations required by federal laws to understand the licensing pathways and regulatory requirements for FPV projects sited on FERC-licensed reservoirs, Reclamation-powered and non-powered reservoirs, and USACE powered and non- powered reservoirs.
Of note, this report only analyzes the addition of FPV to reservoirs and does not consider FPV development on or above canal systems.
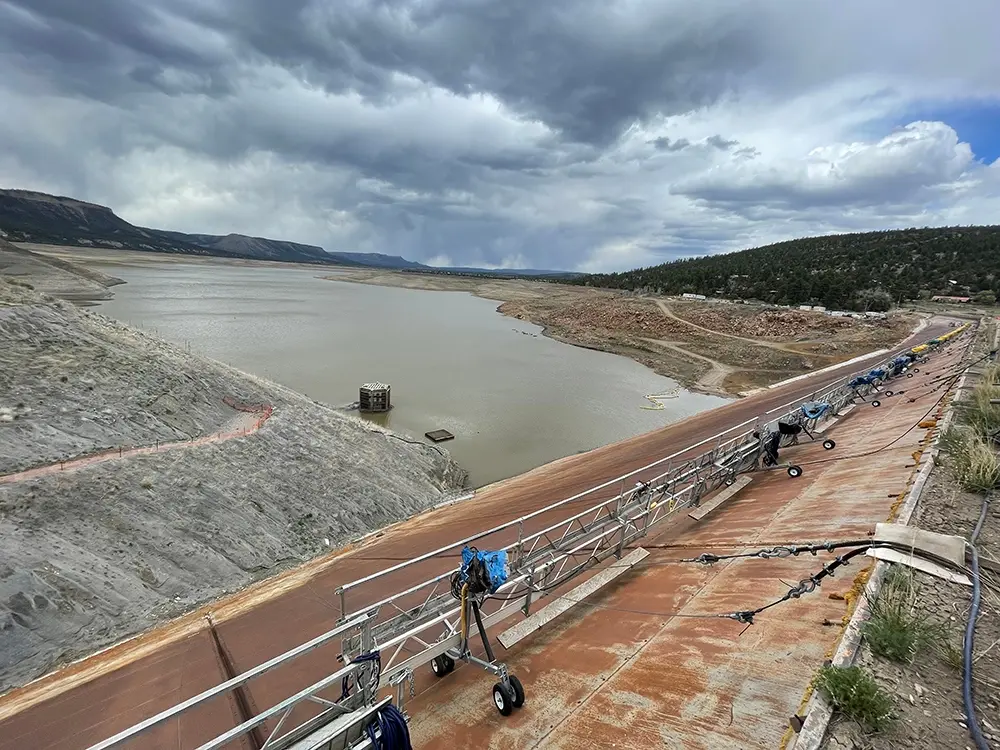
Construction crews attempt to repair the El Vado dam along the Rio Grande in New Mexico. The federal government has been unable to find a way to stop seepage behind the steel faceplate dam. U.S. Bureau of Reclamation
Click the link to read the article on the InkStain website (John Fleck):
July 15, 2024
Talking to Jake Bittle for his Grist piece on the trials and tribulations of El Vado Dam, he asked me a question I loved: “What does this mean in the larger scheme of things?”
My answer:
We seem to be living through a grand convergence of aging water infrastructure failure on New Mexico’s Middle Rio Grande this year.
We’ve talked in this space before about El Vado – built in the 1930s, unusable today. But it is only one example among many right now. If we are frank in recognizing that the main Rio Grande channel is a human artifact, dug in its current place and form in the 1950s, the list right now is long. The Flood Control Acts of 1948 (Public Law 80-858) and 1950 (Public Law 81-516) established the Middle Rio Grande Project and assigned the Bureau of Reclamation the job of performing Rio Grande channel maintenance.
Side channels were excavated by the Bureau of Reclamation along the Rio Grande where it passes through the Rhodes’ property to provide habitat for the endangered silvery minnow. (Dustin Armstrong/U.S. Bureau Of Reclamation)
The channel is infrastructure.
And it’s not just human water use that has optimized around the infrastructure. I was very careful in my comment to Jake – “entire human and natural communities” have optimized around the temporal and spatial flow of a century of altered river systems. When we taught together in the UNM Water Resources Program, my friend and collaborator Benjamin Jones spent significant time on the concept of “coupled human and natural systems”. This is that.
Here’s my current list, feel free to add your favorites in the comments.
The Army Corps of Engineers has had to curtail releases out of Abiquiu Dam on the Rio Chama because sediment has plugged the river. That means decreased flows downstream. They’re working like crazy to dig a pilot channel. It is not yet working.
CORRALES SIPHON
The Corrales Siphon, built (like El Vado) in the 1930s as part of the early Middle Rio Grande Conservancy District works is (like El Vado) broken. The district has installed temporary pumps, but with the reduced flows out of the Chama, there’s not enough water in the Rio Grande to feed the pumps, which means irrigators in Corrales have no water.
LOWER SAN ACACIA REACH
The Rio Grande’s Lower San Acacia reach, heavily altered by channel reconstruction and management from the 1950s onward, is – I believe the technical term is “a fucking mess”. It’s increasingly difficult to get water through this reach to users downstream who depend on it. Lots more on this situation here.
LOW FLOW LEAK
The Low Flow Conveyance Channel (Yay 1950s engineering!) sprang a kinda big leak the early 1990s. It’s still leaking, much to the delight of endangered willow flycatchers – to the human water users not so much.
On July 21, President Joe Biden withdrew from the 2024 presidential race and endorsed Vice President Kamala Harris to run in his place, launching her to the forefront of potential Democratic nominees. Harris’ term as VP hasn’t produced many significant policy outcomes of her own, but her experience as a California senator and attorney general, as well as her 2020 presidential campaign, point to a consistent record of pro-climate, pro-environmental policies and an evolved understanding of tribal land issues. Should she eventually assume the Oval Office, her career to date signals a likely continuation of the West’s Biden-era gains in the protection of public lands, water and wildlife as well as support for tribal sovereignty.
“We couldn’t be more excited,” said Athan Manuel, director of the Sierra Club’s lands-protection program. Harris worked with the organization on bills to expand California’s public lands, increase access to nature and develop community incentives for wildfire prevention. “She understood the totality of these issues, and that gives us great confidence.”
Over the past four years, the Biden administration reinstated protections for Alaska’s Tongass National Forest and conserved more than 41 million acres of public land. It passed the climate-forward Inflation Reduction Act, which was hailed as a windfall for domestic clean energy jobs and a once-in-a-generation wealth transfer to historically marginalized communities. The record bears a striking resemblance to Harris’ own platform for president, which also pursued environmental justice and sought an end to fossil fuels on public lands.
“This was the most impactful one-term presidency on public lands, climate change and environmental justice,” Manuel said. Harris, who was born in Oakland and spent much of her career in California, was also able to provide the Biden administration with insight into regional issues. “A Westerner leading on all these issues is very significant.” [ed. emphasis mine]
Prior to joining Biden’s ticket, Harris was best known as a Golden State prosecutor. As California’s attorney general, Harris won multiple settlements against corporate polluters, including a $44 million settlement from the owners of a container ship that spilled 53,000 gallons of oil into the San Francisco Bay. She secured multimillion-dollar deals with oil companies BP, ARCO and ConocoPhillips for negligent monitoring of hazardous materials in gas station storage tanks, and she was part of the team that held Volkswagen accountable for bypassing air pollution regulations, eventually earning more than $86 billion in penalties for the state. However, her claim that she pursued polluters while working in the San Francisco DA office has come under scrutiny.
A map shows the movements of 12 radio-collared lynx in and around Kanuti National Wildlife Refuge in Alaska in spring 2018. Some lynx traveled many hundreds of miles. Credit: USFWS
Harris’ track record with Indigenous affairs over her decades working in politics is more varied. As state attorney general, she created the first Indian Child Welfare Act Compliance Task Force to protect Native children. But she also opposed multiple tribal applications to put land into “trust” and thereby grow a tribe’s land base. During her time as attorney general, Harris’ office also pursued a legal argument that could have had negative, precedent-setting impacts for tribes that have acquired land in trust. She argued that the Big Lagoon Rancheria, a tribe that was seeking to build a casino on 11 acres of trust land, improperly received that land from the federal government. The case had the potential to open past land-to-trust transfers across Indian Country to litigation, but the 9th Circuit Court of Appeals ultimately ruled against California.
Since then, Harris has distanced herself from that position. When then-Cheyenne River Sioux Tribal Chairman Harold Frazier asked her about this publicly in 2019, Harris said that as California’s attorney general it was her duty to represent the state’s interests, which did not necessarily reflect her own. “As California’s attorney general she was perceived as being more focused on states than tribes,” wrote Mark Trahant (Shoshone-Bannock) in an analysis for ICT. “But that has largely shifted.”
During her 2020 campaign for president, for example, Harris promised to assist tribes in restoring their lands and to make it easier for them to do so in the future. Her campaign also detailed specific policies and initiatives to advance Native voting rights, increase funding for the federal agencies serving tribal communities, and protect Native women and children, building on some of the legislation that she co-sponsored during her time in the Senate. Those bills largely focused on supporting Native health care and addressing the crisis of Missing and Murdered Indigenous Peoples, along with the Native Voting Rights Act of 2019 and other legislation concerning tribal wildlife corridors and food sovereignty.
As vice president, she’s been a part of an administration that has made considerable strides in integrating Indigenous knowledge and tribal priorities into public-lands management, as well as in providing funding for Native-led climate resilience projects and appointing multiple Indigenous people to leadership positions. She was the first sitting vice president to visit the Gila Indian River Community and do an interview with the Native news organization ICT. Asked by reporter Aliyah Chavez (Kewa Pueblo) about the administration’s goals and the decision to appoint Native leaders like Interior Secretary Deb Haaland (Laguna Pueblo), Harris said, “I do believe that we are setting a new model for what the interaction and what the partnership should be [with tribes], always grounded in full appreciation and respect for tribal sovereignty.”
The Democratic Party has less than a month to introduce any alternative candidates before the Democratic National Convention on Aug. 19. Other potential frontrunners, including California Gov. Gavin Newsom, appear to be rallying behind Harris as the primary candidate who could win the race against former President Donald Trump.
New Mexico Congresswoman Melanie Stansbury and the Rio Grande Water Conservation District are working together on federal legislation that would call for a limited study of the Rio Grande Basin.
The involvement of the Rio Grande Water Conservation District and its attorneys comes after Stansbury attempted a similar push in 2022 when she introduced the Rio Grande Water Security Act. That effort was ultimately doomed after pushback from Colorado and the Rio Grande Water Conservation District.
Now the Rio Grande Water Conservation District is trying to steer Stansbury to focus on New Mexico’s portion of the Rio Grande only and not draw in Colorado as part of any federal study.
“She is very determined to introduce federal legislation to call for a study of the Rio Grande. I understand that her real impetus is that she does not feel that enough is being done in New Mexico to aggressively and innovatively manage the water resources within New Mexico,” attorney David Robbins said in remarks this week to board members of Rio Grande Water Conservation District.
“On behalf of the district and the Valley and the state we have been pursuing an effort to convince the congresswoman and her staff that Colorado doesn’t need federal agencies studying its water resources,” Robbins said.
David Robbins and J.C. Ulrich (Greg Hobbs) at the 2013 Colorado Water Congress Annual Convention
“Colorado has already studied its water resources. We have a state water plan, we have all of the plans you could ever want in the form of subdistrict replacement plans, plans of water management in our Valley. We have water court processes and decrees that specifically designate what federal authority exists through the water court system and over water in the Valley, and we don’t intend to compromise one thing if it would have any impact on our obligations.”
Stansbury’s office has not responded to calls and emails seeking comment.
Colorado delivers water at the Lobatos Bridge in Conejos County to send downstream into New Mexico to comply with the Rio Grande Compact. New Mexico, in turn, is obligated to deliver water from the Rio Grande to the Texas state line at El Paso.
Stansbury has been successful in securing federal funding to support New Mexico’s efforts along the middle Rio Grande. She was elected to represent New Mexico’s 1st Congressional District through a special election in 2021 to replace Deb Haaland, who was confirmed as U.S. interior secretary under President Biden.
Haaland in May announced $60 million in funding for New Mexico and West Texas to address how climate change is affecting the middle Rio Grande. The money was the first disbursement from the Inflation Reduction Act for a basin other than the Colorado River Basin, a fact not lost on conservationists working on Upper Rio Grande Basin projects in Colorado.
The Theodore Roosevelt Conservation Partnership and Colorado Open Lands have identified $400 million in total funding needed to improve water resilience and security on the Upper Rio Grande. The organizations made a funding request of $50 million to the U.S. Bureau of Reclamation through the Inflation Reduction Act but were never given a response to their request.
Alex Funk, director of water resources with the Theodore Roosevelt Conservation Partnership, said the Rio Grande needs its own dedicated federal funding source so that it’s not pitted against the better-known Colorado River Basin to address drought and less water.
“The Rio Grande, like the Colorado River Basin, has been experiencing long-term drought conditions. It’s seen huge reduction in its water availability. Everything shows that those flows will continue to get lower and lower where we have several compounding water challenges,” said Funk.
Funk and Sally Weir were recent guests on The Valley Pod and discussed the funding needs for the Rio Grande and their pitch for money to the U.S. Bureau of Reclamation. The Bureau of Reclamation had earmarked $4 billion to address drought mitigation in the Colorado River Basin and other watersheds like the Rio Grande facing comparable levels of drought.
Robbins, the attorney for the Rio Grande Water Conservation District, said it’s important that any federal legislation introduced by Stansbury steers clear of involving Colorado and its management of the Rio Grande.
“We don’t intend to compromise one thing if it would have any impact at all on our obligations at Lobatos. That is what we are going to work by. We’re not going to change the timing (of water delivery), we’re not going to change the quantity, we are simply going to say ‘You got what you got, so you don’t need to study it.’
“That’s very important to me that we take that position because one of the things that the states retained (under the Rio Grande Compact) was the right, which has been recognized for more than a century, to manage the water resources within their boundaries. So I think it is foolishness to get ourselves into a situation where federal agencies are meeting and studying and making recommendations about what is actually your collective responsibility and right to manage.
“If that’s what they want to do in New Mexico, fine. We’re going to work hard to try to be sure that Congress doesn’t provide authority to a separate or new federal agency or commission or committee or whatever it is to come into Colorado and make recommendations about what you have all sweated and argued and arm wrestled over for the past 100 years.”‘We have a state plan’: RGWCD works to limit any federal study of Rio Grande.
Rio Grande and Pecos River basins. Map credit: By Kmusser – Own work, Elevation data from SRTM, drainage basin from GTOPO [1], U.S. stream from the National Atlas [2], all other features from Vector Map., CC BY-SA 3.0, https://commons.wikimedia.org/w/index.php?curid=11218868
Little Snake River agricultural lands along the Colorado-Wyoming border. (Angus M. Thuermer, Jr./WyoFile)
Click the link to read the article on the InkStain website (John Fleck):
July 15, 2024
A team out of Wyoming, including my Colorado River Research Group colleague Kristiana Hansen, has a new paper that reminds us that we need to be careful about how we thinking about conserving water that is being “wasted.”
Their case study is an area on the New Fork in Wyoming, a tributary of the Green, which is a tributary of the Colorado, where producers use flood irrigation on timothy grass to grow livestock forage.
Flood irrigation is often seen as “wasteful.” One approach is to install “more efficient” irrigation technology. But – and this is one of my repetitive talking points with students in the graduate water policy course I teach every fall – you need to flag the word “waste” when you see it in a water policy discussion and think carefully about how you’re using it.
That water is going somewhere, and doing something. You have to include this in your analysis. Maybe it’s really being “wasted”. But you may find that the place the water is going, and the thing that it’s doing, is valuable!
That’s what the Wyoming team found. Flood irrigation recharges the shallow aquifer – reducing the spring peak in the area’s streams, and slowly releasing that water back into those same streams in late summer. Which is crucial, in this case, for economically valuable fisheries – recreational brown trout fishing, to cite their analysis.
This is at the heart Bruce Lankford’s oddly named work on the “paracommons,” which has provided an enormously helpful analytical framework for my thinking about this stuff.
Cleaning up our urban sewage for reuse is super popular right now, and can in some cases be an enormously powerful water policy response to scarcity. But we’ve got to be mindful about where that “wasted” water is going and what positive benefits it is providing. Lots of inland urban cities in the southwestern United States treat their wastewater and return it to rivers, where it feeds ecosystems and downstream users.
Spots of both improvement and drying in the East and Southeast, while much of the West and Plains dried out. Greatest drying this week was in RI, CT & WA.
Yampa River near Deer Lodge Park. Photo credit: Allen Best/Big Pivots
Click the link to read the article on the Big Pivots website (Allen Best):
July 8, 2024
Tri-State agreement includes provision for water rights valued by Moffat County at $2-3 million
The settlement agreement supported by 16 intervening parties that was submitted to the Colorado Public Utilities Commission has a major provision about water rights.
This is apart from the Colorado legislation passed in the 2023 session that allows Xcel Energy and Tri-State Generation and Transmission the ability to retain the water rights they are now using to produce steam at their coal plants near Hayden and Craig to generate electricity. The utilities will be able to retain their direct-flow rights until 2050 while they figure out whether those water rights will be needed in the future.
The settlement agreement is for augmentation water that Tri-State owns. It is held in Elkhead Reservoir near Hayden. The Colorado River Water Conservation District also holds augmentation water in that reservoir.
Why does augmentation water matter? Because, beginning in 2002, the Yampa River became a river that didn’t always have enough water for everybody than wanted it. In 2018, a drought year, a “call” was put on the river for the first time. And in 2022, the Yampa formally became an administrated river.
That means that if somebody wanted to drill a well in the Yampa River drainage for a new home on a plot of land of 35 acres or less, they needed to come to the table with water that could replenish the river, i.e. augmentation water. This is for all wells after the state designation of March 1, 2022.
To meet the need for augmentation water, Moffat County has been leasing water from the River District. The amount is determined by the amount needed on a per-acre-foot basis.
Jeff Comstock, who directs Moffat County’s Department of Natural Resources, said the precise amount of water that Moffat County will be getting from Tri-State will depend upon a determination in water court. The water given to Moffat County by Tri-State can be used into perpetuity.
Moffat County estimates the value of the augmentation water right that is to be transferred at $1 million to $3 million.
Click the link to read the article on the Big Pivots website (Allen Best):
July 17, 2024
June was indeed the third warmest ever in Colorado
Russ Schumacher, the Colorado state climatologist, reports that June was indeed warm across Colorado. It came in third warmest when averaged across the state as compared to the historical record of the last 150 years.
Only Junes of 2022 and 2012 – and those were years of major wildfires across Colorado. The difference between this June and those was that this year’s June was rainy in the mountains and across the Western Slope, “That is a very unusual combination in summer.” See more here.
OAA scientist Chris Cox checks an Atmospheric Surface Flux Station, designed and built by PSL and CIRES to collect data that measures all aspects of the exchange of energy between land and atmosphere. By analyzing these measurements, researchers can gain insight into both local and regional weather and climate systems. This unit is sitting on top of two stacked picnic tables buried under the snow. Credit: Janet Intrieri, NOAA Physical Sciences Laboratory
As delegates arrived at the Republican National Convention in Milwaukee earlier this week to officially nominate former president Donald Trump as their 2024 candidate, a right-wing policy think tank held an all-day event nearby. The Heritage Foundation, a key sponsor of the convention and a group that has been influencing Republican presidential policy since the 1980s, gathered its supporters to tout Project 2025, a 900-plus-page policy blueprint that seeks to fundamentally restructure the federal government.
Dozens of conservative groups contributed to Project 2025, which recommends changes that would touch every aspect of American life and transform federal agencies — from the Department of Defense to the Department of Interior to the Federal Reserve. Although it has largely garnered attention for its proposed crackdowns on human rights and individual liberties, the blueprint would also undermine the country’s extensive network of environmental and climate policies and alter the future of American fossil fuel production, climate action, and environmental justice.
Under President Joe Biden’s direction, the majority of the federal government’s vast system of departments, agencies, and commissions have belatedly undertaken the arduous task of incorporating climate change into their operations and procedures. Two summers ago, Biden also signed the Inflation Reduction Act, the biggest climate spending law in U.S. history with the potential to help drive greenhouse gas emissions down 42 percent below 2005 levels.
Project 2025 seeks to undo much of that progress by slashing funding for government programs across the board, weakening federal oversight and policymaking capabilities, rolling back legislation passed during Biden’s first term, and eliminating career personnel. The policy changes it suggests — which include executive orders that Trump could implement single-handedly, regulatory changes by federal agencies, and legislation that would require congressional approval — would make it extremely difficult for the United States to fulfill the climate goals it has committed to under the 2015 Paris Agreement.
It’s real bad,” said David Willett, senior vice president of communications for the environmental advocacy group the League of Environmental Voters. “This is a real plan, by people who have been in the government, for how to systematically take over, take away rights and freedoms, and dismantle the government in service of private industry.”
However, at least 140 people who worked in the Trump administration contributed to Project 2025, and policy experts and environmental advocates fear Project 2025 will play an influential role in shaping GOP policy if Trump is reelected in November. Some of the blueprint’s recommendations are echoed in the Republican National Convention’s official party platform, and Heritage Foundation president Kevin Roberts says he is “good friends” with Trump’s new running mate, Senator J.D. Vance of Ohio. Previous Heritage Foundation roadmaps have successfully dictated presidential agendas; 64 percent of the policy recommendations the foundation put out in 2016 had been implemented or considered under Trump one year into his term. The Heritage Foundation declined to provide a comment for this story.
Broadly speaking, Project 2025 proposals aim to scale down the federal government and empower states. The document calls for “unleashing all of America’s energy resources” by eliminating federal restrictions on fossil fuel drilling on public lands, curtailing federal investments in renewable energy technologies, and easing environmental permitting restrictions and procedures for new fossil fuel projects such as power plants. “What’s been designed here is a project that ensures a fossil fuel agenda, both in the literal and figurative sense,” said Craig Segall, the vice president of the climate-oriented political advocacy group Evergreen Action.
Within the Department of Energy, offices dedicated to clean energy research and implementation would be eliminated, and energy efficiency guidelines and requirements for household appliances would be scrapped. The environmental oversight capacities of the Department of the Interior and the Environmental Protection Agency would be curbed significantly or eliminated altogether, preventing these agencies from tracking methane emissions, managing environmental pollutants and chemicals, and conducting climate change research.
In addition to these major overhauls, Project 2025 advocates for getting rid of smaller and lesser-known federal programs and statutes that safeguard public health and environmental justice. It recommends eliminating the Endangerment Finding — the legal mechanism that requires the EPA to curb emissions and air pollutants from vehicles and power plants, among other industries, under the Clean Air Act. It also recommends axing government efforts to assess the social cost of carbon, or the damage each additional ton of carbon emitted causes. And it seeks to prevent agencies from assessing the “co-benefits,” or the knock-on positive health impacts, of their policies, such as better air quality.
“When you think about who is going to be hit the hardest by pollution, whether it’s conventional air water and soil pollution or climate change, it is very often low-income communities and communities of color,” said Rachel Cleetus, the policy director with the climate and energy program at the Union of Concerned Scientists, a nonprofit science advocacy organization. “The undercutting of these kinds of protections is going to have a disproportionate impact on these very same communities.”
Other proposals would wreak havoc on the nation’s ability to prepare for and respond to climate disasters. Project 2025 suggests eliminating the National Oceanic and Atmospheric Administration and the National Weather Service housed therein and replacing those organizations with private companies. The blueprint appears to leave the National Hurricane Center intact, saying the data it collects should be “presented neutrally, without adjustments intended to support any one side in the climate debate.” But the National Hurricane Center pulls much of its data from the National Weather Service, as do most other private weather service companies, and eliminating public weather data could devastate Americans’ access to accurate weather forecasts. “It’s preposterous,” said Rob Moore, a policy analyst for the Natural Resources Defense Council’s Action Fund. “There’s no problem that’s getting addressed with this solution, this is a solution in search of some problem.”
The document also advocates moving the Federal Emergency Management Administration, which marshals federal disaster response, out from under the umbrella of the Department of Homeland Security, where it has been housed for more than 20 years, and into the Department of the Interior or the Department of Transportation. “All of the agencies within the Department of Interior are federal land management agencies that own lots of land and manage those resources on behalf of the federal government,” Moore said. “Why would you put FEMA there? I can’t even fathom why that is a starting point.”
The blueprint recommends eliminating the National Flood Insurance Program and moving flood insurance to private insurers. That notion skates right over the fact that the federal program was initially established because private insurers found that it was economically unfeasible to insure the nation’s flood-prone homes — long before climate change began wreaking havoc on the insurance market.
Despite the alarming implications of most of Project 2025’s climate-related proposals, it also recommends a small number of policies that climate experts said are worth considering. Its authors call for shifting the costs of natural disasters from the federal government to states. That’s not a bad conversation to have, Moore pointed out. “I think there’s people within FEMA who feel the same way,” he said. The federal government currently shoulders at least 75 percent of the costs of national disaster recovery, paving the way for development and rebuilding in risky areas. “You are disincentivizing states and local governments from making wise decisions about where and house to build because they know the federal government is going to pick up the tab for whatever mistake they make,” Moore said.
Quillan Robinson, a senior advisor with ConservAmerica who has worked with Republicans in Washington, D.C., on crafting emissions policies, was heartened by the authors’ call for an end to what they termed “unfair bias against the nuclear industry.” Nuclear energy is a reliable source of carbon-free energy, but it has been plagued by security and public health concerns, as well as staunch opposition from some environmental activists. “We know it’s a crucial technology for decarbonization,” Robinson said, noting that there’s growing bipartisan interest in the energy source among lawmakers in Congress.
An analysis conducted by the United Kingdom-based Carbon Brief found that a Trump presidency would lead to 400 billion metric tons of additional emissions in the U.S. by 2030 — the emissions output of the European Union and Japan combined.
Above all else, Segall, from Evergreen Action, is worried about the effect Project 2025 would have on the personnel who make up the federal government. Much of the way the administrative state works is safeguarded in the minds of career staff who pass their knowledge on to the next cadre of federal workers. When this institutional knowledge is curbed, as it was by budget cuts and hostile management during Trump’s first term, the government loses crucial information that helps it run. The personnel “scatter,” he said, disrupts bottom-line operations and grinds the government to a halt.
Although Project 2025’s proposals are radical, Segall said that its effect on public servants would echo a pattern that has been playing out for decades. “This is a common theme in Republican administrations dating back to presidents Richard Nixon and Ronald Reagan,” he said. “What you do is you break the government, make it very hard for the government to function, and then you loudly announce that the government can’t do anything.”
Four states in the drought-stricken Colorado River Basin, including Colorado, want credit for conserving water, but water users and officials have big questions about how to make it happen.
Last year, taxpayers paid farmers and ranchers $16 million to cut their water use in the Colorado River Basin, but the water saved on one farm simply reentered streams, where it could be used by anyone downstream. For years, officials in Colorado, New Mexico, Utah and Wyoming have been considering ways to get credit for that conserved water — to track it, store it in a reservoir, and save it to help the states in the future. Representatives from the four states voted in June to develop a proposal exploring the idea by mid-August.
But building a long-term program to track and store conserved water raises questions about equity, funding, economic impacts and whether the idea is feasible at all.
People are concerned about the bigger picture, said Andy Mueller, general manager of the Colorado River District in Colorado.
“If we’re going to conserve water up here, and if the federal government is going to pay for that conservation with taxpayer dollars, it seems to us that storing it and using it for important public purposes makes sense, rather than sending it downstream to just encourage continued consumption of water [by downstream states],” Mueller said.
Cutting back on water use is a big topic of conversation in the Colorado River Basin, which supplies water to 40 million people and is enduring warmer temperatures and a two-decade megadrought.
Officials from each of the seven states in the basin are weighing who might have to cut their use and how to manage the basin’s reservoirs in high-stakes negotiations over the river’s future after the current rules expire in 2026.
The Upper Basin’s alternative, summed up. Source: Upper Colorado River Commission.
The Upper Basin released a proposal in March that outlined its plan to manage the river after 2026 as part of these negotiations. That proposal includes a commitment to pursue voluntary, temporary and compensated conservation programs.
The June vote of the Upper Colorado River Commission aimed to take that commitment one step forward. The state and federal representatives on the commission want to design a conservation-for-credit program in advance so it’s set up and ready to go if needed.
The commission’s plan could help inform the states’ negotiations, said Amy Ostdiek, who is part of Colorado’s negotiating team and works on interstate water issues for the state’s top water policy agency, the Colorado Water Conservation Board.
“We’ve heard this from water users a lot. … If we’re going to continue doing conservation-type activities, can we explore ways to quote-unquote get credit for it?” Ostdiek said. “It’s worth exploring. … There’s a lot we’d need to work out before we get there.”
Grays and Torreys, Dillon Reservoir May 2017. Photo credit Greg Hobbs.
Big questions from water users
Officials and water users have been kicking around the idea of tracking and storing conserved water for credit for years, and the commission’s August proposal will be the latest iteration of those discussions.
One heavily debated program, called demand management, offered a path toward storing conserved water in a reservoir to help Upper Basin states. But Colorado hit pause on analyzing the idea in 2022 as other Upper Basin states slogged through intense feasibility studies.
Taxpayers paid $16 million in 2023 to conserve water through another program, the System Conservation Pilot Program. Because the program does not track conserved water, there is no certainty where it ends up.
“It inherently just flows downstream and continues to be used by the Lower Basin,” Mueller said. “It really doesn’t do anything other than feed the continued use of the water, rather than encourage conservation of the water.”
The commission’s proposal will try to answer key questions for a program that tracks and stores conserved water, said Chuck Cullom, executive director of the Upper Colorado River Commission. But how will water managers track the actual water down streams, through reservoirs and across state lines? What is a “conservation credit” and how can it be earned? What role would location play?
Mueller of the Colorado River District said the location of the projects ties into big potential equity issues.
Most of Colorado’s participants in the system conservation pilot program so far have been farmers and ranchers on the Western Slope, he said. They helped conserve water by fallowing fields and switching to crops that used less water. But if a farmer stops production, or fallows acres of land to conserve water, it can cut jobs on the farm and spending in the community.
A paid conservation program has to be designed to incentivize participation from all regions of Colorado where Colorado River is used, which includes Front Range cities from Fort Collins down to Colorado Springs and beyond, Mueller said.
Joe Bernal, a rancher in Loma who is participating in the System Conservation Pilot Program, said his concern was how a conservation-for-credit program would be administered.
“Would they work with ditch companies, or would they go with individuals? How much would they offer?” he said. “Would they … help ditch companies and communities protect the viability of agriculture?”
Other water users want to know which reservoirs would store conserved water for credit.
Storing conserved water closer to a river’s source — in high-elevation Upper Basin reservoirs rather than farther downstream — would give the four states more say in when, how much and from where water is released.
Plus, local water users want to conserve water in good years and save it in a nearby reservoir to provide a cushion during the next dry year, said Ken Curtis, general manager of the Dolores Water Conservancy District.
Mcphee Reservoir
Farmers and ranchers in his district are already doing just that: This year, they volunteered to be paid to save water through the system conservation program, and they’re storing it in the nearby McPhee Reservoir to boost carryover water supplies for next year, Curtis said.
The commission’s proposal also aims to define the requirements conservation projects would have to meet to qualify and how years of past water use would come into play.
How to factor in past water use is important to two tribes in Colorado, the Ute Mountain Ute and Southern Ute Indian tribes, said Peter Ortego, general counsel for the Ute Mountain Ute Tribe.
Both tribes have water in a southwestern reservoir that they plan to put to use in the future, but haven’t used yet. Their water does not qualify for use in current paid conservation programs, which raises the question of whether it could qualify for a newer, reimagined conservation-for-credit program, Ortego said.
A program to help the Upper Basin
As officials try to tackle big questions, one thing is clear: Upper Basin water watchers do not want to conserve water if it will just flow downstream to support current use in the Lower Basin.
Congress is currently considering a bill to extend the system conservation pilot program, which does not track where conserved water goes. Meanwhile, officials are dusting off years of analyses about the demand management program, which expires in 2026.
The demand management program created an “account” for up to 500,000 acre-feet of conserved water in Lake Powell. One acre-foot roughly equals the annual use of two to three households.
It’s been frustrating to know the demand management account exists in Lake Powell and to see water being conserved through the system conservation pilot program, or SCPP, that just flows through the reservoir, said James Eklund, a former Colorado water official who helped forge the program and owns a ranch in the pilot program.
“All it needed was to be tagged as DM (demand management) water instead of SCPP water — and it would be water we’d have in our account as Upper Basin states. And we’d be able to point to that water in negotiations,” Eklund said.
But that program is very prescriptive, Ostdiek said.
The account could be used for one purpose: fulfilling the Upper Basin’s interstate water sharing obligations outlined in the 1922 Colorado River Compact, even if river conditions worsen drastically and trigger mandatory cuts in the Upper Basin. The shorthand for this worst-case scenario is a “compact call” or “compact compliance.”
The commission’s upcoming proposal could explore more general uses for credits, including or beyond compact compliance, Ostdiek said.
“I think we need to do some more exploring on what the concept of credit actually means to individual states,” she said, “and think about what the goals would be of that type of approach.”
It’s Friday, it’s hot, the world seems to be collapsing in multiple ways, so I thought I’d bring you a bit of good news for a change: Coal’s big breakdown is back. Okay, so it’s not great news for coal-company CEOs, or for the industry workers who will lose their jobs. But for the planet and all the folks who have had to live with coal mining and coal burning and all of its deleterious effects, it’s got to be a relief.
In his excellent book, Fire on the Plateau, the late, great scholar Charles Wilkinson coined the term “Big Buildup” to describe the flurry of postwar development of coal plants (and dams, uranium mining, oil and gas, etc.) on the Colorado Plateau. The Big Breakdown refers to the decline of the coal industry in the West, as big coal plants are mothballed and the mines shut down and, hopefully, reclaimed, and the air cleans itself up as a result.
The Breakdown began back in 2008, during the global financial crisis, when power consumption plummeted. The economy recovered. Coal did not — it had become more expensive than other energy alternatives and is dirtier, besides, so utilities rushed to rid themselves of the old smoke-spewing behemoths. But then, in the wake of the first wave of the COVID-19 pandemic, coal bounced back, sparking a bit of panic among clean air lovers everywhere. And lawmakers in Utah, Wyoming, and other fossil-fuel-fetishizing states rushed to pass laws to interfere in the free market and prop up the dying industry.
Alas, it isn’t working, as today’s chart — showing both electricity consumption and coal consumption — reveals. I’ve run this chart here before, but I wanted to update y’all because I really like it. Not only does it show how the grid is getting cleaner, but also provides a nice graphic look at U.S. energy history over the last 75 years.
Credit: Jonathan P. Thompson/The Land Desk
A. Coal was the king of the Industrial Age, of course, providing power to run mines and mills and factories and trains, while also heating homes. But by the 1950s the industry was struggling somewhat, as diesel locomotives supplanted the steam ones, natural gas gained ground for heating and cooking, and huge hydroelectric dams blocked rivers across the West to generate power. As of 1955, only 10% of the Western Grid’s power was generated from coal; nearly all the rest was from hydropower.
B. Congress established the Office of Coal Research in 1960 “to encourage and stimulate the production … of coal (and to) maximize the contribution of coal to the overall energy market.”
C. The Big Buildup began in the 1960s with the construction of Four Corners Power Plant on the Navajo Nation in northwestern New Mexico. The construction and operation of the plant and adjacent mine were rife with environmental injustice.
D. The Clean Air Act passed in 1970. You might think that would be the death knell for coal, pretty much the dirtiest fuel out there. But no, it did little to slow coal-burning and it actually boosted relatively low-sulfur coal from Western mines which emits less sulfur dioxide when burned.
E. In 1973 OPEC stopped sending oil and natural gas to the U.S. and its allies to retaliate for U.S. support of Israel in the Yom Kippur War. Further unrest in the Middle East continued to drive up oil and natural gas prices, motivating utilities to burn more coal to generate power.
F. President Jimmy Carter took office during these crises in 1977, the same year Atlantic Richfield Company opened its Black Thunder Mine in the Powder River Basin, which would go on to become the world’s largest coal mine. Carter was a walking contradiction, boosting solar and other clean energy and public lands protections on the one hand, and going all in on coal mining and burning on the other. He pushed domestic coal to displace oil or natural gas (much of which was imported) then used to generate power. Carter also hoped to make synthetic transportation fuels from coal and oil shale and he and Congress put billions toward synfuel subsidies.
G. In 1978 Congress passed the Industrial Fuels Power Act, which basically banned the construction of any new natural gas power plants (another reaction to the energy crises). Coal was the big winner of that one.
H. Carter was also a big pusher of conservation, in rhetoric and policy, and high energy prices bolstered his cause. Electricity consumption flattened and even dropped in the 1980s for the first time in three decades. Yet coal use shot up tremendously at the same time. Under Reagan, electricity use climbed again, but coal consumption dropped. Why? Because OPEC decided to flood the market with oil, lowering oil and gas prices to make them the cheapest fossil fuels for generating electricity.
I. Congress amends the Clean Air Act to tackle the acid rain problem, especially in the East and Midwest. Instead of hurting the coal industry, however, it again gave an even bigger boost to the Western mines. The Powder River Basin solidified its status as the nation’s coal bin.
J. Peak Coal occurred in 2007. There is virtually no chance U.S. mines will ever produce or plants burn as much coal as they did that year.
K. Electricity use plummeted during the 2008 Financial Crisis and coal use dropped with it. As the economy recovered, something strange happened: Electricity use stayed fairly flat, thanks to efficiency and other measures. Coal burning started to recover, but …
L. In 2009 natural gas prices crashed after the combination of horizontal drilling and multi-stage hydraulic fracturing opened up vast stores of methane previously believed to be unrecoverable. That glutted the market with gas, making it cost-competitive with coal. Meanwhile, Democrats and even some national environmental groups were pushing natural gas as a “bridge fuel” to get from dirty coal to renewables. At the same time, oodles of solar and wind generating capacity were being brought online, in part thanks to federal incentives. All of this combined to knock King Coal off its throne. It’s been in freefall (with a blip or two) ever since due mostly to fluctuations in natural gas prices.
M. The first wave of the pandemic and measures taken to slow its spread helped Americans reduce their electricity use considerably. Because coal was one of the most expensive sources of power on the grid, utilities ditched it first, so the dirty fuel took an even bigger blow. Coal plant retirement plans accelerated and it seemed as if coal could be in its final throes.
N. But then the economy recovered along with power use. At the same time, extreme heat drove up demand for more power, hydropower waned, and utilities needed to fill the gap between supply and demand. They turned first to natural gas, which caused prices of that fuel to increase, and then to coal. Thus the Big Breakdown’s dramatic pause in 2021.
But the Big Breakdown is back on. In 2023, coal use plummeted once again. And judging by the first quarter of 2024, there will be even less use this year, even as power demand creeps higher.
“Power Madness” in America, the Big Buildup of coal, and a Senate hearing from five decades ago — JONATHAN P. THOMPSON OCTOBER 1, 2020
There’s a lot of big fires burning out there, with dozens of new starts daily across the West. The McDonald Fire in Alaska was first noticed on July 9; it’s now up to about 150,000 acres. The Cow Valley Fire in Malheur County, Oregon, has grown to 20,000 acres; it was ignited just yesterday. The Silver King Fire in Utah’s Tushar Mountains has charred through about 14,000 acres and forced the cancellation of a major gravel bike race there. There’s also the Babylon Fire south of Dark Canyon within the boundaries of Bears Ears National Monument. It’s grown to about 200 acres in a remote location that, frankly, could use a little bit of therapeutic burning (thanks to our favorite fire lookout readers for tipping us off to it.) Be careful out there, folks!
📸 Parting Shot 🎞️
A datura flower in southern Utah: shy by day; flirtatious and lascivious by night. Jonathan P. Thompson photo.
How did we do in the continuing effort to recover reservoir storage? How much reservoir storage accumulated from this year’s snowpack, and how does that accumulation compare to other years?
In Summary:
Total basin-wide reservoir storage is an appropriate metric to describe the status of the regional water supply and its year-to-year changes. Reclamation provides data on the storage contents of 46 reservoirs in the basin that are primarily managed by the Bureau of Reclamation but also by municipal water agencies and water conservancy districts. Whether destined for within-basin use or for trans-basin diversion, the total amount of water in these reservoirs is the carryover storage available to sustain use during dry times.
Accumulation of storage in those reservoirs occurred between mid-April and early July 2024, and basin-wide storage increased by 2.5 million acre feet. This amount is only 30% of the increase in storage that occurred during the same period in 2023. Nevertheless, basin-wide reservoir storage increased by 300,000 af when the summer peak of 2024 is compared with the summer peak of 2023, because consumptive uses and losses in the intervening time between the two runoff years was only 2.2 million acre feet. Despite the modest runoff of 2024, water managers were able to increase reservoir storage, because they had done such a good job of limiting consumptive uses following the 2023 runoff season.
Today, 62% of the total basin-wide storage is in Lake Mead and Lake Powell. The combined contents of these two largest reservoirs in the United States peaked on 8 July at 18.5 million af. Most of 2024’s snowmelt runoff was stored in Lake Powell, and storage in Lake Mead declined during spring and early summer 2024. Now that the runoff season has ended, some of the contents of Lake Powell will be gradually transferred to Lake Mead.
The Details:
On 6 July, storage in the Colorado River basin peaked for the year at 30.0 million acre feet (af), approximately 50% of capacity of the reservoir system1 (Fig. 1). The combined contents of Lake Mead and Lake Powell peaked on 8 July at 18.5 million af, approximately 37% of the capacity of those two reservoirs. The last time total basin reservoir storage was as much as this was in early January 2021, and the combined storage of Lake Mead and Lake Powell had last been at its present volume in very late April 2021. Thus, reservoir storage has not yet recovered to the average conditions between 2005 and 2020.
Figure 1. Graph showing reservoir storage in the Colorado River watershed between 1 January 1999 and 15 July 2024. Credit: Jack Schmidt/Center for Colorado River Studies
The season of water accumulation, when inflow to reservoirs exceeds outflow, that began in mid-April has now ended. How did we do in the continuing effort to recover reservoir storage? How much reservoir storage accumulated from this year’s snowpack, and how does that accumulation compare to other years?
The snowpack of the Upper Basin peaked on 3 April at 16.8 in of snow water equivalent (SWE)2. For comparison, the median peak SWE for the past 30 years, as computed by the Natural Resource Conservation Service, was 16.0 in., so 2024 was a pretty good year. Nevertheless, 2024 was not nearly as good a year as 2023 when the peak SWE was 23.9 in. Preliminary estimates of natural flow at Lees Ferry for Water Year 2024 are that this year’s natural flow3 will be 12.1 million af, although that estimate may change slightly by the end of the water year.
The relation between peak estimated SWE in the Upper Basin and natural flow at Lees Ferry has a reasonably good correlation for data from 2000 and the years of the 21st century (Fig. 2). There is year-to-year variation in this relation caused by springtime weather that affects the rate of melting and the amount of sublimation. Variation is also caused by the intensity of the summer North American monsoon that augments the natural flow but is unrelated to snowmelt. Estimated natural runoff in 2024 was well predicted by the general relation.
Figure 2. Graph showing the relation between peak annual snow water equivalent for the Upper Colorado River basin and natural flow at Lees Ferry, estimated by Reclamation. The solid line is an exponential relation fit to these data.4 Credit: Jack Schmidt/Center for Colorado River Studies
The amount of water added to reservoir storage is very well predicted by the natural flow at Lees Ferry (Fig. 3), and this relation shows that much more of the natural runoff is captured by reservoirs in wet years than in dry years. In 2024, approximately 20% of the estimated natural flow was stored, consistent with comparable years (2010, 2014, 2015, and 2016) (Fig. 3). A higher proportion of the natural runoff was stored in the wet years of 2005, 2011, 2019, and 2023, when more than 40% of the natural runoff was captured in reservoirs. More than 30% of the natural runoff was stored in 2008, 2009, and 2017.
Figure 3. Graph showing increase in basin-wide reservoir storage as a function of natural flow at Lees Ferry. The solid line is linear relation fit to these data 5. Credit: Jack Schmidt/Center for Colorado River Studies
The combined contents of Lake Mead and Lake Powell peaked on 8 July, but storage in each reservoir followed very different trajectories (Fig. 4). Lake Powell, which is upstream from Lake Mead, captured the inflowing snowmelt runoff and increased in storage by 2.2 million af between mid-April and early July while Lake Mead lost approximately 900,000 af. Now that the inflow season has ended, storage will gradually decline in Lake Powell and increase in Lake Mead.
Figure 4. Graph showing the distribution of reservoir storage in different parts of the Colorado River basin between 1 January 2021 and 15 July 2024. Credit: Jack Schmidt/Center for Colorado River Studies
The storage gains resulting from the 2024 runoff compensated for the consumption of reservoir storage that had occurred after the 2023 runoff season (Fig. 5). This year’s peak of 30.0 million af is slightly more than the peak storage in summer 2023 that was 29.7 million af. This small increase in storage occurred despite a modest 2024 runoff season, because the basin’s water managers had done a good job in conserving the gains of last year (see blog post of 21 May 2024). Only 2.2 million af was consumed or lost following the 2023 runoff season, and the gain of 2.5 million af in 2024 exceeded the preceding loss. Thus, basin-wide storage is ever so slightly better than last year, because we used so little water last year. We now begin a 9-month period when the job in front of us is to continue to reduce consumptive uses and losses until the onset of the 2025 snowmelt season. Let’s not lose focus. We’re all in this together.
Figure 5. Graph showing changes in reservoir storage between 1 January 2023 and 15 July 2024. Credit: Jack Schmidt/Center for Colorado River Studies
1. These data are for 46 reservoirs whose daily storage contents are reported by Reclamation at: https://www.usbr.gov/uc/water/hydrodata/reservoir_data/site_map.html. The data summarized here are through 15 July. 2. Natural Resources Conservation Service. Snow water equivalent data accessed at: https://nwcc-apps.sc.egov.usda.gov/awdb/basin-plots/POR/WTEQ/assocHUC2/14_Upper_Colorado_Region.html. 3. Bureau of Reclamation. Natural flow data accessed at: https://www.usbr.gov/lc/region/g4000/NaturalFlow/provisional.html. Lees Ferry data were released on 22 April and are provisional and based on the April 24-month study. This estimate will be revised in August. 4. This relation is y = 4,048,600 * e(0.06632 x) , where y is the annual natural flow at Lees Ferry for the water year, in acre feet, and x is the peak snow water equivalent of the year, in inches. The R2 of this relation is 0.73. 5. This relation is y = -6,484,000 + 0.75833 X, where X is the annual natural flow at Lees Ferry for the water year, in acre feet, and y is the increase in basin-wide reservoir storage that occurred during the snowmelt season typically between mid-April and mid-July . The R2 of this relation is 0.92. Data used to calculate this relation do not include 2002 and 2012 when basin-wide storage decreased during the snowmelt season.
In 1922, Federal and State representatives met for the Colorado River Compact Commission in Santa Fe, New Mexico. Among the attendees were Arthur P. Davis, Director of Reclamation Service, and Herbert Hoover, who at the time, was the Secretary of Commerce. Photo taken November 24, 1922. USBR photo.
This story is part of ongoing coverage of the Colorado River, produced by KUNC in Colorado and KNAU in Arizona. It is supported by the Walton Family Foundation.
The future of the Colorado River hangs in the balance. The states that will decide its future are stuck at an impasse. They can’t agree on a plan to divvy up the shrinking water supply.
At the heart of that disagreement are three words written over 100 years ago.
It’s all rooted in a document called the Colorado River Compact. None of its authors are alive today, but the words they wrote in 1922 are still shaping life for millions today.
“The content of this particular document, the Colorado River Compact, is the foundation of the law that is governing the Colorado River at this point,” said Patty Rettig, who manages the water archive at Colorado State University’s library.
Her archive includes the writings of Delph Carpenter, one of the eight men who penned the original document. Sitting at a library table, Rettig carefully flips through the pages of his notes — thin, carbon-paper drafts marked up with pencil — looking for clues from history about how we arrived at the water policy fights of the 21st century.
Patty Rettig retrieves a file in the Water Resources Archive at Colorado State University on June 25, 2024. Papers from the collection of Delph Carpenter, one of the Colorado River Compact’s signers, show how its architects chose their words carefully. Photo credit: Alex Hager/KUNC
“I know they were thinking about the future,” she said. “We have evidence they were thinking about the future, but I don’t think they were thinking 100 years into the future.”
Taking a closer look at those three words — why they were chosen a century ago and how they’re being interpreted today — tells us a lot about the big, complicated problems facing the Southwest’s most important water supply.
Where are we now?
The Colorado River supplies 40 million people across seven Western states and parts of Mexico. Rules about sharing water are decided by representatives of those seven states. Mostly appointed by governors, they meet, usually behind closed doors, to decide who should get how much.
Right now, the clock is ticking for them to agree on new guidelines for water sharing since the current set of rules expires in 2026. Meanwhile, more than two decades of dry conditions have only increased pressure for the entire region to cut back on demand. The Colorado River has been in the grips of a megadrought, fueled by climate change, and demand has remained mostly steady.
As a result, the region’s reservoirs have plummeted to record lows, and big changes are needed for a sustainable future.
In March, the states split into two camps and published their ideas for managing the river after 2026. Those two groups were divided along familiar lines. The Upper Basin states of Colorado, Utah, Wyoming and New Mexico found themselves pitted against the Lower Basin: California, Arizona and Nevada.
Those two camps have been at odds since the earliest days of Southwestern water management, and 2024 is no exception.
The Upper Basin’s alternative, summed up. Source: Upper Colorado River Commission.
What do they disagree about?
The two proposals for managing water lay out a major philosophical difference between the Upper and Lower basins. They disagree about who should take responsibility for the gap between supply and demand.
The Upper Basin is legally required to let a certain amount of water flow to its downstream neighbors each year. After more than 100 years of complying with that standard, Upper Basin states want the ability to allow less water to flow, and their proposal puts that idea into writing.
About 85% of the Colorado River starts as snow in the Upper Basin’s mountains. Climate change, the catalyst for the region’s water shortages, is shrinking the amount of snow that falls in those mountains each year.
Metro Denver, left, gets half its water from the Upper Colorado River Basin, with river headwaters northwest of Longs Peak and Mount Meeker in Rocky Mountain National Park. Dillon Reservoir, off Interstate 70 in Summit County, top right, is owned by Denver Water and holds water for Metro Denver; reservoir water is transported under the Continental Divide to reach the city. Blue Mesa Reservoir, near Gunnison, Colorado, bottom right, is a key water storage facility in the Colorado River Basin and has reached dramatic lows because of drought. Credit: Colorado State University
Because of that, the Upper Basin states argue, they feel the sting of climate change more sharply than the Lower Basin. Cities and farms within its four states have to adjust their water use in accordance with recent snowfall, Upper Basin leaders say, but the Lower Basin can count on predictable water deliveries from upstream.
The Upper Basin’s proposal basically outlines a legal loophole that would let them, under certain circumstances, allow less water to flow downstream without breaking their contract with California, Arizona and Nevada.
“[The proposal] protects Lake Powell storage for the benefit of both the Upper and Lower Basins, mitigates the risk of either Lake Powell or Lake Mead reaching dead pool, and is consistent with the Law of the River,” the Upper Basin states wrote in their proposal.
What are those three words?
In 1922, eight men spent 11 months going back and forth about the language of the Colorado River Compact. They were very deliberate in their choice of words.
One of the most important ideas laid out in its pages is the division of water between the Upper and Lower Basin. Half of it — 7.5 million acre-feet — stays in the mountain states where it starts as snow. Those Upper Basin states are on the hook to let the other half flow downstream.
Article III, Section D of the Compact explains it this way.
“The States of the Upper Division will not cause the flow of the river at Lee Ferry to be depleted below an aggregate of 75,000,000 acre-feet for any period of ten consecutive years reckoned in continuing progressive series beginning with the first day of October next succeeding the ratification of this compact.”
Patty Rettig points to a sentence printed in a 1922 copy of the Colorado River compact. The wording of that sentence is being used in negotiations about the river’s future in 2024. Photo credit: Alex Hager/KUNC
The water leaders of Colorado, Utah, Wyoming and New Mexico are, today, zooming in on one tiny part of that sentence.
“Will not cause.”
The Upper Basin states, in 2024, say the agreement does not require them to send a particular amount of water downstream every year. Instead, it requires them to not be the reason that amount doesn’t make it downstream.
They’re arguing that climate change, not the states themselves, is the reason that less water is making it downstream. The Upper Basin states say they have less water to begin with, and it isn’t their fault – it’s the fault of a warming climate.
And they’re saying the Colorado River Compact, written more than a century ago, gives them legal permission to allow less water to flow downstream because they aren’t the ones causing the water supply to go down.
Whose idea was this?
The Colorado River Compact has not always been interpreted in this way. The idea to blame climate change as the “cause” of depleting water supplies, by most accounts, came around in the early 2000s. The people who drew it up are still around today.
“I might have been one of them,” Eric Kuhn said with a chuckle. “I plead guilty.”
Kuhn, now retired, was the head of the Colorado River District from 1996 to 2018. The taxpayer-funded agency was founded to keep water flowing to the cities and farms of Western Colorado. He said warming temperatures, which pushed river supplies into a steady decline starting around the year 2000, was the spark for the idea.
“We have fixed obligations at Lee Ferry, and because of climate change, we’re going to see less and less water in the river,” Kuhn said. “A fixed obligation with a declining resource means our water supply is caught between the two. So, I called it the ‘Upper Basin squeeze.’”
Lee Ferry, also called Lee’s Ferry, is a place on the Colorado River in Northern Arizona. The architects of the Compact designated it as the river’s halfway point. The measuring equipment installed there is still important today.
Lee’s Ferry. (Gaging station at upper left.) Photo by John Fleck
Kuhn doesn’t blame today’s water leaders for pushing the idea during negotiations about the future. He said they wouldn’t be doing their jobs if they didn’t highlight climate change. But he doesn’t see this interpretation — the idea of “not causing” drops in the water supply — as the silver bullet to the Upper Basin’s water woes
“I think it’s a negotiating stance,” Kuhn said, “And hopefully will give them some maneuvering room to come up with a different proposal than what they’re saying right now.”
What did the Compact’s authors mean?
A certain faction of powerful people are choosing to interpret the language of the Colorado River Compact in a very specific way. But was that the intention of the people who wrote it?
In short, it’s hard to tell. But people with a knowledge of water history think they probably weren’t trying to create a loophole. Patty Rettig, the archivist at Colorado State University, has read through a lot of documents that can provide some context.
The collection she manages contains extensive writings from Delph Carpenter. He was Colorado’s delegate to the 1922 meetings that resulted in the Colorado River Compact. His family turned over his papers, which includes an original copy of the Compact itself, to the CSU library. The collection also includes pages upon pages of handwritten notes and work-in-progress drafts that accrued during the months-long deliberations.
Governor Clarence J. Morley signing Colorado River compact and South Platte River compact bills, Delph Carpenter standing center. Unidentified photographer. Date 1925. Print from Denver Post. From the CSU Water Archives
Rettig has read through the meeting minutes from 1922 – a word-by-word transcription of what state negotiators talked about during their brainstorming sessions in Santa Fe. New Mexico. She does not think Delph Carpenter would have deliberately chosen wording about the Upper Basin’s delivery obligation to provide 21st century leaders a way to find some wiggle room in how they manage water.
“I think it is plausible, but I think that also might be stretching his intentions some,” she said. “I don’t have the sense that he was trying to do something underhanded or trying to get specific benefits for his state.”
The compact’s authors — a group that also included representatives from six other states and Herbert Hoover, who was the U.S. Secretary of Commerce at the time — may not have been thinking about water policy discussions in the year 2024, but they were decidedly choosy with their wording.
Flipping through a mishmash of undated drafts of the Compact, many marked with Carpenter’s own scribbles and notes, that now-important “will not cause” sentence takes a few different forms.
At one point, the authors write that the Upper Basin states will not cause the river to be “diminished” below the set amount of water. At another, they use the word “reduced.” Finally, they settled on “depleted.”
But throughout all of the drafts, or at least the ones that made it into CSU’s collection, they did not change the wording about the Upper Basin’s responsibility to not “cause” the river to drop.
What happens if this goes to court?
The Upper Basin’s idea was met with swift dismissal from downstream states. JB Hamby, California’s top water negotiator, put that dissent into words.
“Arguing legal interpretations until we’re all blue in the face doesn’t do anything to proactively respond to climate change,” Hamby said in a press conference on March 6, the day the proposal was released.
For Robert Glennon, water law expert and professor at the University of Arizona, the Upper Basin’s argument only makes sense if you laser-focus on those three words — “will not cause” — and ignore the context of the Colorado River Compact as a whole.
He said it’s a simple document, laying out a sequence of steps to split the river in half at Lee’s Ferry. The document itself is only a few pages long. It was written before Glen Canyon Dam and Hoover Dam were built or extensive canals tapped the river’s flow.
Glennon said the compact’s authors “didn’t know what the Upper Basin states might do, but they wanted to make sure there was no hanky-panky.” The phrase in question, demanding the Upper Basin send water downstream, simply reinforces the agreed-upon split.
Lake Powell’s decline is seen in these photos of Glen Canyon Dam taken a decade apart. On the left, the water level in 2010; on the right, the water level in 2021. (Source: Bureau of Reclamation)
That, in Glennon’s mind, is the most “sensible interpretation” of the Compact’s language. But if the states decide to take the question to court, Glennon said, a lawsuit over the language “would be a disaster.”
“What, you’re trying to cram modern theories and the science of climate change into a 100-year-old document?” Glennon said.
He pointed out the Colorado River Compact is short — considerably shorter, he joked, than a lease for an apartment. It doesn’t contain any legal definitions for key words like “depleted” or “cause.” No one could predict what the courts would do, and court cases over Western water rights, in the past, have sometimes dragged on for years or even decades.
Glennon adds that if the Upper Basin really wanted to reopen the terms of the Colorado River Compact in a courtroom, there is a stronger argument at hand. The founders who divided up the water in 1922 judged the river’s flow by a period of extremely wet years — in fact, some of the wettest in more than a thousand years. Even setting aside long-term drought and climate change, the compact divvied up more water than the river normally holds. In legal terms, that’s called a “mutual mistake” – and it’s the kind of thing a lawyer could use to void a contract.
“I think that’s a legal argument with some heft to it,” Glennon admitted.
But he wasn’t suggesting anyone take that road. Glennon said it’s in no one’s interest to tear apart the Colorado River Compact. Instead, he expressed faith in the ongoing negotiations.
“We’re pretty close to finding ways to get through this really quite terrible period,” he said. “The people who are working on these issues at the state and federal level are smart, they’re earnest, they’re determined to get through this, and I think they will.”
What’s next for negotiations?
Glennon isn’t the only one who believes the states can hash this out at the negotiating table without leaning on controversial readings of old laws.
Jim Lochhead was Colorado’s top water negotiator in the late 90s, and among the first people to push the “will not cause” interpretation. But now, he said, isn’t the right time for lawyers to make “arcane and complex arguments.”
“Making strident arguments about those interpretations ultimately ignores the responsibility of the basin states to come together and reach agreement on managing a crisis that we all face together as a basin,” Lochhead said.
Rebecca Mitchell, John Entsminger, Estevan Lopez, Gene Shawcroft, JB Hamby, Tom Buschatzke at the Getches-Wilkinson Center/Water and Tribes Initiative Conference June 6, 2024. Photo credit: Rebecca Mitchell
His comments join a chorus of other Colorado River experts who, despite their differences about how exactly to solve the supply-demand crisis, agree on one thing: the river’s future should be decided by the Western states that use its water.
Credit: Earth Justice
“I think the fundamental lesson is that we’re much better off controlling our own destiny than putting our future in the hands of nine justices on the United States Supreme Court who don’t understand Western water law, who don’t understand life in the West,” Lochhead said.
Proposals from both basins are on the desk of the Bureau of Reclamation, the federal agency which manages Western dams and reservoirs. They’re joined by suggestions from tribal nations and a coalition of environmental nonprofits.
Reclamation officials are calling on the states to find some consensus before the November election, so federal water managers can start the paperwork to implement post-2026 river management plans before any potential disarray that could be caused by a change in presidential administrations.
In June, state water negotiators said they plan to take longer than that, hinting that they are more likely to find common ground closer to the 2026 deadline.
“New plot using the nClimGrid data, which is a better source than PRISM for long-term trends. Of course, the combined reservoir contents increase from last year, but the increase is less than 2011 and looks puny compared to the ‘hole’ in the reservoirs. The blue Loess lines subtly change. Last year those lines ended pointing downwards. This year they end flat-ish. 2023 temps were still above the 20th century average, although close. Another interesting aspect is that the 20C Mean and 21C Mean lines on the individual plots really don’t change much. Finally, the 2023 Natural Flows are almost exactly equal to 2019. (17.678 maf vs 17.672 maf). For all the hoopla about how this was record-setting year, the fact is that this year was significantly less than 2011 (20.159 maf) and no different than 2019” — Brad Udall
In May of 2018, USGS Hydrologic Technician Dave Knauer found a batch of zebra mussels attached to the boat anchor in the St. Lawrence River in New York. (Credit: John Byrnes, USGS. Public domain.)
Click the link to read the article on the Colorado Politics website (Thelma Grimes). Here’s an excerpt:
July 18, 2024
After years of taking steps to keep zebra mussels out of Colorado’s rivers and lakes, state officials said on Tuesday they are “devastated” to learn the invasive species has now made its way into the Colorado River, potentially affecting four states, and they are working on a rapid response to stop it from spreading…According to the Colorado Parks and Wildlife, the zebra mussel was found in the Colorado River and Government High Line Canal through routine testing in early July. On July 1, the state’s Aquatic Nuisance Species team collected a plankton sample from the Government Highline Canal near Clifton. The sample was evaluated at a lab in Denver, where a suspected single zebra mussel veliger was found, officials said.
Photo of a zebra mussel veliger discovered by CPW in the Colorado River near Grand Junction after routine testing in early July. A veliger is the mussel’s free-floating (planktonic) larval stage that can only be seen under a microscope. Photo Credit: CPW
A veliger is the free-floating larval stage of a mussel. At this stage in the life cycle, a zebra mussel can only be confirmed through a microscope. The mussels eat plankton, which takes away from fish that rely on it for food…After further analysis on July 9, the lab notified Invasive Species Manager Robert Walters that the sample was positive for zebra mussel DNA, officials said. Since the positive testing, the nuisance species team had collected plankton samples from two locations in the Colorado River upstream of the Grand Valley Water Users Canal. By July 11, both samples were confirmed for zebra mussel DNA.
Justyn Liff, the Bureau of Reclamation’s public affairs specialist, told Colorado Politics that sampling will increase upstream, and more meetings will be held between state and federal agencies to develop a solution to stop the species from spreading. Colorado Parks and Wildlife officials said that, with single detections in both waters, the areas are now designated as “suspect” for the presence of zebra mussels. The response must be rapid, with the state wildlife agency rolling out the Invasive Species Rapid Response Plan, which starts with taking more samples to determine if the official classification should be changed from “suspect” to “positive.”
The Government Highline Canal flows past Highline State Park in the Grand Valley. CREDIT: BETHANY BLITZ/ASPEN JOURNALISM
The Salton Sea (pictured above ) straddles the Imperial and Coachella valleys. (Source: Water Education Foundation)
Click the link to read the article on the InkStain website (John Fleck):
July 5, 2024
Janet Wilson had a super helpful piece this week in the Desert Sun about steps being taken (in a hurry) to get the institutional widgets in place to meet Lower Basin commitments to reduce water use under a deal hashed out in spring 2023 to head of Colorado River NEPA litigation.
I wrote (with youthful enthusiasm) in my book Water is For Fighting Over about the potential of “deficit irrigation” as a water use reduction tool in Imperial and places like it. One of the reasons we have converged on alfalfa as a crop in the arid southwestern United States is how robust it is when the water runs short. From the book:
Do that intentionally, for money, and you have an adaptation tool that avoids fallowing entire fields or “buy and dry”. This also works with Bermuda grass and klein grass, two other forage crops grown in Imperial. Taken together, the three crops accounted for 233,000 of Imperial’s 333,000 acres under active irrigation in June, according to IID’s latest irrigation acreage report. (Total Imperial “farmable” acreage is 436,000 acres, the rest is either being fallowed or between crops right now.)
Deficit irrigation is one of three water conservation tools on the table for Imperial, as discussed in a draft Environmental Assessment released last week. Also on the table are on-farm efficiency improvements and straight up fallowing.
All involve federal money to compensate farmers (and their irrigation district). [ed. emphasis mine]
Denver Water on Tuesday celebrated the completion of its new treatment plant, the Northwater Treatment Plant, after nearly a decade of planning, design and construction.
The plant, built along Highway 93 north of Golden, can clean up to 75 million gallons of water per day and was designed to be expanded if needed. Over time, the new plant will replace the utility’s Moffat Treatment Plant, which was built in Lakewood in the 1930s.
“It was time to build a plant that could replace one of our older plants,” said Nicole Poncelet-Johnson, the head of the water quality and treatment group at Denver Water.
“This new plant will help us better meet the needs of a changing regulatory environment, the impacts of climate change and the need to be more sustainable in our operations,” she said.
The Northwater Treatment Plant began operations earlier this year and was completed under budget.
Denver Water also operates the Foothills Treatment Plant, located near Roxborough and completed in 1983. It’s Marston Treatment Plant, located in southwest Denver, started operations in 1924. Both plants have been updated over their decades of operation.
The Northwater plant incorporates new technology and lessons learned from other treatment plants. Its design also allows for upgrades to be added as needed.
“The designers and contractors have worked on other conventional treatment plants along the Front Range, and you can see in this plant that they brought the best designs and ideas here to Northwater,” Poncelet-Johnson said.
Unique elements at Northwater include deeper filter beds, which are used to filter out dirt particles in water. The deeper filters at the new plant can be operated for longer periods of time between cleanings, making them better suited for treating water affected by various aspects of climate change such as wildfires or floods.
The Northwater Treatment Plant’s filter beds remove dirt particles from the water as it flows through the treatment plant. Photo credit: Denver Water.
The plant uses ultraviolet technology to help clean the water, technology that reduces the time, space and chemicals needed to disinfect the water for delivery to customers.
And a generator that harnesses power from the water flowing into the plant, when combined with other energy efficiency improvements, is capable of producing more energy than it needs for operations.
“This plant helps us be ready for the next 100 years. It’s a great investment in the future for Denver Water and its customers,” Poncelet-Johnson said.
A look back at building the Northwater Treatment Plant
With the old Moffat Treatment Plant, which started operations in the 1930s, nearing its end life, Denver Water decided to build a new treatment plant along Highway 93 north of Golden, near its Ralston Reservoir.
The project requiredinstalling a new pipeline, more than 5 feet in diameter, to carry water more than 8 miles from the new treatment plant to the site of the old Moffat Treatment Plant in Lakewood. The new pipeline replaced one that dated from the 1930s. The Moffat plant also was modified as it will transition from cleaning water to primarily storing water following the completion of the Northwater plant.
The new plant, pipeline and modifications to the Moffat facility are known as the North System Renewal project.
Installing the new water pipeline required tunneling under two railroad lines and three major highways, including Interstate 70:
Denver Water is building a new $90 million water pipeline in Jefferson County, Colorado. The pipeline replaces two existing pipelines and is needed for Denver Water’s new water treatment plant.
Construction on the Northwater Treatment Plant started in September 2018.
In the spring of 2019, the new plant was the subject of a senior capstone project for graduating civil engineering students at the University of Colorado Boulder. The students, working in teams, presented their designs for the building that houses the filter systems at the plant to Denver Water’s leaders on the project.
How did the CU Boulder students do? Watch here:
For CU Boulder engineering students, their spring 2019 capstone project revolved around Denver Water’s new state-of-the-art water treatment plant.
How construction of Denver Water’s newest treatment plant stayed on schedule in 2020, despite the COVID-19 pandemic.
The summer of 2021 saw the beginning of the massive effort to place the thousands of yards of concrete that would make up two giant concrete water storage tanks, each capable of holding 10 million gallons of clean water. The tanks, now partially buried, are most visible aspects of the plant seen from Highway 93.
Pouring the concrete floor of the first of two 10-million-gallon water storage tanks at the new Northwater Treatment Plant started at 2:30 a.m. on Friday, May 14, 2021, and continued through noon that day. Photo credit: Denver Water.
By the end of 2021, the plant had officially passed the 50% complete milestone for construction while the people working on the project had collectively dedicated 1 million hours to the effort.
The Northwater Treatment Plant received several national awards during its years of construction. Photo credit: Denver Water.
In 2022, the project received an award from the American Water Works Association, the largest organization of water supply professionals in the world. The project was the recipient of the 2022 AWWA Innovation Award, given to utilities that have inspired or implemented an innovative idea, best practice, or solution to address a challenge facing the industry.
In 2023, construction of the Northwater plant received national recognition from the American Public Works Association for its commitment and accomplishments around safety, including protecting the health of hundreds of workers on the project during the COVID-19 pandemic.
Lincoln Creek was yellow as it flowed into Grizzly Reservoir in September 2022. A report from the Environmental Protection Agency says metals contamination in the creek and reservoir is a result of natural causes, not a nearby mine. CREDIT: HEATHER SACKETT/ASPEN JOURNALISM
Click the link to read the article on the Aspen Daily News website (Austin Corona). Here’s an excerpt:
July 17, 2024
Ongoing construction at the Grizzly Reservoir turned the Roaring Fork River orange as it ran through Aspen on Tuesday. The discoloration had remained in the upper valley as of Tuesday afternoon, with some cloudiness visible as far downstream as Woody Creek. The river appeared clear at Old Snowmass. The city of Aspen said in a Facebook post that its municipal drinking water is safe to drink. Aspen takes its drinking water from Castle and Maroon creeks, not the Roaring Fork. The only drinking water intake located directly on the Roaring Fork is in Glenwood Springs. Nonetheless, county officials have warned recreators to be cautious when playing in the river and avoid ingesting river water. The county also warned against allowing pets in the river. A county alert on Tuesday said the river could appear muddy and discolored over the next few days. Sediment from Grizzly Reservoir likely contains high loads of copper, aluminum, iron and other minerals. The reservoir is located on Lincoln Creek, where the Environmental Protection Agency discovered high metals contamination in 2023 (the contamination was found to be naturally occurring). After leaving Grizzly, the creek flows into the Roaring Fork River roughly 10 miles upstream of Aspen.
Ordway, Colorado-based Twin Lakes Reservoir and Canal Company, which maintains and operates Grizzly, is installing a liner on the reservoir dam this summer. The company is draining the reservoir as part of the project, which has apparently allowed sediment from the bottom of the reservoir to flow downstream in Lincoln Creek…Twin Lakes Reservoir and Canal began draining the reservoir in late June, sending the drainage water through a tunnel under the continental divide. Toward the end of the process, the water level dropped below the tunnel’s intake, causing project managers to send the remaining reservoir contents down Lincoln Creek.
Click the link to read the release on the USGS website:
August 24, 2022
With the iconic monarch butterfly’s recent addition to the endangered species list, identifying areas where populations are growing or holding constant provides hope that the declines may be slowed or reversed. For the eastern monarch butterfly, the Midwest U.S is a critical breeding area, but climate change is furthering local population declines. Using extensive data sets and forecasting models, a research team supported in part by the Midwest CASC worked with scientists, community leaders and natural resource managers to identify breeding grounds in the Midwest and Ontario, Canada that are projected to be the least impacted by climate change. This information can be used to aid resource managers in locating areas their work may be the most impactful under the uncertainty of future climate conditions.
Over the past week, remnants of Beryl made their way up into the Midwest, bringing with them significant precipitation from east Texas all the way into Michigan. Another shot of significant rain at the end of the current period in the Midwest kept the region quite wet overall. Significant precipitation along the eastern seaboard from New Jersey into the Carolinas was welcomed, but isolated to coastal areas. Much of the rest of the country was quite dry with only pockets of light precipitation. The warmest temperatures were over the West, with departures of 3-6 degrees above normal widespread, and from Washington to California, with departures 9-12 degrees above normal. The coolest temperatures were also associated with areas that picked up the best rains as temperatures from Texas into Arkansas and Missouri were up to 3 degrees below normal. Areas of the Northeast were also warmer than normal with departures of 6-9 degrees above normal…
A few pockets of above-normal precipitation were recorded in northwest South Dakota and north central North Dakota as well as in areas of eastern Kansas at the end of the current period. Much of the rest of the region was dry or received minimal amounts of precipitation. Abnormally dry conditions were expanded in northwest and southeast Kansas as well as in eastern Colorado and western Nebraska. Moderate drought was introduced over eastern Colorado and expanded in northwest Nebraska and southwest South Dakota as well as in eastern portions of Wyoming. Moderate and severe drought expanded in central Colorado as the foothills remained dry. After several weeks of wet weather, some drying out is taking place in portions of the region, which is welcomed in some circumstances…
Colorado Drought Monitor one week change map ending July 16, 2024.
Warmer-than-normal temperatures dominated the region, with only portions of western Colorado and New Mexico below normal for the week with departures of up to 3 degrees below normal in New Mexico. Portions of central Washington and Oregon into northern California had temperatures 9-12 degrees above normal. Isolated rains in New Mexico and Arizona as well as portions of central California were the only precipitation events of significance in the region. In response to the recent heat and dryness, a large swath of abnormally dry conditions was expanded this week from northern Nevada and southern Idaho into northern Utah. Abnormally dry conditions were also expanded in northwest California, western Nevada, southern Colorado and southwest Utah. Moderate drought was expanded over more of central Oregon with more abnormally dry areas added in the west. Moderate drought was expanded in western Wyoming, and Montana had severe drought expand broadly in the west while a new pocket of extreme drought was introduced…
It was a mostly dry week over the region with much of the area experiencing temperatures that were 2-3 degrees below normal. With short-term dryness returning to portions of north Texas and southern Oklahoma, abnormally dry conditions were expanded this week. Throughout the rest of the region, no other significant changes were made this week, with status quo common across the region…
Looking Ahead
Over the next 5-7 days, an active pattern appears to be developing from the Southwest, Plains, and into the Southeast and eastern seaboard. The most significant precipitation is anticipated over New Mexico, southern Colorado, northeast Texas, and from Louisiana through Virginia. Dry conditions are anticipated over much of the West and Midwest during this period. Cooler-than-normal temperatures are anticipated over much of the Plains, South and into the Southeast, with some departures from normal approaching 9-11 degrees below normal in portions of Nebraska, Kansas and into Colorado and New Mexico. Warmer-than-normal temperatures will dominate the West with departures of 11-13 degrees above normal over the Great Basin and into the northern Rocky Mountains. Near-normal temperatures are anticipated over other areas.
The 6-10 day outlooks show that the greatest chances of below-normal temperatures will be over the southern Plains into portions of the South, Southwest and southern Midwest. The greatest probability of experiencing above-normal temperatures during this time will be over the West and the Florida peninsula and portions of the Northeast. The highest probability of above-normal precipitation will be over Texas with the area from the Southwest into the Mid-Atlantic also expected to have above-normal chances of above-normal precipitation. The area with the greatest chances of below-normal precipitation will be over the northern Rocky Mountains into the northern High Plains.
US Drought Monitor one week change map ending July 16, 2024.
American beaver, he was happily sitting back and munching on something. and munching, and munching. By Steve from washington, dc, usa – American Beaver, CC BY-SA 2.0, https://commons.wikimedia.org/w/index.php?curid=3963858
From email from the Beaver Institute (Matt Moseley):
BOULDER, Colo – As drought, climate change and wildfires become more challenging around the country, the intriguing beaver has become a hot topic these days.
BeaverCON is the premier global gathering for knowledge-sharing and celebration of beavers. The Beaver Institute will host the third biennial global gathering on October 19-24 at the University of Colorado Boulder. It will feature presentations, science, field trips, panels, discussion, art and storytelling about the castor canadensis.
“Beavers are more important than ever in water management and creating habitat,” said Adam Burnett, executive director of the Beaver Institute. “This conference is an opportunity for multiple organizations, disciplines, and experiences to converge and learn how to create a future of ecological balance with beavers. We are thrilled with the speakers and energy around this unique and special conference.”
Highlights of BeaverCON:
Saturday, October 19: Cameron Peak Wildfire Field Trip with Dr. Emily Fairfax.
Sunday, October 20: Urban Beaver Field Trip
Monday, October 21: Opening Ceremony with Tribal Recognition, activating of Artist Commission; featured presenters include Dr. Emily Fairfax on wildfires, USDA FSA Administrator Zach Ducheneaux on beavers and farmers, Dr. Ellen Wohl on beavers in Colorado, California’s Natural Resources Secretary Wade Crowfoot on beaver reintroduction, Brock & Kate Lundquist on the Bring Back the Beaver Campaign, and Jim Vaile & Alicia Yellow Owl on Blackfeet Nation’s beaver management plan.
Tuesday, October 22: Multiple speakers on beaver-related restoration, coexistence, relational conservation, partnering with Tribal Nations, youth leadership, subsistence living, relocation, and policy. Leading voices in the field Molly Alves, Mark Beardsley, Dr. Roisin Campbell-Murphy, Janine Castro, Derek Gow, Dr. Chris Jordan, Dr. Jordan Kennedy, Sarah Marshall, Torrey Ritter, Gerhard Schwab, Dr. Colin Thorne, and Alexa Whipple, will present and participate in panels. A Beaver Storytelling Circle will be held at the Dairy Arts Center in the evening.
Wednesday, October 23: A sprawling “State of the Beaver Union” session, Low-Tech Process-Based Restoration (LTPBR) technical sessions, film screenings, and presentations on permafrost, rewilding, youth leadership, policy, and more.
Thursday, October 24: Wetland Field Trip and a beaver coexistence workshop with Mike Callahan (Beaver Solutions, Beaver Institute)
Photo of a zebra mussel veliger discovered by CPW in the Colorado River near Grand Junction after routine testing in early July. A veliger is the mussel’s free-floating (planktonic) larval stage that can only be seen under a microscope. Photo Credit: CPW
Colorado Parks and Wildlife (CPW) announces the discovery of zebra mussel veligers in the Colorado River and Government Highline Canal after routine testing in early July.
On July 1, staff from CPW’s Aquatic Nuisance Species (ANS) team collected a plankton sample from the Government Highline Canal near Clifton. This sample was evaluated at the ANS Lab in Denver where a suspected single zebra mussel veliger was found. The Sample was then sent to CPW’s Aquatic Animal Health Lab (AAHL) for further analysis. On July 9, the lab notified Robert Walters, Invasive Species Program Manager, that the sample was positive for zebra mussel DNA.
The Government Highline Canal, in Palisade. The Government Highline Canal near Grand Junction. The Grand Valley Water Users Association, which operates the canal, has been experimenting with a program that pays water users to fallow fields and reduce their consumptive use of water. Photo: Brent Gardner-Smith/Aspen Journalism
On July 8, CPW ANS staff collected plankton samples from two locations in the Colorado River upstream of the Grand Valley Water Users Canal diversion. On July 10 ANS technicians identified single suspect zebra mussel veligers in both samples. The samples were sent to the AAHL for confirmation. On July 11, the lab confirmed the samples were positive for zebra mussel DNA.
With single detections in both waters, these locations are now considered “suspect” for the presence of zebra mussels. In response to this detection, CPW has initiated their Invasive Species Rapid Response Plan and increased sampling is underway to determine if the classification should be changed to “positive,” a designation given when two or more subsequent sampling events detect mussel veligers in a water body.
A veliger is the free-floating (planktonic) larval stage of the mussel. At this stage of their life cycle, zebra mussels can only be seen under a microscope. No adult zebra mussels have been found at this time at either location.
“This challenging discovery has ecological and economic impacts not only on the Grand Valley but potential statewide impacts as well. CPW is committed to working with all of our partners as we work to better understand the extent of this discovery and the next steps in protecting the natural resources and infrastructure,” said CPW Director Jeff Davis.
Zebra mussels pose an extreme risk of ecological impacts to Colorado. The establishment of zebra mussels in the Colorado River is likely to negatively impact native fish populations due to their filter-feeding strategies that strip essential prey items, such as plankton, from the water. Slower-moving sections of the Colorado River, such as pools, eddies, and backwaters, are especially prone to invasion.
Zebra mussels also pose a risk to infrastructure that pulls water from the Colorado River. Female zebra mussels can produce up to 1,000,000 eggs in a spawning season. As they mature, the mussels bond to surfaces with byssal threads making them extremely difficult to remove. This rapid reproduction coupled with their attachment by byssal threads can lead to clogged water infrastructures creating long-term maintenance issues.
“We are disappointed in the situation we find ourselves in,” said Ed Warner, Area Manager, BOR Western Colorado Area Office. “We know how much effort CPW has put into keeping the Colorado River clear of zebra mussels. This is an extremely difficult scenario for all who rely on the Upper Colorado River system. We look forward to partnering with CPW, our stakeholders, and all involved to do what we can to address the situation.”
“This news is devastating,” said Tina Bergonzini, Grand Valley Water Users Association General Manager “Having our canal and the Colorado River test positive increases the threat of this invasive species and could impact everyone in the Grand Valley. From irrigation to drinking water, the ramifications cannot be underestimated or overstated. Our efforts, alongside our partners at CPW and the BOR, will be increased to protect our infrastructure, the livelihoods of so many, and water security for us all.”
CPW staff will continue working closely with our partners at the Bureau of Reclamation and Grand Valley Water Users Association on the next steps. Signs alerting the public of the river status will be posted at river access points starting in the De Beque Canyon to the Loma Boat Ramp.
“Detecting mussels in the Colorado River highlights how critical it is for boaters, paddlers, anglers, and any person recreating in Colorado’s waters to do their part in preventing the spread,” said Robert Walters, Invasive Species Program Manager.
CPW strongly encourages anyone boating, floating, paddling, or fishing in the Colorado River to clean, drain, and dry their vessels and equipment, including motorized boats, rafts, paddle boards, kayaks, and fishing gear after exiting the river.
CPW is evaluating options for the future management of Highline Lake based on this new information. Updates regarding access, fishing regulations, and water management will be provided once those decisions have been made.
Questions from the media for the Bureau of Reclamation can be directed to BOR Public Affairs Specialist Justyn Liff at 970-248-0625 or jliff@usbr.gov.
Questions from the media for the Grand Valley Water Users Association can be directed to GVWAU General Manager Tina Bergonzini at 970-242-5065 or tbergonzini@gvwua.com.
🚨 This is big news—we’ve discovered zebra mussel larvae in the Colorado River and Government Highline Canal near Grand Junction. No adult zebra mussels have been found at this time. pic.twitter.com/HIPoau5PQd
— Colorado Parks and Wildlife (@COParksWildlife) July 16, 2024
SPANISH TRANSLATION:
CPW anuncia el descubrimiento de mejillones cebra en el río Colorado y el canal Highline del Gobierno
GRAND JUNCTION, Colorado. – El Departamento de Parques y Vida Silvestre de Colorado (CPW, por sus siglas en inglés) anuncia el descubrimiento de veligers de mejillón cebra en el río Colorado y el canal Government Highline después de hacer pruebas de rutina al principio de julio.
El 1 de julio, el personal del equipo de Especies Acuáticas Molestas (ANS) de CPW recolectó una muestra de plancton del Canal Highline del Gobierno, cerca de Clifton. Esta muestra fue evaluada en el Laboratorio ANS en Denver, donde se encontró un presunto veliger de mejillón cebra. Luego, la muestra se envió al Laboratorio de Salud de Animales Acuáticos (AAHL) de CPW para más análisis. El 9 de julio, el laboratorio notificó a Robert Walters, Gerente del Programa de Especies Invasoras, que la muestra era positiva de ADN de mejillón cebra.
El 8 de julio, el personal de CPW ANS recolectó muestras de plancton de dos lugares en el río Colorado aguas arriba del desvío del Canal de Usuarios de Agua de Grand Valley. El 10 de julio, un técnico de ANS identificó a un solo sospechoso de mejillón cebra en ambas muestras. Las muestras se enviaron a la AAHL para su confirmación. El 11 de julio, el laboratorio confirmó que las muestras eran positivas de ADN de mejillón cebra.
Con detecciones únicas en ambas aguas, estos lugares ahora se consideran “sospechosos” de la presencia de mejillones cebra. En respuesta a esta detección, CPW ha iniciado su Plan de Respuesta Rápida de Especies Invasoras y se está llevando a cabo un aumento de muestreo para determinar si la clasificación debe cambiarse a “positiva”, una designación que se da cuando dos o más eventos de muestreo posteriores detectan mejillones veligers en agua.
Un veliger es la etapa larvaria flotante (planctónica) del mejillón. En esta etapa de su ciclo de vida, los mejillones cebra solo se pueden ver bajo un microscopio. No se han encontrado mejillones cebra adultos en este momento en ninguno de los dos lugares.
“Este desafiante descubrimiento tiene impactos ecológicos y económicos no solo en el Gran Valle, sino también posiblemente en todo el estado. CPW está comprometido a trabajar con todos nuestros socios para comprender mejor el alcance de este descubrimiento y los próximos pasos para proteger los recursos naturales y la infraestructura”, dijo el director de CPW, Jeff Davis.
Los mejillones cebra representan un riesgo extremo de impactos ecológicos para Colorado. Es probable que el establecimiento de mejillones cebra en el río Colorado tenga un impacto negativo en las poblaciones de peces nativos debido a sus estrategias de alimentación por filtración que despojan del agua a las presas esenciales, como el plancton. Las secciones más lentas del río Colorado, como pozas, remolinos y remansos, son especialmente propensas a la invasión.
Los mejillones cebra también representan un riesgo para la infraestructura que extrae agua del río Colorado. Las hembras de mejillón cebra pueden producir hasta 1,000,000 de huevos en una temporada de desove. A medida que maduran, los mejillones se adhieren a las superficies con hilos bisales, lo que los hace extremadamente difíciles de eliminar. Esta rápida reproducción, junto con su fijación por roscas bisales, puede provocar la obstrucción de las infraestructuras de agua, lo que crea problemas de mantenimiento a largo plazo.
“Estamos decepcionados con la situación en la que nos encontramos”, dijo Ed Warner, Gerente de Área de la Oficina del Área Occidental de Colorado de BOR. “Sabemos cuánto esfuerzo ha puesto CPW para mantener el río Colorado libre de mejillones cebra. Este es un escenario extremadamente difícil para todos los que dependen del sistema del río Colorado. Esperamos asociarnos con CPW, nuestras partes interesadas y todos los involucrados para hacer lo que podamos para abordar la situación”.
“Esta noticia es devastadora”, dijo Tina Bergonzini, Gerente General de la Asociación de Usuarios de Agua de Grand Valley, “El hecho de que nuestro canal y el río Colorado den positivo aumenta la amenaza de esta especie invasora y podría afectar a todos en Grand Valley. Desde el riego hasta el agua potable, las ramificaciones no pueden subestimarse ni exagerarse. Nuestros esfuerzos, junto con nuestros socios en CPW y BOR, se incrementarán para proteger nuestra infraestructura, los medios de vida de tantas personas y la seguridad hídrica para todos nosotros”.
El personal de CPW continuará trabajando en estrecha colaboración con nuestros socios en la Oficina de Recuperación y la Asociación de Usuarios de Agua de Grand Valley en los próximos pasos. Se colocarán letreros que alerten al público sobre el estado del río en los puntos de acceso al río, comenzando en el cañón De Beque hasta la rampa para botes de Loma.
“La detección de mejillones en el río Colorado pone de manifiesto lo importante que es para los navegantes, remeros, pescadores y cualquier persona que se recree en las aguas de Colorado hacer su parte para prevenir la propagación”, dijo Robert Walters.
CPW recomienda encarecidamente a cualquier persona que navegue, flote, reme o pese en el río Colorado que limpie, drene y seque sus embarcaciones y equipos, incluidos botes motorizados, balsas, tablas de remo, kayaks y equipos de pesca después de salir del río.
CPW está evaluando opciones para la futura administración del lago Highline en función de esta nueva información. Las actualizaciones sobre el acceso, las regulaciones de pesca y la gestión del agua se proporcionarán una vez que se hayan tomado esas decisiones.
Las preguntas de los medios de comunicación para la Oficina de Reclamación pueden dirigirse al especialista en asuntos públicos de BOR, Justyn Liff, al 970-248-0625 o jliff@usbr.gov.
Las preguntas de los medios de comunicación para la Asociación de Usuarios de Agua de Grand Valley pueden dirigirse a la Gerente General de GVWAU, Tina Bergonzini, al 970-242-5065 o tbergonzini@gvwua.com.
Click the link to read the article on the Sibley’s Rivers website (George Sibley):
July 17, 2024
In the last post, I suggested that the Colorado River Compact with its ‘temporary equitable division’ into two basins could now be considered irrelevant (or worse, obstructive) because we have finally effectively accomplished, over the past century, the goal that brought the seven-state Compact commission together in 1922, but which they were unable to achieve then: a seven-way division of the use of the river’s waters.
They wanted a legally constituted seven-way division that would override the appropriation doctrine at the interstate level, to avoid a seven-state horserace for water in which California was already lapping the field, but in 1922 they lacked, for that goal, both a sufficient knowledge of the river’s flows and reasonable expectations for their own growth. Finally they settled on the two-basin division that was, from the start, problematic (Arizona refused to even ratify it), but which sufficed to persuade Congress that the states were enough in agreement so that Congress could go ahead with funding the big mainstem structures the Bureau of Reclamation was champing at the bit to build (perhaps the real goal of the Compact).
But now, after a century of Colorado River development, we ought to be able to say, with resignation if not confidence, that, yes, we have accomplished an eight-way division of use of the river’s waters (seven states plus Mexico). We can say this because all of the waters of the river have been put to use; what each state has to use now is almost certainly all the water it will ever have to use – at best.
Is it an ‘equitable’ division? The Compact intended for each basin to have the use of half of the river’s waters; what has evolved over the century is roughly two-thirds of the river being used by the Lower Basin, one third by the Upper. But a huge majority of the 35-40 million people served by the river live in the Lower Basin; the majority of the best land irrigable by the river is there. Speaking as an Upper Basin inhabitant, I would rather see the water go where the people are, than the people coming to where the water is (although too much of that is happening anyway).
Map credit: AGU
But to my point: the seven-way (plus Mexico) division of the use of the waters that the Compact commissioners wanted has been achieved – like it or not. (Water for the 30 First People tribes is shoehorned into the state allotments.) So can we not finally jettison the two-basin division that has really proven to be nothing but divisive? As indicated by the current situation, with each basin producing a plan for the future that is unacceptable to the other basin?
We seem to have two options for the post-2026 operation and management of the river systems and structures at this point: one, add another set of ‘Law of the River’ modifications, corrections, crutches and bandaids to the beat-up Compact. Or two, start to do what we keep telling ourselves we need to be doing today: ‘thinking outside the box’ – the Compact being the box we’re in. Nested in a larger box, the appropriation doctrine as the ultimate answer, no matter what the question.
So with the seven states currently deadlocked in the two-basin box, we might take the moment to at least haul ourselves up onto the edge of the box to look around – and we might find a start in looking at the basic nature and function of our river, underneath all the physical, legal and economic structures we’ve laid over it to control and contain its basic nature. There is also some interesting science happening around the river I want to get into….
The basic function of every stream is to collect and carry off water from precipitation that the precipitation ‘catchment basin’ could not ‘catch’ and put to work in some way nurturing other life, soaking into the root zone of the plant life or accumulating in surface pools and lakes. When it comes too fast (as when a snowpack is melting), or the slope is too steep or rocky, the ‘catchment basin’ becomes a ‘watershed,’ shedding water. This is not to say that a living stream is just a ‘drainage ditch’; the water itself gives intimations of trying to stay with the land, slowing itself with picking up everything from sand and gravel to whole trees; and when the slope gentles enough, it drops what it is carrying in its own path and forces itself into looping meanders and wetlands that maximize contact with the land and opportunities to stay there.
A stream becomes a ‘gaining’ or ‘losing’ stream, depending on what is happening in the watershed it is moving through: precipitation causes direct runoff from the land, and also raises the water table, the level of saturation in whatever geological structures underlie the watershed. Both of those can add water to the stream, making it a ‘gaining’ stream. If there is no precipitation, or only enough to wet the root zone for whatever plant life is trying to hold the watershed together, and if the stream is carrying a flow that is higher than the water table in the stream’s riparian zone, then the stream will give some of its water to its riparian zone in what hydrologists call a ‘hyporheic exchange,’ making it a ‘losing’ stream. (Personally, I think of it as a ‘giving stream.’)
You can probably see where this is going for a river in an arid region like most of the Colorado River Basin. Humid-region rivers like the Mississippi and its eastern tributaries tend to be ‘gaining streams’ all the way to the oceans, due to precipitation throughout the basin, but an arid-region river is more likely to be a ‘losing (giving) stream’ once it leaves its relatively wet headwaters.
This Trail Ridge Road view of the Colorado Front Range shows how the upslope conditions are created. Photo credit: Texas A&M University
A state-of-the-science study by the Western Water Assessment (based at the University of Colorado), compiling work from many river scientists, reported that 85-90 percent of the Colorado River’s total water supply is runoff from the mountain headwaters of the Colorado River. The mountains force air upward into cooler atmospheric levels, where any moisture in the air condenses and falls as precipitation, mostly above 8,000 feet in elevation. There would be no Colorado River were it not for the mountain ranges rising to 14,000 feet in the Southern Rockies – which constitute less that 15 percent of the Basin’s 250,000 square miles. The river’s desert reaches receive very little dependable precipitation – a lot of which comes in violent summer storms powerful enough to break through the ‘heat shield’ that creates the virga – the afternoon would-be storms when rain is seen trailing out of clouds, but being vaporized before reaching ground by the rising desert heat.
The Colorado River, despite its mountain origins, is a desert river. Below the 7,000-foot elevation the river’s tributary streams flow onto (and deeply into) the high deserts of the Colorado Plateau, then out of those canyons and into the subtropical Sonora and Mojave Deserts. Desert rivers, as a rule, are gaining streams only in their headwaters highlands; once in the deserts, they are losing (giving) streams that begin to disappear, through evaporation, plant transpiration, and ‘giving’ to low water tables – and now, of course, to humans diverting the river to irrigate rich but dry desert lands, or to water great desert cities: human practices that go back 6,000 years to the ‘Fertile Crescent’ of the Tigris and Euphrates Rivers and the floodplains of the Nile.
The Colorado River, despite its mountain origins, is a desert river. Below the 7,000-foot elevation the river’s tributary streams flow onto (and deeply into) the high deserts of the Colorado Plateau, then out of those canyons and into the subtropical Sonora and Mojave Deserts. Desert rivers, as a rule, are gaining streams only in their headwaters highlands; once in the deserts, they are losing (giving) streams that begin to disappear, through evaporation, plant transpiration, and ‘giving’ to low water tables – and now, of course, to humans diverting the river to irrigate rich but dry desert lands, or to water great desert cities: human practices that go back 6,000 years to the ‘Fertile Crescent’ of the Tigris and Euphrates Rivers and the floodplains of the Nile.
The Colorado River, as it ran before we went to work on it, still carried enough water so there would be some left after its passage through the deserts, to ‘waste’ into the Gulf of California – most of in a 2-3 month flood as the snow melted, then dropping to a trickle in the delta that probably went intermittent in drier periods. But the Great Basin north of the Colorado River region has good current examples of what happens more or less naturally with desert rivers.
Credit: USGS
Forty streams and rivers flow into the Great Basin from the Sierras, the Wasatch, the Colorado and Columbia Plateaus, and the smaller Nevada ranges within its basin-and-range landscape, and most of those streams just disappear there. Some of them are substantial like the Truckee and Humboldt Rivers as they emerge from the mountains, and flow into salty fluctuating lakes similar to but much smaller than the Great Salt Lake (also in the Great Basin). But most of those streams disappear in shallow silty playas that are dry most of the year, or they just dribble off into the riparian scrub growth they nurture in passing.
Evaporation and plant transpiration from those ‘dying’ Great Basin desert rivers is probably responsible for some of the precipitation that falls on the Southern Rockies and creates the Colorado River. As the dried-out westerlies pass over the Sierras where they’ve dumped their load of Pacific moisture – a lot of it on the Sierras’ east slopes (Tahoe Lake regularly gets 8-20 feet of snow), the dried air warms up as it flows down the mountains and begins picking up vapor evaporated from the 40 Great Basin streams and rivers, carrying it on to the Rockies where it is again condensed to precipitation.
Colorado River water is thus at the end of a line of freshwater transformations beginning with water vapor from the Pacific Ocean, condensed to rain over California’s coastal mountains, running off as liquid water to the Central Valley, then to vapor again under the hot sun, picked by the westerlies, then condensed to serious rain or snow over the high Sierras, then back to water running off the Sierras, then evaporated again in the Great Basin and again picked up by the westerlies, then condensed again to snow as it is cooled over the Southern Rockies, then melted as runoff and groundwater for the Colorado River.
The freshwater dance: less than three percent of the planet’s water is in the freshwater cycle at any time, but all land-based life depends on that fraction, mostly in its liquid state. One notices, however, that the sun and wind that create it over the ocean and move it onto land work hard to return it to its vaporous state – and what we are doing to our atmosphere is making it easier for the vaporizing forces, and more difficult to keep enough liquid water for all life everywhere.
When it comes to contemplating the management and operation of a desert river, it’s useful to begin by trying to ignore all of the artificial boundaries drawn over the river basin, especially the state boundaries which (except for where the river divides California from Arizona) bear absolutely no resemblance to or reflection of any real geography. Dividing unsettled lands into large ‘territories,’ bounded by straight lines useful only in oceanic navigation, is an imperial ploy used to create weak political and economic states with a developed dependence on the powers that drew the lines – in our case, setting up resource supply territories for the ever-expanding industrial juggernaut ‘back east.’
Western US
If you can forget the state lines and look at nature’s usually blurrier or fuzzier lines – you don’t need to be hydrologist to see that a desert river divides naturally into two regions: a water-production region in the mountains and other uplands that receive most of the river-creating precipitation, and a water-consumption region, the deserts where the river’s water gradually disappears into atmospheric vapor, groundwater, or riparian life – now including extensive human activities taking some of the water a long way from the natural river channel.
Obviously the two regions require different management strategies, in a time of water-stress. In the Colorado River’s ‘water-consumption’ region, with humans now the largest consuming entity, the management challenge is in the broad range of activities that can be called ‘conservation’: implementing systemic changes like requiring low-flow fixtures in all construction or remodeling; determining the best balance of water uses and providing the carrots and sticks to work toward those balances; doing what can be done to capture whatever precipitation does fall rather than treating it as ‘storm runoff’; where possible ‘hiding’ stored water away from the sun through recharging underground aquifers; developing internal and inter-community water reuse and sharing systems for the metropolitan sprawls – et cetera.
Rendering of Phoenix’s proposed Cave Creek direct potable reuse project. Source: City of Phoenix
A lot of work is already being done in these ventures – mostly initiated by the cities themselves, or by large irrigation entities – sometimes working together with the cities. Such measures are expensive – some of them very expensive, like reuse systems requiring substantial disruptive replumbing, but they do ‘increase the water supply’ to the extent that water not needed in one place can fill a shortage somewhere else.
But an entirely different set of management challenges await up in the ‘water-production’ region – the 15 percent of the basin that produces 85-90 percent of its water – and not a lot is being done about those challenges, so far as I can tell, at least not in a conscious and deliberate way. Most of the water-production region is public land, and most of it is administered by the U.S. Forest Service which has a lot of other challenges on its plate.
But there is a factoid from the aforementioned Western Water Assessment study of Colorado River science that intrigues: they say that as much as 170 million ace-feet of precipitation falls on the Colorado River Basin, the majority of it in the mountain headwaters tributaries – yet only about 10 percent of that shows up in the river. What happens to the rest of it?
I’m reupping this in case you missed it. $9,000 to go.
Laurna Kaatz photo credit Aspen Global Change Institute.
From email from Taylor Winchell:
June 26, 2024
Hi all,
I hope this message finds you well. I am reaching out to let you know about a GoFundMe campaign to support Laurna Kaatz as she continues her recovery from a traumatic brain injury suffered in October 2021.
Laurna’s impact on climate adaptation, water resource management, and in supporting her many colleagues is simply immeasurable. This GoFundMe campaign is an opportunity for us to come together and show our support to Laurna during this ongoing challenging experience.
If you have any questions or need further information, please feel free to reach out (taylorwinchell@gmail.com). My apologies if this email has reached you and you do not know Laurna – this email distribution was assembled from a variety of lists that generally know Laurna and therefore includes some people that may not know Laurna well or at all.
“New plot using the nClimGrid data, which is a better source than PRISM for long-term trends. Of course, the combined reservoir contents increase from last year, but the increase is less than 2011 and looks puny compared to the ‘hole’ in the reservoirs. The blue Loess lines subtly change. Last year those lines ended pointing downwards. This year they end flat-ish. 2023 temps were still above the 20th century average, although close. Another interesting aspect is that the 20C Mean and 21C Mean lines on the individual plots really don’t change much. Finally, the 2023 Natural Flows are almost exactly equal to 2019. (17.678 maf vs 17.672 maf). For all the hoopla about how this was record-setting year, the fact is that this year was significantly less than 2011 (20.159 maf) and no different than 2019” — Brad Udall
In 2022, Lake Powell was at its lowest since it was originally filled in the 1960s. [Amy] Haas noted an ongoing concern that there is currently no mechanism to ensure the conserved water from the upper basin states is flowing down to Lake Powell and staying there.
The relationship between the upper and lower basin states is not always pleasant, but [Gene] Shawcroft noted that recently, agreements and understandings have been made between the entities…In their post-2026 operations proposal, the lower basin states said they would cut water use by 1.5 million acre-feet per year as long as Lake Powell and Lake Mead’s combined storage remains at a certain level. Shawcroft added that the question now is, at what point, do these cuts in water use begin?
“The upper division states feel very strongly that we need to improve our storage (and) that we need additional storage. And so our concept would be that we would have that one-and-a-half reduction occur at an elevation that was higher than what they would propose. Their position, or their thought process is, if there’s water in the system, we ought to put it to use,” he said.
Haas added, “The lower basin is proposing actions based on total system contents as they define it, which includes not only Lake Powell and Lake Mead but also the upstream initial units, right? So this would be Flaming Gorge, the Aspinall unit in Colorado and Navajo.”
Contractors move equipment as part of a 2021 study of removing per- and polyfluoroalkyl (PFAS) from the aquifer under Cannon Air Force base, near Clovis, New Mexico. New Mexico asked a judge to require the federal government to pay current and future damages from PFAS in court documents filed Monday, July 8, 2024. (Courtesy U.S. Air Force Staff Sgt. Maxwell Daigle)
Click the link to read the article on the SourceNM.com website (Danielle Prokop):
July 10, 2024
New Mexico requested a judge order the federal government to pay the past and future costs of cleaning up ‘forever chemicals’ from military bases across the state, per court documents filed Monday.
New Mexico officials argue the federal government needs to be accountable for PFAS contamination costs at Cannon Air Force Base, Holloman Air Force Base, Kirtland Air Force Base, White Sands Missile Range and Fort Wingate.
Now, after a federal rules change on Monday, they hope it will allow the state to recover damages and future cleanup costs for PFAS contamination left by the U.S. Department of Defense at military bases across New Mexico.
“We applaud the EPA’s listing of certain PFAS, or ‘forever chemicals,’ as hazardous substances under the Superfund statute,” New Mexico Attorney General Raúl Torrez said. “This enables us to pursue monetary damages and costs at federal facilities, as stated in our amended complaint.”
Torrez said the change means a federal law requiring polluters to pay to clean up contamination now applies to PFAS.
The designation of PFAS as a hazardous substance is separate from the EPA’s efforts to remove the forever chemicals in drinking water.
The filing makes the federal government liable to pay for current and future costs, repair damages to water, land, air and address impacts to wildlife and the state’s economy.
“This opens the door for us to really help communities like Clovis who have been suffering for far too long with this threat, if not actuality of PFAS,” New Mexico Environment Secretary James Kenney said.
He told Source New Mexico that if a judge grants the request, the timeline for payment would be uncertain, but pointed to a similar process on the Gold King Mine, which took several years.
The state has spent an estimated $8 million to $10 million on technical, legal costs and clean-up at Cannon and Holloman, Kenney said, but the estimates for cleanup at all sites will be expensive.
“We could easily be looking at up to 150 million, if not more, especially once we understand the magnitude of the damages,” Kenney said.
He said it’s unclear when the state will have an estimated cost of damages available.
“It depends if we have cooperation by the United States,” Kenney said. “I would say to be five and-a-half years in, and to be where we are today, does not scream – to me – cooperation.”
As part of those costs, New Mexico is looking to recoup at least $850,000 for the removal of thousands of PFAS-contaminated cow carcasses from a dairy farm next to Cannon, another $1.3 million for investigation contamination around bases, according to the complaint.
The filing amends a five-year old civil case before the federal District of South Carolina Court. That case combined 500 claims from across the country seeking damages from contamination caused by the use of a fire-fighting foam containing PFAS. The case has been in a discovery phase since 2020.
Specifically, New Mexico said the U.S. Army and the U.S. Air Force broke state law by failing to contain or “address contaminants, hazardous wastes, and hazardous substances,” listing how PFAS was found in groundwater and surrounding environment.
The original 2019 complaint only focused on Cannon and Holloman Air Force bases, but the amended complaint filed Monday expands to five sites.
New Mexico argued in their 65-page motion that while the federal government has acknowledged that PFAS poses “an imminent and substantial danger,” at Cannon, that they have failed to take action to clean up.
The complaint asked that the court grant the state the power to direct the federal government to “to take all steps necessary” on clean-up.
The U.S. Department of Defense deferred comment to the U.S. Department of Justice Tuesday.
New Mexico is embroiled in a second, separate federal lawsuit with the U.S. Department of Defense over PFAS, which is still in mediation, and is not part of the effort to recoup damages.
The Klamath River is experiencing an amazing transformation. The remaining 3 of 4 dams are coming down. This winter, Yurok crews hand planted 8.5 tons of native seeds in the former reservoirs. Now, an array of locally adapted wildflowers & grasses cover much of the clay soil. pic.twitter.com/WidDSihHxV