In 2050 the food on our dinner plates will look very different than it does now. A changing climate will force a shift from water and land-intensive staples like beef and dairy to more resilient alternatives. Rising temperatures and erratic weather patterns have already reduced the yields of traditional crops like potatos, coffee, bananas, wheat, corn, and rice. As those staples become harder to produce humanity will pivot toward more resiliant crops like millet, sorghum, beans and lentils—which can thrive in degraded soil and arid conditions.
The most dramatic shift will occur in our protein consumption, specifically the move away from industrial livestock. Cattle farming is both a major contributor to greenhouse gas emissions and highly vulnerable to water scarcity. By mid-century, traditional beef and pork will likely become luxury items. In their place, lab-grown meat, insect proteins, and plant-based meat substitutes will become the norm, offering the same nutritional benefit at a fraction of the environmental cost.
Beyond meat alternatives, we can expect to see insects and algae integrated into the mainstream diet. While we turn our noses up to them now, crickets and mealworms are highly efficient protein sources that require minimal land and water. Similarly – seaweeds and microalgae like spirulina will move from health-food niches to primary ingredients, valued for their ability to grow rapidly in saltwater without the need for synthetic fertilizers or freshwater irrigation.
Technology will also personalize our nutrition to combat food insecurity and supply chain instability. With the rise of vertical farming and hydroponics in urban centers, fresh produce will be grown blocks away from where it is consumed, reducing “food miles” and spoilage. We may also see the widespread use of biofortified crops—genetically engineered to contain higher levels of essential vitamins—to compensate for the nutrient density loss currently being observed in plants grown under high CO2 levels.
Ultimately, the diet of 2050 will be defined by diversification and efficiency. The era of relying on a handful of global commodities is coming to an end, replaced by a circular food economy that prioritizes local resilience and low-impact nutrients. While these changes are born of necessity, they offer a path toward a more sustainable relationship with the planet, ensuring that a growing population can be fed sustainably in a warming world.
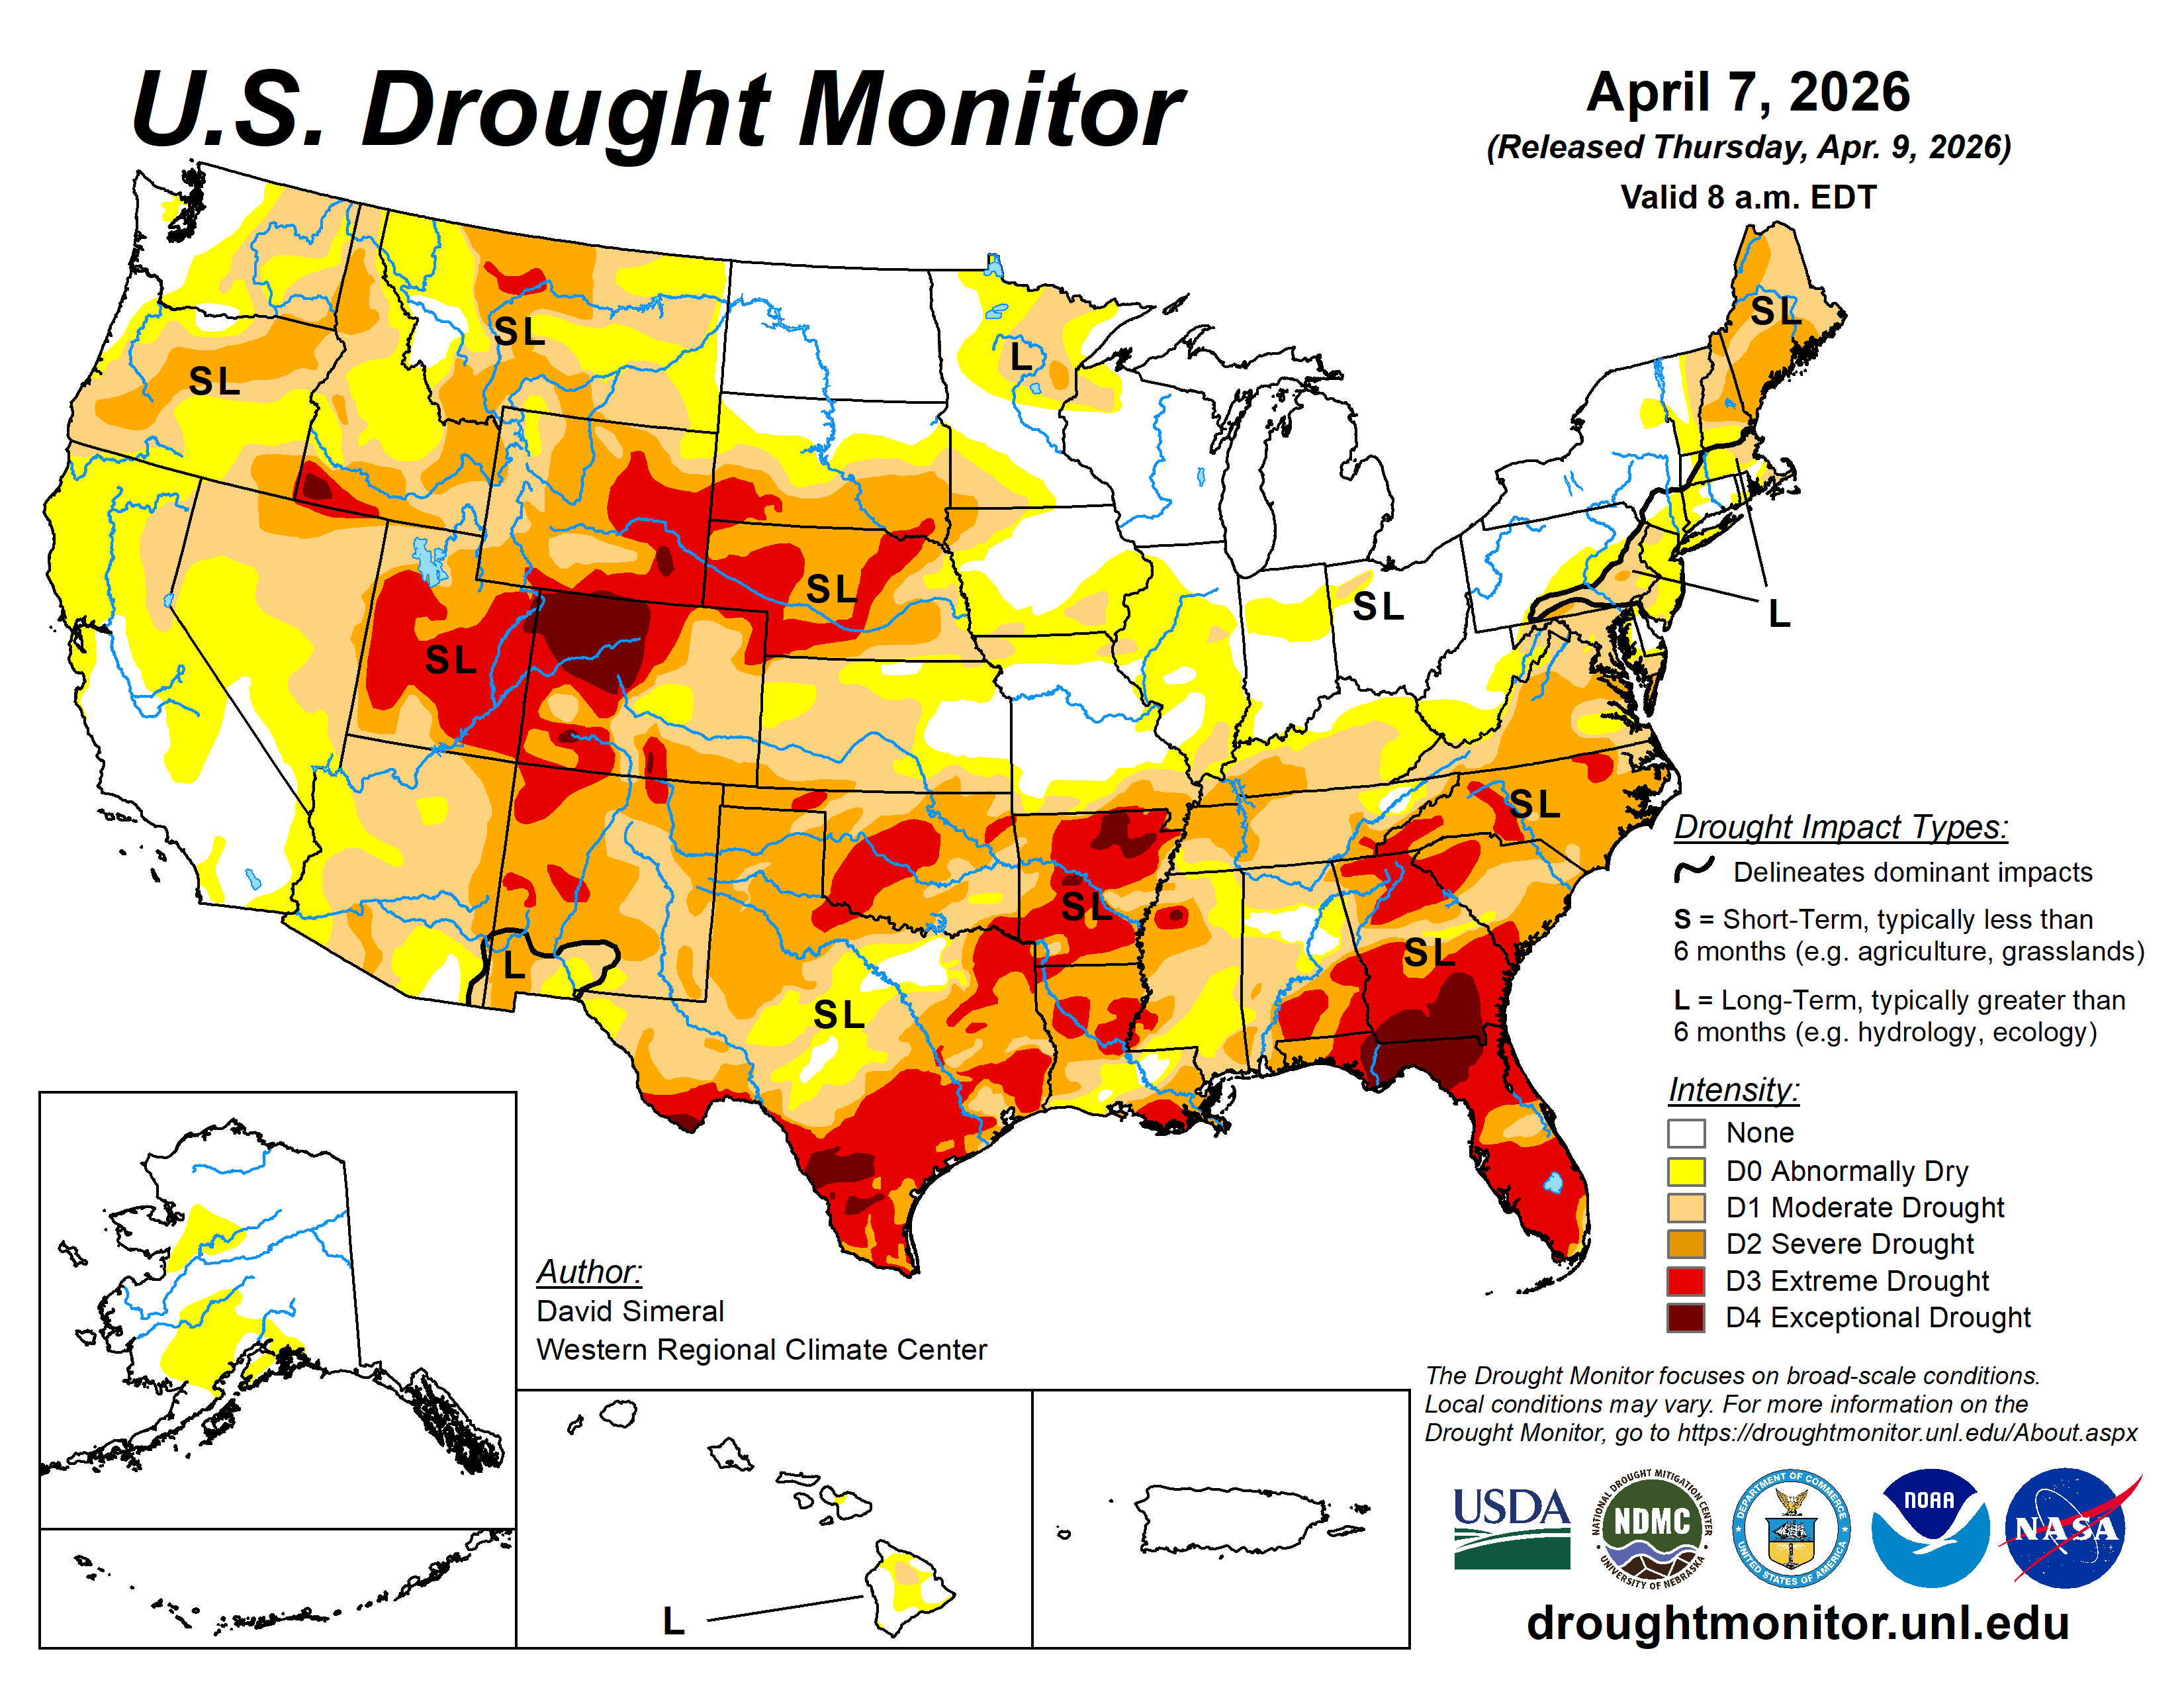
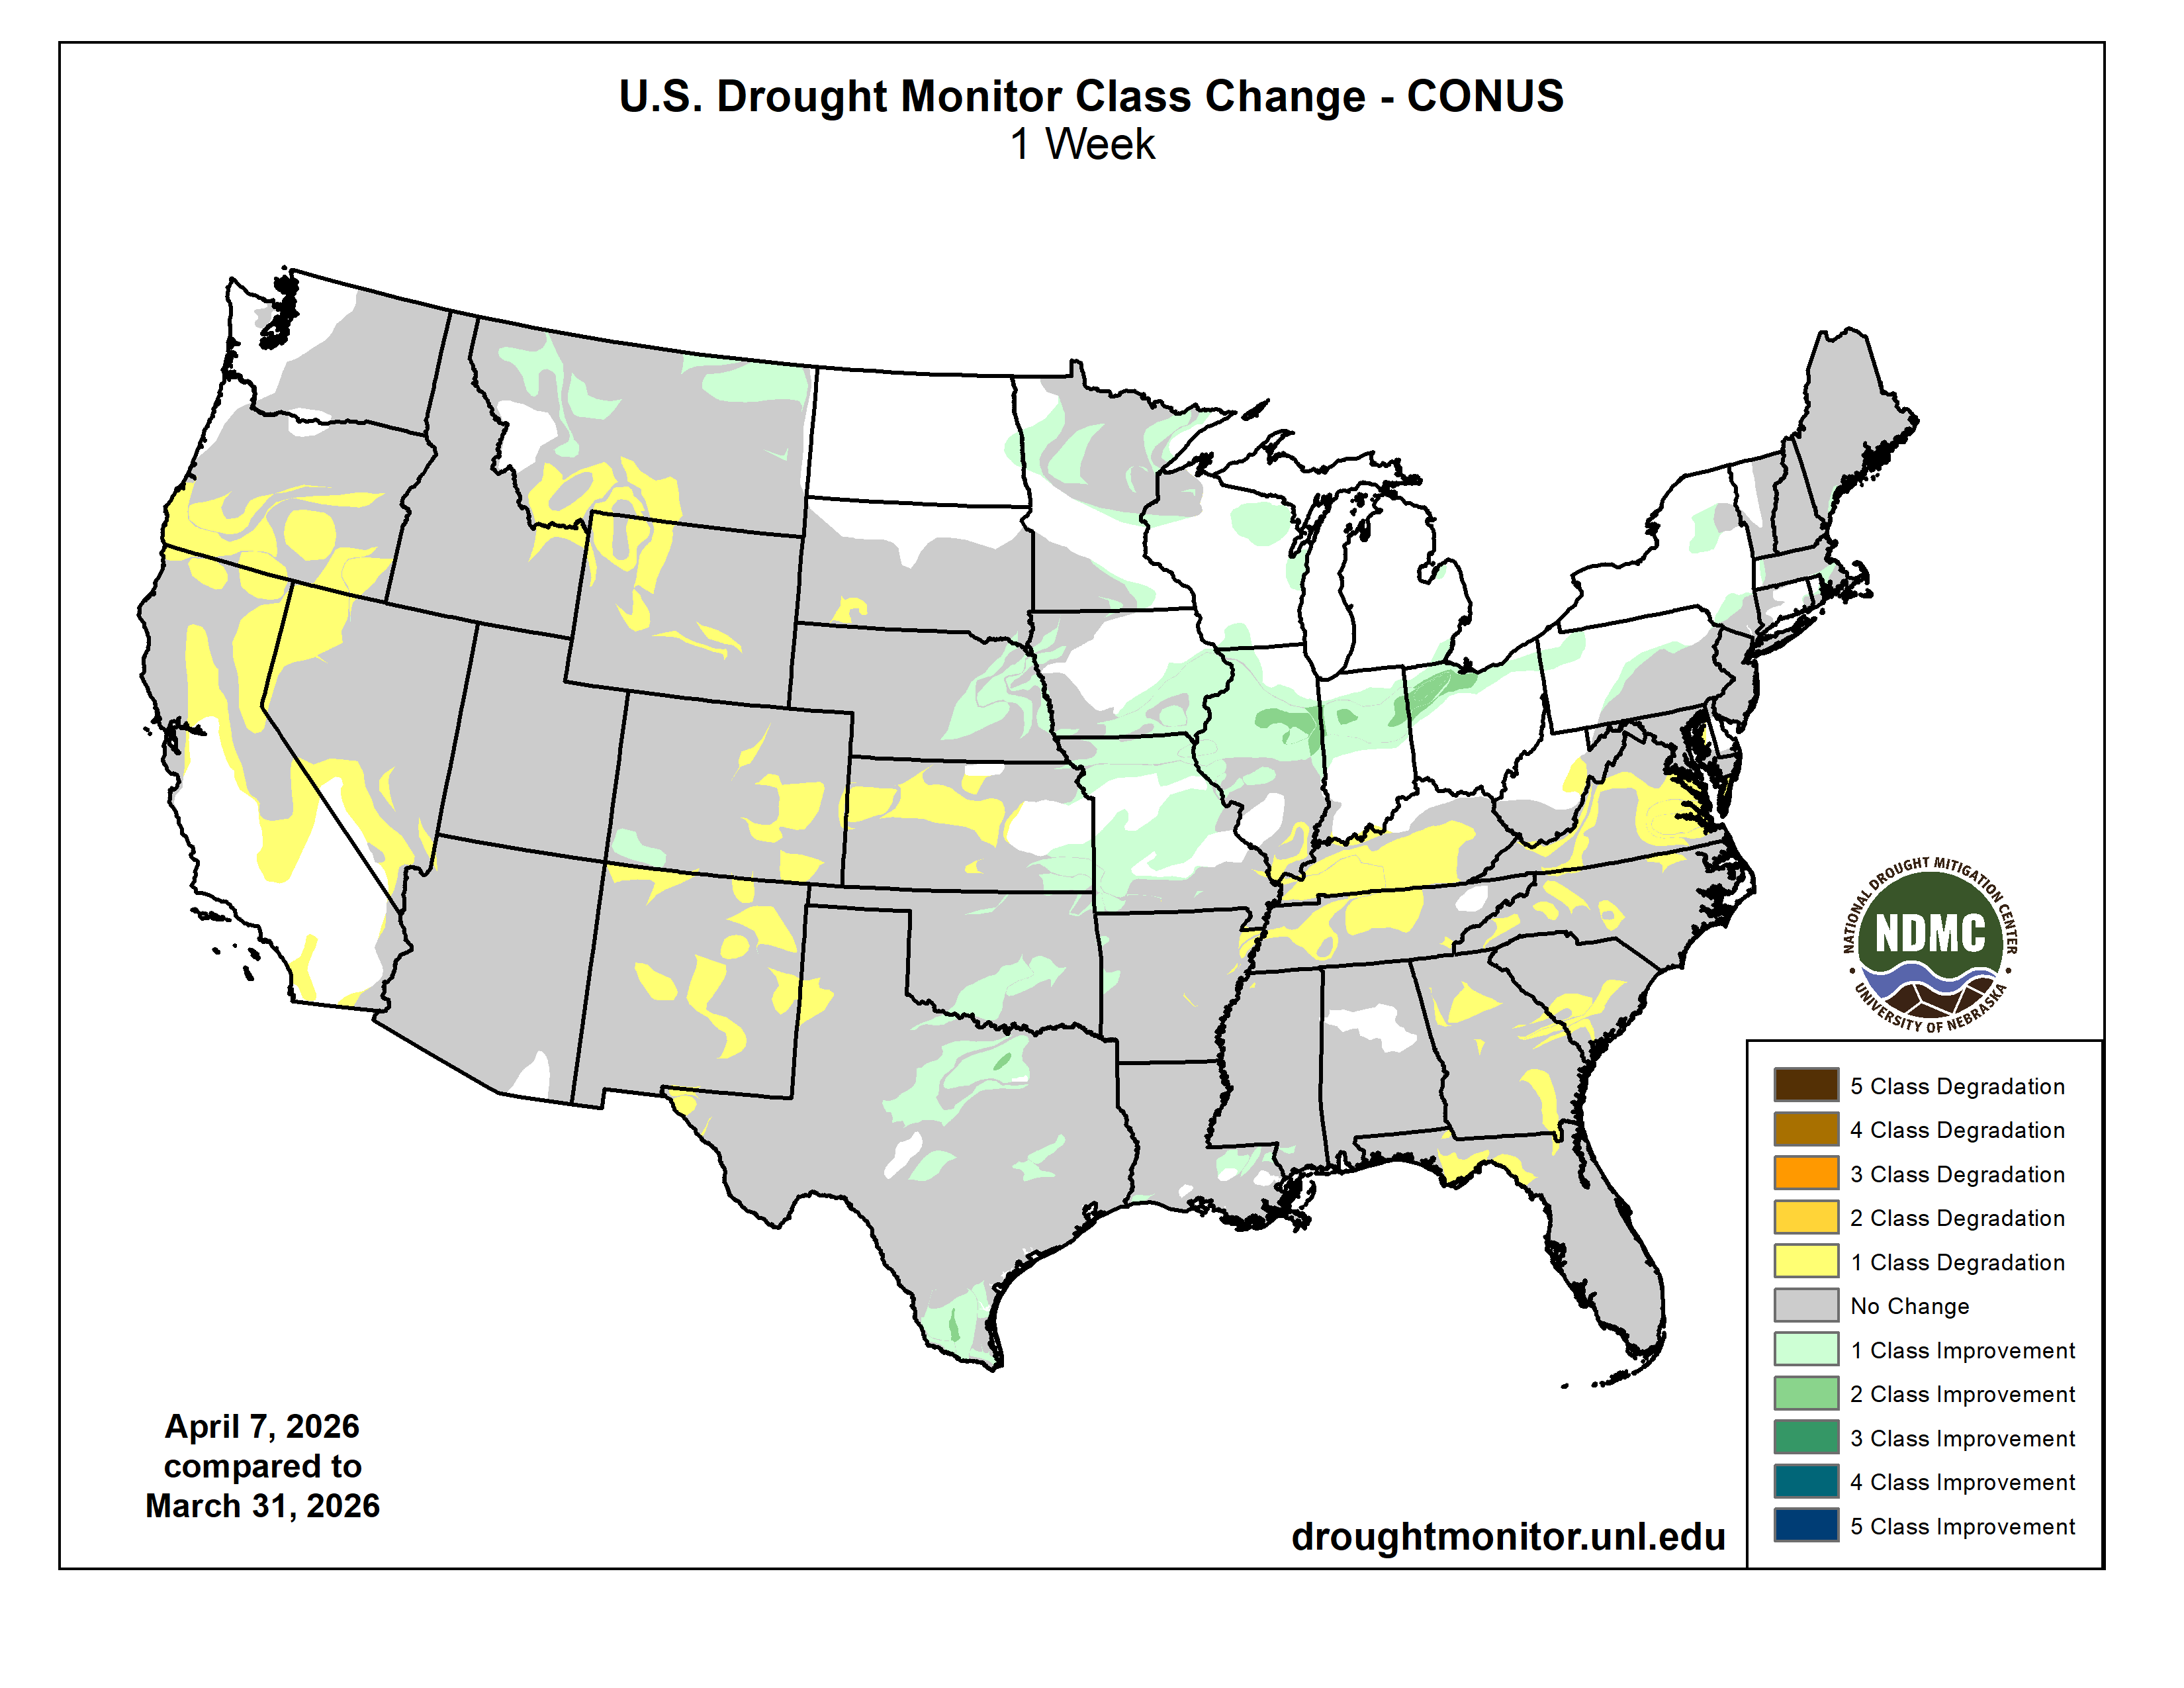
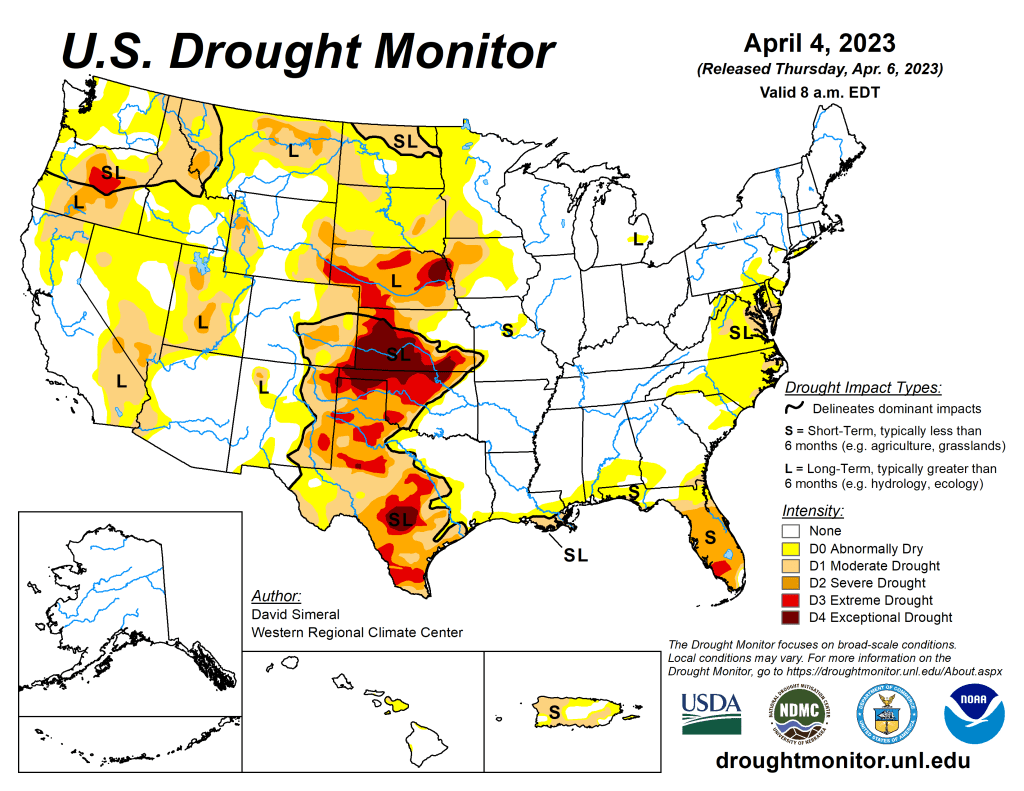
This U.S. Drought Monitor (USDM) week saw degradations across the areas of the West, Southeast, and Mid-Atlantic, while rainfall during the past week led to improvements in drought-affected areas of the South, Plains, and Midwest. In the Midwest, widespread improvements were made after another round of precipitation during the past week leading to removal of areas of drought on the map in Iowa, Missouri, Illinois, Indiana, and Ohio. In these areas, precipitation totals ranged from 2 to 5 inches. Similarly, significant rainfall was observed in portions of Texas, Oklahoma, and Louisiana leading to targeted improvements. Out West, generally dry conditions prevailed across much of the region, although modest precipitation totals were observed in areas of the Pacific Northwest, Northern California, Intermountain West, and Southwest with the highest totals logged in California. Despite the much-needed precipitation, conditions deteriorated on the map in Oregon, California, Nevada, Wyoming, Montana, and New Mexico. In the Hawaiian Islands, conditions have improved significantly during the past two months due to historic rainfall events observed across the island chain. Elsewhere, dry conditions continued across much of the Southeast and Mid-Atlantic, leading to degradation in conditions from Virginia to Florida.
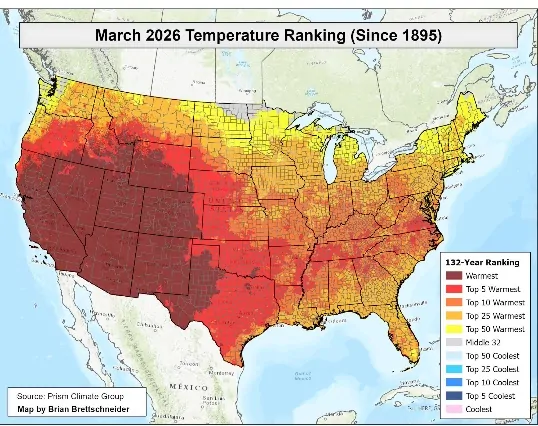
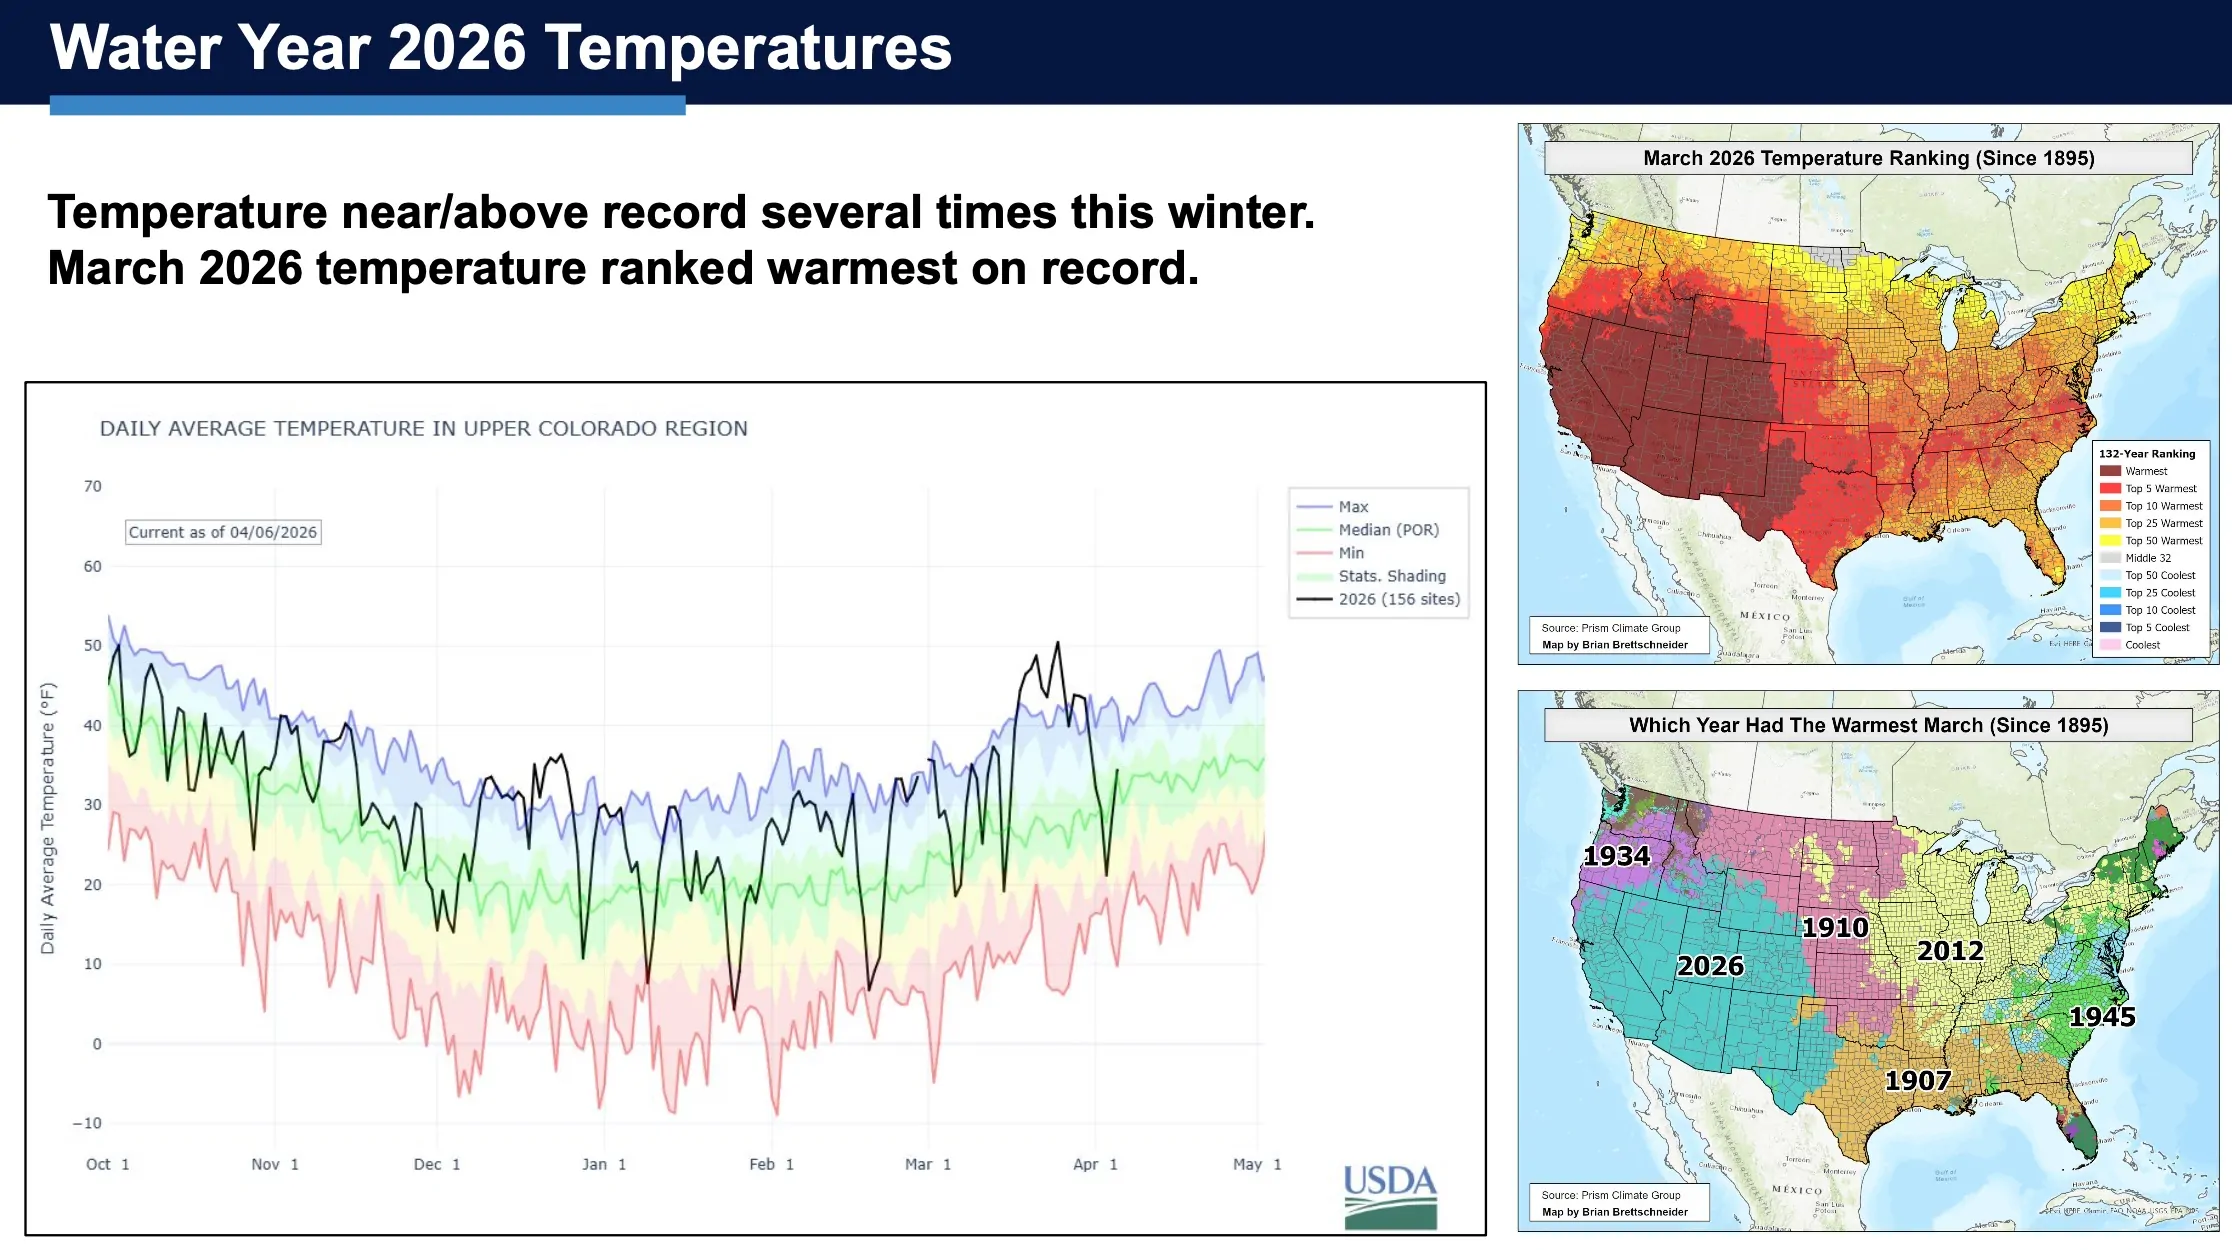
According to the latest U.S. temperature and precipitation analysis by NOAA’s Center for Environmental Information, March 2026 was the warmest March on record for the contiguous U.S. (CONUS) with average temperatures reaching 9.4 °F above the 20th-century average. For the month, 1,432 counties observed their single warmest March day on record (1950-present). Moreover, the April 2025 to March 2026 period was the warmest 12-month span recorded for CONUS since 1895. In terms of precipitation, the January to March period was the driest on record for CONUS, breaking the previous record set in 1910…
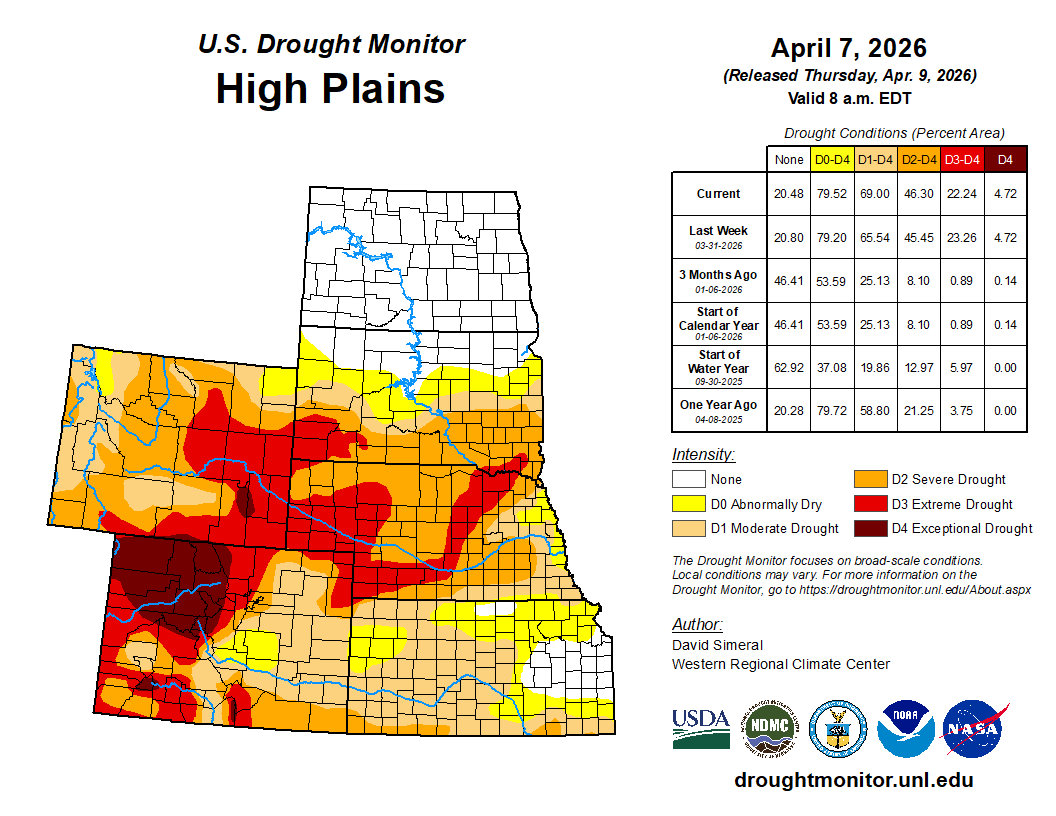
On this week’s map, rainfall (1 to 4 inches) during the past week led to targeted improvements in far eastern portions of Kansas and Nebraska. Meanwhile, conditions deteriorated on the map in areas of central and western Kansas, and southwestern South Dakota. For the week, average temperatures were 4 to 10+ °F below normal across much of the region with the greatest departures observed in the Dakotas. Looking at climatological rankings for the past 60-day period (March 7 to April 7), several locations ranked among their driest on record, including Dodge City, KS (driest on record; -1.51 inches); Goodland, KS (driest on record; -1.05); and Manhattan, KS (2nd driest; -1.81 inches). In terms of hydrologic conditions, the U.S. Geological Survey is reporting below to much below normal streamflows across southwestern South Dakota, southern Nebraska, and central/western Kansas…
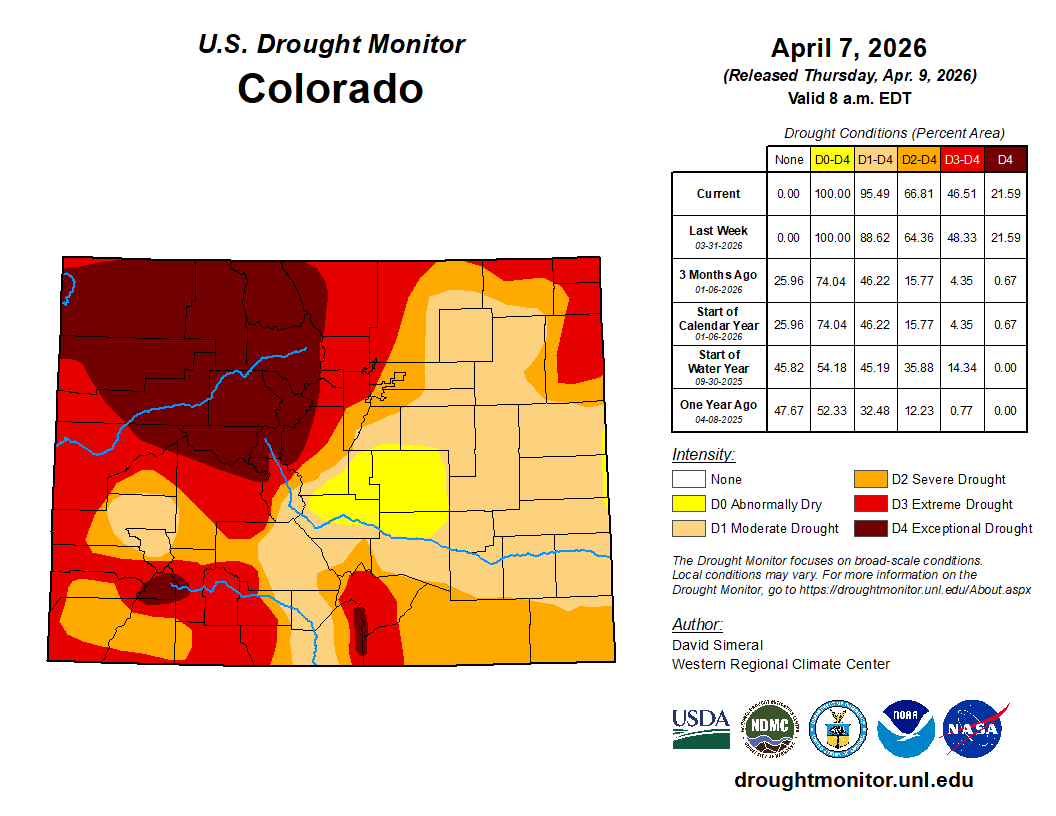
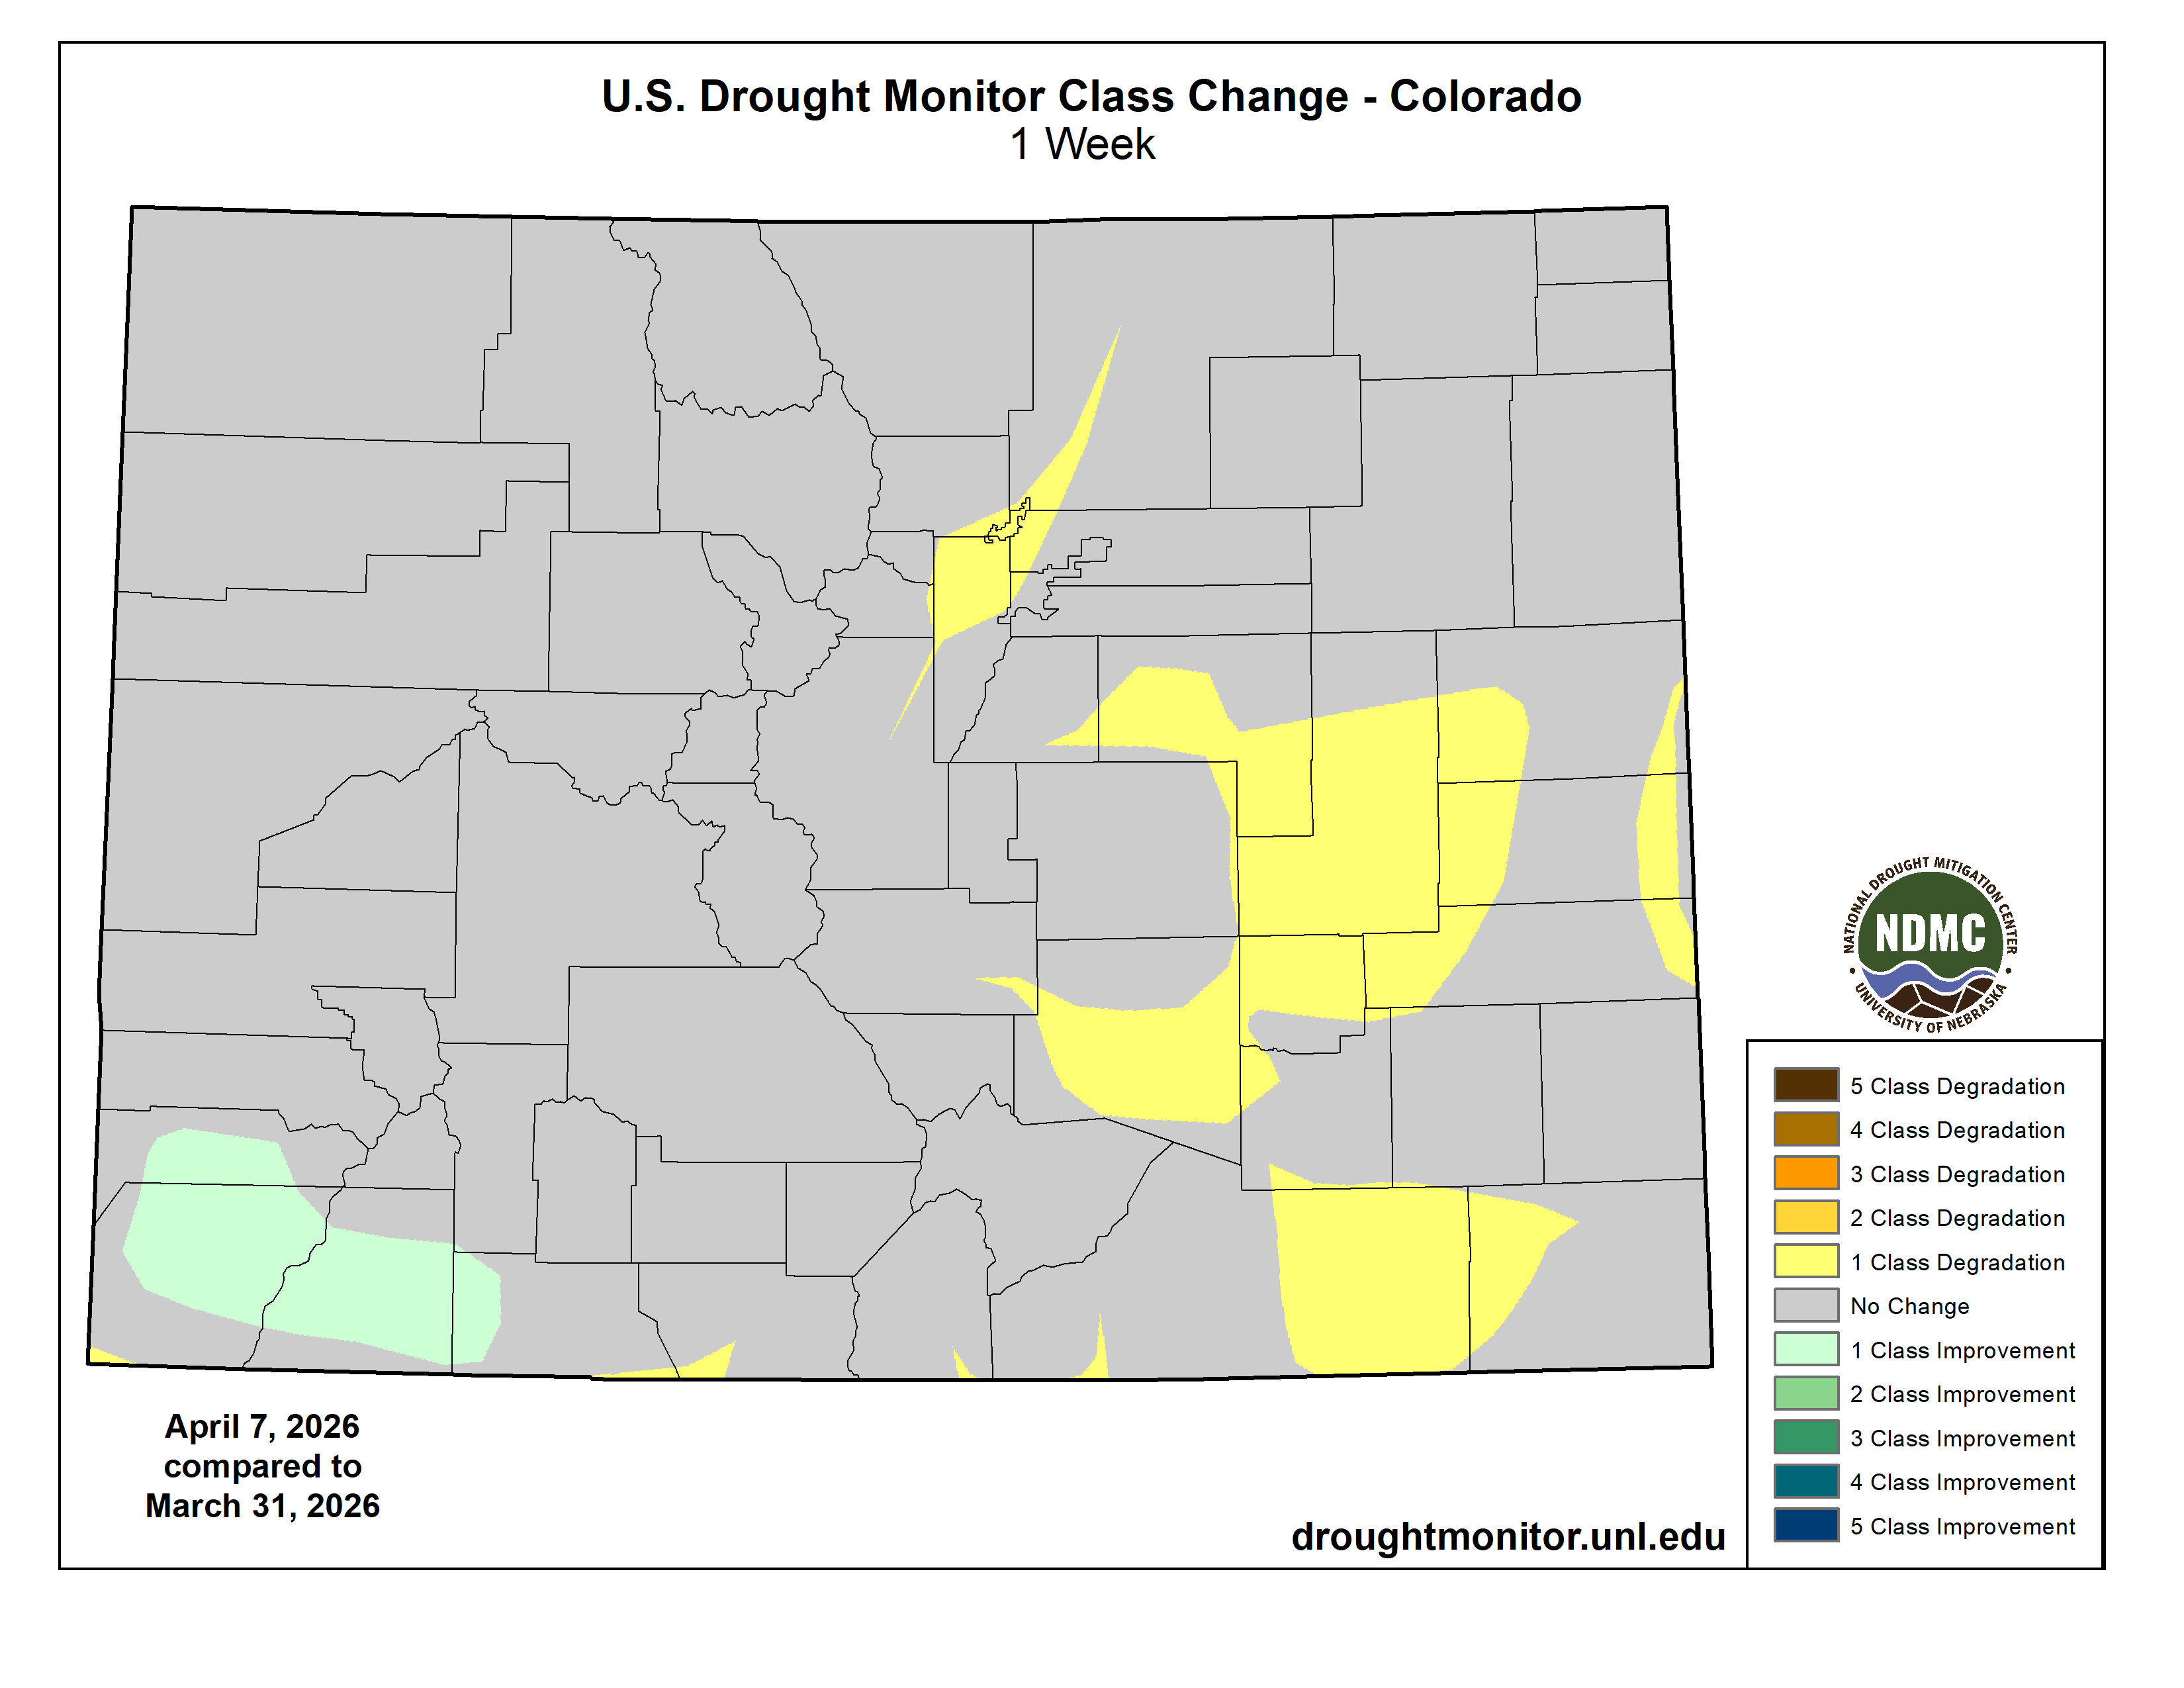
Colorado Drought Monitor one week change map ending April 7, 2026.
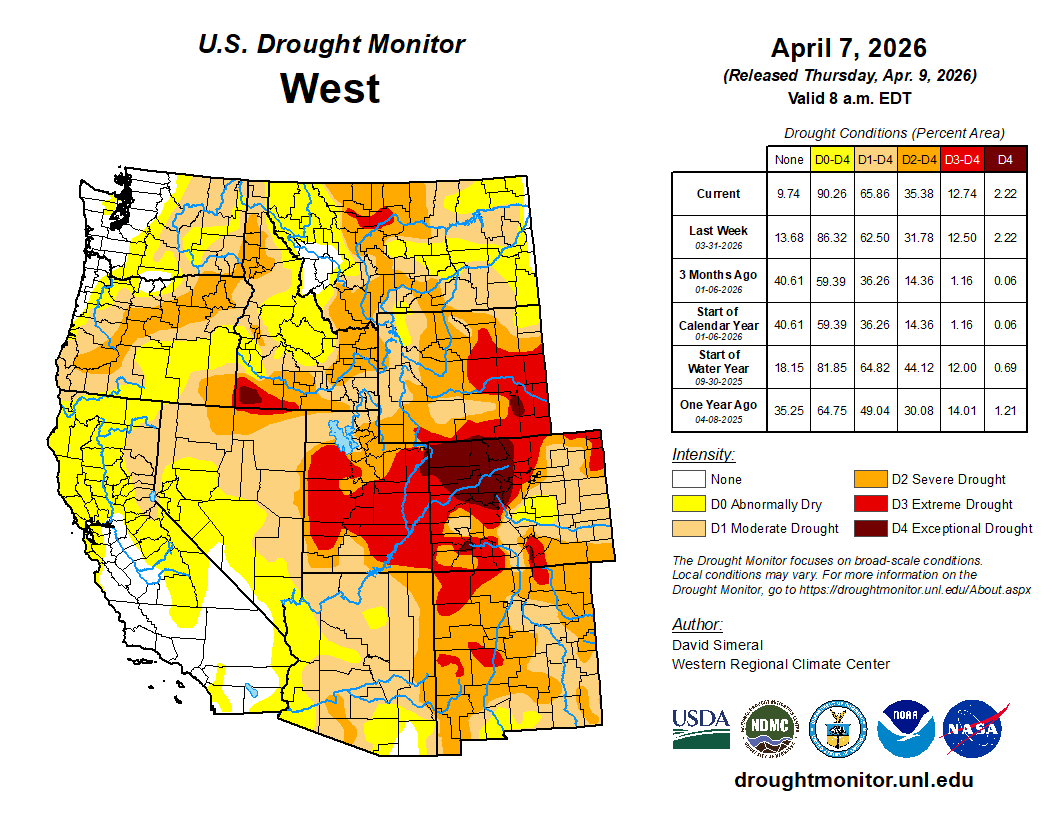
Conditions continued to deteriorate in the region with degradations made across southern Oregon, Northern California, southwestern Montana, northwestern Wyoming, and New Mexico. Despite some precipitation falling across the mountain ranges of the region this week, the snowpack conditions remain extremely poor with the remaining snowpack primarily restricted to the highest elevations. In Colorado, NRCS is reporting statewide SWE at the lowest on record. Historically, median peak SWE in Colorado occurs on April 8, however, this year peak SWE occurred on March 8. In Washington state, the Department of Ecology issued a statewide emergency drought declaration as projected water supplies are expected to be well below normal levels. In the Colorado River Basin, Lake Powell is 24% full, while Lake Mead is 33% full, according to the U.S. Bureau of Reclamation. Across areas of the Far West, very dry conditions were observed during the past 30-day period (March 7 to April 7), with record to near-record dryness at the following locations: Eugene, OR (10th driest; -2.57 inches); Medford, OR (9th driest; -1.38 inches); Crescent City, CA (2nd driest; -5.58 inches); Mount Shasta, CA (driest on record; -5.35 inches); San Francisco, CA (5th driest; -2.34 inches); Santa Cruz (driest on record; -3.13 inches); Monterey, CA (3rd driest; -2.8 inches), and San Diego, CA (driest on record; -1.24 inches)…
On this week’s map, improvements were made in drought-affected areas of Texas, Oklahoma, Louisiana, and Arkansas, while areas of Tennessee saw degradations. In terms of precipitation during the past week, moderate to heavy rainfall accumulations (ranging from 3 to 6 inches) were observed in Texas, Oklahoma, and isolated areas of Louisiana. In Arkansas, some beneficial rains fell in the far-western portion of the state, which led to a boost in streamflow conditions. However, dry soils and significant precipitation deficits remain across the state with the NDMC CMOR tool showing many new impact reports during the past week. Looking at climatological rankings for the past 60-day period (February 7 to April 7), record to near-record dryness was observed in the region, including in Monticello, AR (4th driest; -5.7 inches), and Monroe, LA (7th driest; -6.69 inches). In Texas, Water for Texas (April 7) reports statewide reservoirs at 74% full, with eastern reservoirs in good condition while many western and southern reservoirs remain below normal. Average temperatures for the week were above normal across the region (2 to 12+ °F)…
Looking Ahead
The NWS Weather Prediction Center 7-Day Quantitative Precipitation Forecast calls for precipitation accumulations generally ranging from 1 to 4 inches across eastern portions of the Southern Plains, Midwest, and Northeast, with the heaviest totals (locally 3 to 4 inches) along a corridor extending from eastern Oklahoma and Arkansas through the Mid-Mississippi Valley into eastern portions of the Upper Midwest. Across the Southeast and Mid-Atlantic, very dry conditions are expected, with little or no precipitation across most areas. The highest totals in the region are expected in isolated areas of eastern Florida, where accumulations may reach 2 to 3 inches. Across the High Plains, light-to-moderate precipitation accumulations ranging from 0.25 to 1.5 inches are expected, with the greatest totals across the eastern extent of the region. In the West, moderate-to-heavy liquid precipitation accumulations are expected across areas of California, particularly along the central and northern Sierra Nevada and coastal ranges, as well as portions of the central and northern Rockies, with lighter to moderate totals across portions of the Pacific Northwest. Dry conditions are expected to prevail across much of the Southwest, including areas of the southeastern California deserts, southern Nevada, Arizona, and New Mexico.
The NWS 6–10-Day Temperature Outlook (valid April 14–18, 2026) calls for above-normal temperatures across nearly all of the contiguous U.S., with the highest probabilities across the eastern half of the country, including the Midwest, Southeast, Mid-Atlantic, and Northeast. Below-normal temperatures are limited to areas along the broader U.S.–Canada border region in the Northern Plains and Upper Midwest, while near-normal temperatures are expected across parts of the Pacific Northwest.
In terms of precipitation, the 6–10-Day Outlook calls for above-normal precipitation across the Far West, northern Rockies, New Mexico, Texas, the South (eastern extent), portions of the central and southern Plains, Midwest, and Northeast. Near-normal precipitation is expected across the Intermountain West, Desert Southwest, areas of the South, Mid-Atlantic, and coastal New England. Below-normal precipitation is favored across the Southeast and portions of the Mid-Atlantic.
US Drought Monitor one week change map ending April 7, 2026.
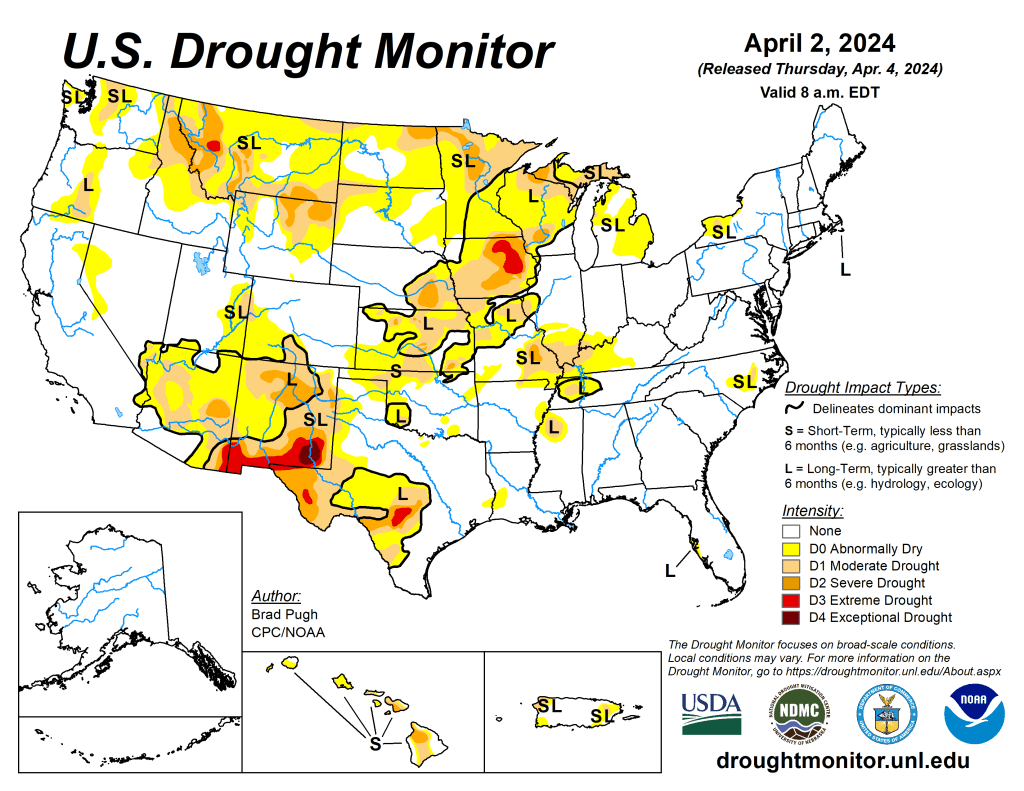
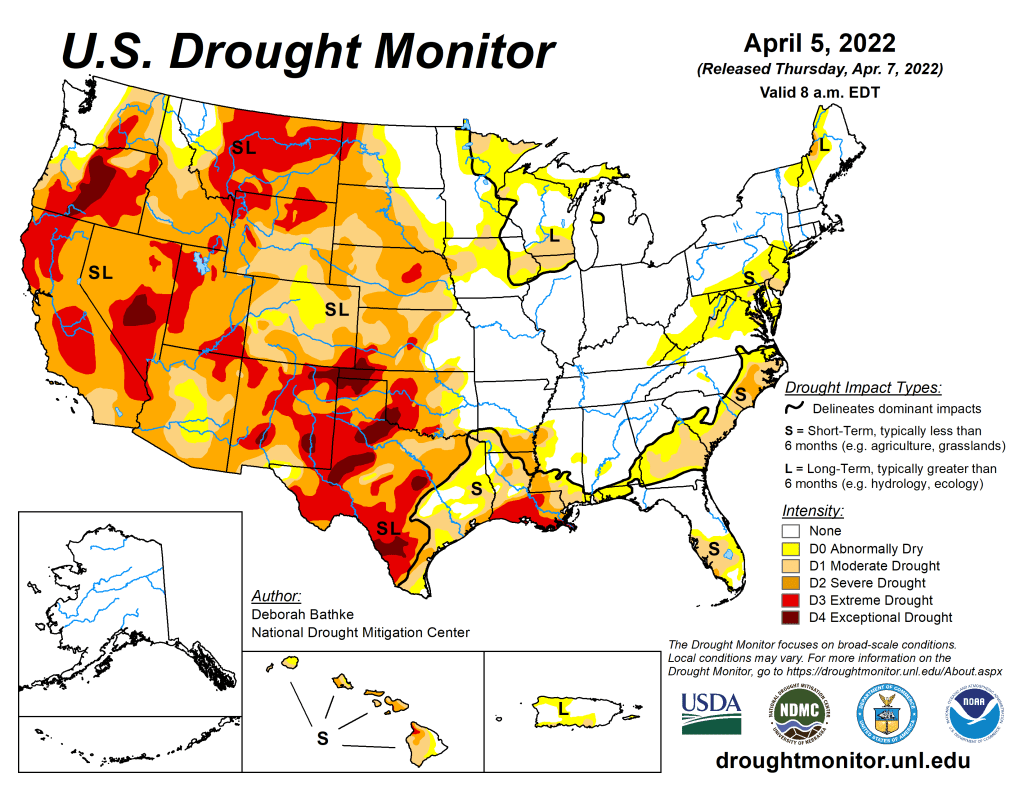
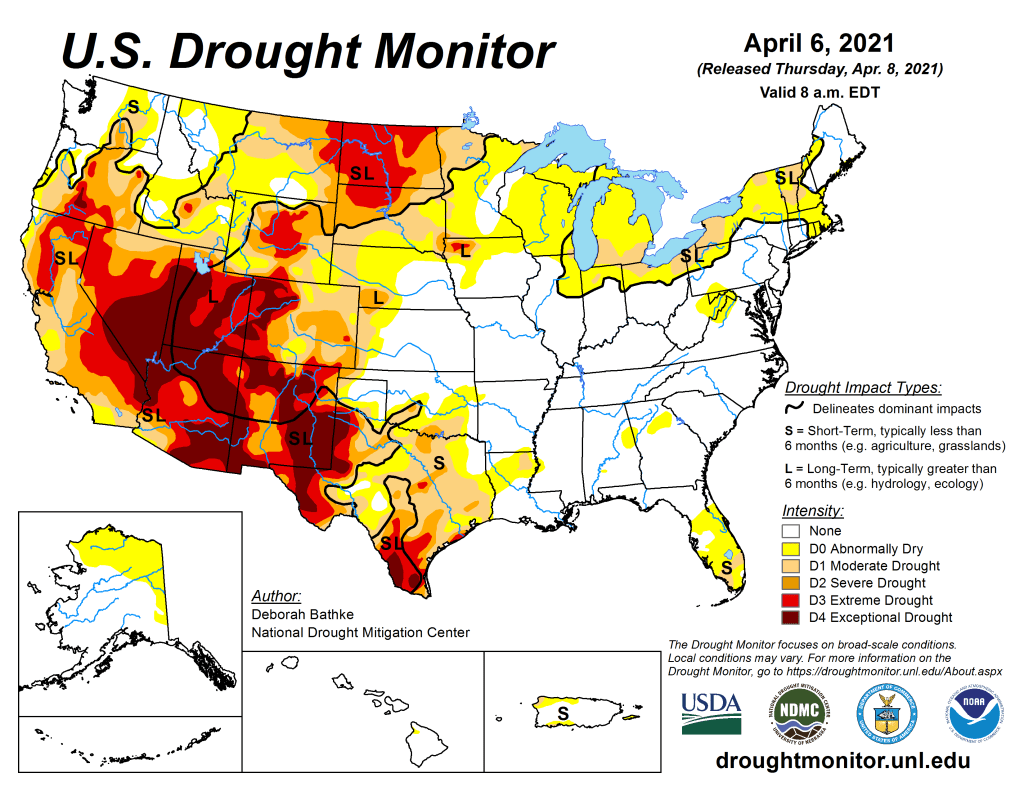
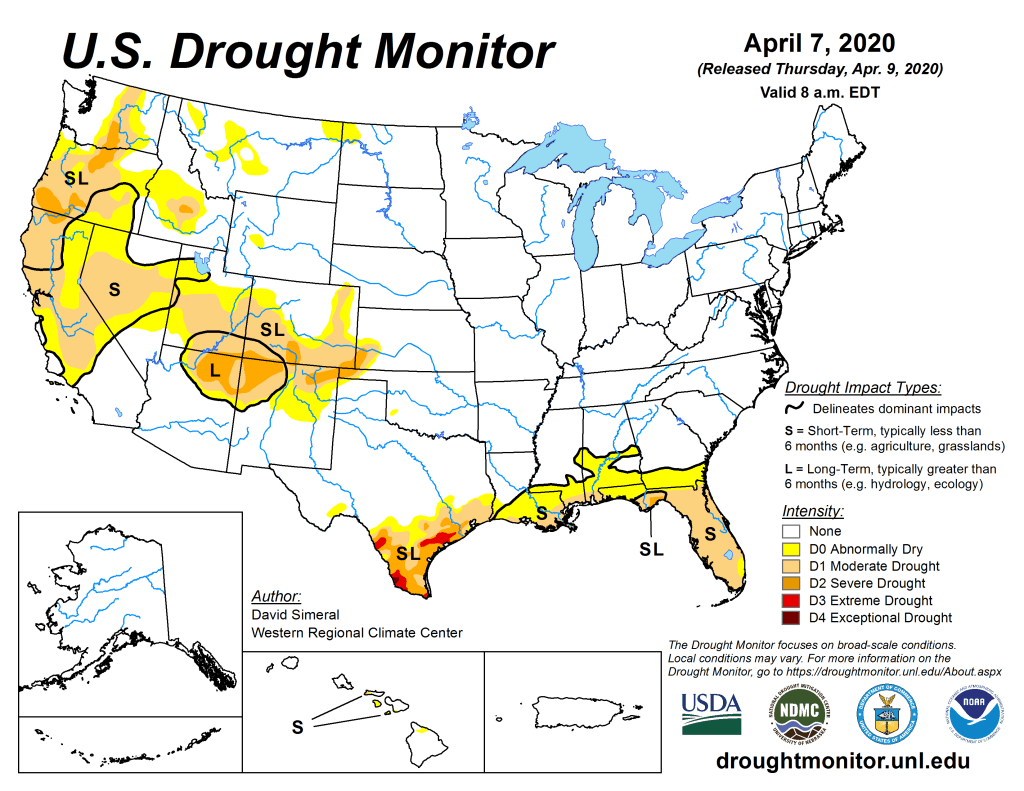
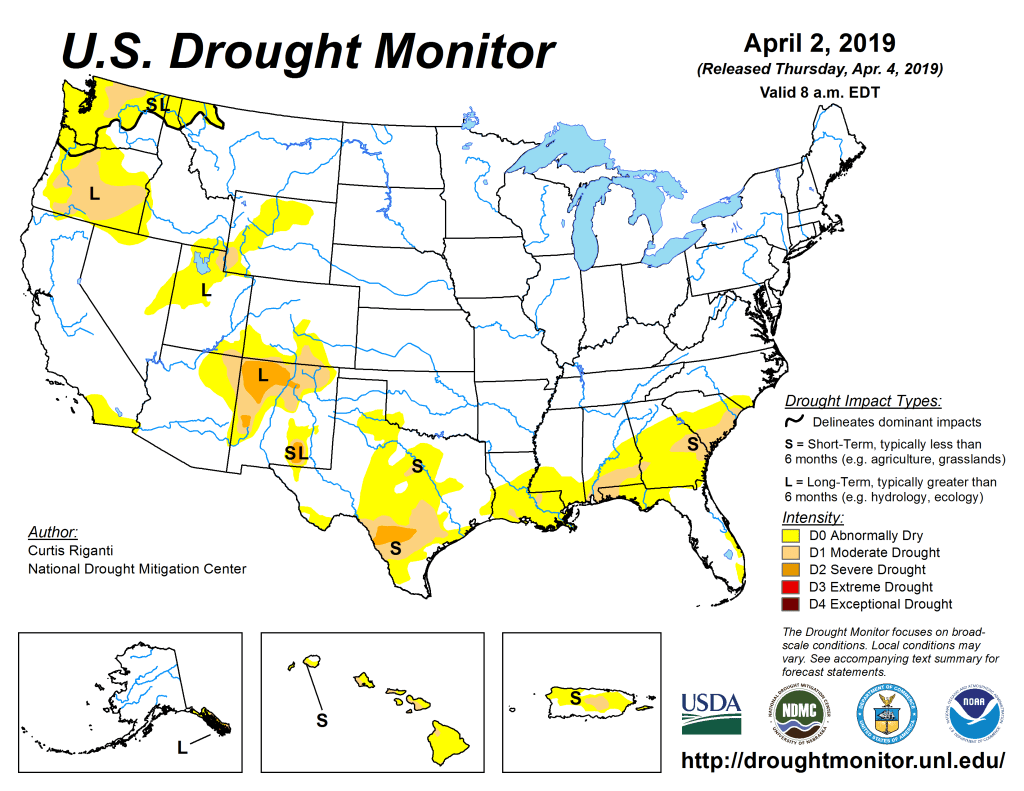
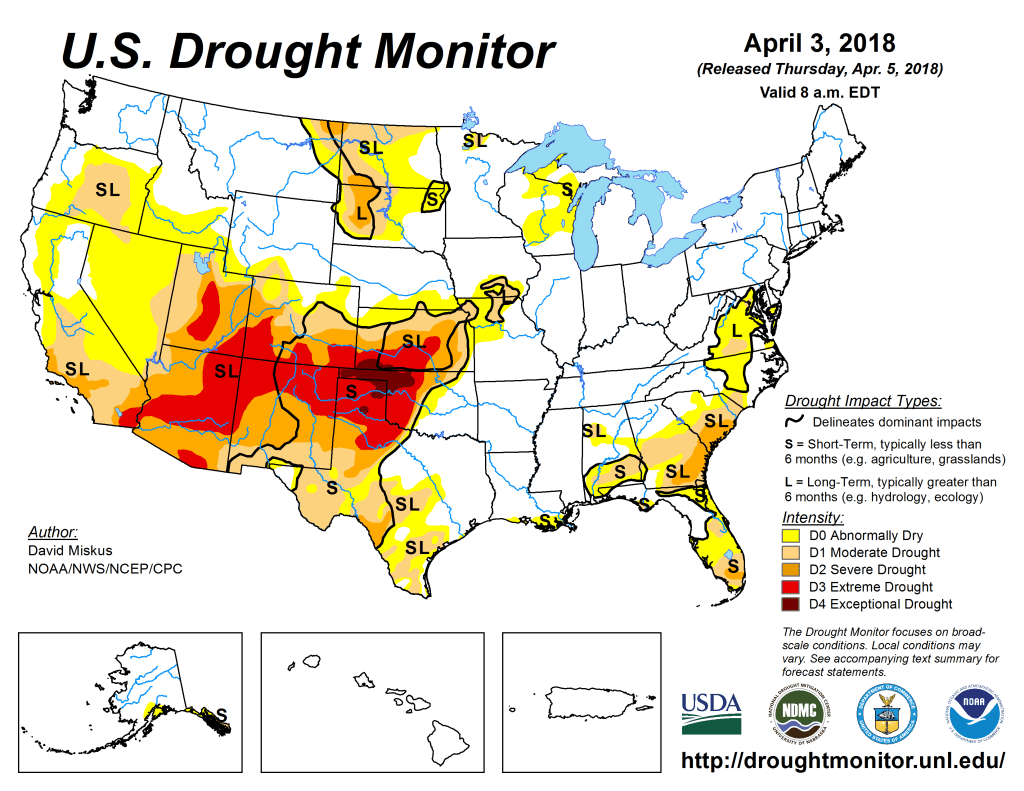
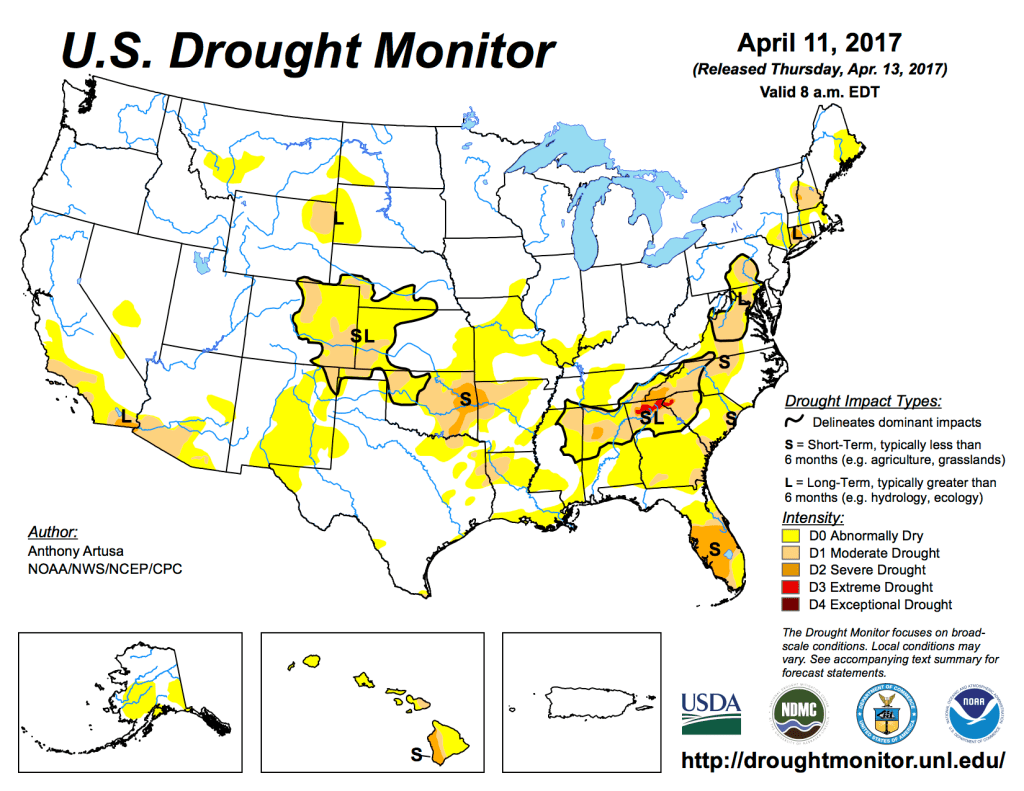
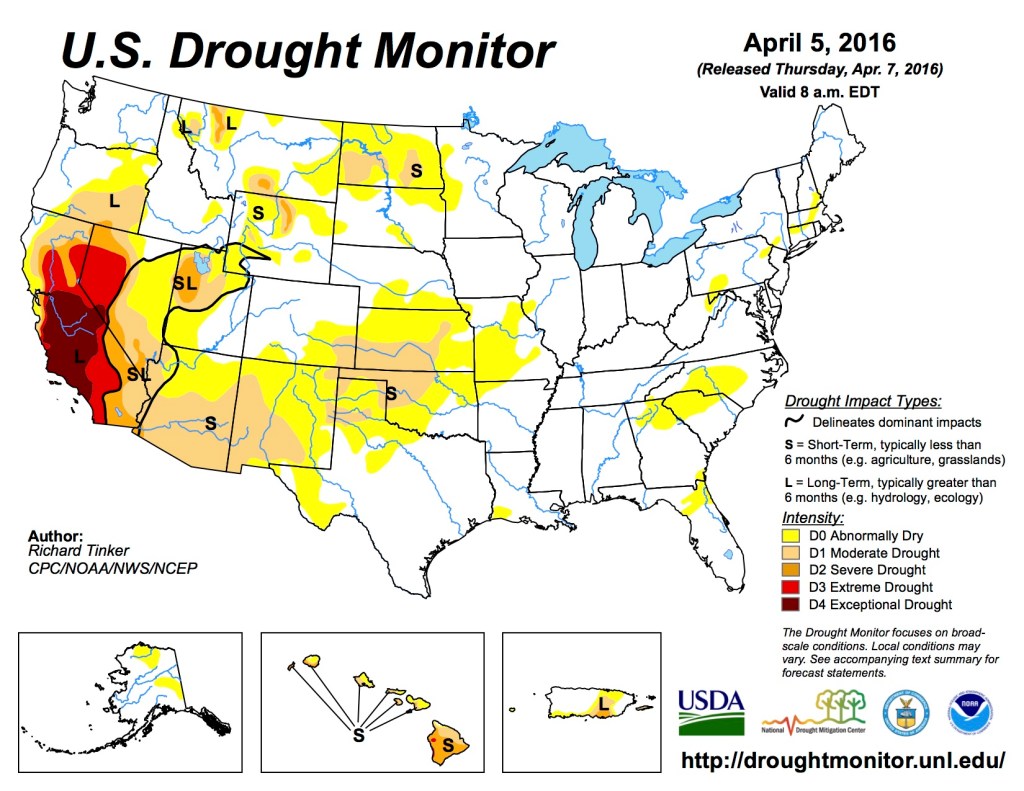
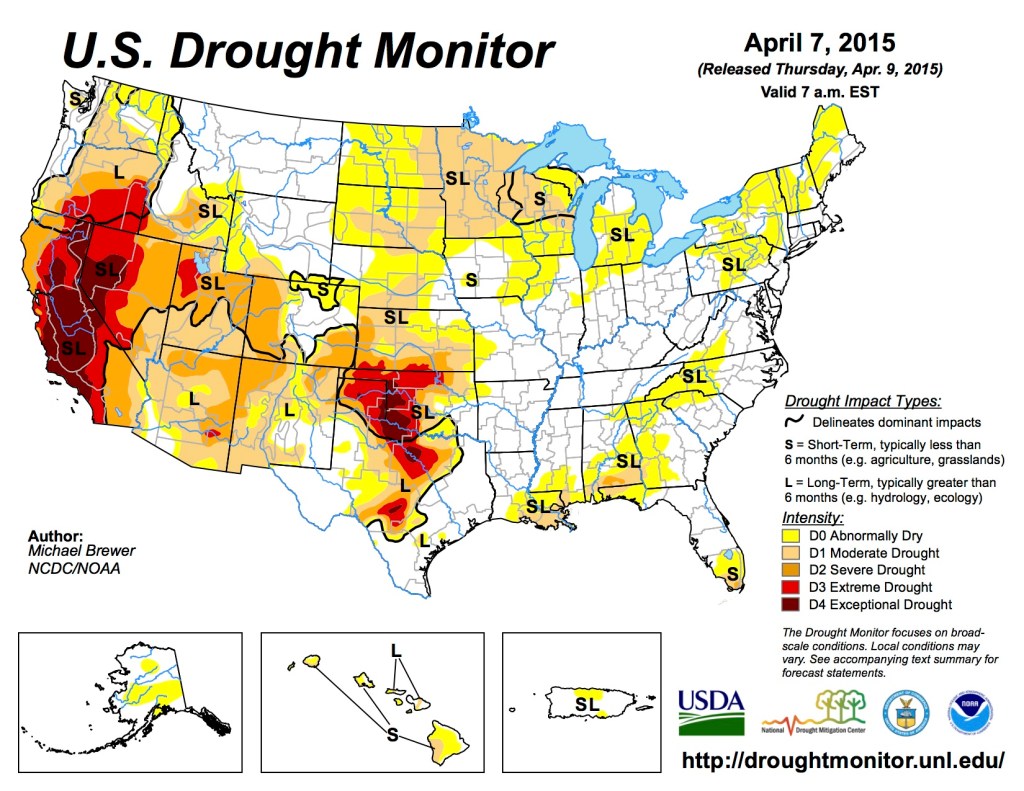
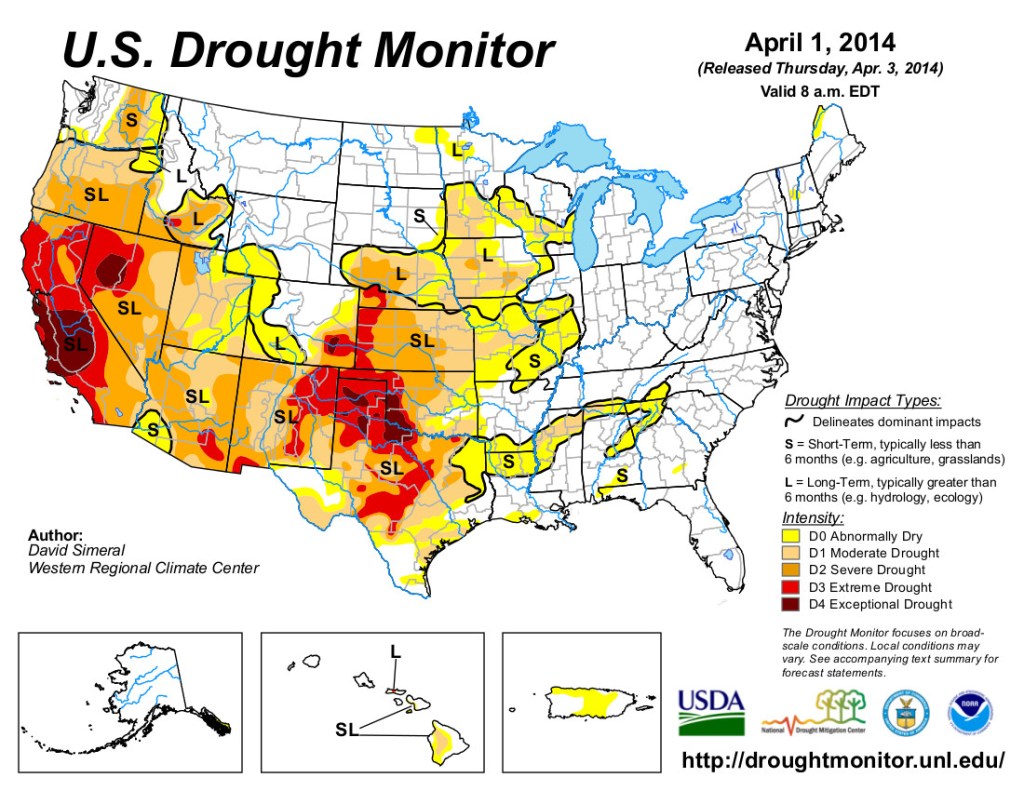
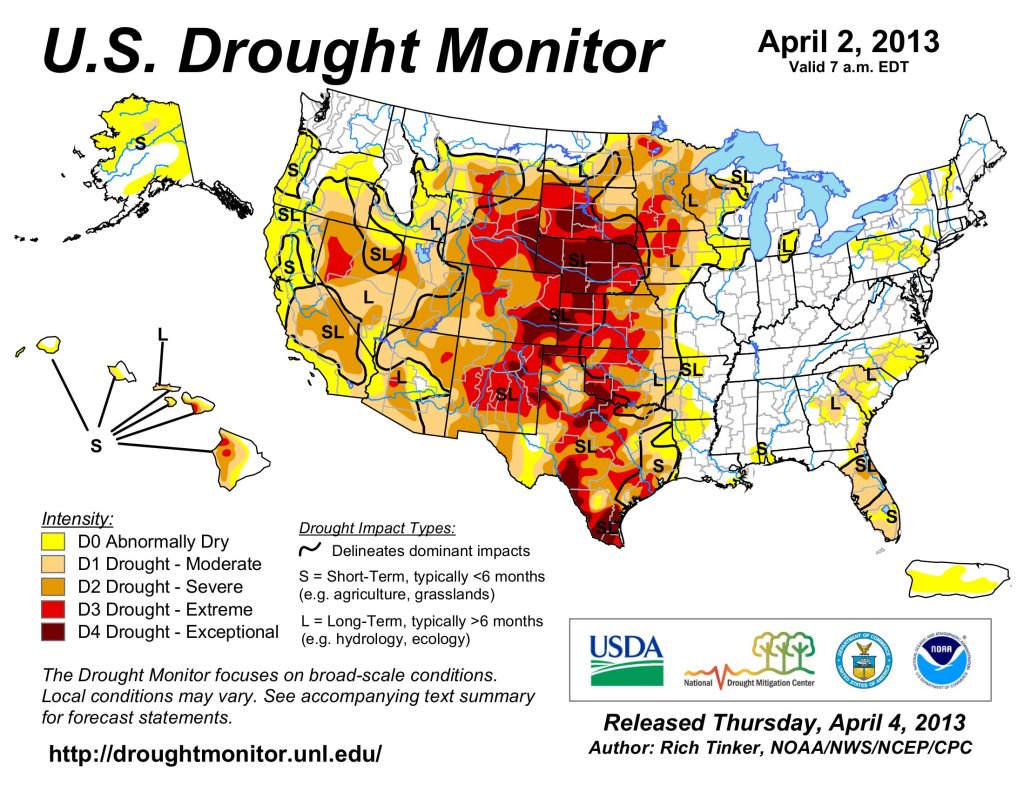
Just for grins here’s a slideshow of early April US Drought Monitor maps for the past few years.
UPDATE: March brings spring flowers and an update from NCEI’s Monthly U.S. Temperature and Precipitation Analysis. 🥵 This was the warmest March on record for the contiguous U.S. Learn more. https://t.co/mlvPCKiXmnpic.twitter.com/uepJiBzOZY
Click the link to read the article on the Big Pivots website (Allen Best):
April 8, 2026
Will inflows into Lake Powell will drop below those of 2002? You remember that year? A year of heat, drought and fire. An essay about changes and what precipitates them.
Just what we need in Colorado, an El Niño that could cause a hotter-than-average summer for the Western United States and other parts of the globe, continuing into 2027.
Risk of an El Ninõ has been rising, reported the Washington Post on Monday citing the work of a medium-range weather forecasting organization. This one could push global temperatures to record levels, particularly in 2027. “Real potential for the strongest El Ninõ event in 140 years,” wrote Paul Rondy, a professor of atmospheric science at the State University of New York at Albany.
This, explained the Post, could also yield milder winter temperatures in the United States.
We already know something about warm winters. November was the third warmest November on record in Colorado. December and February broke records, as Colorado state climatologist Russ Schumacher has reported.
Then came March and a records-busting string of days during the “heat dome.” Fort Collins went over 90, a threshold not achieved on average until June. These hottest and earliest thresholds were breached at locations across Colorado.
Across the Colorado River Basin, average daily temperatures during March were the warmest on record. This wreaked havoc on an already so-so or less snowpack.
“March was not … helpful,” consulting climate researcher Jeff Lukas observed drily in a LinkedIn post on Monday. “Record heat for the Upper Colorado River Basin and near-record-low precipitation in what should be one of the snowiest months. The basin-wide snowpack peaked at the earliest date and lowest level on record.”
In Colorado, the snowpack in the Eagle River drainage on April 1 was 21% of the 30-year average. The Roaring Fork River was 26%. On the Yampa it was 20%. On the San Juan, it was 17%. In all these cases and others, the snowpack had fallen by half or more compared to March 1.
Lake Powell, already shrunken to 24% to 25% of capacity, will almost assuredly show even more shoreline. As of Tuesday the reservoir level was down almost 31 feet from a year ago. The Colorado River Basin Forecasting Center on Tuesday predicted 22% of average flows into Powell. Rain and snow could still help, but at least in the next 10 days, they are unlikely.
Two benchmarks, 1977 and 2002, exist for awful-flow years on the Colorado River since Glen Canyon Dam was completed in the 1960s. In 2002, flows into Powell were shockingly low, about 25% of average. The decline after two so-so years was remarkable. Powell, however, had been 94% full to start the century.
Margins have narrowed. Becky Bolinger, a climate researcher in Colorado, pointed out Monday on LinkedIn that the Colorado River Basin Forecast Center currently projects flows April-through-July flows will be a little greater than 2002. “I think it is entirely plausible that the actual volume for 2026 comes in as a new record low,” she wrote.
What will the Bureau of Reclamation do? It operates the big dams on the Colorado River, including Glen Canyon. Average releases from Glen Canyon Dam since 2000 have been 8.29 million acre-feet.
One Colorado hydrologist, once again writing on LinkedIn, speculated that the Bureau will reduce the releases from Powell to 6 million acre-feet and conceivably even lower. That would leave Powell above the minimum level needed to produce power, if barely. Power production from 2000 to 2023 declined 17%.
The value of clean power is great. It is part of the portfolio of nearly all electrical cooperatives in the region, including those in Colorado, as well as municipal providers. The greater value, say utility executives, is the ability of the dam’s hydro unit to restart the Western grid, if necessary. This is called a black start. Such a need is unlikely but huge if it were to occur. The giant amounts of battery storage, however, have reduced that importance in the last few years.
Those reduced flows from Powell, however, would likely annoy Arizona and California. The Colorado River Compact of 1922 split the water in the river system between the lower-basin states and Colorado and other upper-basin states. It put a figure on the division: 7.5 million acre-feet. (And more must flow from the upper basin for Mexico and to account for evaporation). In 1922, they thought there was plenty left for Mexico and more yet to flow into the Pacific Ocean. Wisely, in 1948, the upper basin states, in their compact amongst themselves, instead used a percentage.
In question is what exactly the 1922 compact says is the obligation of upper basin states? Must they allow all the water in the Eagle, Yampa and other headwaters rivers be allowed to flow downstream to deliver 7.5 million acre-feet? What if that much water isn’t there?
Colorado River Basin states have notoriously been at an impasse about how to share the shrinking river. The position of Colorado — and other upper-basin states — was pithily captured in a statement by Becky Mitchell, Colorado’s chief negotiator, “We’ve been asked to solve a problem we didn’t create with water we don’t have,” she has said.
“It’s plain: the precarious situation facing the Basin today was fueled by overuse in the Lower Basin,” wrote Nick Peters, the chief system planning and projects officer for Colorado Springs Utilities, in an op-ed published during March in Colorado Politics.
Peters argued against a short-term deal in response to the exigency of this year’s dramatic declines.
In late March, I saw Mitchell at an event in Fort Collins celebrating the 60th anniversary of the Colorado Water Center. “I follow you to Lamar. I follow you to Grand Junction. I follow you to Silverthorne. I follow you here to get an interview,” I said jokingly.
“You can follow me tomorrow to Durango to the basin roundtable there if you want,” she answered with a smile.
We spoke about the Colorado River, but not on the record.
Two days later, I saw that she had traveled to southwest Colorado while I likely still slumbered. There, she delivered enough fire and brimstone to bring the attendees gathered at the roundtable in Ignacio to their feet in a standing ovation, according to the Durango Herald.
In Fort Collins, the Colorado Water Center dinner had been arranged around tables. I had signed up to be at Jennifer Gimbel’s table. As a director of the Colorado Water Conservation Board, she had once represented Colorado in the Colorado River affairs. She is now senior policy scholar at the Water Institute.
“It’s my understanding they were hoping to get a deal for 20 to 30 years. Now they’re looking at five years,” she told me. “They really need to just look at this year.”
I asked her whether the negotiations have been as transparent as they should be. Some have said they are not. We can hear the talking points of Becky Mitchell and other negotiators, but we have not heard about their strategies.
Gimbel pointed me to the frequent appearances of Mitchell at the basin roundtables and other water forum. She’s constantly on the road.
Schlatter and Megdal traced the trajectory of prior agreements on the Colorado River, pointing to the role of federal leadership in forging agreement.
“In this round of negotiations, federal leadership has been lagging,” they write. ”The Department of the Interior has not made clear what the consequences might be for the states if they fail to agree. The U.S. Bureau of Reclamation has been without a permanent commissioner since President Donald Trump retook office in January 2025. And federal staff have only recently begun helping to facilitate the discussions.”
They also say this: “We believe that agreement between the seven states is still possible. It may be less effective to bring in a third-party facilitator at this stage in the negotiation process, though, because of the degraded trust, hardened positions and shortage of time.”
Earlier in the evening, a film had been shown that extolled the work of the water center. Colorado State University produced Elwood Mead, after whom the reservoir along the Arizona-Nevada border is named, and others. The current staff of the water center includes Brad Udall, who has deep roots at many levels in the Colorado River Basin
Udall said something that captivated me, in part because it improved upon my own thoughts. I had been toying with an essay that laid out how Colorado during the roughly first 130 years of its existence had been all about putting water to beneficial use. And the last roughly 35 years had been most prominently about reconciling its past with the new limits. I was thinking in part of groundwater mining but also the fact that there really is no water to be had on the surface. There’s less. We’ve hit the wall and it is moving.
In Udall’s thesis — which I learned from him later he has delivered in several slide shows — the history of the Colorado River Basin can be seen in three phases. The 19th century water law meets 20th century infrastructure now colliding with 21st century population and climate change.
And 2026 seems to be a seminal year in that journey. We already have had heat records tumbling left and right, with an El Nino likely to deliver more. We quite possibly will see a record for low inflow into Lake Powell, undercutting 2002.
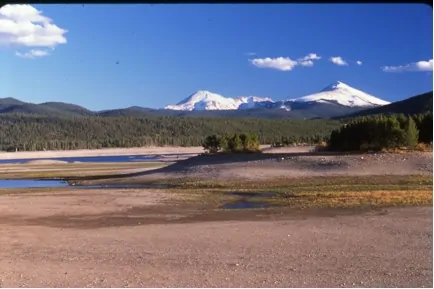
Dillon Reservoir in 2002. Photo credit: Allen Best/Big Pivots
I remember June 2002 quite well. On that month’s first Sunday I stood atop a mountain in Colorado and saw smoke from the Hayman Fire, which soon became the biggest fire in Colorado history (it’s now ranked 4th) as well as fire from the Coal Seam Fire near Glenwood Springs. More came later. It was a smoky summer in Colorado.
A few weeks ago, I heard former Gov. Bill Ritter and Bryan Hannegan, the CEO of Holy Cross Energy, fret about the risk of wildfire. The drought, said Ritter, “puts us in a very, very difficult and delicate position.”
State officials, meanwhile, are gearing up to address Front Range forests vulnerable to bark beetles. And at the Public Utilities Commission, Chairman Eric Blank has been openly worrying about whether Colorado will have enough electricity this summer to meet demand if we have unusually hot weather.
Changes mostly occur in increments, but there are times that changes take giant steps. “This year is going to teach us a lot,” said Nathan Coombs, manager of the Conejos Water Conservancy District in the San Luis Valley, when I saw him in Fort Collins. The district depends upon water storage in Platoro Reservoir, located in the San Juan Mountains. The normal inflow into the reservoir in late March, he said, was 12 to 15 cubic feet per second. “This morning, it was 195, because of the heat melting the snow.”
Two days later, at a forum in Alamosa, Coombs, a fourth-generation farmer, further explained the predicament. These earlier flows must be allowed to proceed downstream. Only later in the year will the reservoir be allowed to retain water. But will there be any?
Maybe we will get giant rain and snowstorms yet this spring. In the next 10 days, the forecast is for both wetter and warmer than normal. And, as Coombs and others pointed out, big rainstorms last October left the soil saturated.
October, of course, should bring snow, not rain, to higher elevations. We are living in different times, mostly warmer. Then there’s that elevated risk of an El Niño and a much, much warmer summer ahead of us and the winter beyond that.
Here are the typical outcomes from both El Niño and La Niña for the US. Note each El Niño and La Niña can present differently, these are just the average impacts. Graphic credit: NWS Salt Lake City office
Watering restrictions take effect on April 15. Courtesy of City of Arvada
Click the link to read the article on the Arvada Press website (Rylee Dunn). Here’s an excerpt:
April 7, 2026
After one of the driest winters on record in Colorado, the City of Arvada has declared a Stage 1 drought and will begin implementing mandatory watering restrictions on April 15. Starting April 15, all Arvada water customers — including residents, businesses and city-managed properties — will have to start following a mandatory two-day per week watering schedule. Outdoor watering is prohibited from 10 a.m. to 6 p.m. Amy Willhite, Arvada’s Water Resources Administrator, said the watering restrictions will help Arvada preserve its water supply amid rising temperatures and historically low snowpack levels.
“Maintaining a reliable water supply is a public health and safety priority for the City of Arvada,” Willhite said. “Restricting outdoor watering ensures we can continue to have the supply needed for drinking, cooking, cleaning, and other essential needs this year and in the future.
“These conservation measures protect our water supply through the current drought, and unknown future conditions,” Willhite continued. “In a significant drought, it becomes the responsibility of our entire community to conserve water.”
The city’s goal with the restrictions is to reduce water use across the city by 20%. Once the restrictions take effect, single-family residential homes with even-numbered addresses will be permitted to water on Sundays and Thursdays. Homes with odd-numbered addresses will be allowed to water on Wednesdays and Saturdays. Apartment buildings and commercial buildings will be permitted to water on Tuesdays and Fridays unless otherwise instructed. Trees, shrubs, vegetable gardens, and flowers can be watered using a handheld hose or drip irrigation outside of 10 a.m. to 6 p.m.
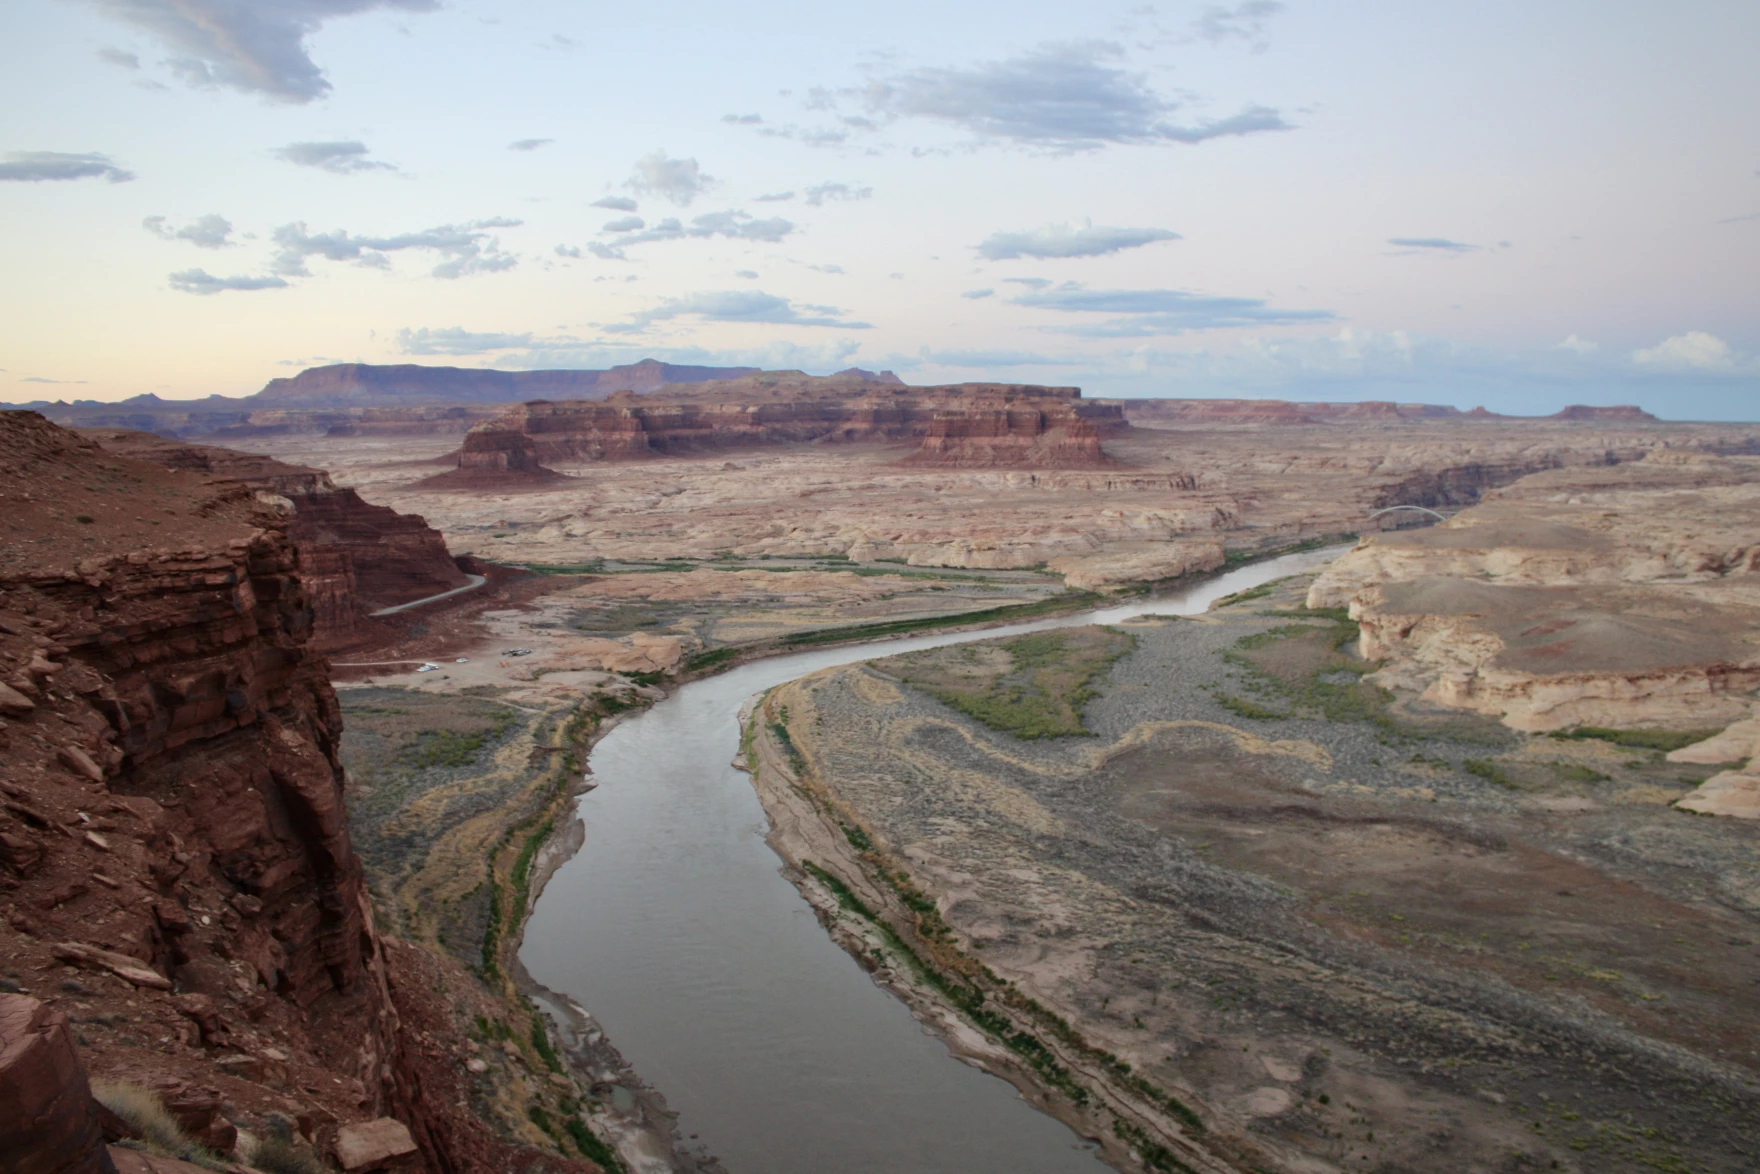
The Colorado River flows near Hite, Utah on July 4, 2022. The river’s water supply is shrinking, and states are caught in a standoff about how to cut back on demand. Alex Hager/KUNC
Click the link to read the article on the KUNC website (Scott Franz):
April 8, 2026
This story is part of ongoing coverage of the Colorado River, produced by KUNC in Colorado and supported by the Walton Family Foundation. KUNC is solely responsible for its editorial coverage.
Last month’s record breaking heat across the Mountain West led to the worst snowpack on record in Colorado and Utah, along with a significantly downgraded forecast for the upcoming supply of Colorado River water.
Cody Moser with the federal Colorado Basin River Forecast Center said in a monthly briefing Tuesday [April 7, 2026] that just 1.4 million acre feet of Colorado River water is expected to reach Lake Powell through July. That’s less than a quarter of what’s considered normal.
It’s also much lower than the 2.3 million acre feet Moser’s office projected a month ago, before the heat wave in the West melted away an already meager supply of snowpack.
“With record low snow pack, we have well below normal water supply forecasts,“ he said. “In many cases, our April through July (water) volume forecasts rank in the lowest five on record when compared to historical observations.”
The forecast for how much water will reach Flaming Gorge Reservoir also dropped more than 20% since the last monthly projection. Flows for the Yampa River are also projected to be near the record low.
Moser added it’s likely some rivers and streams in western Colorado have already reached their peak runoff for the year.
He said the water supply forecasts could improve if wet conditions arrive, or decline even further if the West remains dry.
The worsening river forecasts arrive as the seven states that use the waterway remain at an impasse this spring over how to share and conserve the water in the future.
If states can’t reach a deal, the Interior Department is expected to identify its preferred option for how to manage Lake Powell and Lake Mead after the current operating guidelines expire this fall.
Interior Secretary Doug Burgum told Arizona radio station KTAR News this week that the worsening spring runoff conditions are going to “require everybody to dig in and take bigger cuts than they want, and we haven’t reached that spot yet.”
Map of the Colorado River drainage basin, created using USGS data. By Shannon1 Creative Commons Attribution-Share Alike 4.0
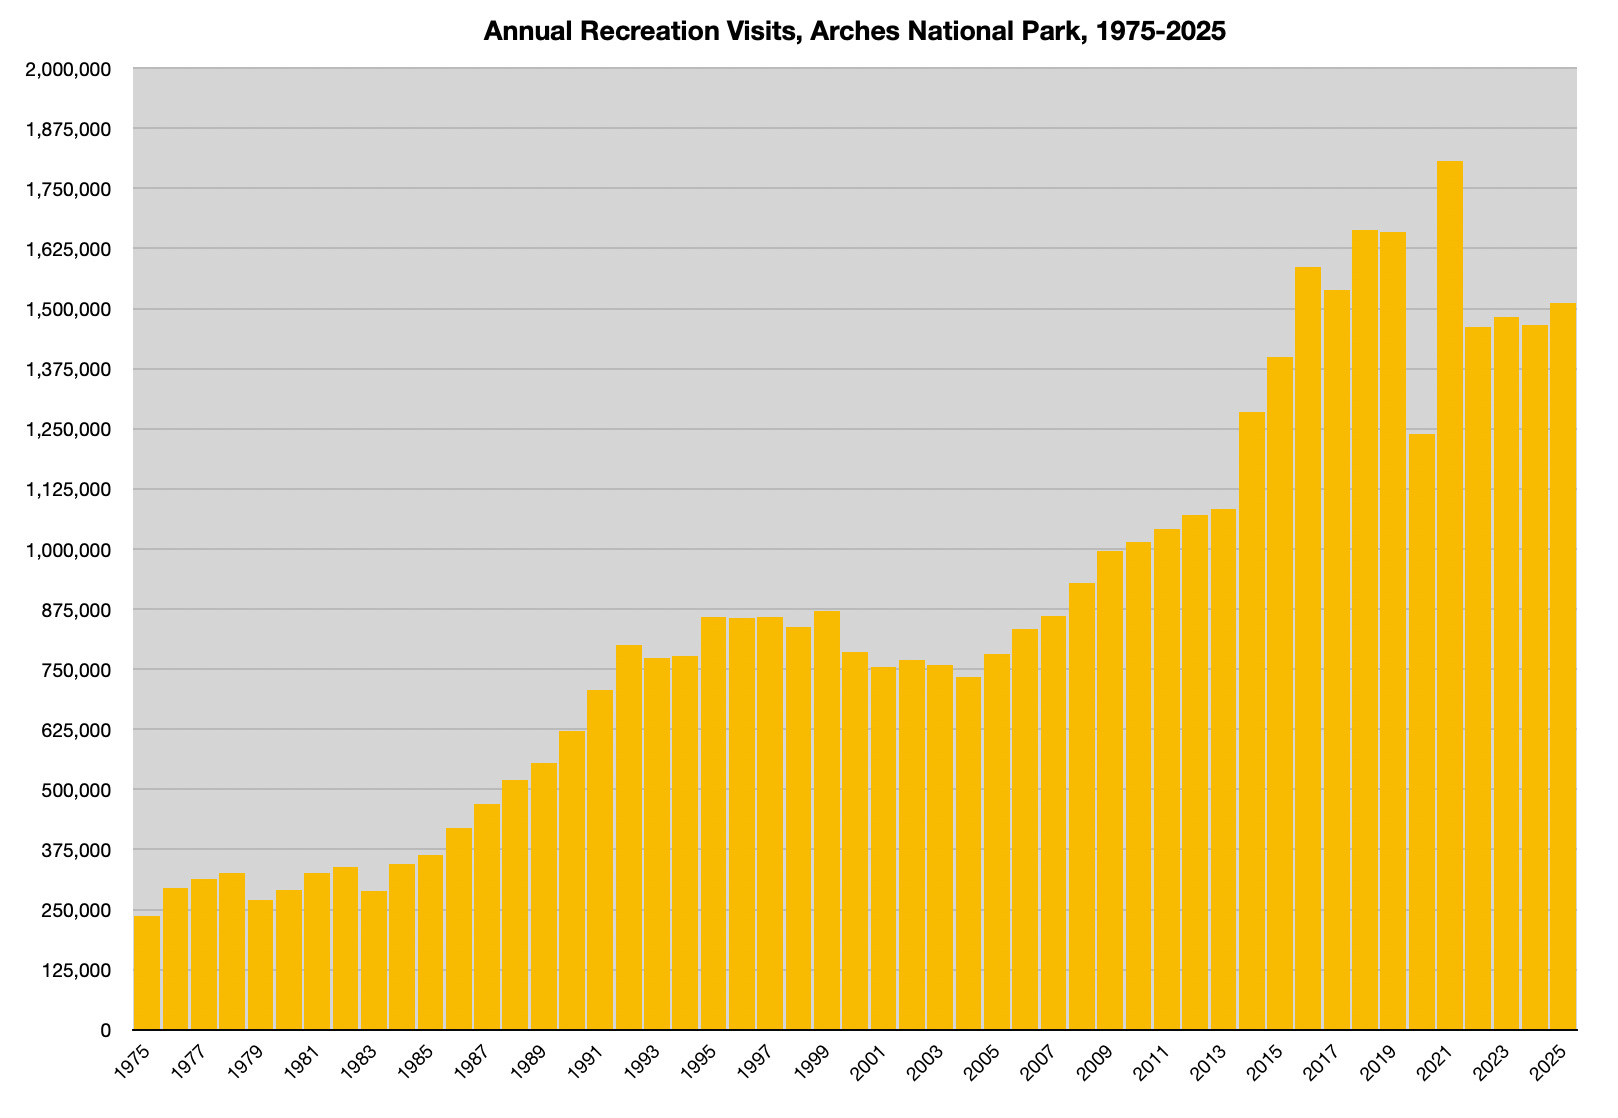
Arches visitor numbers soared during the Mighty Five campaign, plummeted in 2020 during the first COVID wave, surged in the pandemic’s aftermath, then corrected and plateaued. The correction corresponds with the implementation of the timed-entry reservation system. Source: NPS.
Earlier this year, the Trump administration cancelled the timed-entry reservation system for Arches National Park. The move was inspired in part by complaints from some Moab and Grand County elected officials and business owners who claimed the system had hampered overall visitation to the area, thereby hurting businesses’ bottom lines and diminishing tax revenues.
A new analysis is throwing that reasoning into doubt. And it raises the question of whether visitation to Arches is fueling Moab’s tourism industry, or the community and its amenities are drawing folks to the national park, or something in between. But it also should spur a conversation on who or what a national park should be serving.
During the Cold War, when Moab was primarily a uranium mining and milling town, with a bit of sightseeing, jeep-riding, and river-floating tourism on the side, Arches National Park was relatively quiet, with an average annual visitation of about 250,000 between 1965 and 1986. Winters could be downright empty: During January 1979, the first year monthly counts were recorded, only 2,970 people — or less than 100 per day on average — entered the park.
Domestic uranium production peaked in 1980. In 1984, the massive Atlas uranium mill just down the road from the entrance to Arches National Park shut down, and the industry effectively perished, creating an economic vacuum into which outdoor recreation-oriented tourism could slide. The Groff brothers opened Rim Cyclery in 1983, began renting mountain bikes a year later, and hosted the first Canyonlands Fat Tire Festival and Moab Stage Race (for road bikes) in 1986. The latter included a race from Moab, into Arches National Park, and back, something that would not fly nowadays.
Arches annual visitation also exceeded the 400,000 mark for the first time that year and climbed swiftly thereafter. While it’s difficult to suss out the cause and effect here, it is pretty clear that Arches visitation did not drive Moab’s transformation into a mountain bike and outdoor recreation mecca. If anything, it was the other way around. Arches visitation plateaued in the early 2000s, but Moab and Grand County’s amenities and tourism related sectors — retail trade, real estate, and services — continued to add jobs and in-migration remained strong.
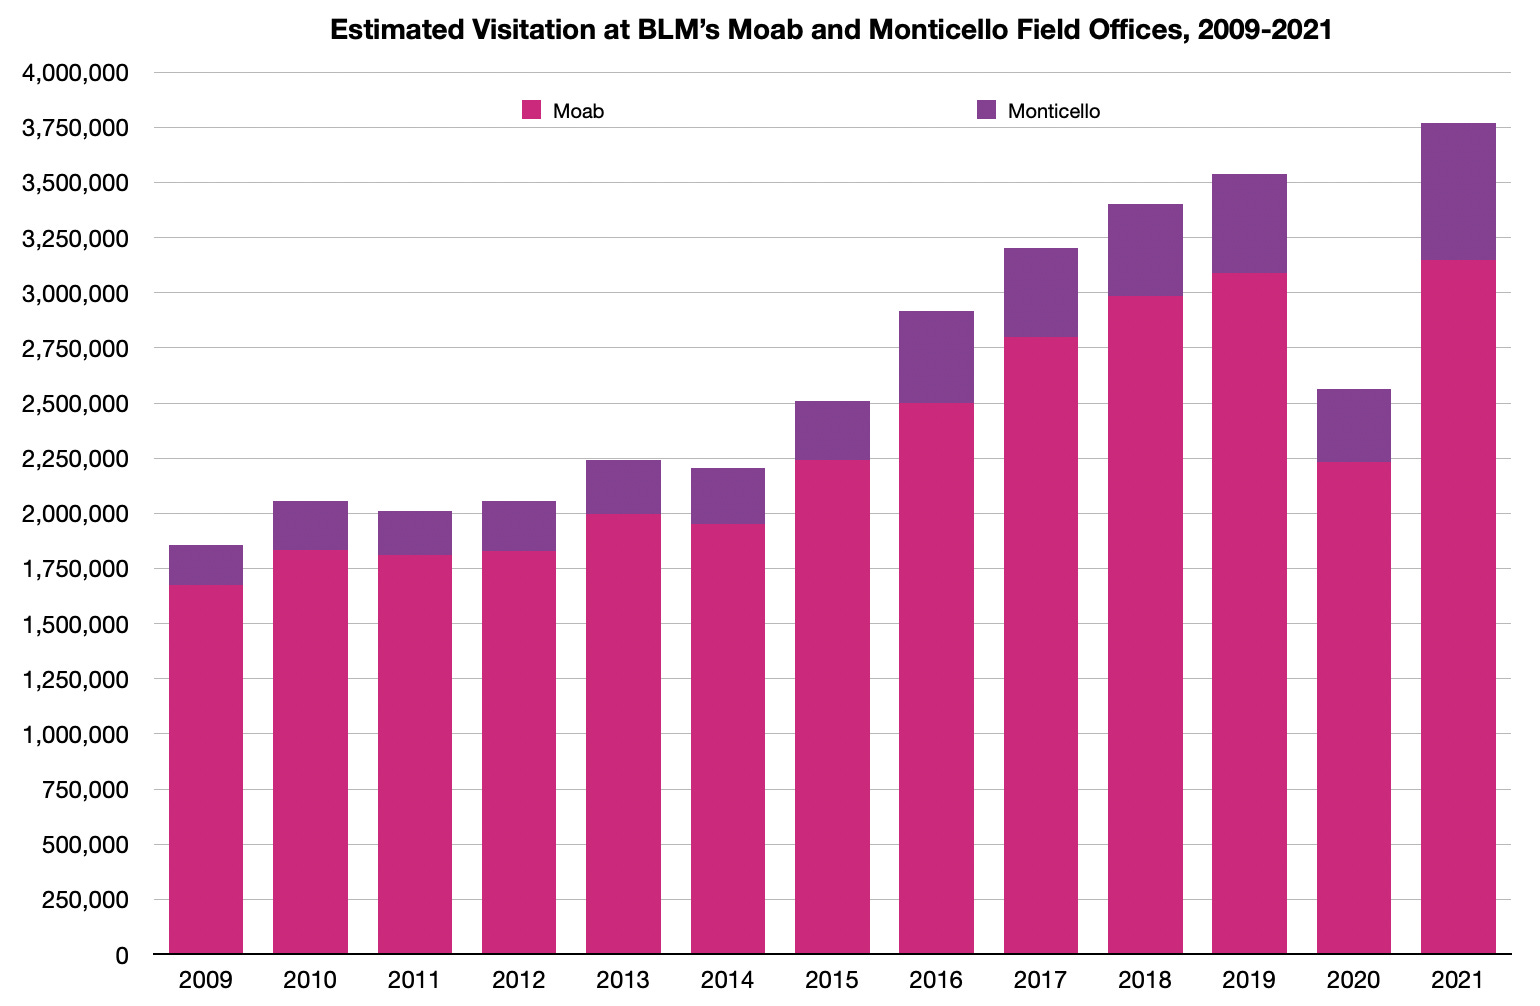
The non-national-park public lands around Moab see far more visitors than Arches National Park each year. Source: BLM.
Arches visitation and Moab’s might as an amenities economy continued to mirror each other. Utah’s Mighty Five marketing campaign helped drive Arches visits from less than 1 million in 2009 to 1.7 million in 2018. This led to packed parking lots, trail traffic jams, interminable waits at the entrance gates as lines of cars spilled out onto the highway for a mile or more, and dozens of instances in which rangers had to turn visitors away because the park simply couldn’t handle any more.
In 2021, a post-Covid surge drove visitation up to 1.8 million, prompting park officials to finally pull the trigger on timed entry, an idea that had been floating around for years. Requiring visitors to reserve their spot would spread the crowds out, at least, while also giving them more predictability. It sucks to drive for hours or even fly across the world to see Delicate Arch, only to get turned away at the gate. The program was launched as a pilot in April 2022, and made permanent the following year. Arches visitation tumbled soon thereafter, dropping to 1.46 million in 2022 and 1.48 million in 2023.
Last spring, Moab resident Matt Hancock presented an analysis to the Grand County commissioners purportedly showing that timed-entry led to the visitation decline, which resulted in a decrease in transient room tax collections. And that decline, he argued, was costing Moab about $45 million annually in direct visitor spending, which then rippled out into the community in the form of lost tax revenue and the services they fund.
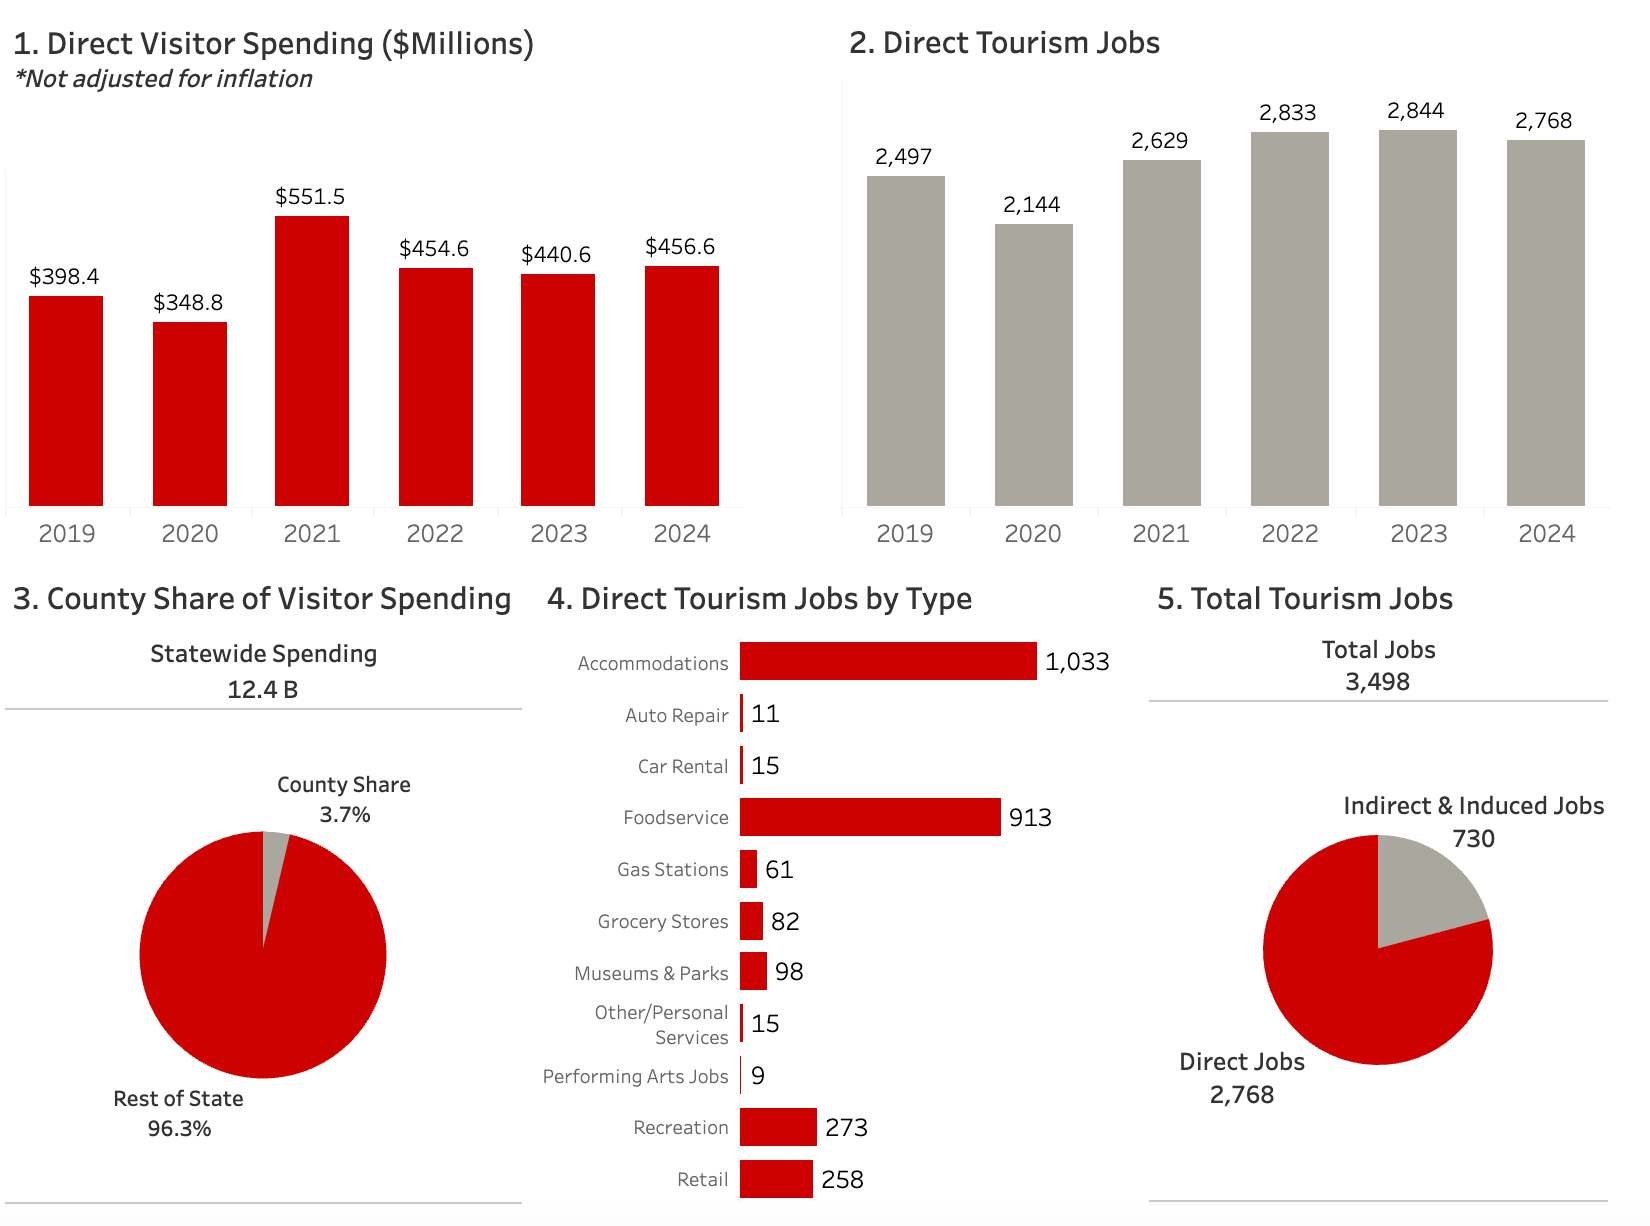
Direct visitor spending in Grand County, Utah, dropped off after the COVID surge, but remained above pre-COVID levels through 2024, throwing doubt on claims that Arches’ timed-entry drove the post 2021 decline. Source: Kem C. Gardner Policy Institute County Tourism Dashboard.
Grand County Commissioner Brian Martinez then formulated an “Access and Capacity Enhancement Alternative” plan for managing Arches National Park. It favored expanding infrastructure and packing more crowds into the park, and slammed any sort of “demand restrictions” such as timed-entry, saying Grand County “considers its impact on visitation, the local economy, and the community to be unacceptable.”
Martinez presented the plan to a group of state and federal officials at a closed State of Utah and National Park Service Workshop in Salt Lake City aimed at exploring ways to give local officials more control over public lands. A few months later, reservation systems were nixed at Arches, Yosemite, Glacier, and Rocky Mountain National Parks.
Will this boost visitation and Moab’s economy? Possibly, but not likely, according to yet another look, this one by Moab resident Emily Campbell. She also finds a correlation between Arches visitor number declines and timed entry, but points out that the corresponding transient room tax decreases could be attributed to other factors, such as a shift in visitors’ lodging choices. They may be camping on public lands, for example, or staying in neighboring counties, where hotels and such tend to be less expensive.
Meanwhile, other sectors of the economy have thrived, with food services, retail, and construction taxable sales shooting up even as Arches visitation has lagged. Perhaps it’s a sign that Moab’s economy is diversifying slightly, if only from relying heavily on tourism to also depending on folks that actually live there, but earn their incomes from outside the county.
Rather than trying to build on this diversification, however, Grand County is continuing to throw resources at yet another study aimed at determining the economic impact of timed entry — regardless of the fact that the reservation system has been suspended, at least for now.
Of course, all of this skirts around the deeper and bigger issue: the purpose of national parks. Is it really to bolster gateway communities’ tourism industries and enrich local business owners? Or is it, as the National Park Service’s mission states, to preserve “unimpaired the natural and cultural resources and values of the National Park System for the enjoyment, education, and inspiration of this and future generations”?
That’s what parks officials should be thinking about, first and foremost. They should manage the park for the long-term benefit of the park and the resources there. Secondary to that is its effect on the visitors’ experience. Limiting the number of people traipsing around the park by whatever means will be better for the park (or at least not worse for it). And spreading out the crowds with a reservation system will not only make Arches more enjoyable to visit, but will also make it more predictable. That, in the long run, will be better for the park, for its visitors, and, yes, for the gateway communities, too.
Moab’s tourism industry might be wise to get outside the growth at all costs mindset as well. The place has been adding hotel rooms at an astounding rate, looking to capitalize on the Moab mystique. But there are limits to how much visitation can continue to increase without not only wrecking the surrounding public lands but also diminishing the experience and driving folks away. Who knows, the tourism industry could bust just as hard as uranium mining did 40 years ago.
March certainly went out like a lion, though maybe not in the way that the saying is normally understood. It was hot. Damned hot. I’ll give a more thorough rundown on the heatwave and a final snowpack analysis in a later dispatch (after the next storm system moves through in hopes that it might improve the situation). But for now here’s a few stats from the heat wave.
204; 279: Number of monthly high-temperature records that were broken or tied in Arizona and Colorado, respectively, during the last two weeks of March.
102° F: Temperature at the Phoenix airport on March 18, setting a new monthly record and beating the earliest first 100-degree day by eight days.
105° F: The temperature in Phoenix on March 19, 20, and 21, breaking the March record yet again.
78.8° F: Average temperature in Phoenix for the month of March, 6.5° higher than the previous record high average temperature for the month.
109° F: Recorded temperature in Yuma, Arizona, on March 20.
78° F: Temperature in Del Norte, Colorado, on March 20, a new monthly record.
92° F: Temperature in Trinidad, Colorado, on March 21, smashing the previous monthly record high of 85° set … two days earlier.