
Click on a thumbnail graphic to view a gallery of drought data from the US Drought Monitor website.
Click the link to go to the US Drought Monitor website. Here’s an excerpt:
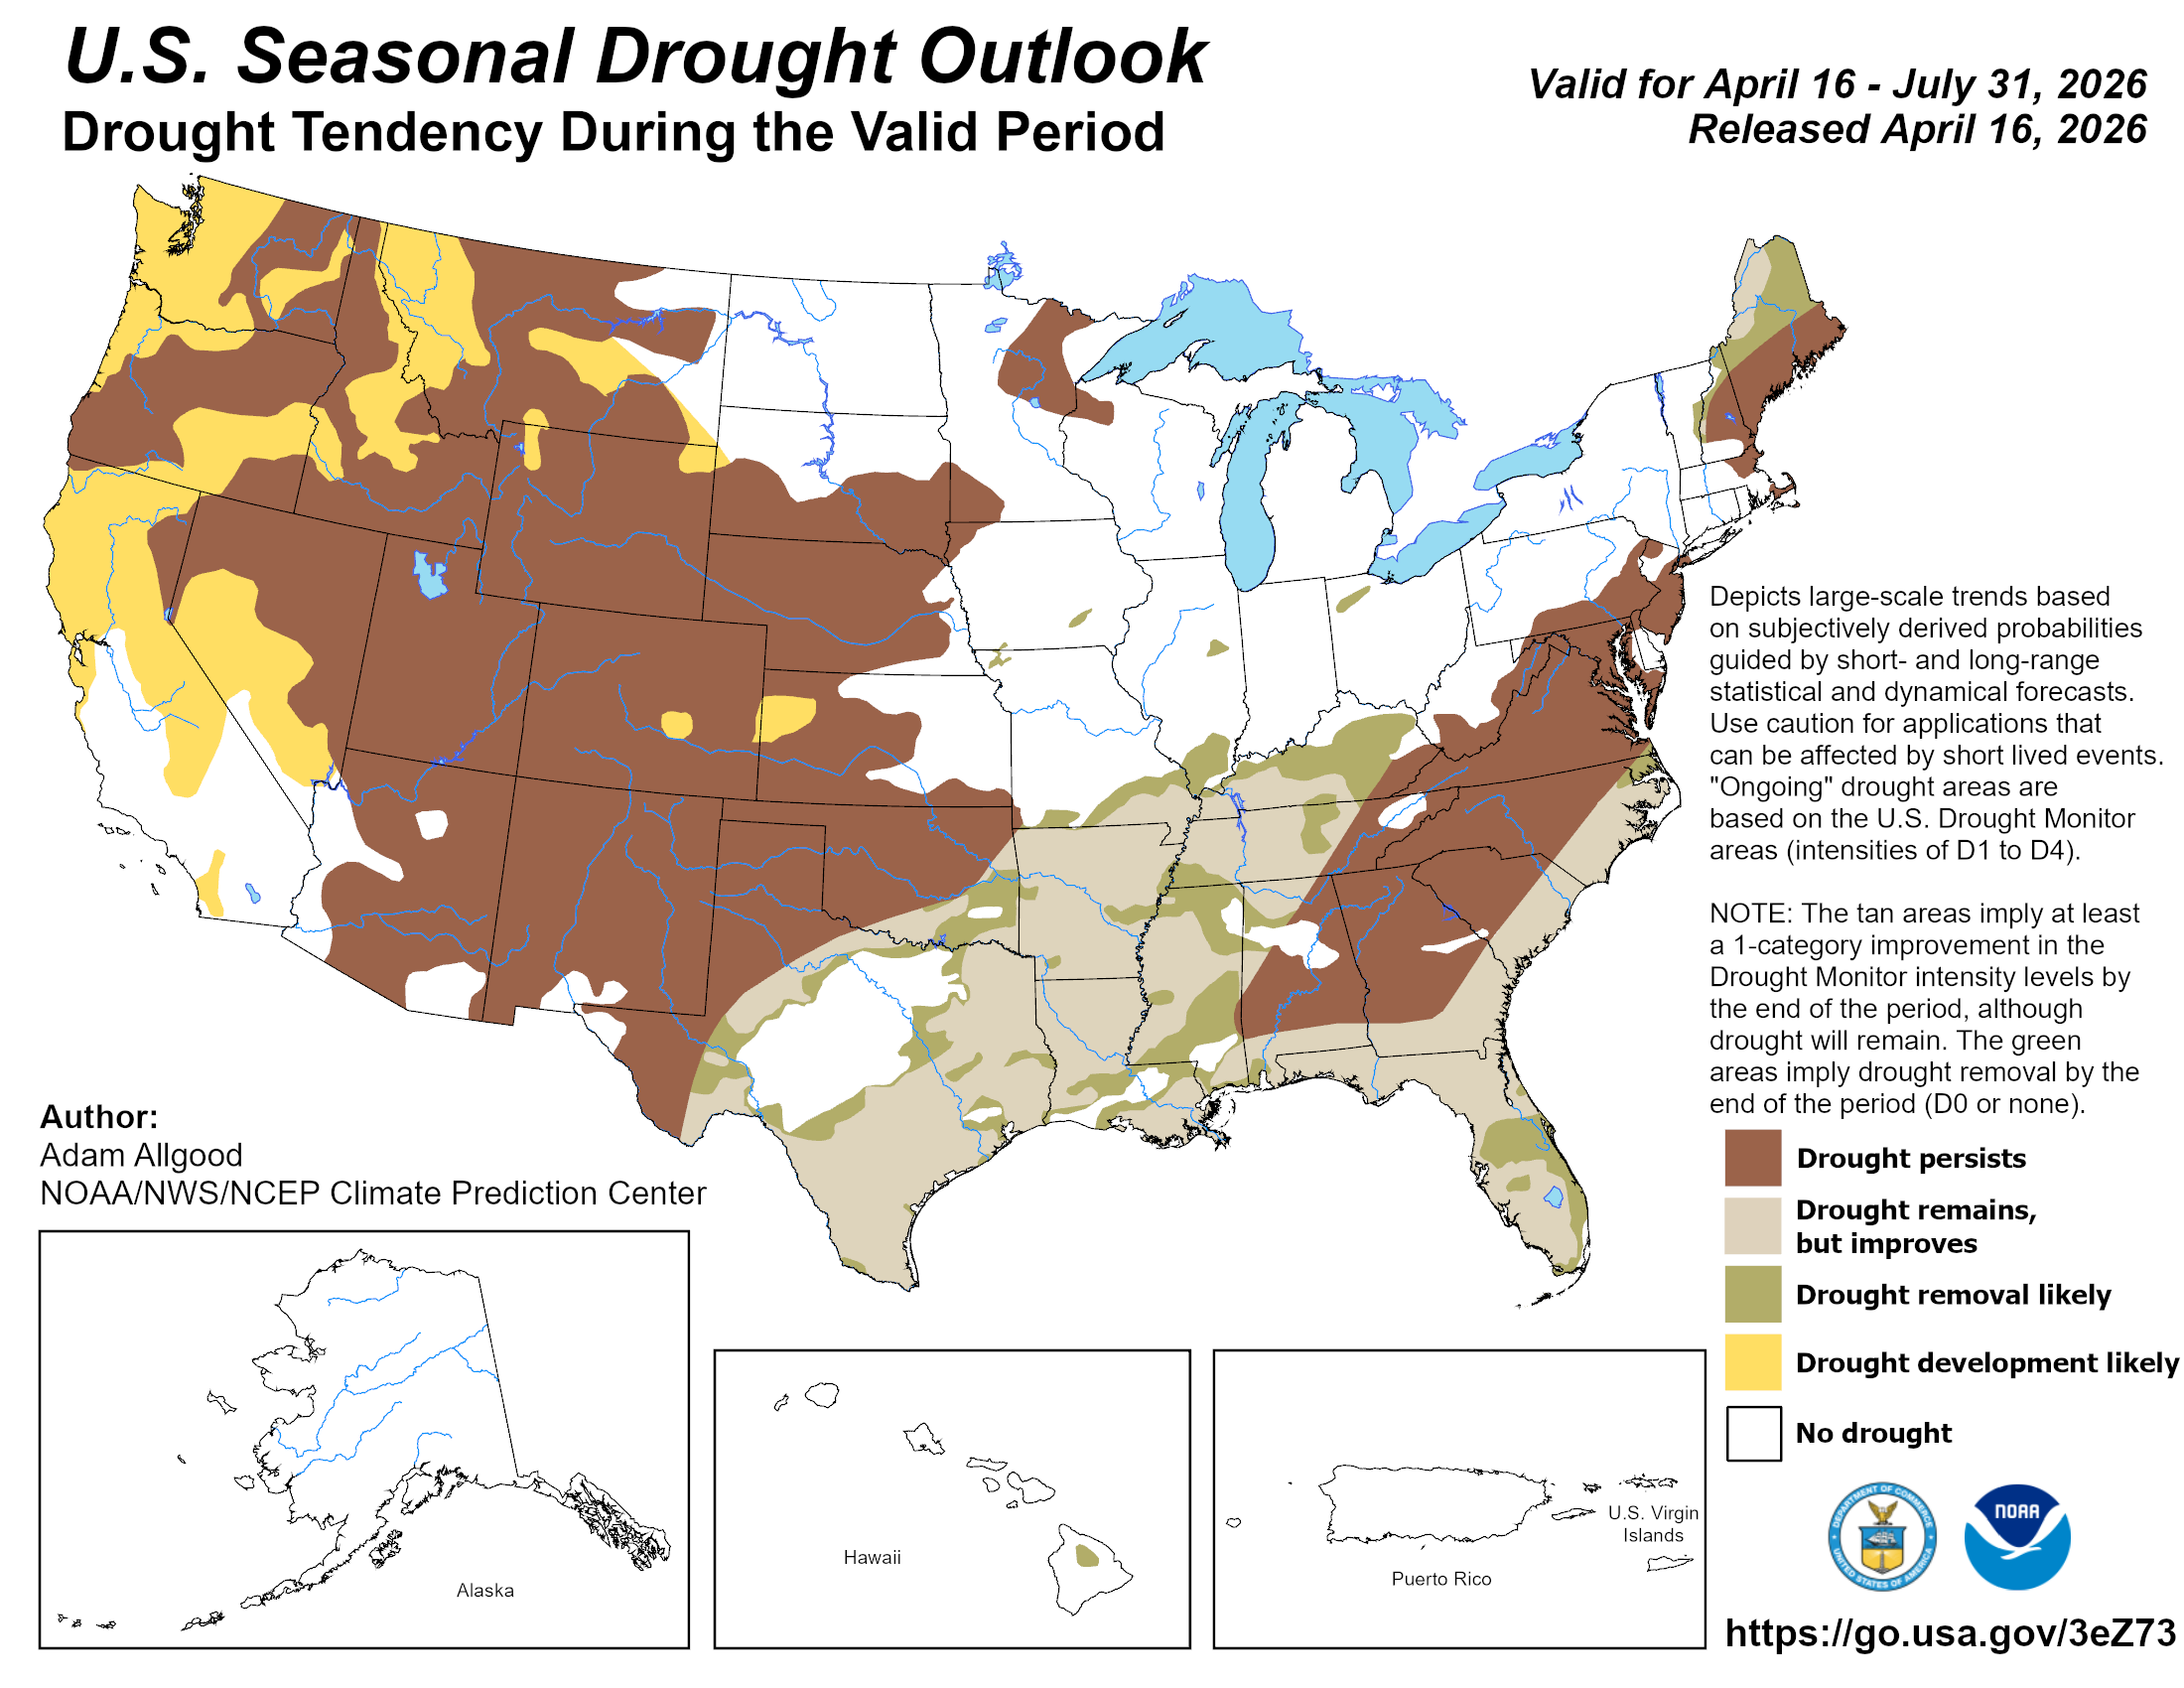
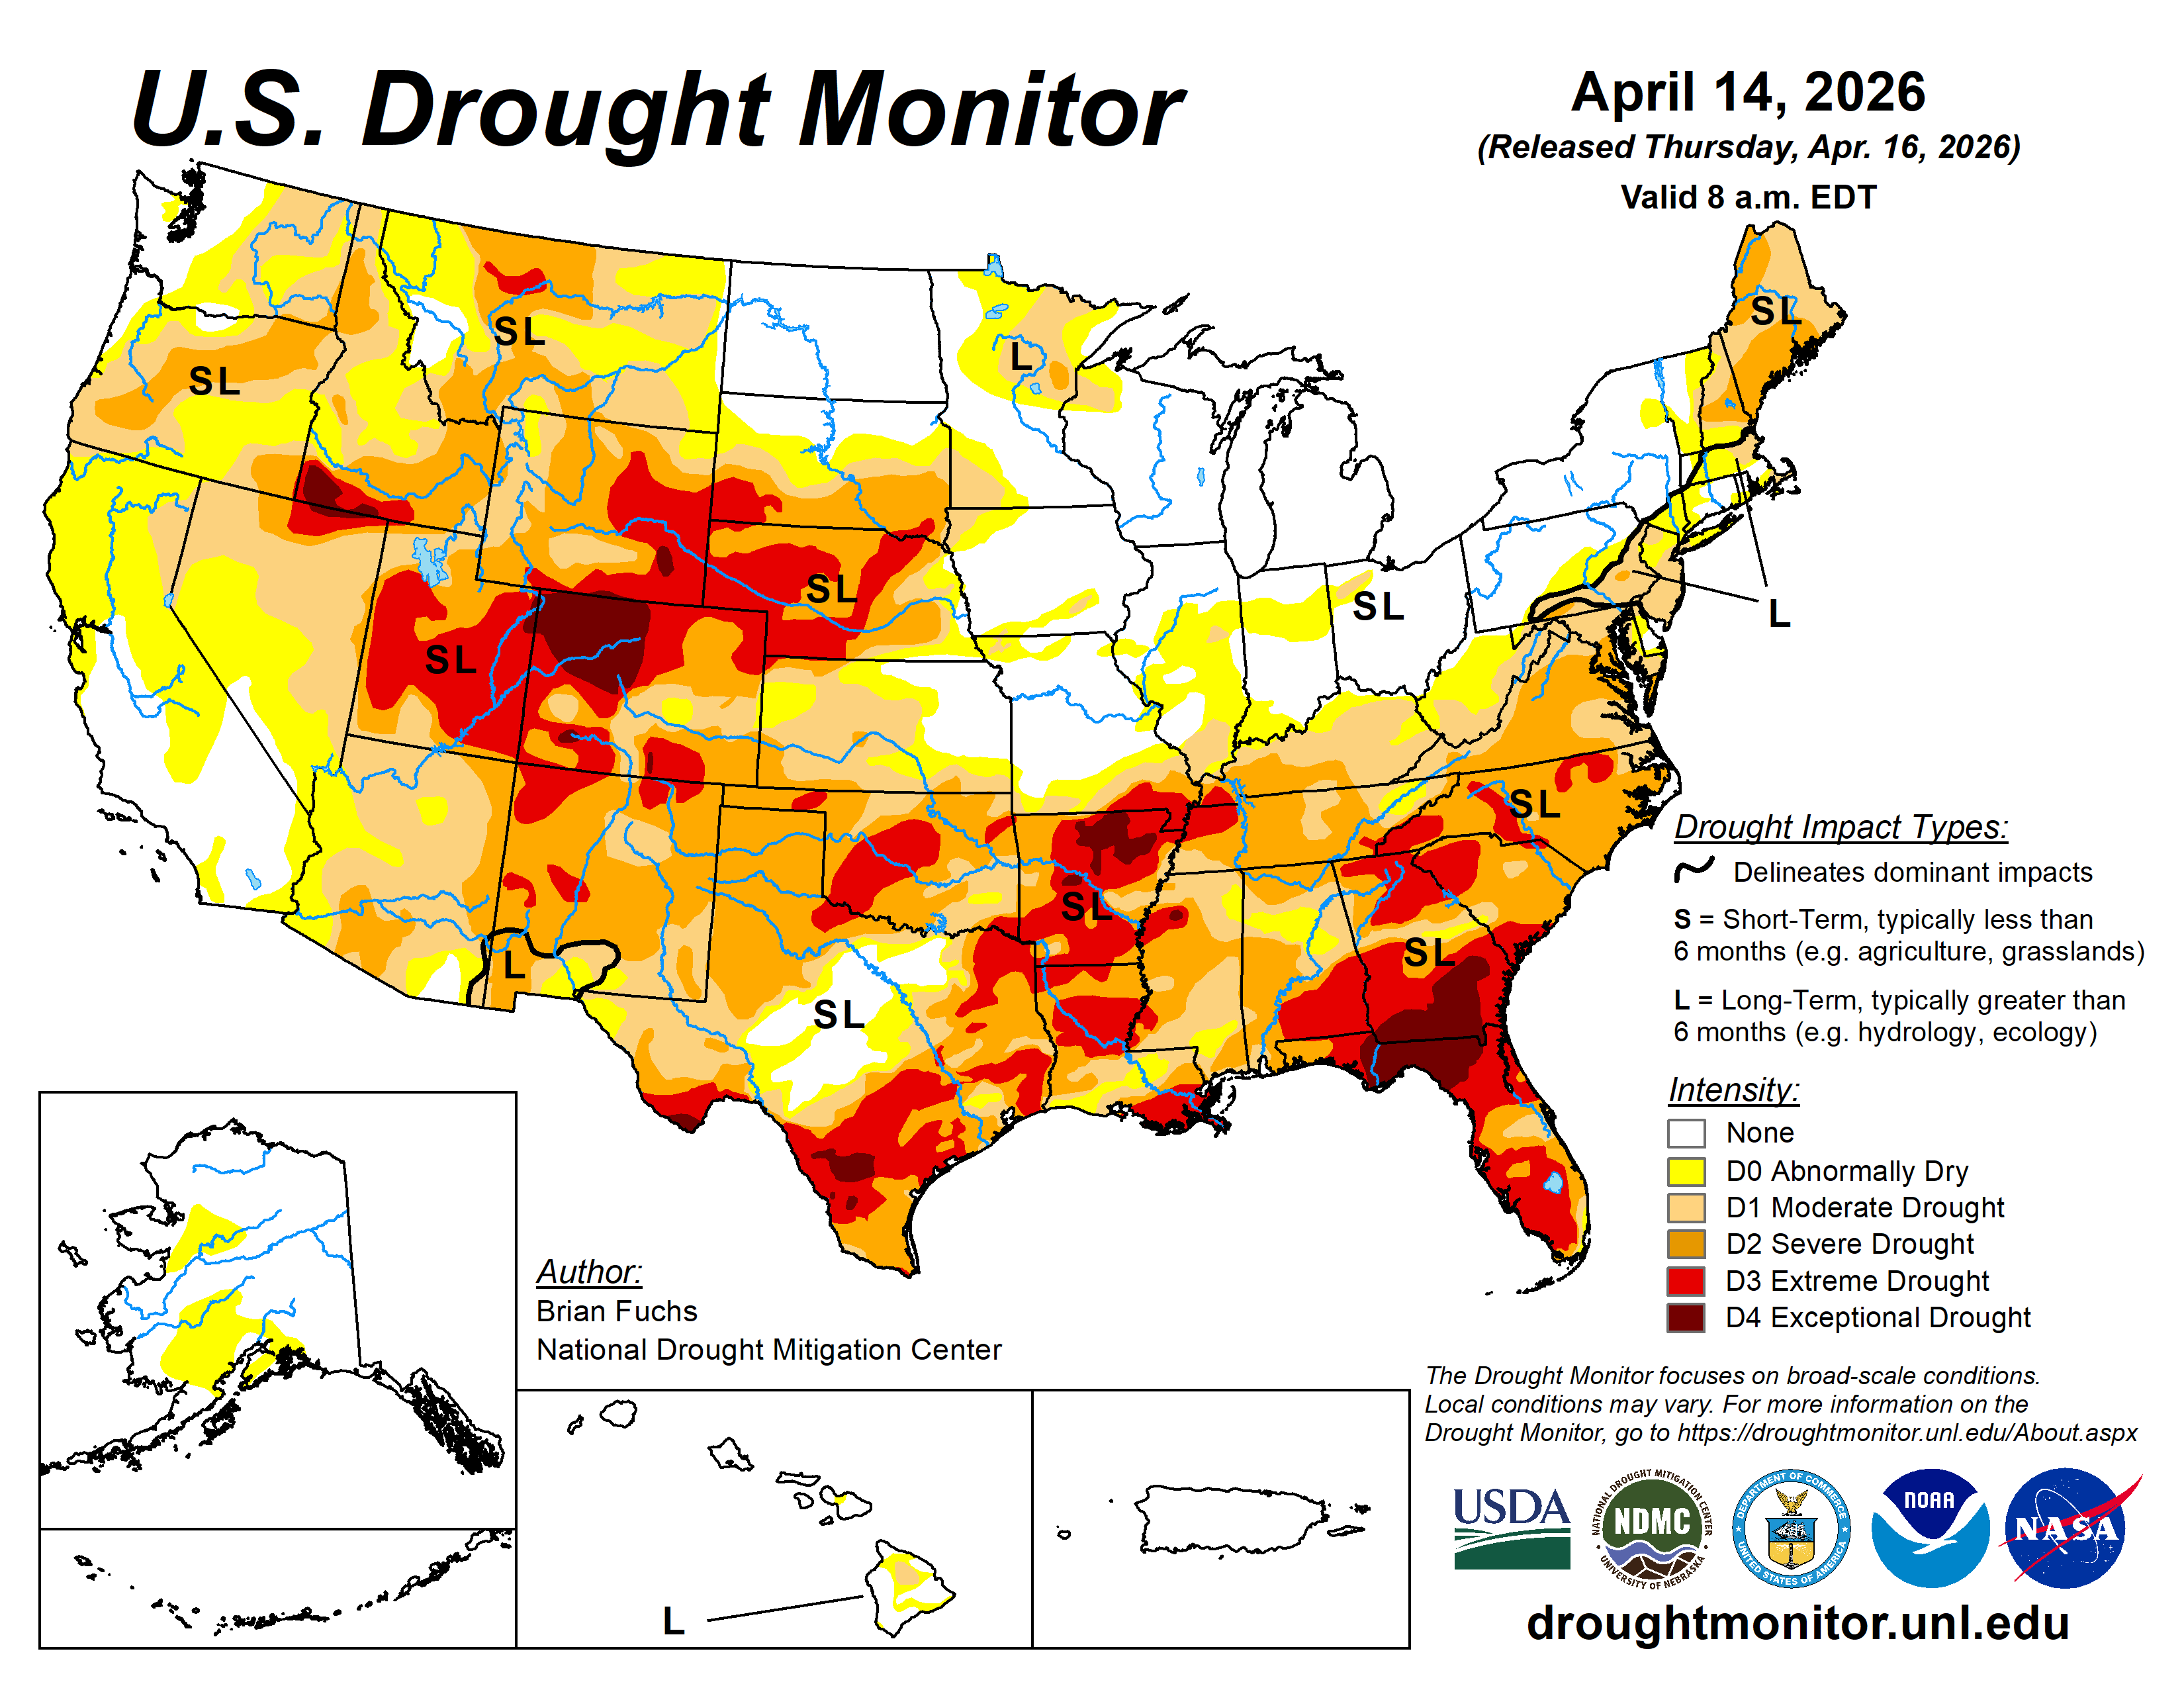
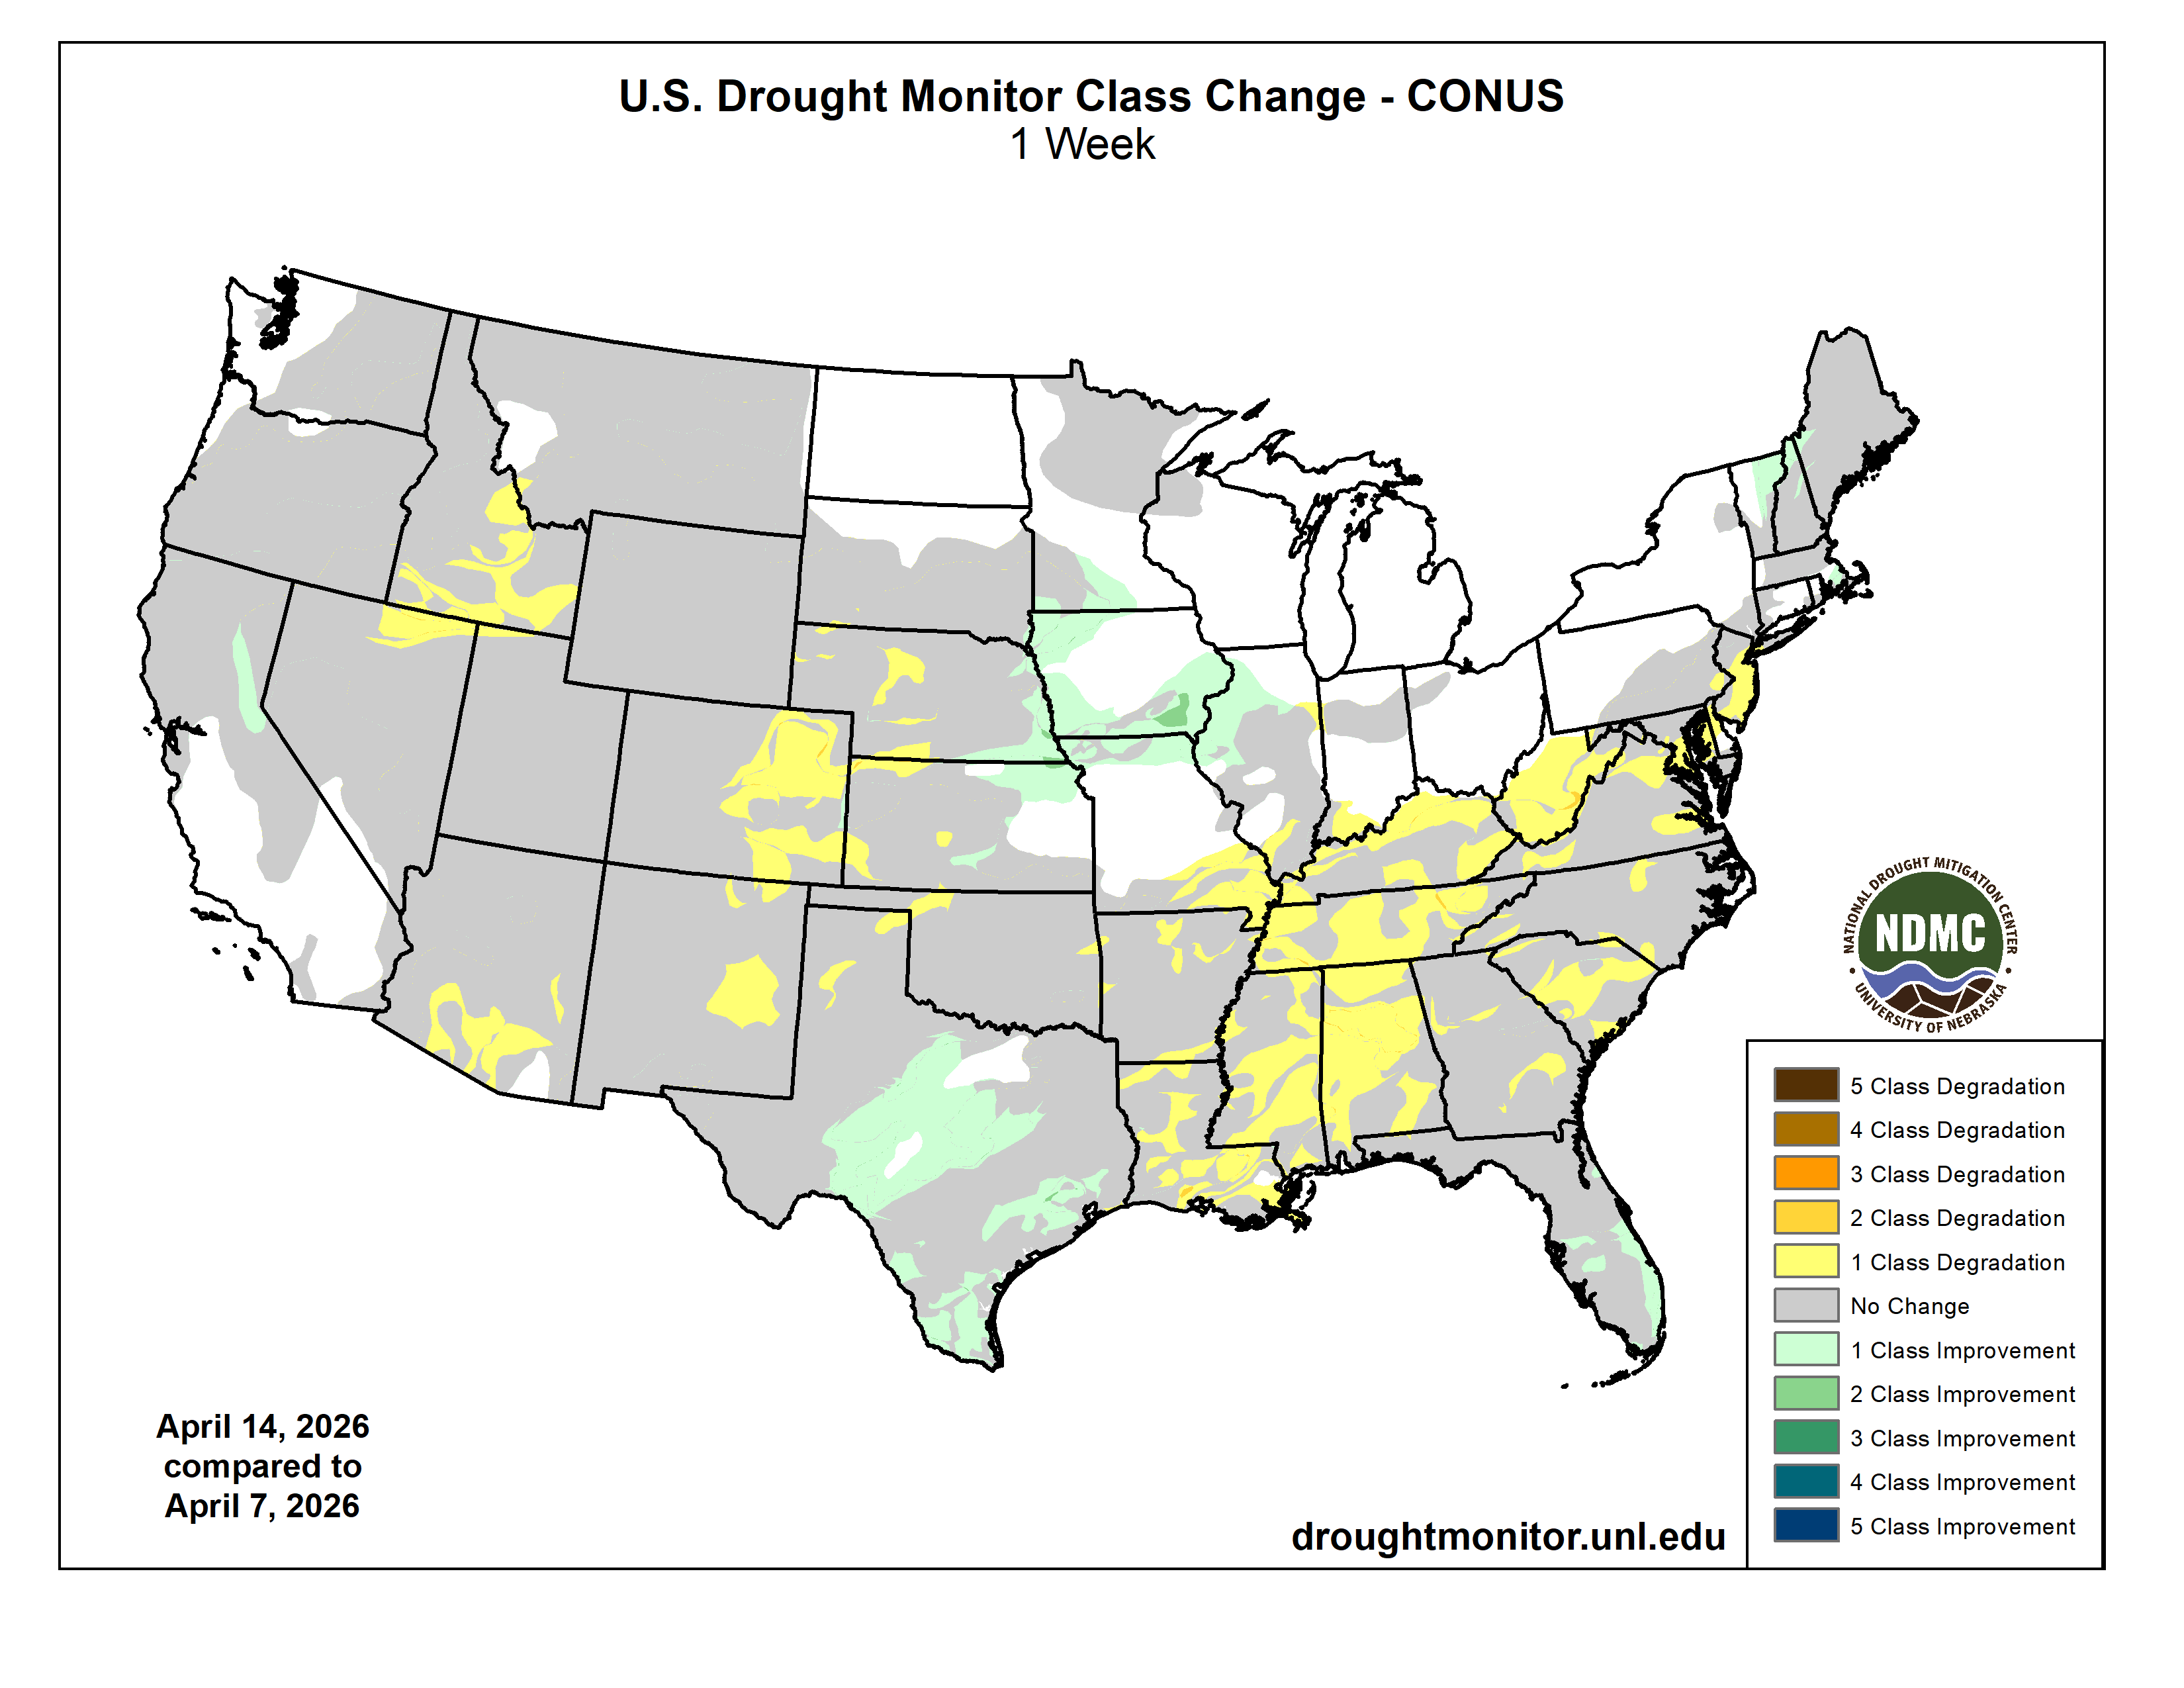
This Week’s Drought Summary
Much of the country continued to experience above-normal temperatures in April. During the last week, the warmest temperatures were over the southern Midwest and into the central Plains, where departures were 9°F or greater. California and portions of the Southeast into the Mid-Atlantic were near normal to slightly below normal. Dryness has continued in the Southeast, portions of the South, the Northeast, and much of the High Plains. The greatest precipitation occurred in the Great Basin, northern California, central and west Texas, northeast Kansas, and across much of Michigan and Wisconsin, where spring thunderstorms developed within an active weather pattern, mainly over the Midwest…
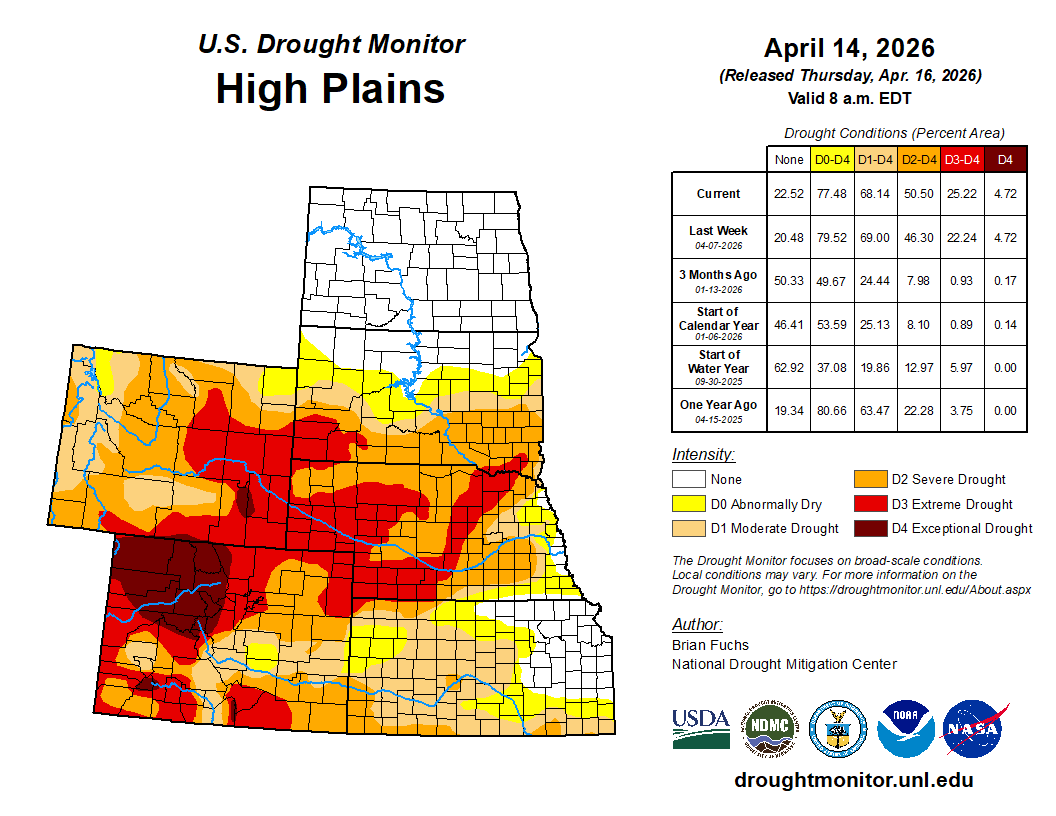
High Plains
Temperatures were mostly above normal, with only eastern North Dakota and northeast South Dakota near or below normal. The greatest departures occurred in central Kansas, where temperatures were 12–15 degrees above normal. Above-normal precipitation was observed in southwest and northern North Dakota.
Kansas experienced the most active weather, with southwest and eastern areas of the state and southeast Nebraska recording above-normal precipitation. Some areas of northeast Kansas received more than 400% of normal precipitation. These rains led to improvements in abnormally dry and moderate drought conditions across southeast Nebraska and northeast Kansas. Some areas of eastern Nebraska and south-central Kansas also saw improvements.
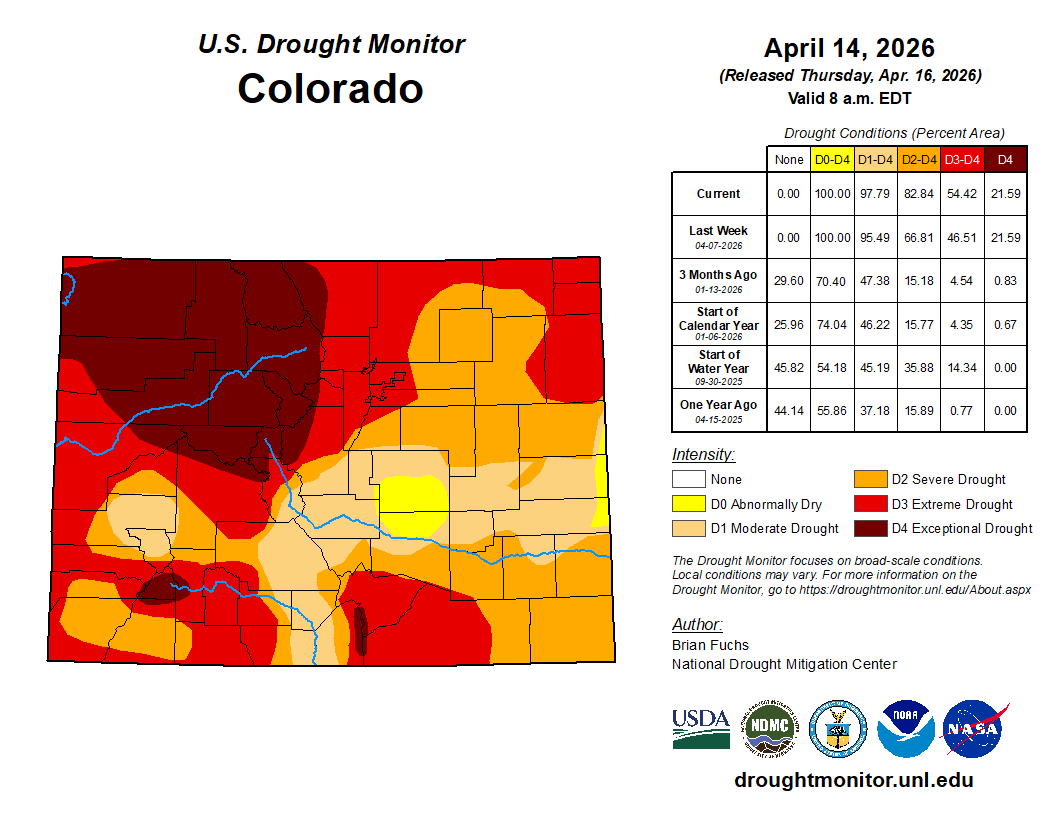
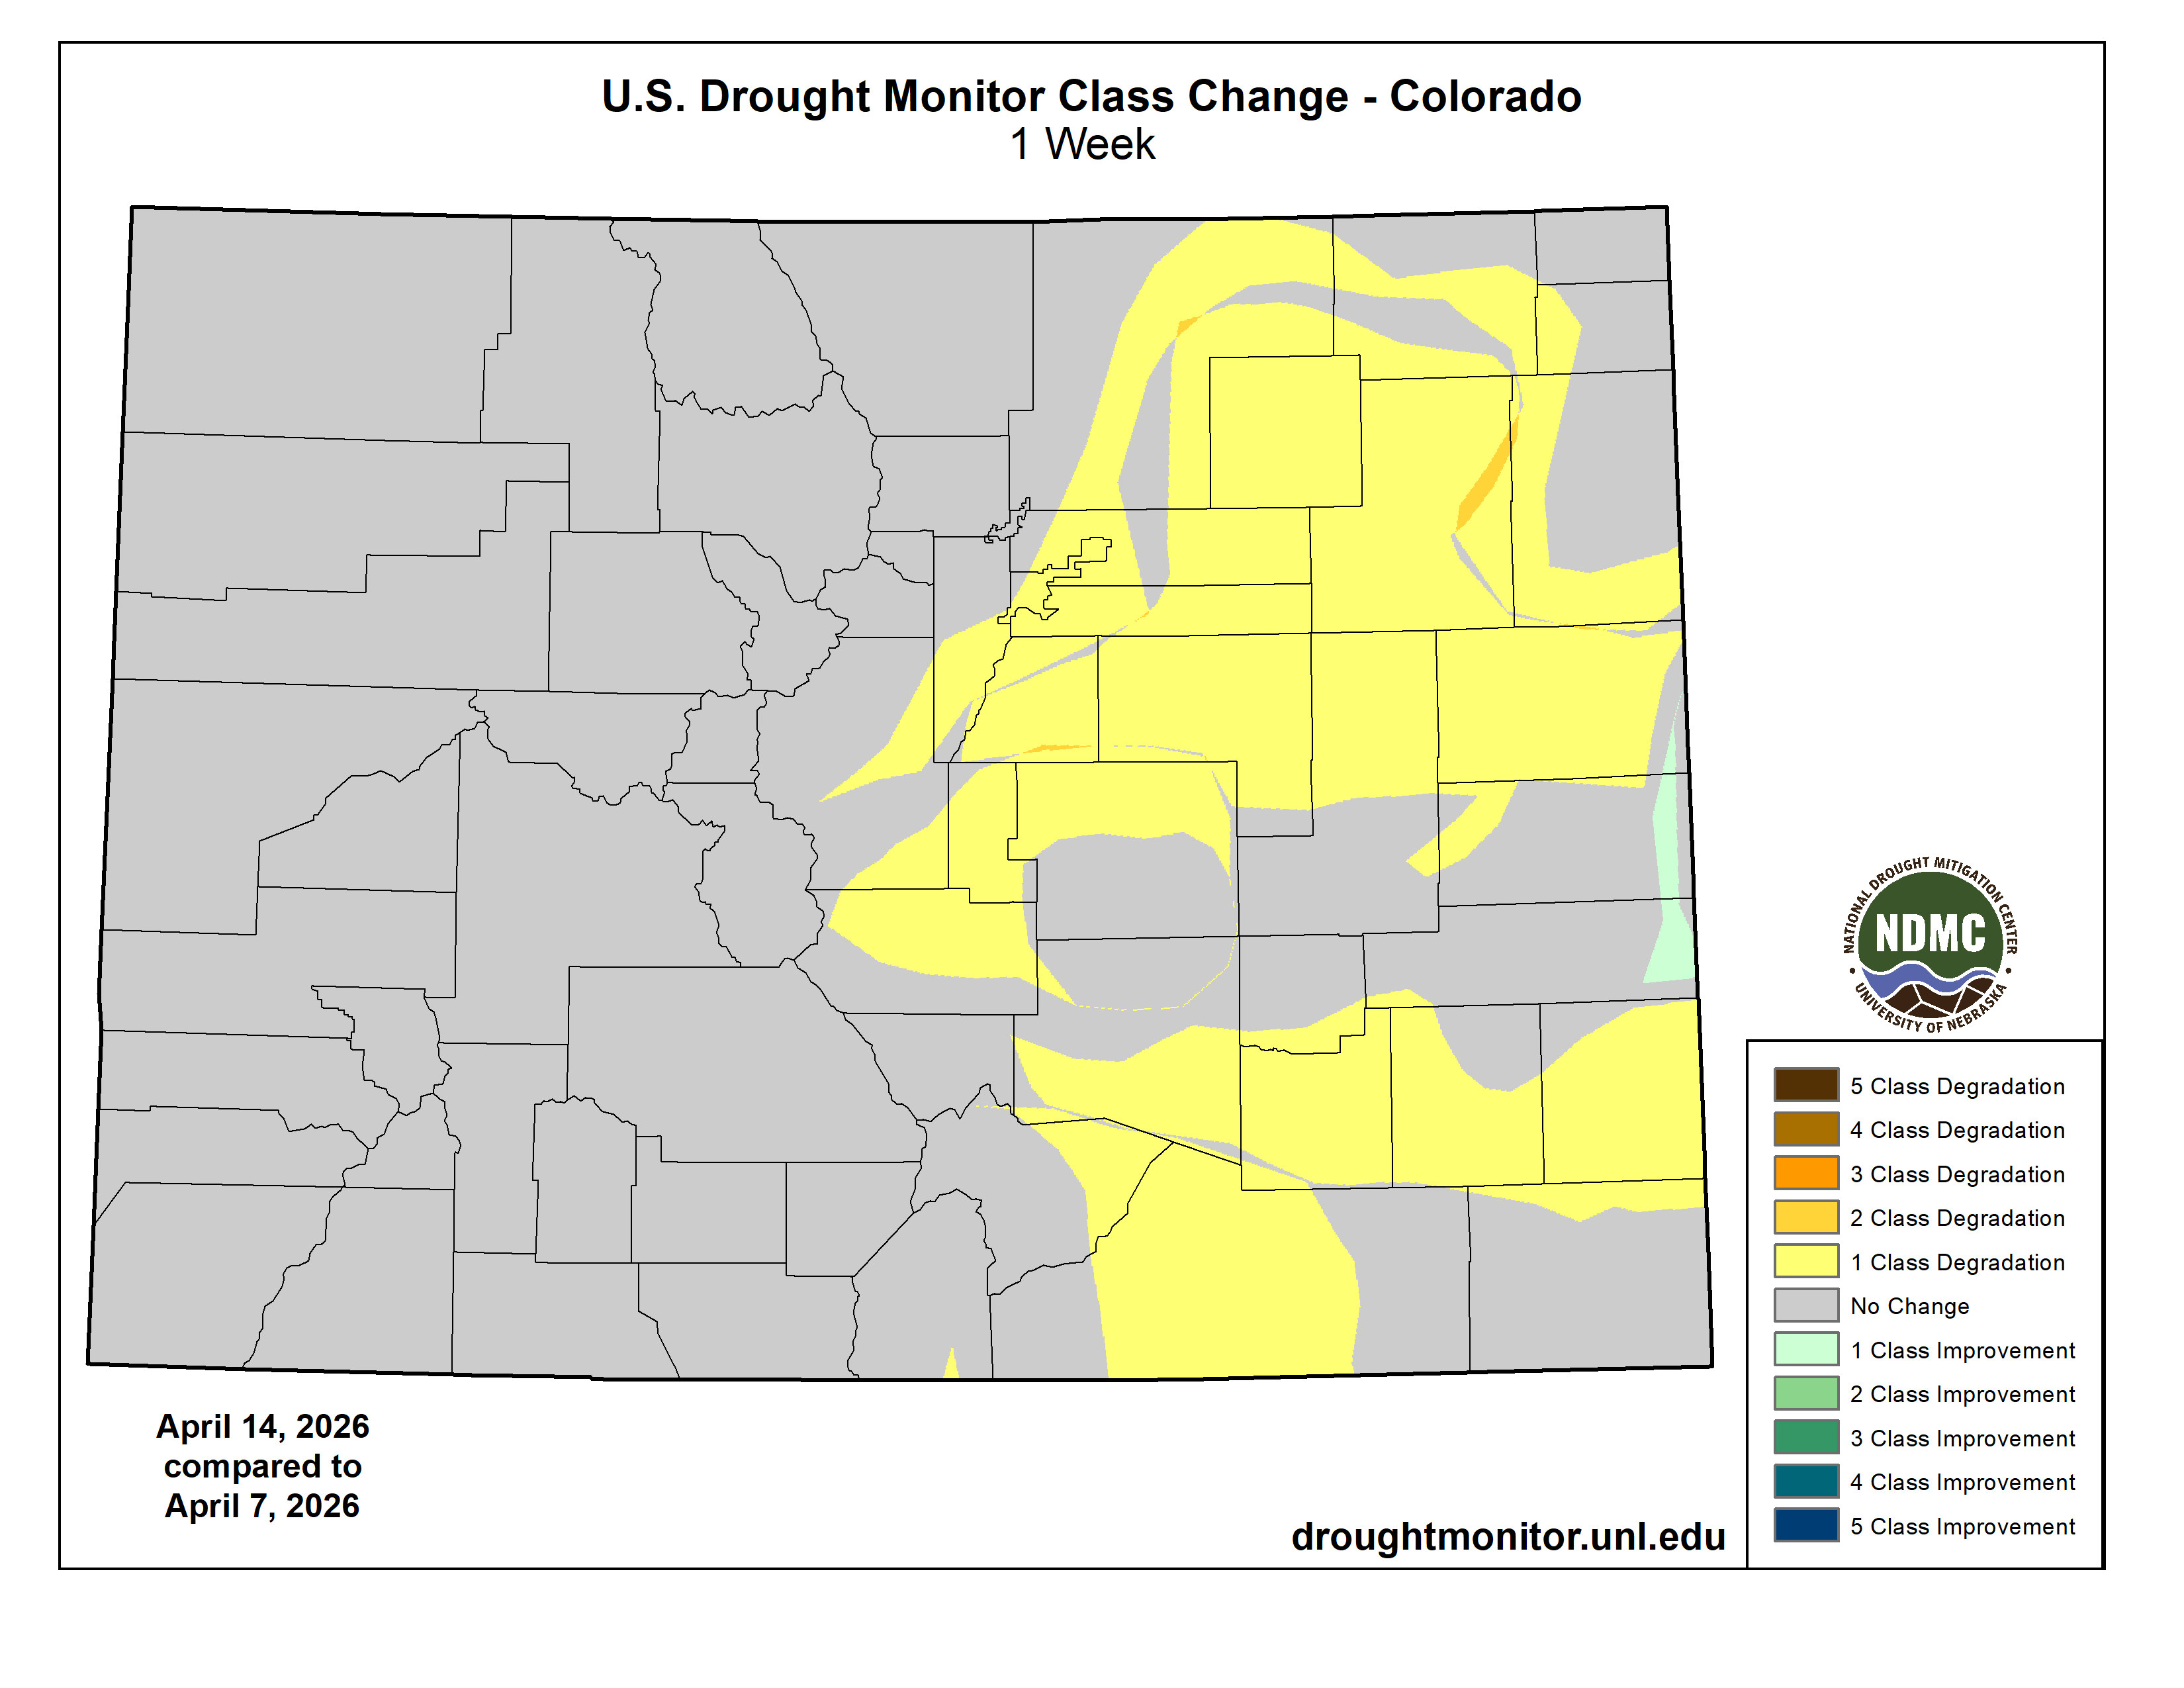
Extreme drought expanded across southwest Nebraska and northwest Kansas, while severe drought expanded across southwest Kansas. The plains of eastern Colorado experienced nearly a full-category degradation, with expansion of moderate, severe, and extreme drought…
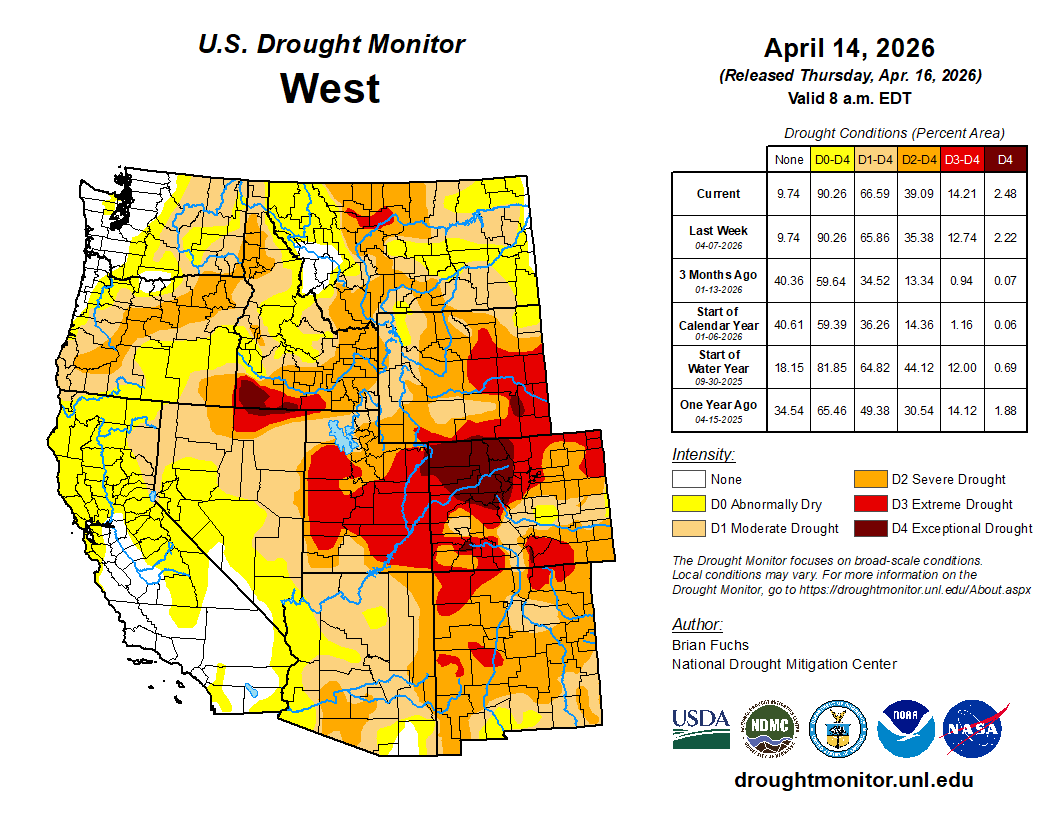
West
Warmer-than-normal temperatures dominated the region this past week. Departures were 6–8 degrees above normal across most of Utah, Colorado, and Wyoming. Only the Sierra Nevada area and northern California were near to slightly below normal.
Precipitation was mixed, with parts of northern California, northern Nevada, eastern Oregon, southern Utah, eastern and western New Mexico, southwest Idaho, and eastern Washington receiving above-normal precipitation.
The lack of snowpack will continue to impact the region in the coming months. Earlier-than-normal snowmelt, below-normal seasonal totals, and increased liquid precipitation are contributing to hydrological impacts.
Changes this week included improvements in moderate drought in northeastern California and expansion of moderate and severe drought in southern Arizona. Southern Idaho into northern Nevada saw expansion of severe, extreme, and exceptional drought, while severe drought expanded across eastern and northern New Mexico…
South
Precipitation was mixed across the region. Oklahoma and much of central and western Texas received more than 150% of normal precipitation. Farther east, eastern Arkansas and Louisiana saw light precipitation, while areas farther west and into Tennessee remained mostly dry.
Temperatures were above normal across much of the region, with only southern Texas, southern Louisiana, and eastern Mississippi near or below normal. The greatest departures occurred in western Oklahoma and the Texas Panhandle, where temperatures were 12–15 degrees above normal.
Drought expanded and intensified across much of Tennessee, with moderate and severe drought expanding statewide and a new area of extreme drought developing in the northwest. In Mississippi, moderate and severe drought expanded across eastern and southern areas, with extreme drought expanding in the northwest. Arkansas remained dry, with extreme and exceptional drought expanding in both northern and southern areas.
Louisiana saw expansion of extreme drought across much of the south, as well as central and northern areas. Moderate and severe drought also expanded across southern portions of the state. Oklahoma remained largely unchanged, with only minor expansion of severe drought in the panhandle.
The most significant improvements occurred in Texas, where much of central, southern, and southeastern portions of the state saw a full-category improvement in drought conditions. However, severe drought expanded in parts of the panhandle…
Looking Ahead
Over the next 5–7 days, precipitation is expected to be most prominent across the southern Plains, Midwest, and Northeast. The heaviest precipitation is likely from eastern Kansas into Missouri and northward into eastern Iowa, northern Illinois, and the Great Lakes.
Additional precipitation is expected from the Pacific Northwest into the northern Rockies and High Plains. Dryness is likely to persist across much of the Southwest and Southeast.
Temperatures are expected to be above normal from the northern Rockies into the High Plains, with the greatest departures in western Nebraska, eastern Colorado, and central Montana (10–13 degrees above normal). Cooler-than-normal temperatures are anticipated across much of central Texas (5–9 degrees below normal), while warmer-than-normal conditions are expected across the Mid-Atlantic (5–7 degrees above normal).
The 6-10 day outlooks show that the locations with the best chances of experiencing below- normal temperatures are in the Southwest, especially those locations in Arizona and southern Nevada and California as well as in New England with the best chances in both Arizona and Maine. There is a high likelihood of above-normal temperatures over much of the Midwest, Plains, and into the South and Southeast with the best chances over Kansas, Missouri, Arkansas, Oklahoma into southern Nebraska and Iowa. Precipitation chances are expected to be near-normal over southern Florida and southern areas of New Mexico and Arizona. Near-normal precipitation is also expected over the Pacific Northwest, upper Midwest and into the Northern Plains. In the Northeast, there will be a mix of near-normal to below-normal precipitation chances. Most of the rest of the country has above-normal chances of recording above-normal precipitation with the greatest chances over an area from northern Louisiana to Indiana.
Click the link to read the article on The Land Desk website (Jonathan P. Thompson):
April 14, 2026
🐟 Colorado River Chronicles 💧
With each passing April day without major snowfall, we gain more clarity on the Colorado River situation and what things might look like this summer, which is, in a word, grim. Or, as Arizona’s top water officials put it: “The winter and spring snowpack and runoff projections in the upper basin are abysmal.”
The Colorado River Basin Forecast Center is putting a number to that term by predicting that the Colorado River system will deliver about 1.4 million acre-feet1 of water to Lake Powell from April 1 through July 31. That’s about 23% of the median for the spring runoff season, which is when flows are most abundant, and just over half of last year’s not so great figure of 2.6 MAF.
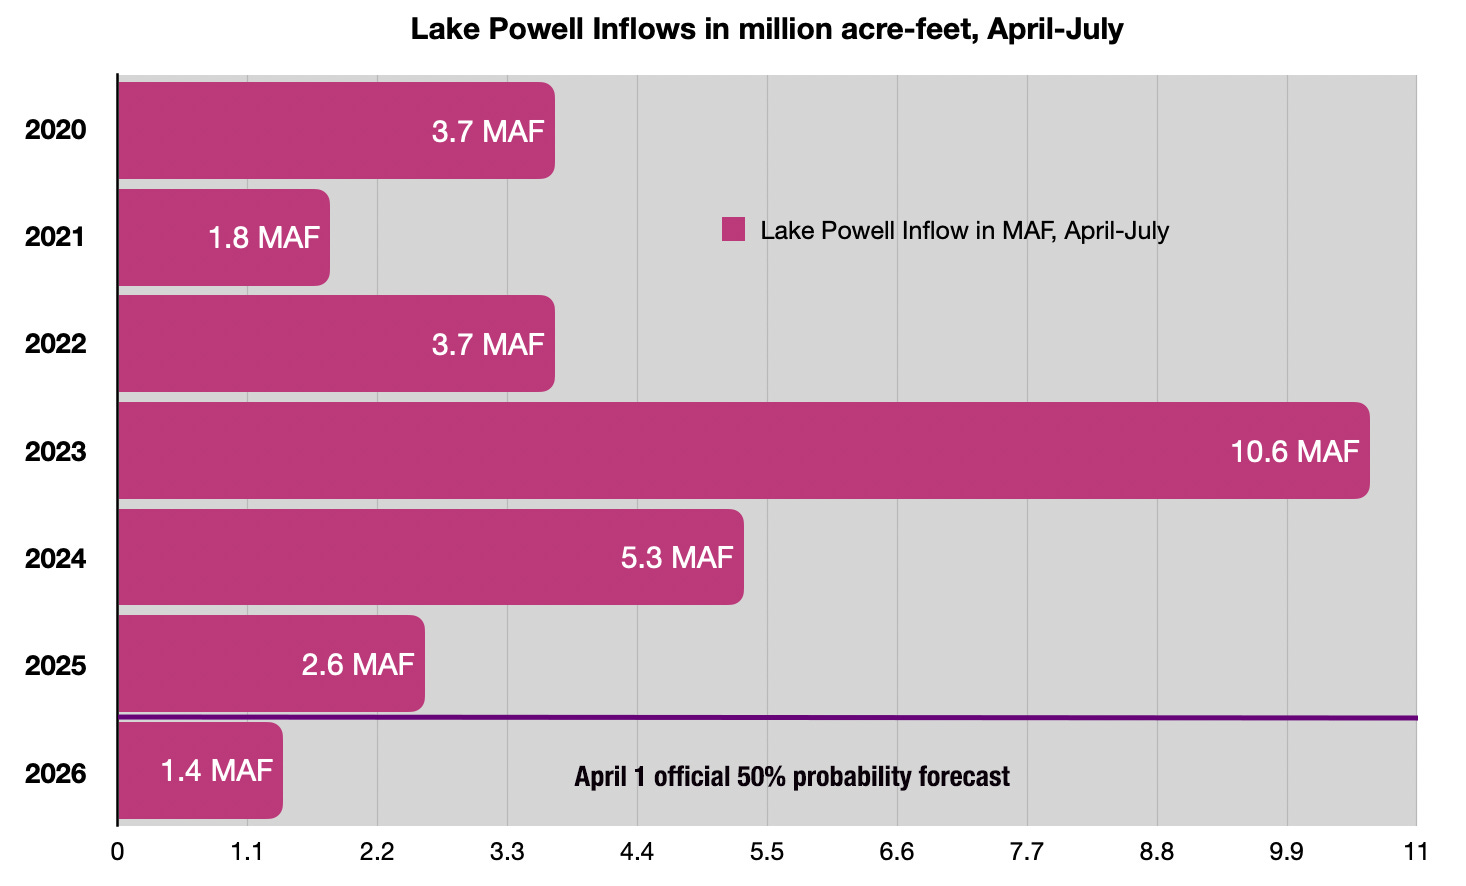
Believe it or not, that figure — the official 50% forecast, made by an actual person — may be optimistic. Over the last two weeks, the Ensemble Streamflow Prediction model (which is a constantly updating automated forecast) has come up with an even more dire outlook, downgrading the forecast to 1.16 MAF during that same time period.
Abysmal, indeed.
We’re also getting a little more information as to how the feds plan to address the crisis, at least in the near-term. Most significantly, they tentatively plan to “defend” minimum power pool at Glen Canyon Dam, which is to say they will do what it takes to keep the surface level of Lake Powell at or above 3,500 feet in elevation to avoid relying on the lower river outlets, which are not engineered for sustained use. The weapons they will use for this defense include:
- Reducing Lake Powell releases from the planned 7.48 million acre-feet to 6 million acre-feet.
- Releasing up to 1 MAF from the “Upper Initial Units,” which includes Flaming Gorge, Blue Mesa, and Navajo Reservoirs. Hydrology may make this impossible, however, meaning that these releases could be as low as
650 MAF.65 MAF (or 650,000 acre-feet).- For now, Interior is not asking for larger cuts from the Lower Basin (beyond the 1.5 MAF cuts they’ve already taken), which presumably means the feds will not reduce Lake Mead releases through Hoover Dam.
But will it be enough to avoid dipping below what I call de facto deadpool at Lake Powell? We won’t really know until later this summer, but a fairly simple calculation can help predict that future. Keep in mind that I’m no hydrologist, I’m just working with the numbers that are available to see whether potential inputs (Lake Powell inflows) are at least equal to planned outputs (Glen Canyon Dam releases).
I put together this little diagram to help visualize things. I know the text is tough to read in the email version, and especially if you’re reading this on your phone. So I’d suggest clicking on the image (or the headline of this post) and viewing it in the web version.
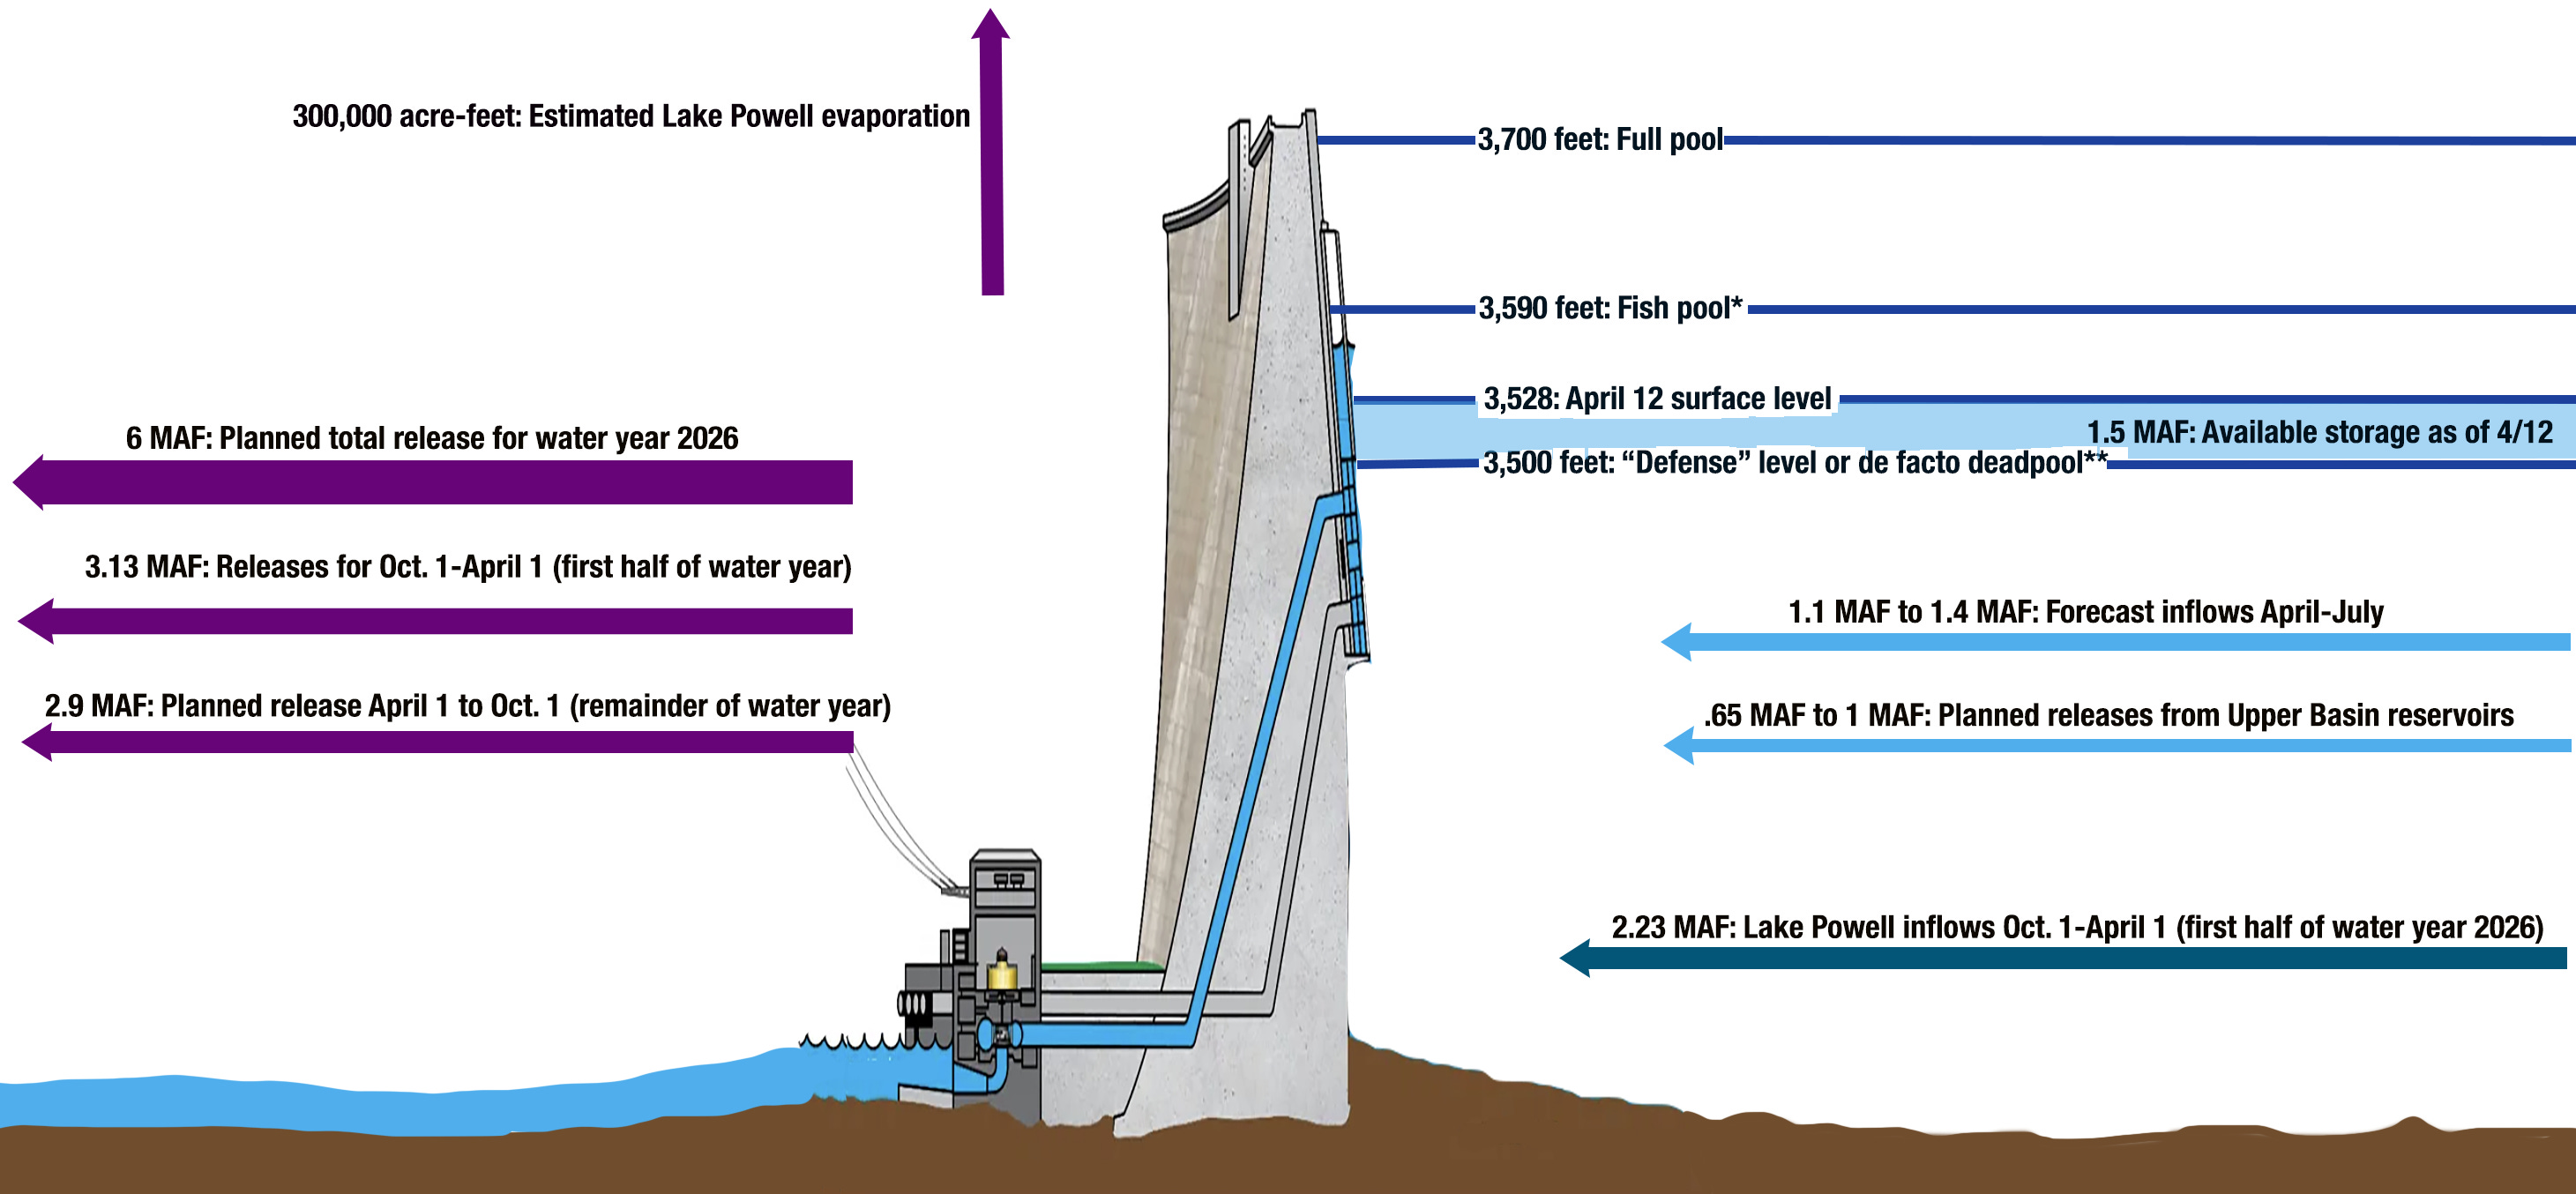
Here are the figures for the equation.
Inflows:
- 1.5 MAF: Lake Powell Storage available above 3,500 feet.
- 1.1 MAF to 1.4 MAF: Forecast Lake Powell inflows April-July
- .65 MAF to 1 MAF: Planned releases from upper basin reservoirs.
TOTAL INFLOWS: 3.25 to 3.9 MAF
Outflows:
- 2.9 MAF: April 1 – Oct. 1 releases to reach 6 MAF for the water year (3.13 MAF has already been released)
- .3 MAF: Rough estimate of evaporation from Lake Powell for the remainder of the water year.
TOTAL OUTFLOWS: 3.2 MAF
That gives us a whopping .05 to .7 million acre-feet to spare. That is cutting it close, folks; a hot, dry summer could drive evaporation levels up, and/or bring inflows down, shaving off the sliver of breathing room this affords. But unless the outlook dims considerably, the BoR should be able to avoid a run-of-the-river situation this year, which is good news. And, since Arizona likely will not be required to take more cuts this year, the state will probably hold off on doing a compact call and dragging the Upper Basin to court.
These measures, however, will have a variety of consequences, including:
- The Upper Basin reservoirs (Flaming Gorge, Navajo, Blue Mesa) are also likely to see record low inflows this year. That, combined with up to 1 million acre-feet of additional releases to benefit Lake Powell, will draw them down considerably, affecting hydropower production, irrigation, and, especially, recreation.
- Non-native smallmouth bass are abundant in Lake Powell, but since they are warmer-water fish, they tend to stay near the surface of the reservoir, meaning under normal conditions they stay well above the penstocks, or the outlets in the dam that lead to the hydropower turbines. However, as the surface drops closer to the penstock openings, so do the fish, allowing them to get flushed through the dam into the Colorado River. And because the water released from the dam is warmer (since it’s nearer to the surface), that warms the river downstream, allowing the bass to thrive and compete with the endangered native fish downstream. This is likely to be exacerbated as the surface level nears 3,500 feet.
- This year’s 6 MAF release from Glen Canyon Dam will bring the ten-year aggregate flows at Lees Ferry down to about 79 million acre-feet. This potentially puts the Upper Basin in violation of Article III of the Colorado River Compact, which mandates that the Upper Basin “not cause the flow of the river at Lee Ferry to be depleted below an aggregate of 75 million acre-feet” for any 10-year period. A 1944 treaty added another 7.5 million acre-feet to this figure to cover half of Mexico’s allotment, making for a total of 82.5 MAF over ten years. Note: The interpretation of this provision is in dispute.
- The diminished reservoir levels, combined with the reduced releases, will lead to lower hydropower output from the dam. That will force tribes, communities, and utilities that buy the relatively cheap power to purchase it on the open market. And it will also cut into power-sale revenues, which help fund endangered fish recovery programs.
- Reduced dam releases will mean lower flows, on average, through the Grand Canyon, affecting riparian ecosystems and boating.
- Reduced dam releases equate to lower flows into Lake Mead. Since the BoR apparently does not plan to cut releases from Hoover Dam, that reservoir will likely see its levels drop considerably, diminishing hydropower output and affecting recreation. My rough calculation suggests Lake Mead’s surface level will drop from the current 1,060 feet to about 1,030 feet, which would be lower even than in 2022. The BoR has suggested it will “defend” a level of 1,000 feet. That would almost certainly lead to Lower Basin shortages.

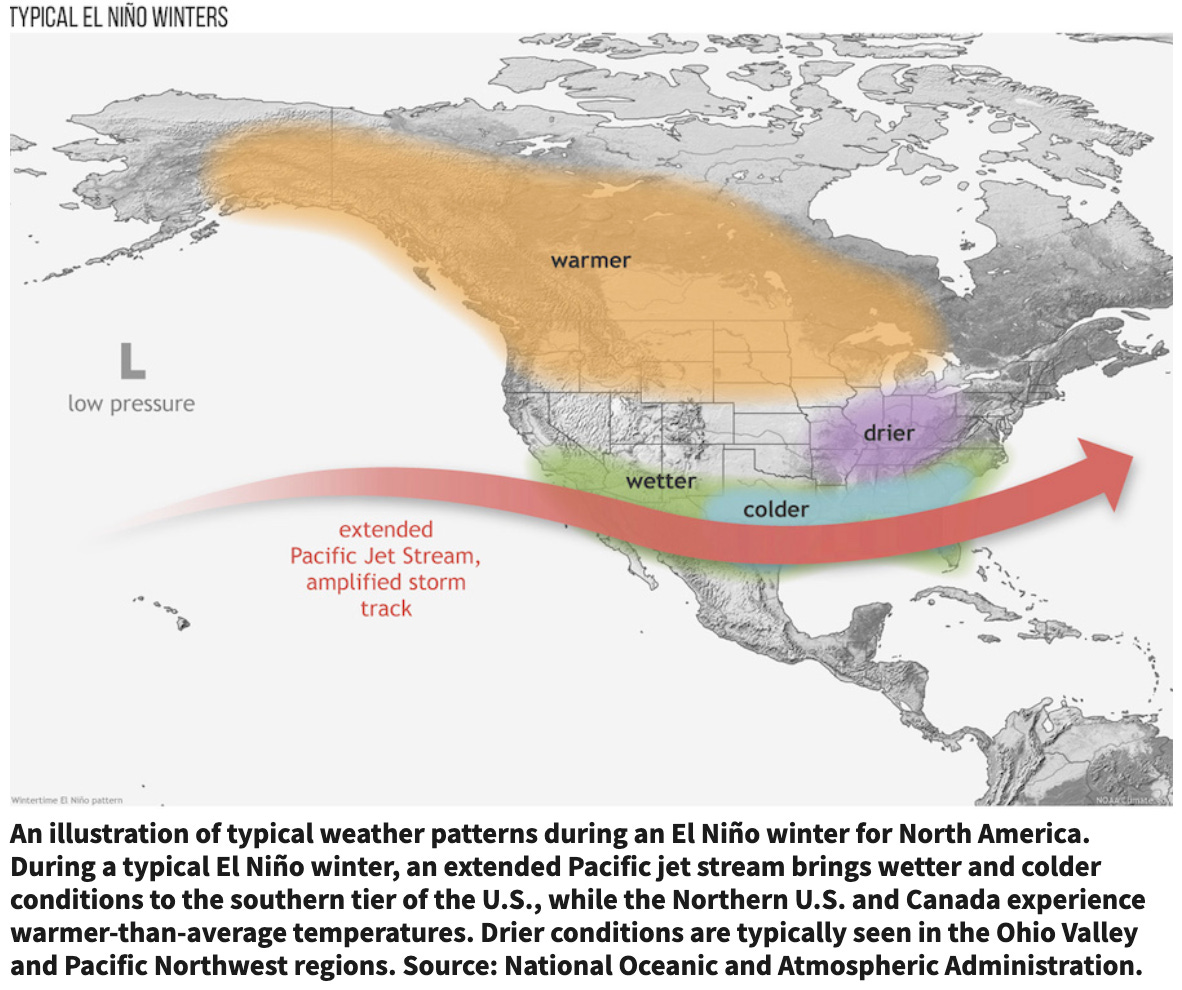
There is potentially good news on the horizon. Conditions are ripening up for a “super” El Niño to begin forming this summer. It’s difficult to predict how that will affect the Upper Colorado River Basin, but for now, forecasts are calling for a strong monsoon in the Southwest, beginning in July. That probably would not do much to bring up Lake Powell’s levels, but it would provide relief to the many farmers who are almost certain to lose irrigation relatively early this summer and may help keep late-summer megafires at bay. And, you never know, El Niño might just bring a monster winter just when we need it most.
A Colorado River glossary and primer — Jonathan P. Thompson
1 *The forecasts are for the “unregulated flow,” which means that it is an estimate of what the flow would be without upstream dams holding water back. This is not the same as “natural flow” which is a calculation of what the flow would be without upstream human consumptive use, dams, or diversions. In this case, actual inflow and unregulated inflow are almost the same.
