Climate change is significantly disrupting global coffee production by altering the specific environmental conditions—mild temperatures and predictable rainfall—that coffee plants require to thrive. These shifts are leading to reduced yields, lower bean quality, and a dramatic decrease in land suitable for cultivation.
Stock photograph of coffee beans provided by Storyblocks
Key Impacts on Coffee Production
Drastic Yield Reductions: Research indicates that for every increase in average air temperature, coffee production can decrease by approximately 14%. Top producers like Brazil, Vietnam, and Colombia have already experienced significant yield losses due to extreme heat and prolonged droughts.
Loss of Suitable Land: Projections suggest that up to 50% of the land currently used for coffee farming could become unproductive by 2050. This is forcing farmers to migrate to higher, cooler elevations, which is often limited by available terrain and can lead to further deforestation.
Accelerated Pest and Disease Spread: Warmer, wetter conditions are expanding the range of devastating threats like coffee leaf rust (a fungus) and the coffee berry borer (a beetle). These pests are now reaching higher altitudes that were previously too cool for them to survive, causing billions in damages.
Declining Bean Quality: Rising temperatures cause coffee cherries to ripen too quickly, resulting in smaller beans with less complex flavor profiles and lower acidity. This particularly threatens the specialty coffee market, which relies on the delicate Arabica variety.
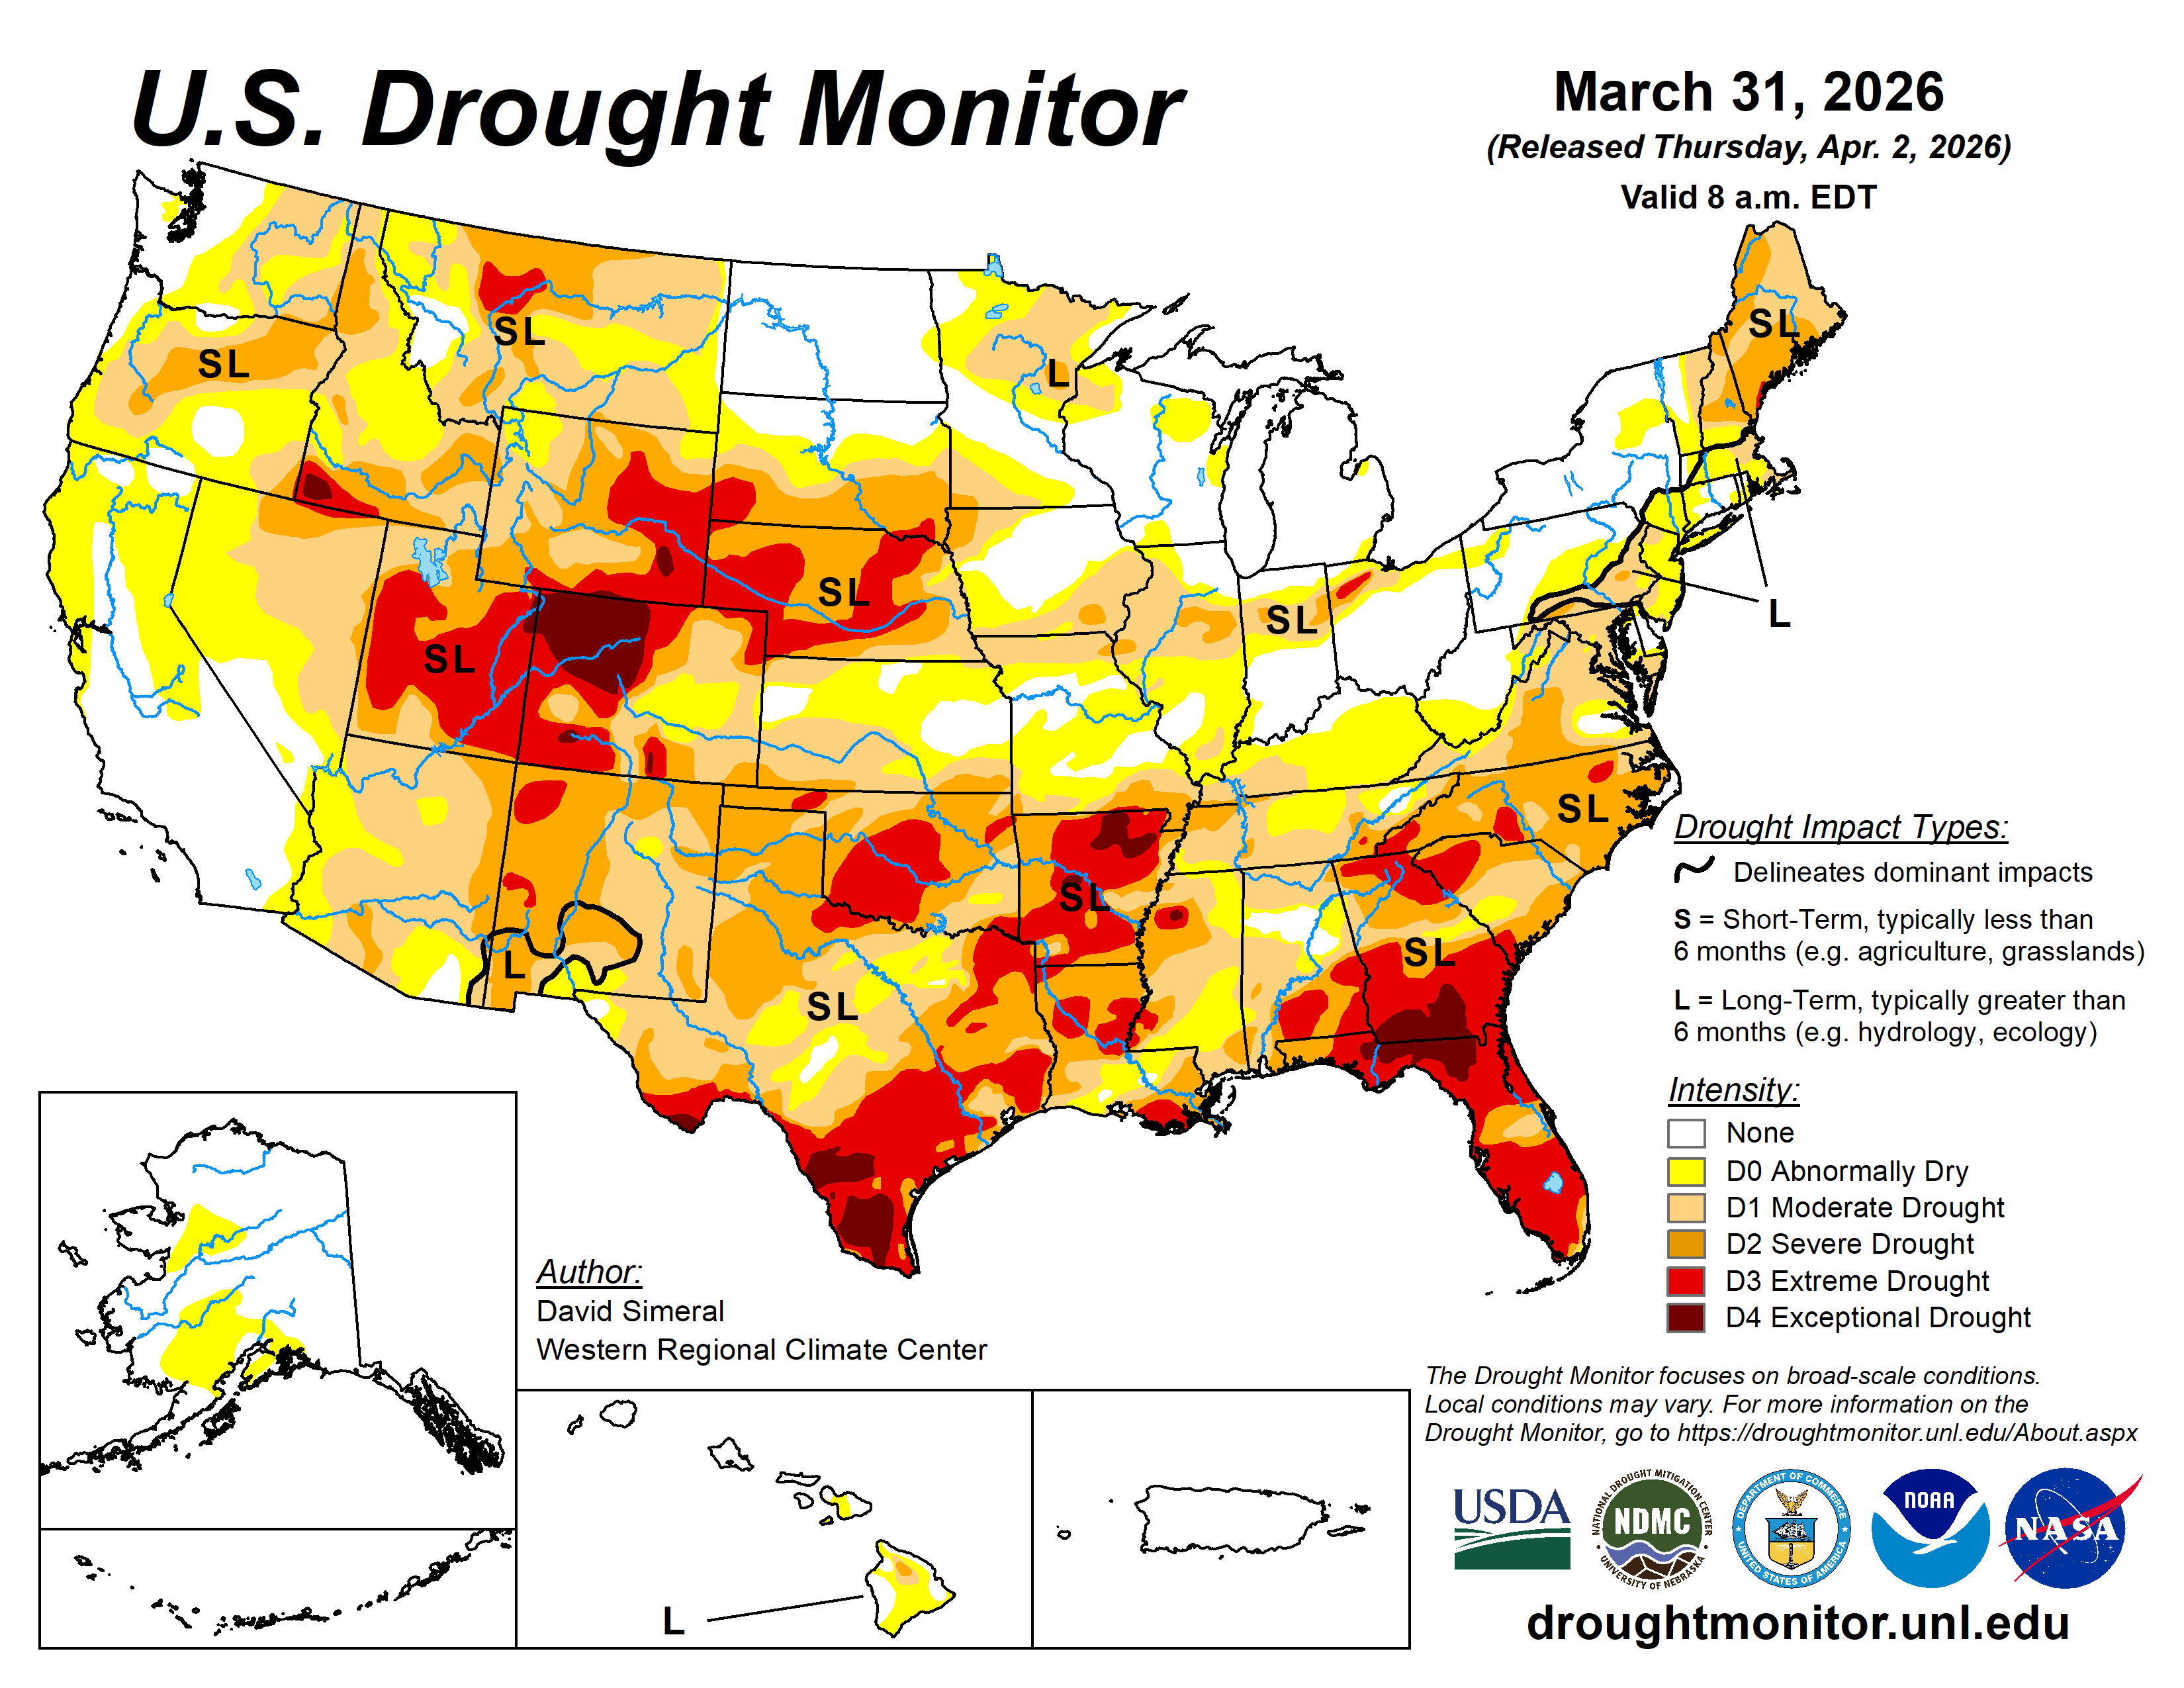
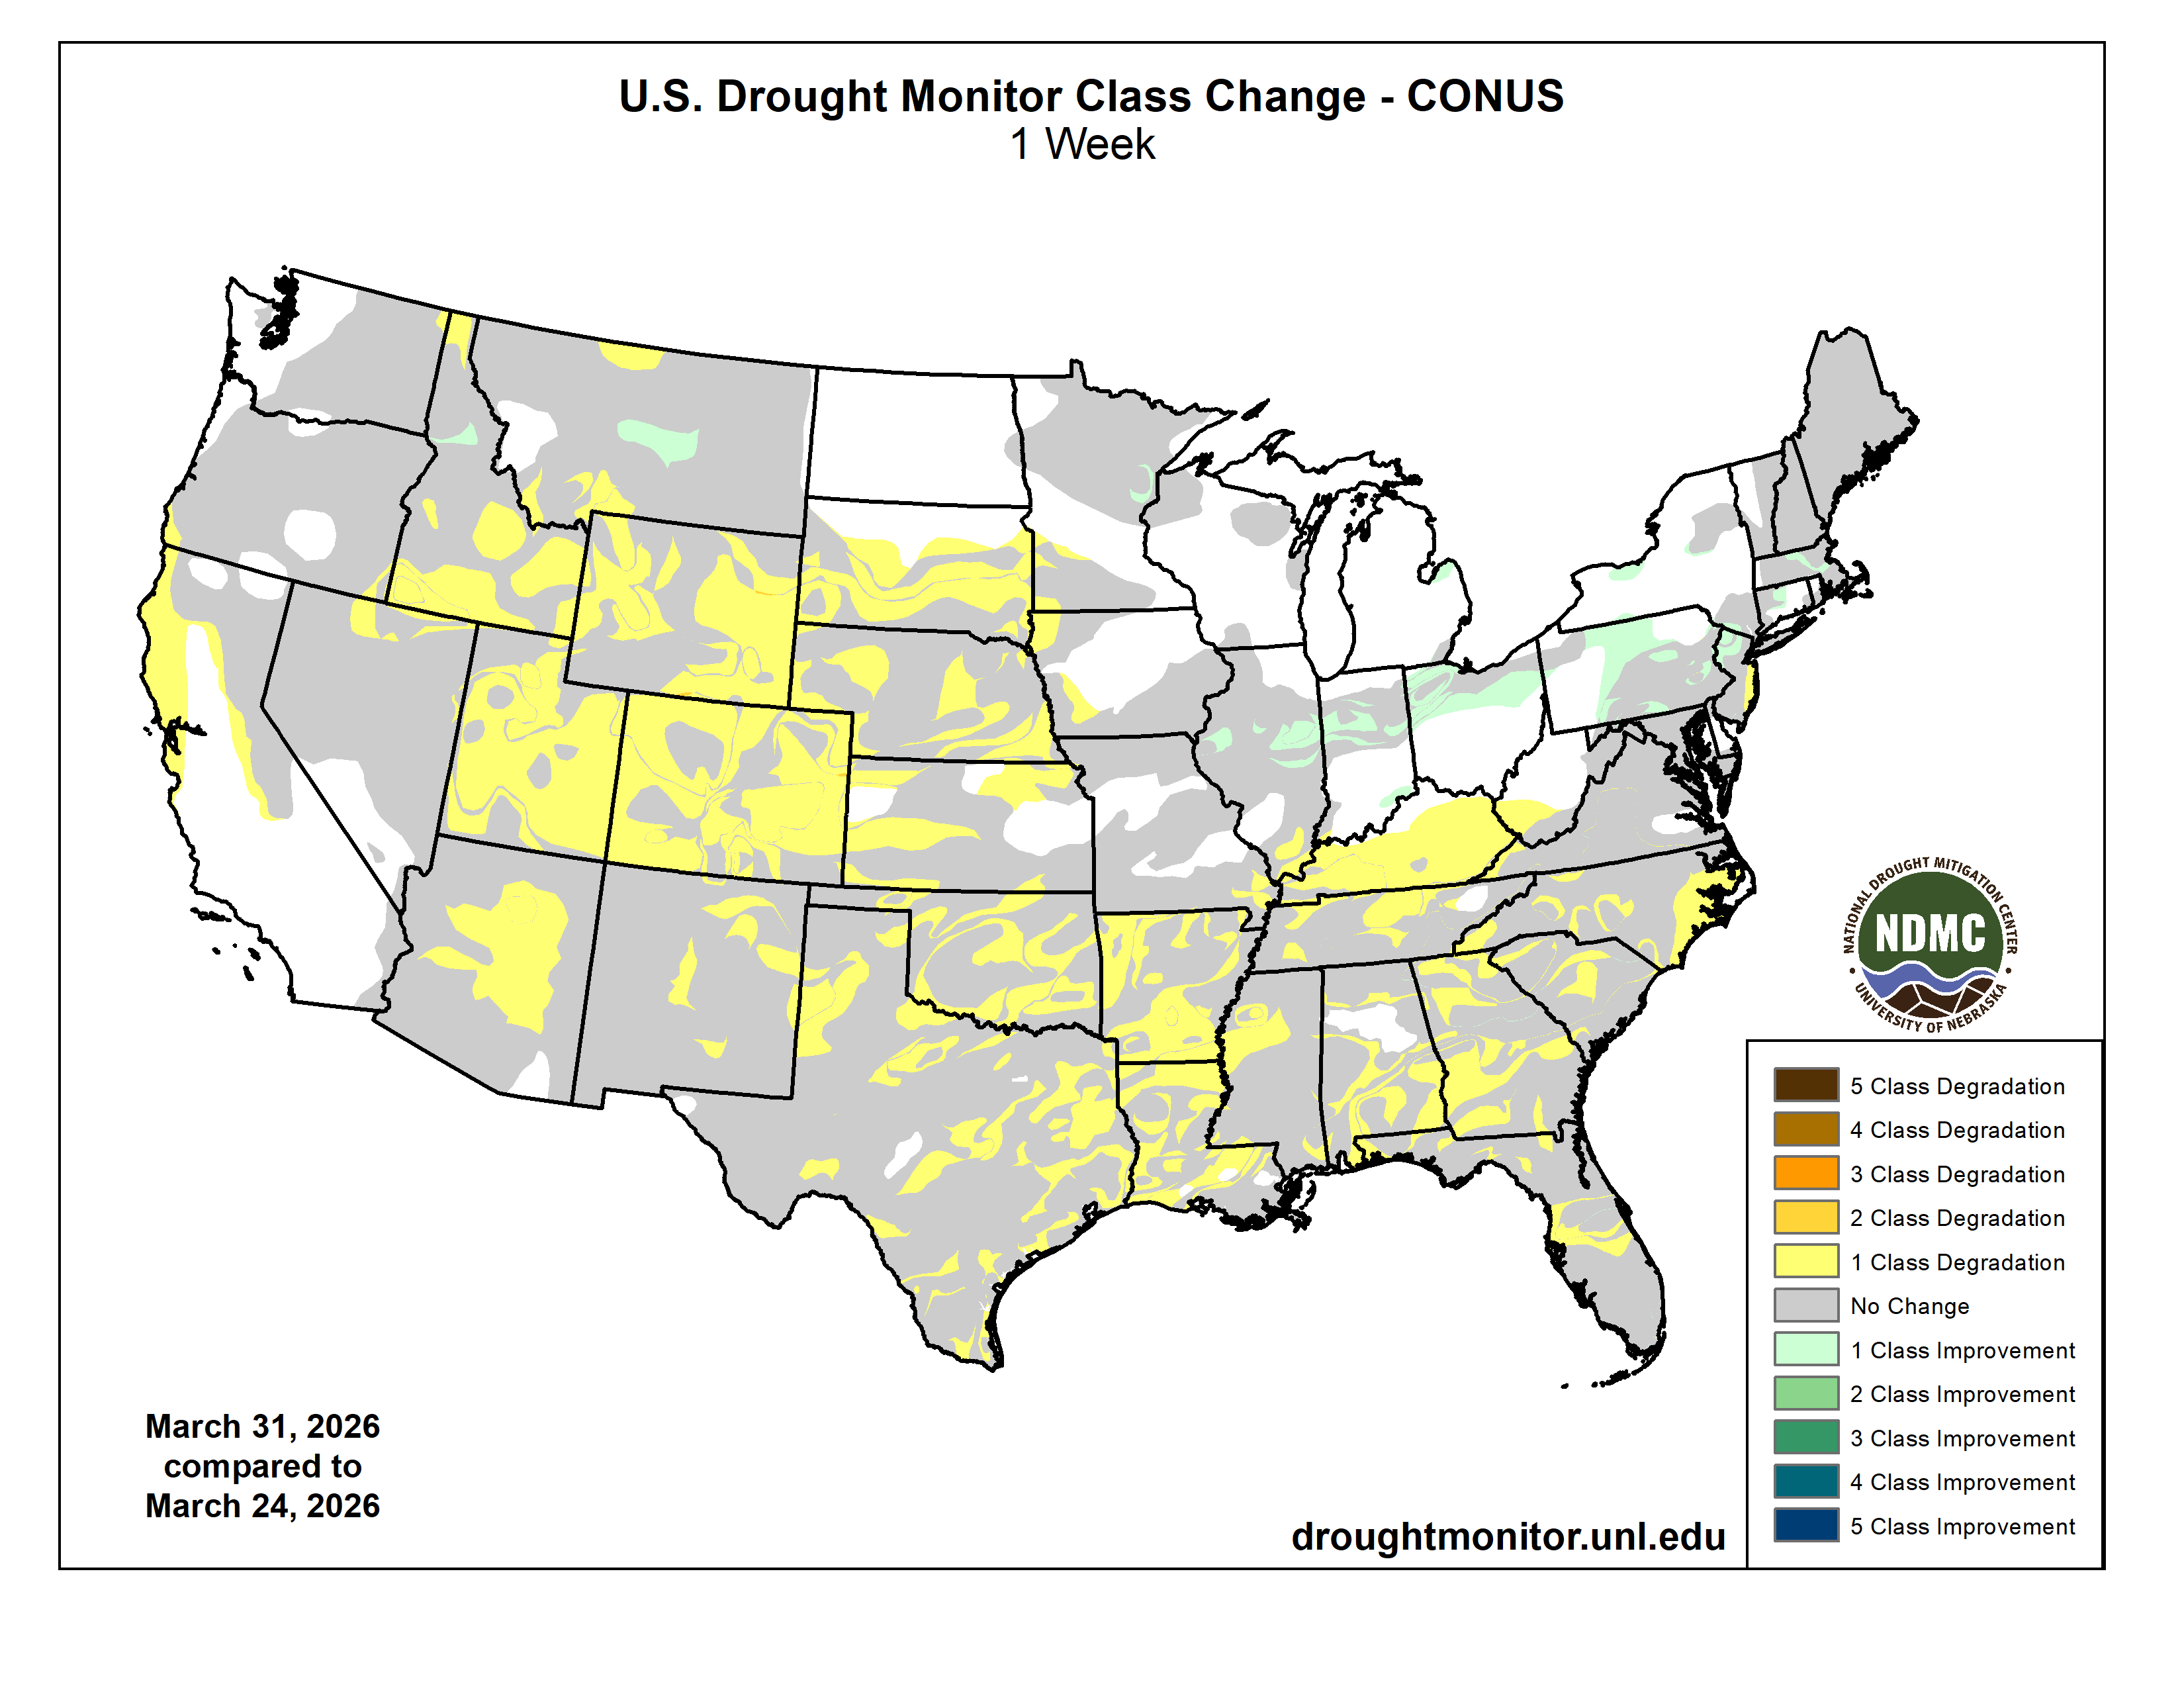
This U.S. Drought Monitor (USDM) week saw extensive degradations across areas of the West, Plains, South, and Southeast. Out West, widespread degradations were centered across the Intermountain West, including Colorado, Utah, Idaho, and Wyoming, and to a lesser extent across portions of Arizona, New Mexico, Nevada, and Montana. Continued degradations are expected in the coming weeks and months due to anomalous heat and record-low snowpack levels. In the Plains, drought expanded and intensified from Oklahoma to South Dakota. In the South and Southeast, dry conditions persisted this week, adding to significant longer-term (9- to 12+ month) precipitation deficits (ranging from 8 to 20+ inches), with the most severe drought conditions centered over portions of Texas, Arkansas, Georgia, and Florida. In the Northeast and Midwest, light-to-moderate rainfall (1 to 3 inches) during the past week led to targeted improvements in Illinois, Indiana, Ohio, Pennsylvania, and New York.
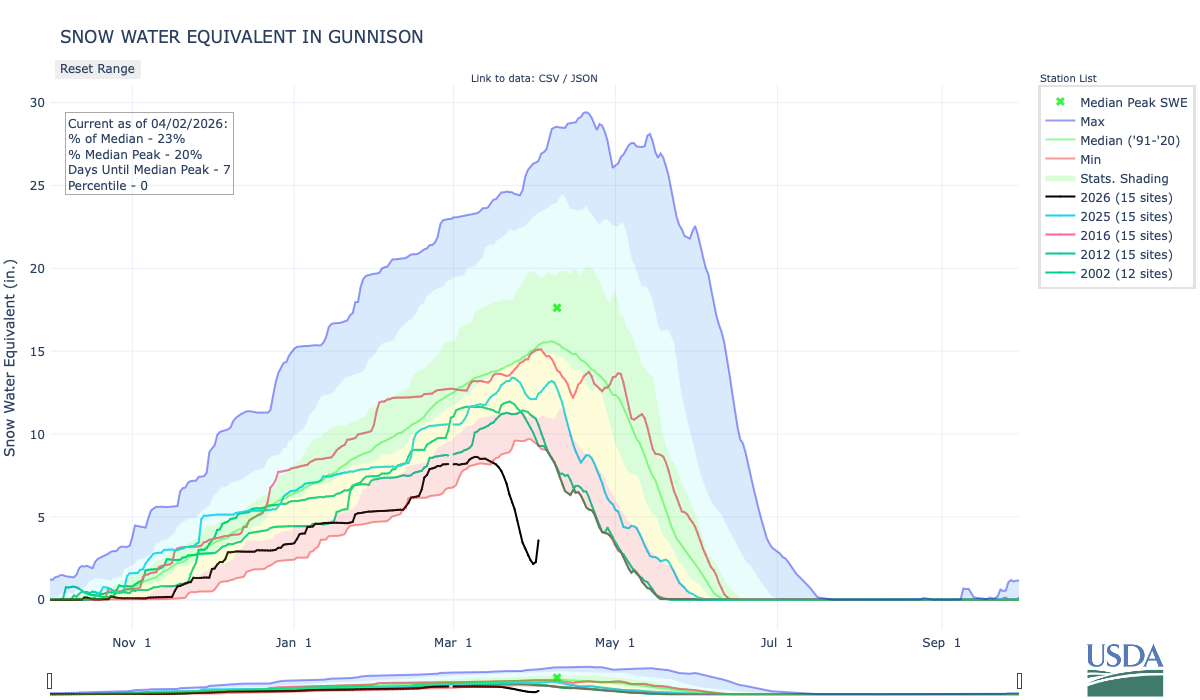
At the end of March, mountain snowpack conditions remain well below normal for the time of year, with record to near-record low levels observed across all western states. Additionally, many Natural Resources Conservation Service (NRCS) SNOw TELemetry (SNOTEL) network monitoring stations are reporting very shallow snow depths or no snow on the ground. Region-level (2-digit HUC) snow water equivalent (SWE) values (percent of median) are as follows: Pacific Northwest 55%, Missouri 56%, Upper Colorado 24%, Great Basin 18%, Lower Colorado 14%, Rio Grande 8%, and Arkansas-White-Red 8%. In California, statewide snowpack is 18% of normal (April 1), with the Southern Sierra at 32%, Central Sierra at 21%, and Northern Sierra at 6%. Despite poor snowpack conditions, California’s reservoirs remain at or above historical averages for the date (March 31), with Lake Shasta and Lake Oroville at 113% and 123% of average, respectively. In the Southwest, the U.S. Bureau of Reclamation (March 29) reports critically low levels at Lake Powell (24% full; 41% of average for the date) and Lake Mead (33% full; 52% of average for the date), with the total Colorado River system at 36% of capacity (compared to 41% at the same time last year)…
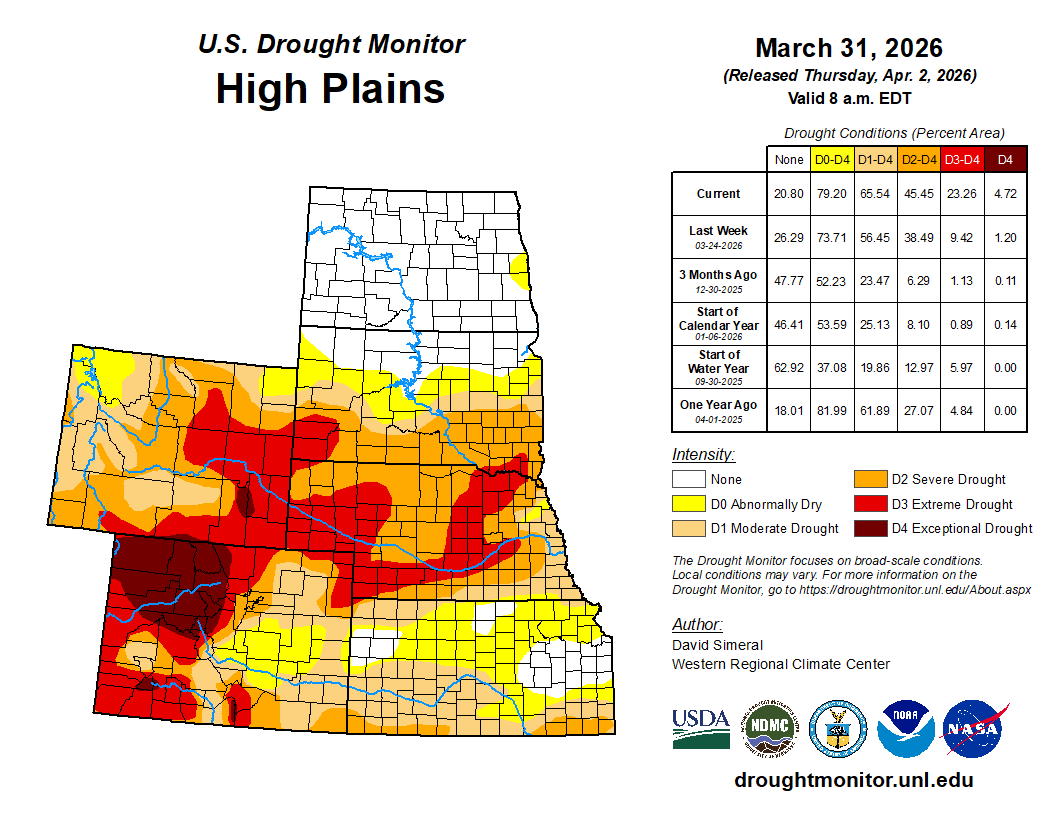
On this week’s map, widespread changes were made across the region in response to below-normal precipitation (time scales from 1 to 6 months), declining soil moisture, scattered low streamflows, elevated evapotranspiration rates, and associated anomalously warm temperatures—not only in recent weeks, but moving through the entire cool season. In South Dakota, record to near-record low streamflows have been observed during the last 120-day period as well as below-normal soil moisture levels observed at the South Dakota Mesonet monitoring stations. Additionally, the NDMC’s CMOR map shows numerous ag-related impact reports from the Black Hills region in southwestern South Dakota. For the week, the region was very dry with warmer-than-normal temperatures (3 to 15+ °F above normal) observed across much of the region, with the greatest anomalies observed in Nebraska and Kansas. Looking at climatological rankings for the past 90-day period (January 1 to April 1), several locations ranked among their warmest on record, including Grand Island, NE (warmest on record; +9 °F departure from normal); North Platte, NE (warmest on record; +10 °F); Rapid City, SD (warmest on record; +9 °F departure from normal); Goodland, KS (warmest on record; +11 °F departure from normal); and Dodge City, KS (warmest on record; +8 °F departure from normal)…
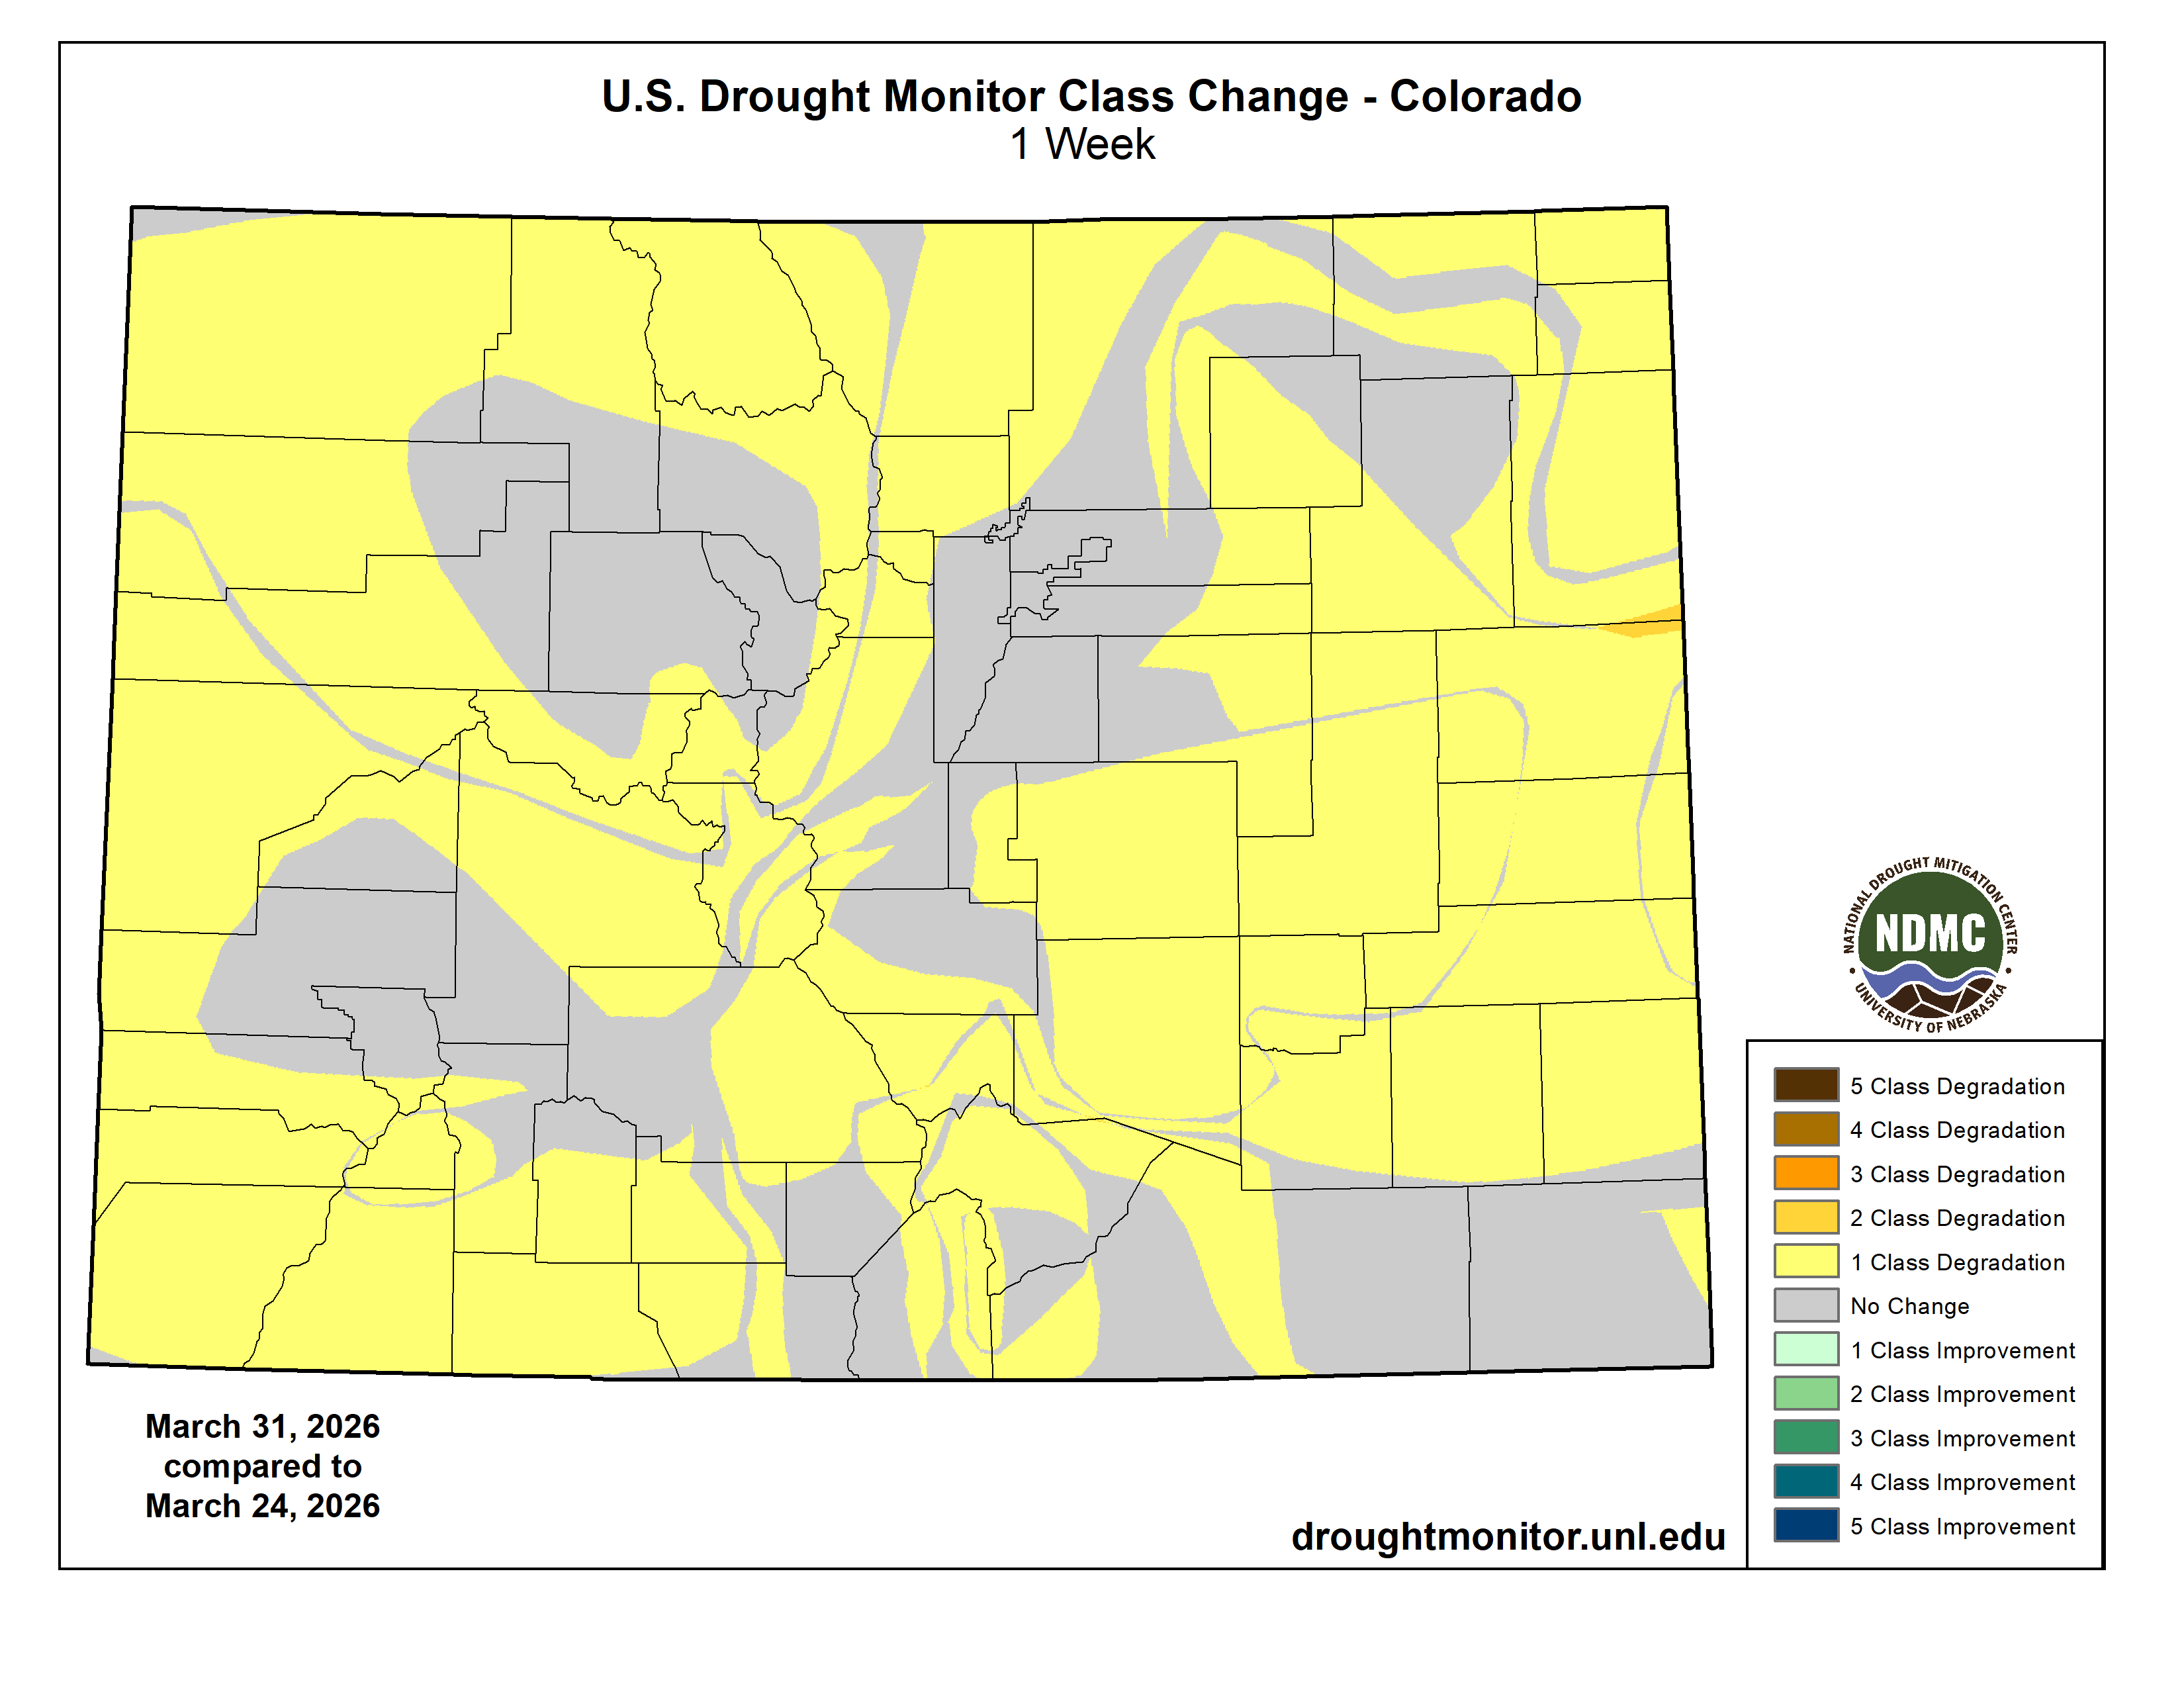
Colorado Drought Monitor one week change map ending March 31, 2026.
Conditions deteriorated significantly on the map this week in response to the combination of record to near-record heat and very poor snowpack conditions. The recent heat wave accelerated snowmelt across the region over the past few weeks, with many NRCS SNOTEL stations reporting little to no snow on the ground or unseasonably low levels. Peak runoff is occurring earlier than normal—or has already passed in some locations—raising concerns about reduced inflows into reservoirs moving through spring and into the summer months. In the Upper Colorado River Basin, Lake Powell is 25% full, while upstream reservoirs show mixed conditions, including Flaming Gorge (82% full), Blue Mesa (50%), and Navajo Lake (62%). In Rio Grande Basin in New Mexico, Elephant Butte is 12% full and Caballo Reservoir is 7% full. In Arizona, the Salt River Project reports the Salt River system at 56% full, the Verde system at 63%, and the combined system at 63% (compared to 70% last year)…
On this week’s map, widespread degradations were made in drought-affected areas of Texas, Oklahoma, Louisiana, and Arkansas, while isolated areas of Mississippi and Tennessee saw degradations. During the past 30-day period, the National Drought Mitigation Center’s Conditions Monitoring Observer Reports (CMOR) tool showed numerous impact reports across the region. For the week, dry conditions prevailed across the region. Looking at climatological rankings for the past 90-day period (December 31 to March 31), several locations ranked among their driest on record, including Austin, TX (4th driest; -5.53 inches), Brownsville, TX (driest on record; -3.38 inches), Oklahoma City, OK (driest on record; -3.61 inches), Monticello, AR (driest on record; -8.95 inches), and Jackson, MS (driest on record; -7.4 inches). In Texas, Water for Texas (April 1) reports statewide reservoirs at 73.5% full, with eastern reservoirs in good condition while many western and southern reservoirs remain below normal, including Falcon Reservoir (19% full). Average temperatures for the week were above normal across the region (3 to 15+ °F) with dry conditions prevailing…
Looking Ahead
The NWS Weather Prediction Center 7-Day Quantitative Precipitation Forecast (QPF, liquid equivalent) calls for precipitation accumulations generally ranging from 2 to 4 inches across eastern portions of the Southern Plains, Midwest, and Northeast, with the heaviest totals along a corridor from eastern Texas through the Lower Mississippi Valley into portions of the Upper Mississippi Valley. In the Southeast and Mid-Atlantic, light-to-moderate liquid precipitation accumulations ranging from 0.5 to 2 inches are expected. Across the High Plains, light-to-moderate liquid precipitation accumulations ranging from 0.5 to 2 inches are expected, with the greatest totals across portions of the Dakotas. In the West, light-to-moderate liquid precipitation accumulations are expected across areas of the region, with the highest totals across portions of the Pacific Northwest, northern California, and southern Oregon. In the higher elevations, snow is expected across the Sierra Nevada, southern Cascades, northern Great Basin, and portions of the central and northern Rockies. Dry conditions are expected to prevail across much of the Southwest, including areas of southern California, southern Nevada, Arizona, and New Mexico.
The 6–10-day temperature outlook (valid April 7–11, 2026) calls for above-normal temperatures across much of the western U.S., Southern Plains, and areas of the South, with the highest probabilities centered over the California, Nevada, Utah, and Arizona. Below-normal temperatures are favored across the Northern Plains as well as the New England. Near-normal temperatures are expected across much of the eastern U.S., including the Mid-Atlantic and Southeast, as well as portions of Texas. In terms of precipitation, the 6–10-day outlook calls for above-normal precipitation across areas of the eastern half of the western U.S., Plains states, South, much of the Midwest, and Florida. Below-normal precipitation is favored across portions of the Mid-Atlantic and southern extent of New England. Near-normal precipitation is expected across areas outside of these regions, including portions of the western U.S. and Southeast.
US Drought Monitor one week change map ending March 31, 2026.
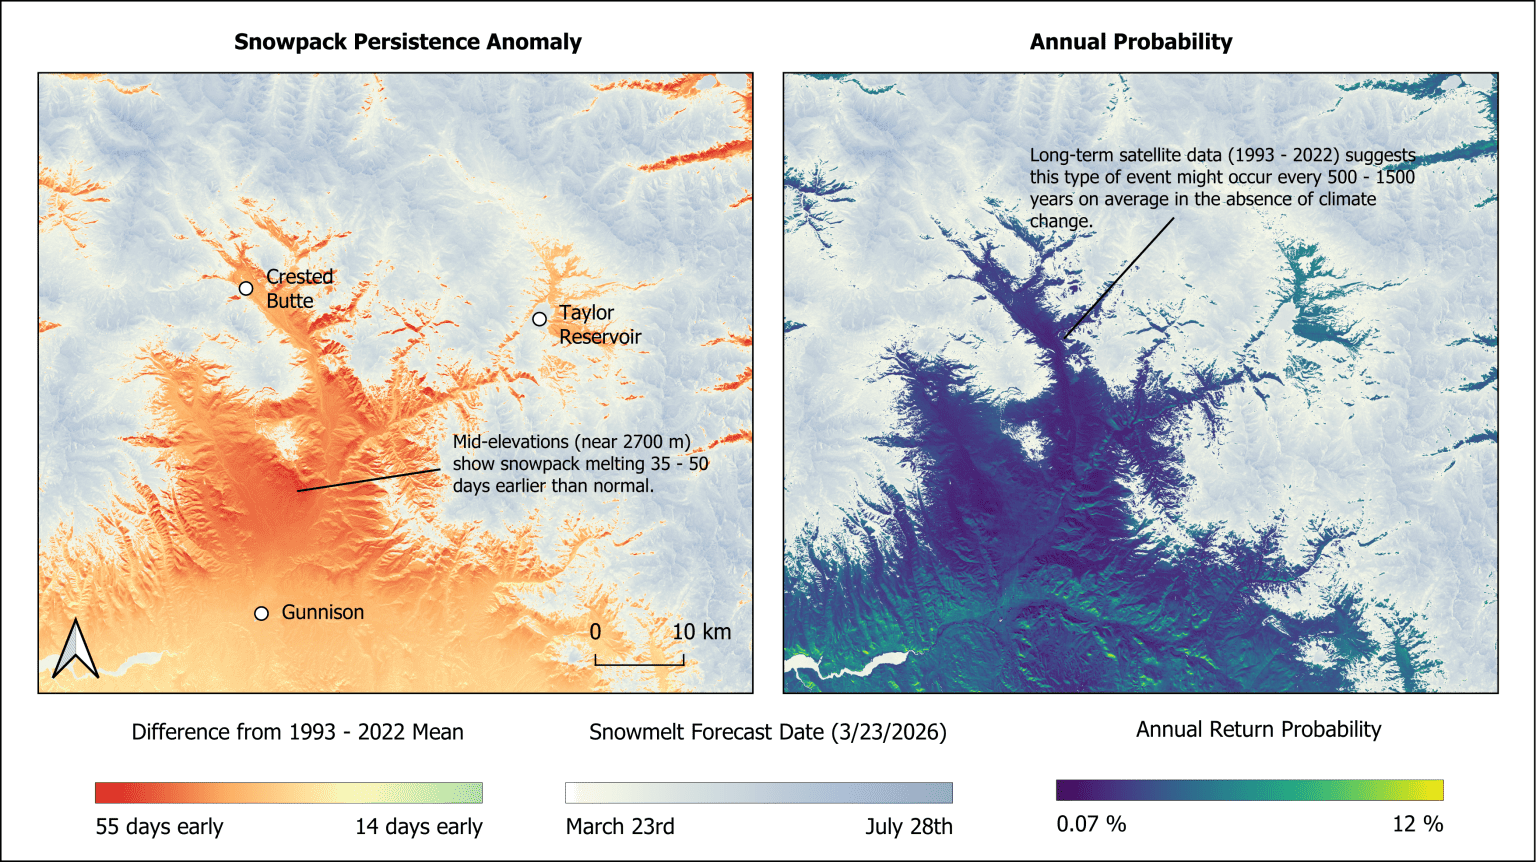
GOTHIC, Colorado, April 1, 2026 — The Rocky Mountain Biological Laboratory (RMBL) reports that, as of late March, spring 2026 snowpack surrounding its Gothic, Colorado, campus was at its lowest level recorded in more than 50 years of observations. In the absence of recent climate change, these conditions likely would occur only once every 200 to 1,000 years.
This new analysis by RMBL Principal Research Scientist Ian Breckheimer, PhD, draws on long-term field datasets and 40 years of satellite imagery that track the seasonal disappearance of mountain snowpack — a vital water resource for the ecosystem and the primary source of water in the drought-stricken Colorado River.
According to Breckheimer’s findings, at most sites in the Gunnison Basin, the 2026 snowpack levels and timing of snowmelt are far outside the historic range of variability:
Gunnison Valley slopes and lower elevations: a 1-in-60- to 300-year event
Crested Butte valley bottoms: a 1-in-300- to 400-year event
Mid-slopes of Flat Top Mountain and surrounding areas: a 1-in-500- to 1,000-year event
When accounting for recent climate change, which has caused snowpack to melt 3 to 5 days earlier each decade since 1993 at many sites, the likelihood of this year’s low snowpack level increases. However, it is still rare, with an estimated chance of occurring just once in 25 to 50 years. Moreover, at mid-elevations (between 8,000 and 9,000 feet), low snowfall and warm temperatures have combined to completely melt the current year’s snowpack 35 to 50 days earlier than the historical average. Although storms this week are bringing significant new snow to the higher peaks in the Gunnison Basin, sites where snowpack has already disappeared (most sites below 9,000 feet elevation) will receive mostly rain from this event.
“This is not the new normal,” says Breckheimer, “but it is exactly the kind of extreme event that will test how prepared our ecosystems and communities are for increasing variability.”
The research underscores the importance of long-term ecological observation. RMBL, which sits at an elevation of nearly 10,000 feet in Gothic, Colorado, hosts one of the most well-studied mountain ecosystems in the world, with decades of continuous data on snowpack, hydrology, and ecological response. These datasets make it possible to place current conditions into historical context and estimate how common they might be with and without recent observed climate change.
The implications extend beyond the Gunnison Valley. Snowpack dynamics directly influence water availability, wildfire risk, ecosystem health, and agricultural systems across the western United States. Understanding when and how these extremes occur is critical for forecasting and planning.
“This kind of insight is only possible because of long-term, place-based science,” says RMBL Executive Director Jeni Blacklock. “What we are seeing this year highlights both the value of these datasets and the urgency of continuing to invest in them.”
The findings were first presented during RMBL’s public Après Science talk series, which connects scientists and the public around emerging research in mountain ecosystems. A video of the talk, held on March 25, as well as supporting materials, will be released in the coming weeks. Sign up at rmbl.org/newsletter-sign-up to receive updates delivered via RMBL’s monthly e-newsletter.
Still image of the upper East River Valley from billy barr’s webcam, taken March 30, 2026, courtesy of Ian Breckheimer
About the Rocky Mountain Biological Laboratory Founded in 1928, RMBL is among the oldest and most respected field stations in the United States. Located in Gothic, Colorado, RMBL supports more than 200 scientists and students each summer and hosts one of the most extensive collections of long-term ecological data in the world.
Media notes:
Media contact: Suzanne Ennis, RMBL communications manager. Email: suzanne@rmbl.org
Additional slides and data visuals available upon request
Video of presentation available soon
Interviews available with Ian Breckheimer and RMBL leadership
L to R: Jennifer Rudgers, Stephanie Kivlin, Aimée Classen, and Lara Souza at the Rocky Mountain Biological Laboratory site in Colorado. Photo provided
SACRAMENTO, Calif. – The Department of Water Resources (DWR) today conducted the critical April snow survey at Phillips Station and found no measurable snow, a stark indicator of how record‑hot March temperatures and high‑elevation rain have erased the Sierra Nevada snowpack months ahead of schedule. The combination of warm storms and unusually hot temperatures rapidly melted what remained of this year’s already sparse snowpack. Statewide, the snowpack is now just 18 percent of average for this date, according to the automated snow sensor network.
Today’s results are the second lowest April measurement on record for Phillips Station, largely because there was still some visible snow on the ground. By contrast, the lowest April reading occurred in 2015 when no snow was present at the site. Although DWR and its partners in the California Cooperative Snow Surveys Program are completing additional surveys across the Sierra Nevada, preliminary data indicates this year’s April 1 snowpack is the second lowest on record.
The April measurement is a critical marker for water managers across the state, as it is typically when the snowpack reaches its maximum volume and begins to melt. However, this year’s extremely hot and dry conditions throughout the month of March, along with a warm atmospheric river system in late February, initiated snowmelt several weeks ahead of schedule. According to automated sensors across the Sierra Nevada, this year’s statewide snowpack likely reached its peak on or near February 24.
“It feels like we skipped spring this year and dropped straight into a summer heatwave,” said DWR Director Karla Nemeth. “What should be gradual snowmelt happened suddenly weeks ago. To me, this is another reminder that aging water systems need to be retrofit for more volatile precipitation patterns. We’re seeing fewer, warmer storms and shorter wet seasons. Future water supplies will depend upon our ability to capture water when it’s available and manage it more efficiently.”
DWR’s water supply forecasts use data from the April 1 snowpack to calculate how much snowmelt runoff will eventually make its way into California’s rivers and reservoirs. This information is critical for reservoir managers, who must balance flood control and water supply goals through the winter and depend on snowmelt to slowly refill reservoirs as demand increases during the dry season.
Given the unprecedented heatwave across the West in March, DWR and its partners expanded monitoring efforts to better track this year’s rapid snowmelt, including 100 additional mid-month snow surveys across 18 critical watersheds. The California Cooperative Snow Surveys Program has also been working closely with partner agencies to monitor the snowmelt and ensure water managers have the information they need to make informed water management decisions.
DWR has focused efforts over the past five years to understand and track how snowpack accumulation and melt translates into water supply, which has aided efforts to forecast runoff in new extreme climate conditions. New snow hydrology modeling in key watersheds gives DWR better insights into the changing physical state of the snowpack. Expanding data collection efforts with Airborne Snow Observatories Inc. and academic research partners, including UC Berkeley’s Central Sierra Snow Lab, now also allow DWR to consider factors like changes in soil moisture and snowpack temperature in its runoff forecasts.
“What makes this year stand out is the disconnect between precipitation and snowpack,” said Andy Reising, manager of DWR’s Snow Surveys and Water Supply Forecasting Unit. “We received near-average precipitation in many parts of the state, but much of it fell as rain instead of snow. That led to one of the lowest April snowpacks on record and one of the earliest peaks we’ve seen in decades — conditions that make forecasting runoff more complex.”
Although some additional snow is forecasted to arrive in the coming days, it is not likely to make up for the rapid snowmelt and hot, dry March. In the Northern Sierra Nevada, where the state’s largest water supply reservoirs are located, the snowpack is just 6 percent of average.
Measuring California’s snowpack is a key component of water management. On average, California’s snowpack supplies about 30 percent of California’s water needs. Its natural ability to store water is why California’s snowpack is often referred to as California’s “frozen reservoir.”
The data and measurements collected from DWR and its partners with the California Cooperative Snow Surveys Program help inform the water supply and snowmelt runoff forecasts, known as the Bulletin 120, that help water managers plan for how much water will eventually reach state reservoirs in the spring and summer. This information is also a key piece in calculating State Water Project allocation updates each month. Learn more about how snow melt makes its way into State Water Project reservoirs each spring.
DWR conducts four or five snow surveys at Phillips Station each winter near the first of each month, January through April and, if necessary, May.