Click on a thumbnail graphic to view a gallery of drought data from the US Drought Monitor website.
Click the link to go to the US Drought Monitor website. Here’s an excerpt:
This Week’s Drought Summary
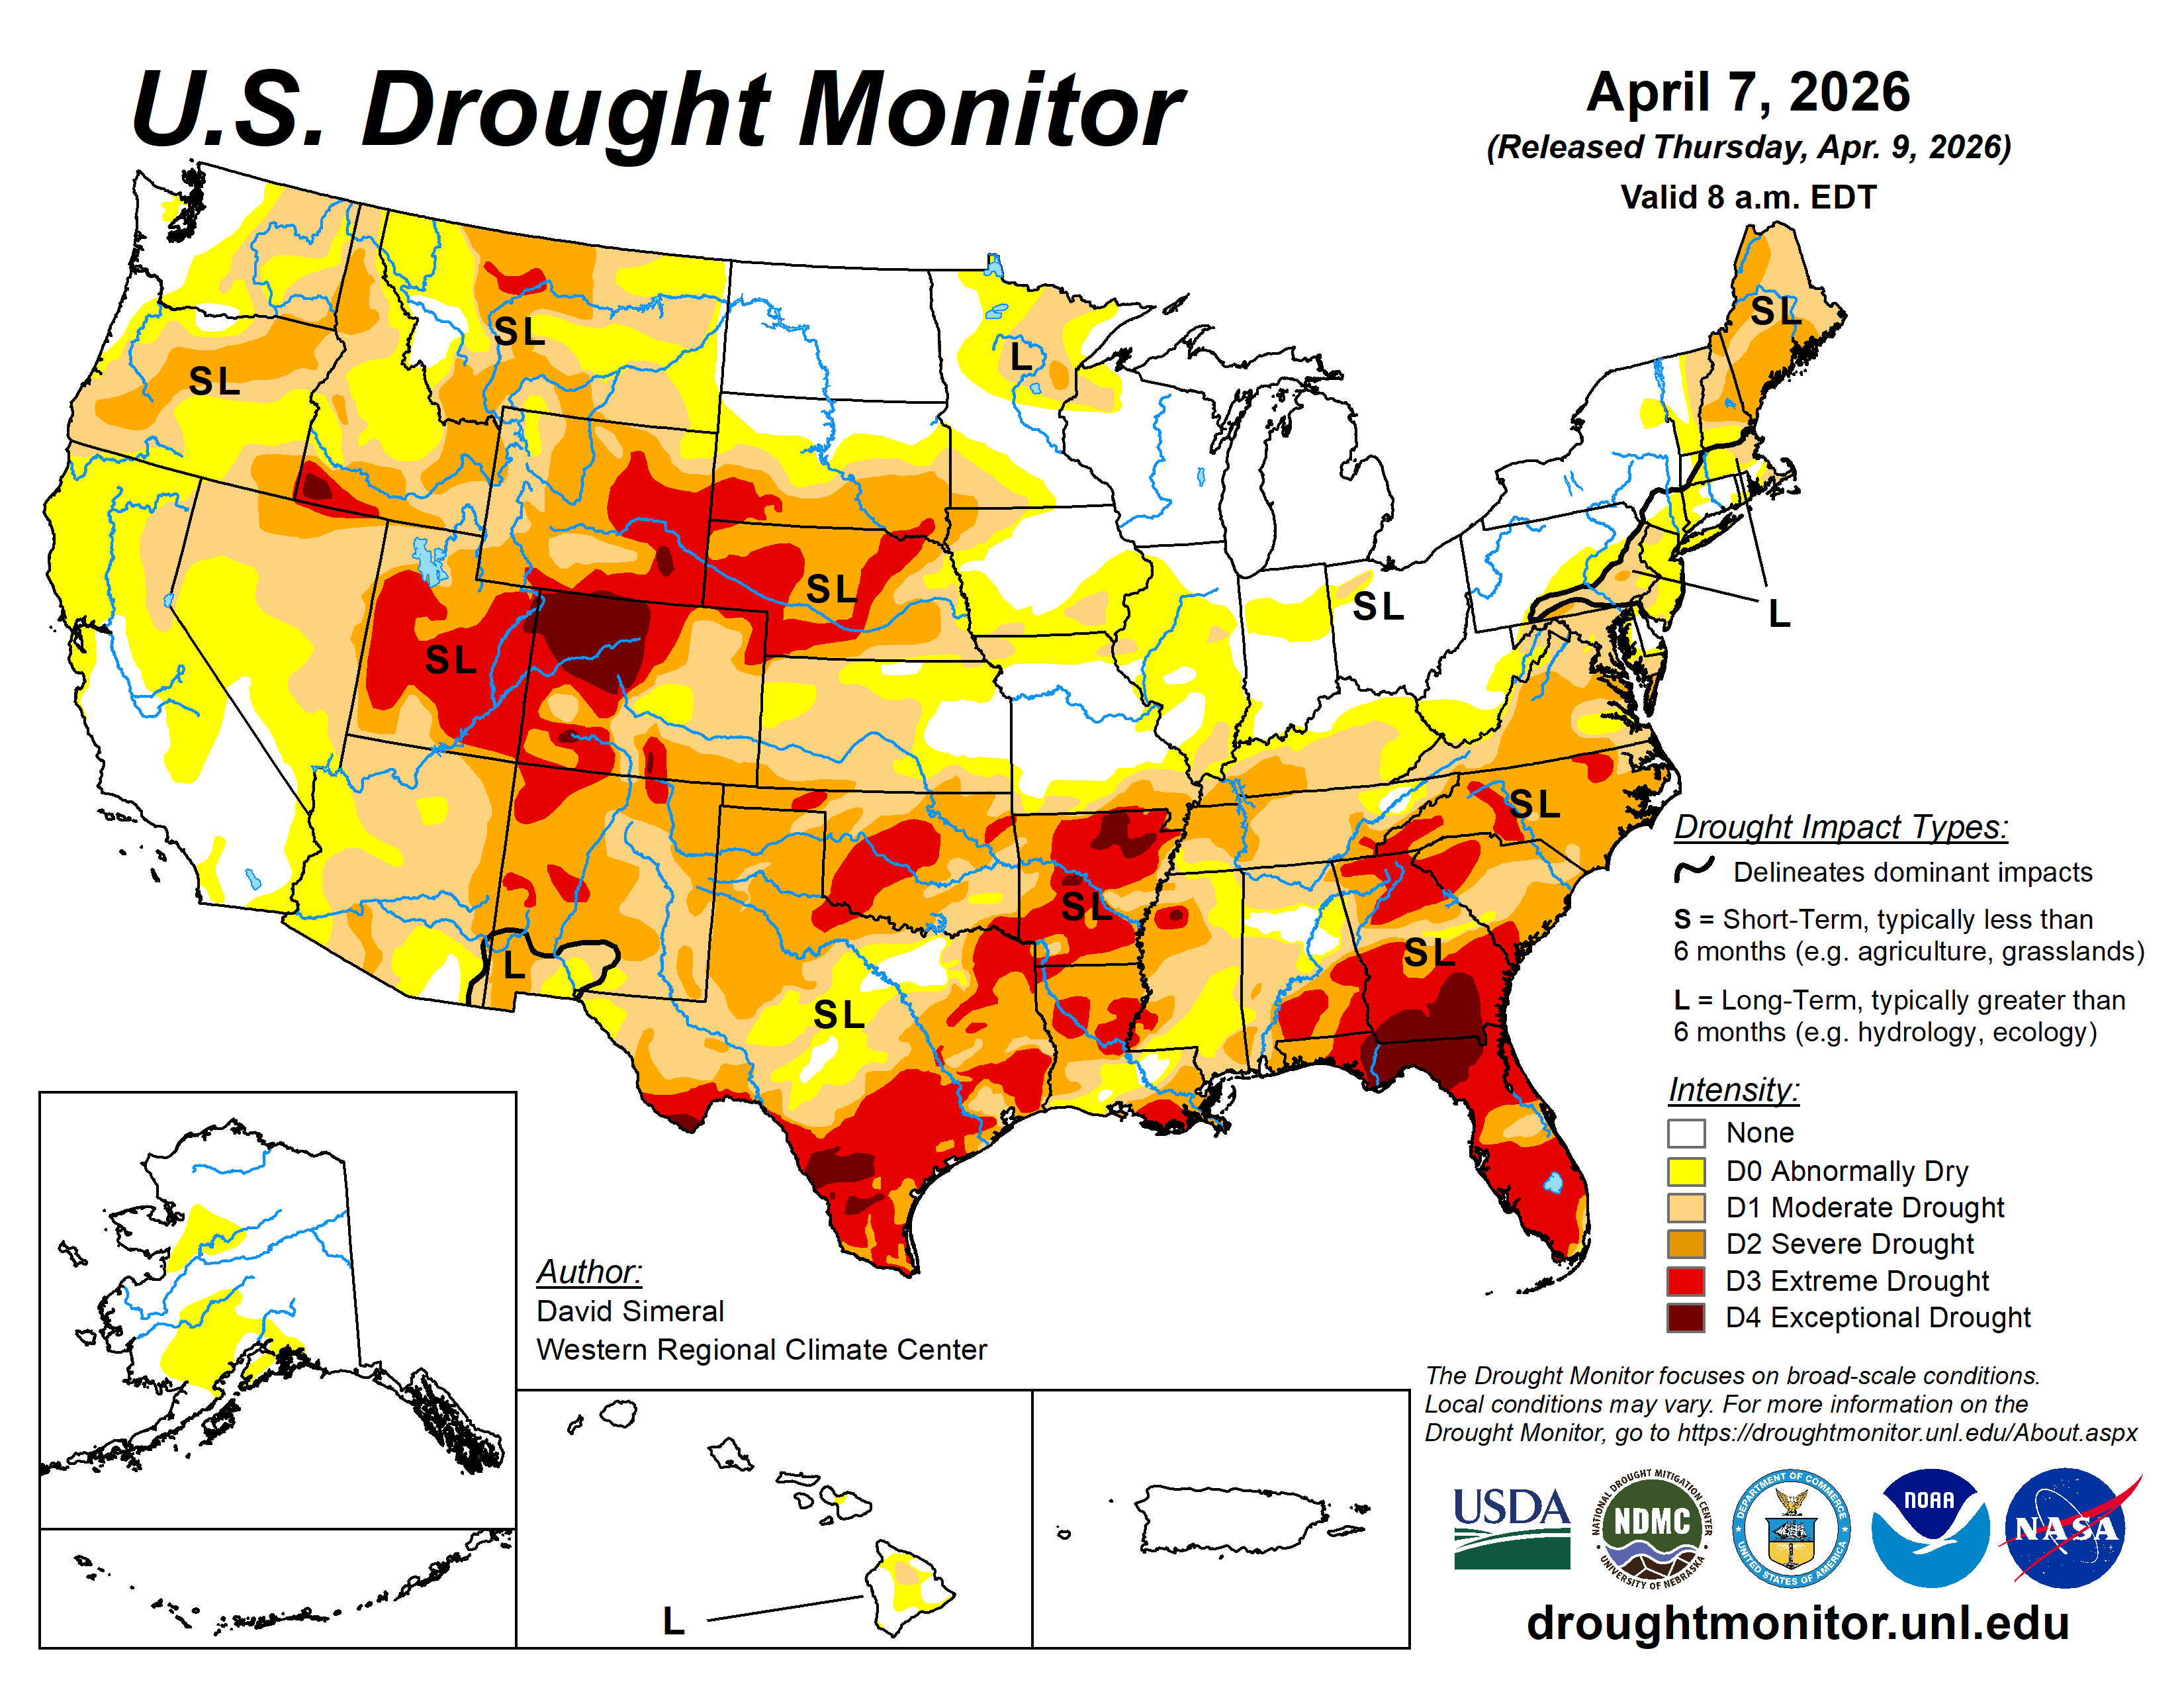
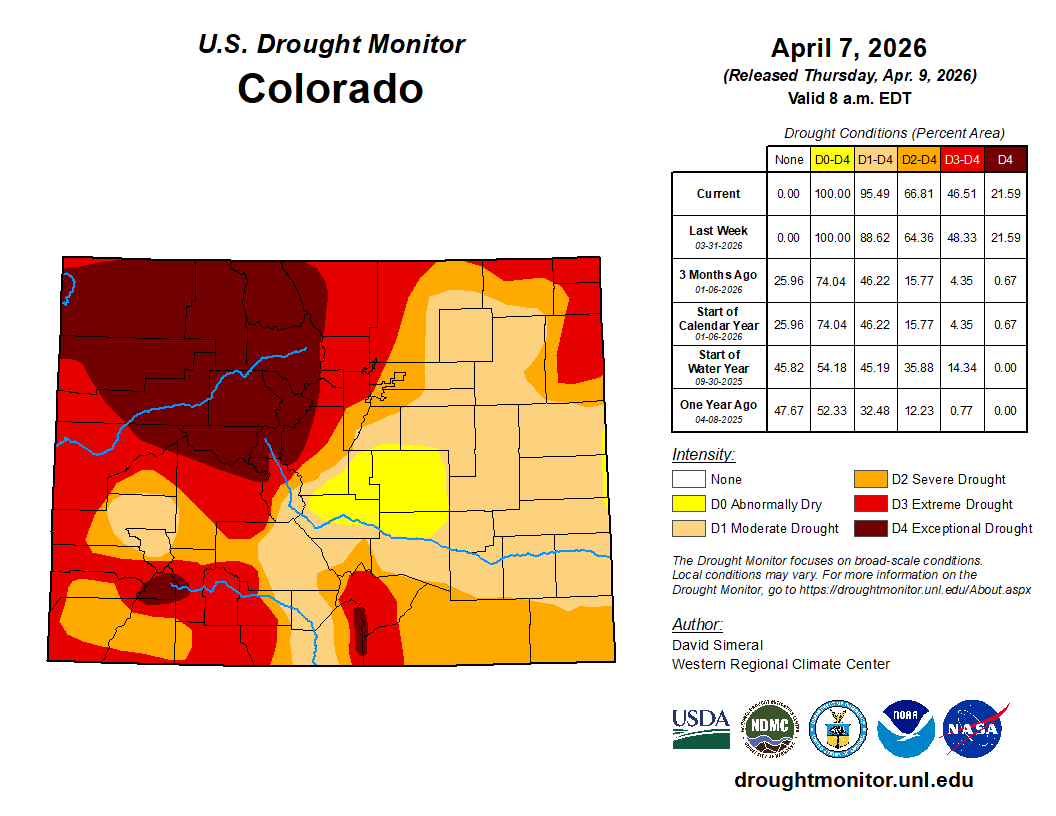
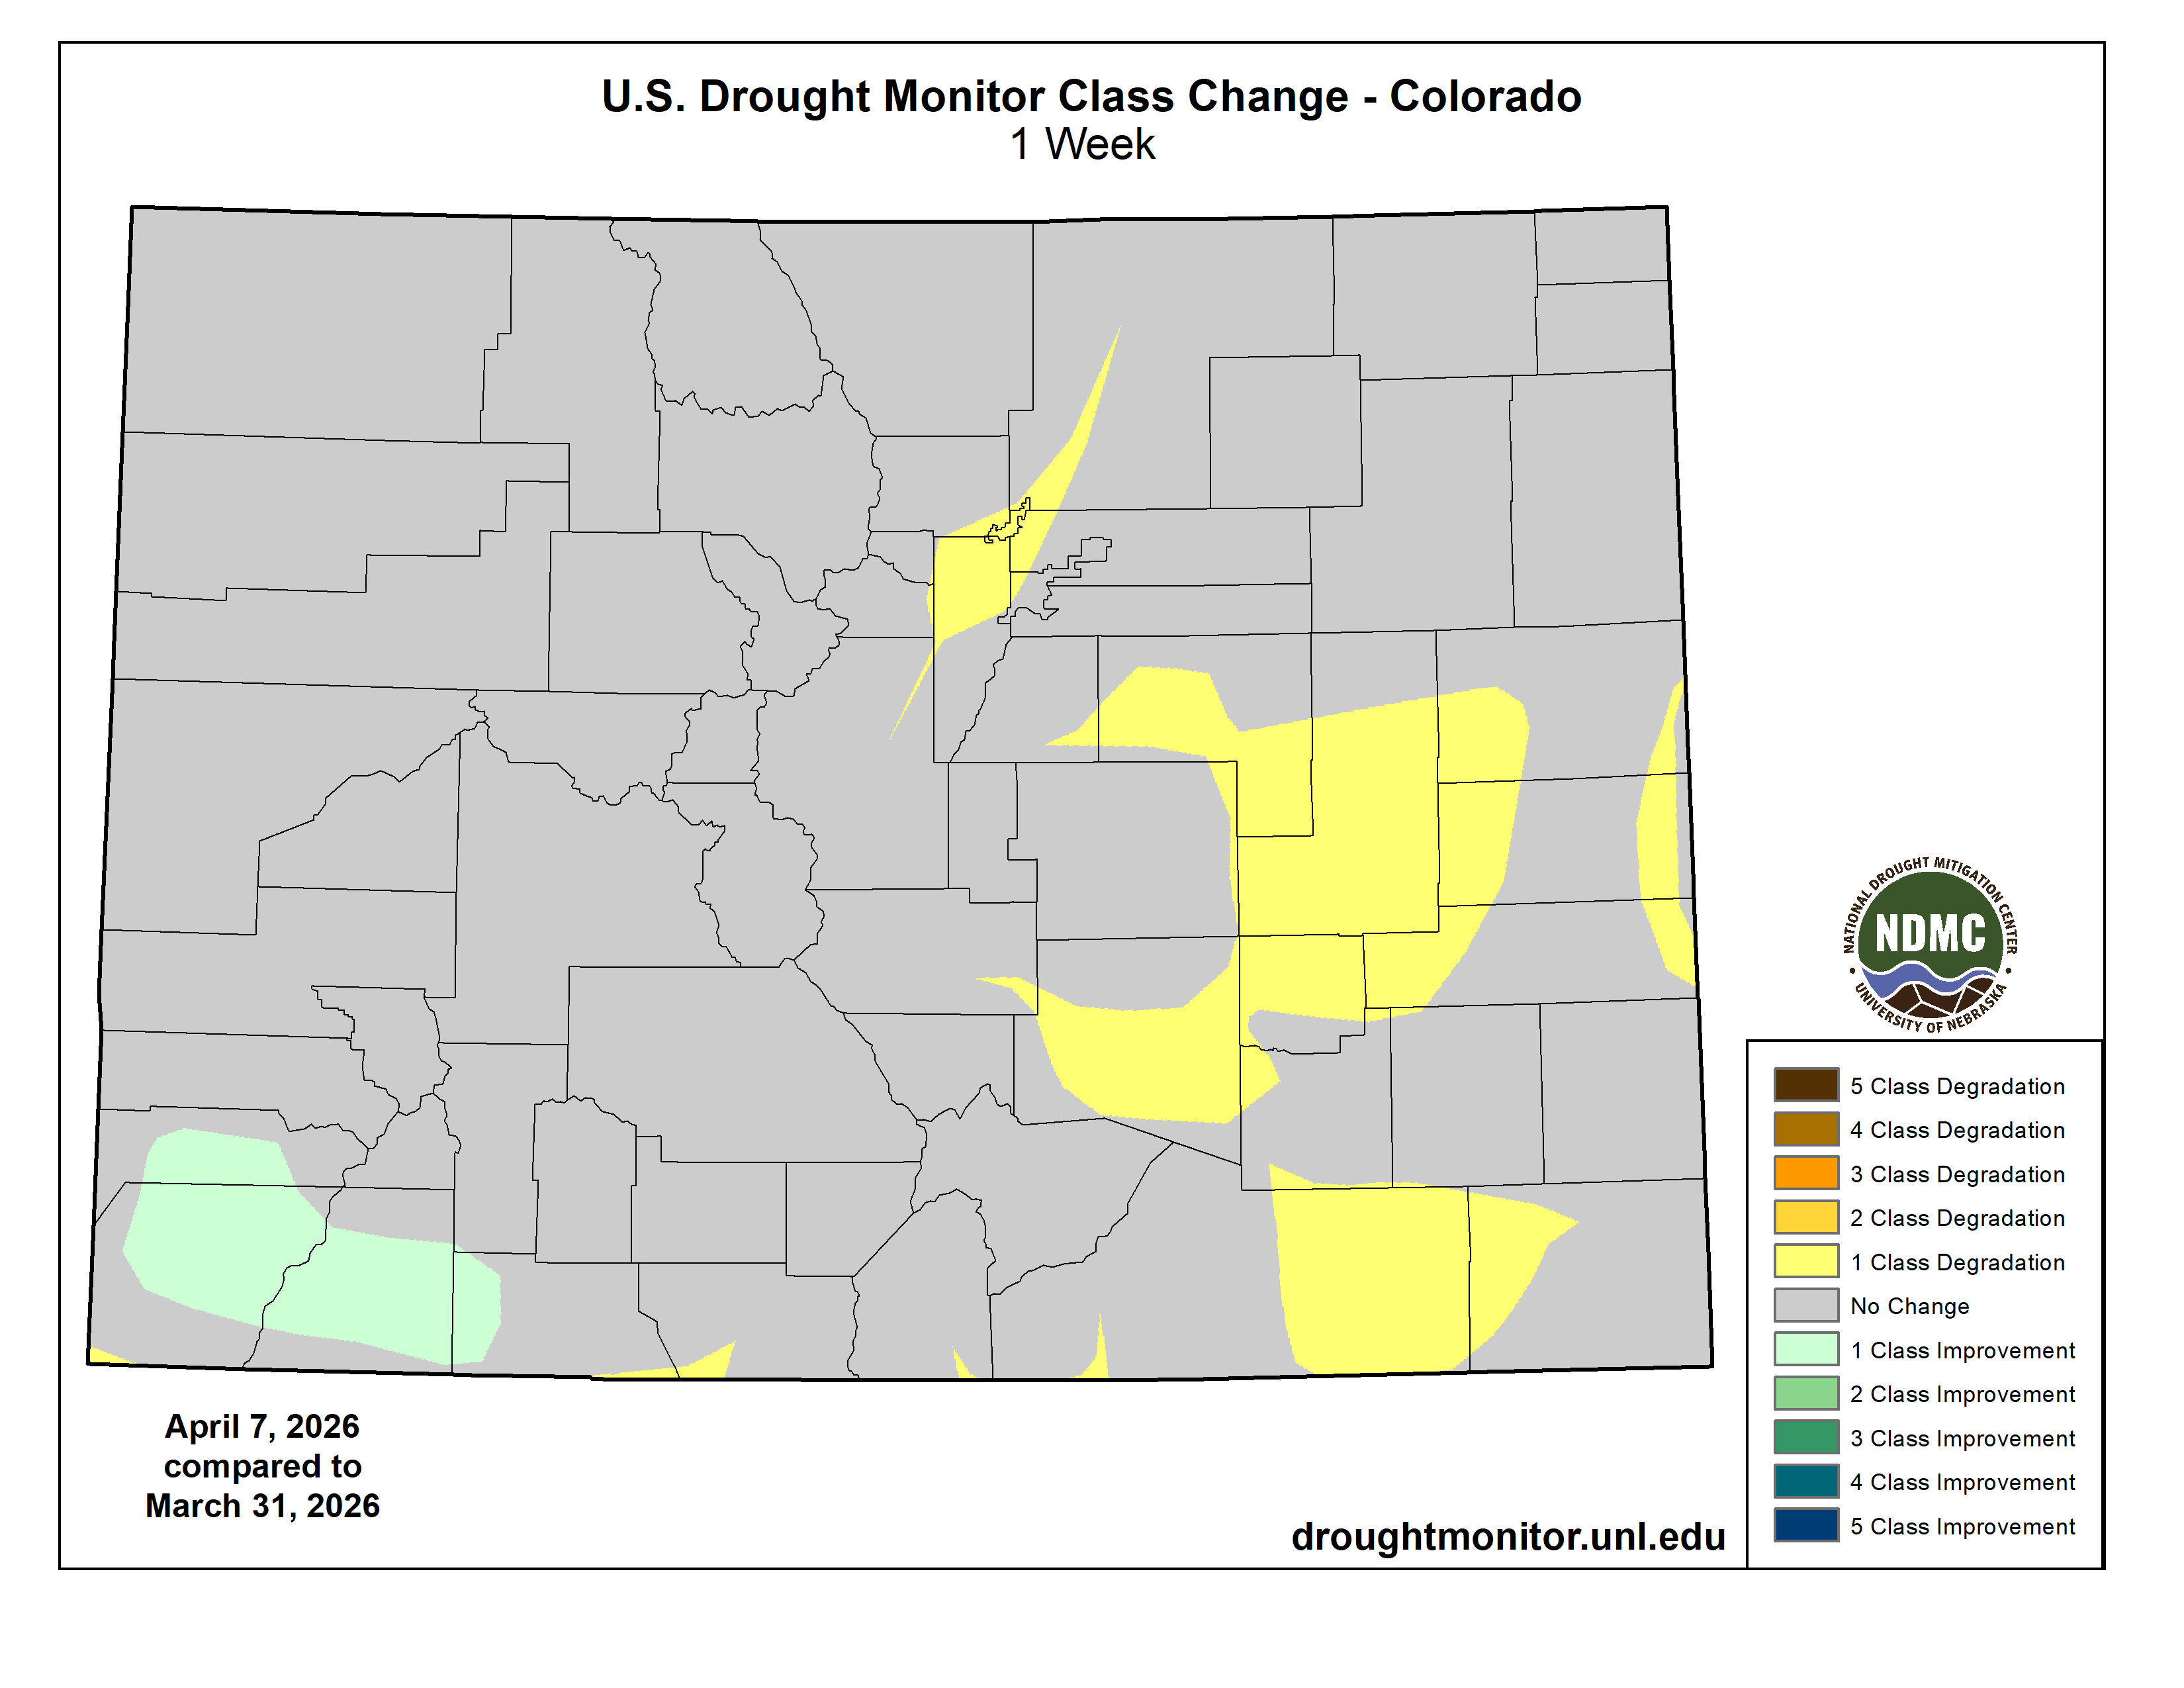
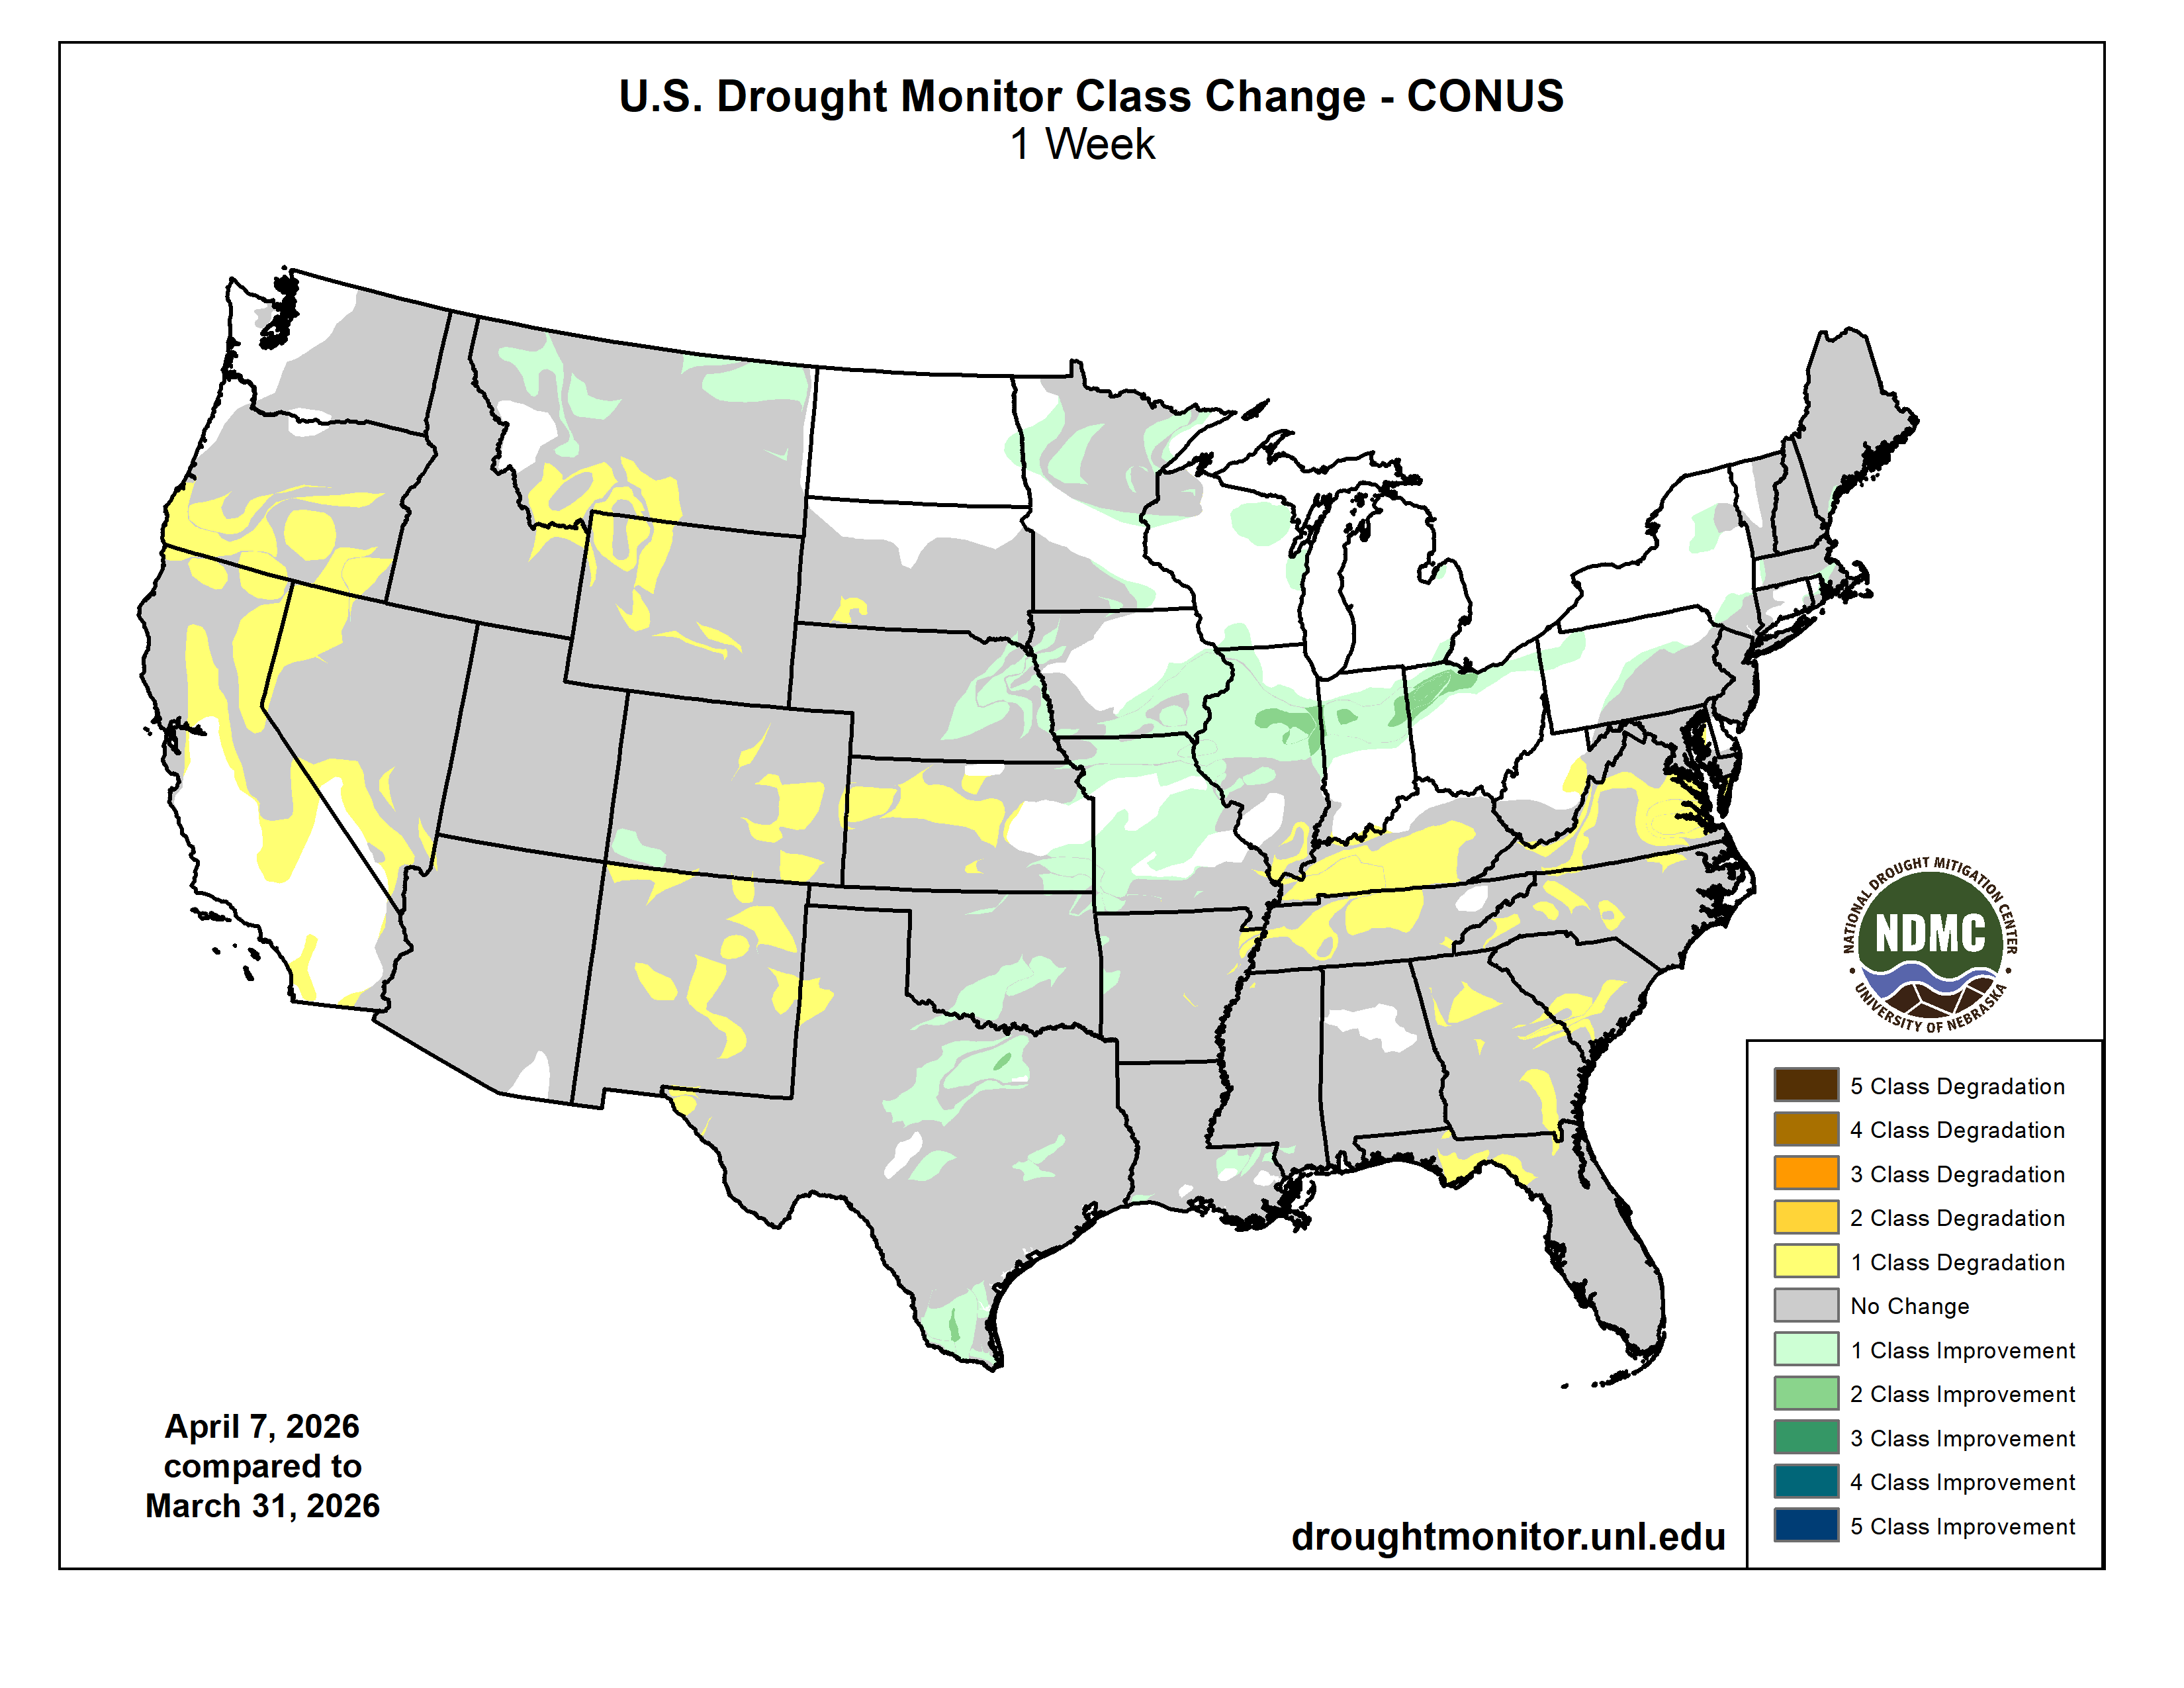
This U.S. Drought Monitor (USDM) week saw degradations across the areas of the West, Southeast, and Mid-Atlantic, while rainfall during the past week led to improvements in drought-affected areas of the South, Plains, and Midwest. In the Midwest, widespread improvements were made after another round of precipitation during the past week leading to removal of areas of drought on the map in Iowa, Missouri, Illinois, Indiana, and Ohio. In these areas, precipitation totals ranged from 2 to 5 inches. Similarly, significant rainfall was observed in portions of Texas, Oklahoma, and Louisiana leading to targeted improvements. Out West, generally dry conditions prevailed across much of the region, although modest precipitation totals were observed in areas of the Pacific Northwest, Northern California, Intermountain West, and Southwest with the highest totals logged in California. Despite the much-needed precipitation, conditions deteriorated on the map in Oregon, California, Nevada, Wyoming, Montana, and New Mexico. In the Hawaiian Islands, conditions have improved significantly during the past two months due to historic rainfall events observed across the island chain. Elsewhere, dry conditions continued across much of the Southeast and Mid-Atlantic, leading to degradation in conditions from Virginia to Florida.
According to the latest U.S. temperature and precipitation analysis by NOAA’s Center for Environmental Information, March 2026 was the warmest March on record for the contiguous U.S. (CONUS) with average temperatures reaching 9.4 °F above the 20th-century average. For the month, 1,432 counties observed their single warmest March day on record (1950-present). Moreover, the April 2025 to March 2026 period was the warmest 12-month span recorded for CONUS since 1895. In terms of precipitation, the January to March period was the driest on record for CONUS, breaking the previous record set in 1910…
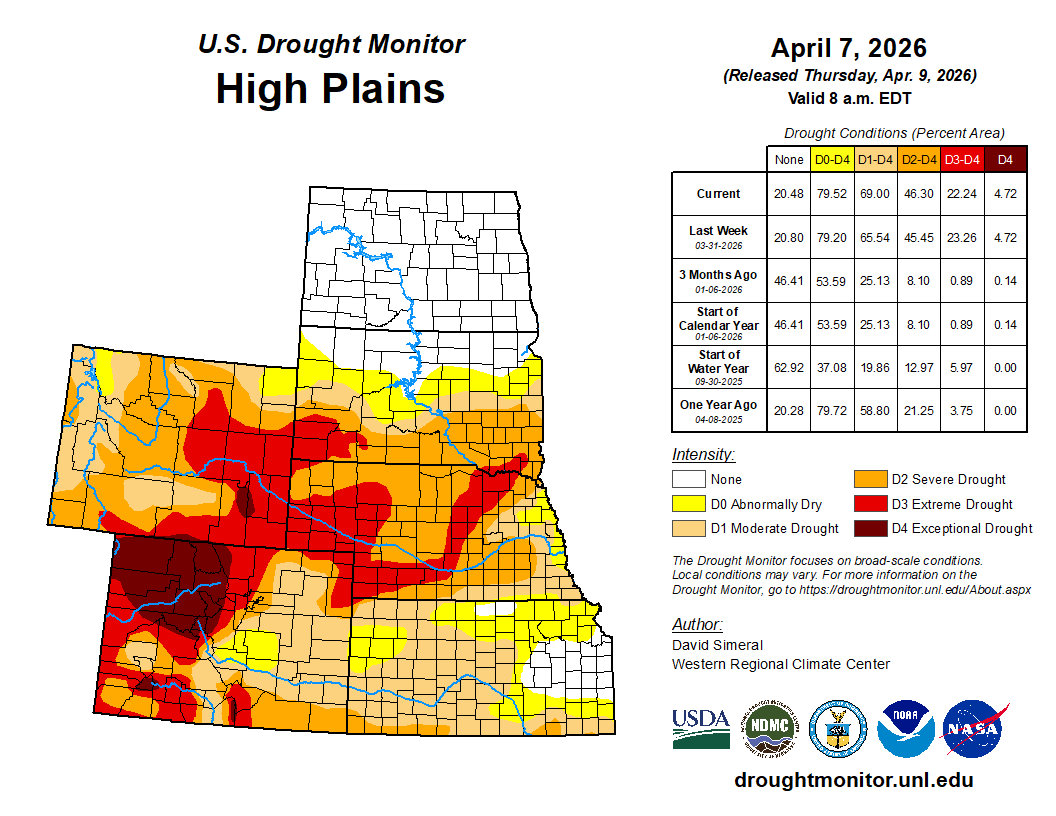
High Plains
On this week’s map, rainfall (1 to 4 inches) during the past week led to targeted improvements in far eastern portions of Kansas and Nebraska. Meanwhile, conditions deteriorated on the map in areas of central and western Kansas, and southwestern South Dakota. For the week, average temperatures were 4 to 10+ °F below normal across much of the region with the greatest departures observed in the Dakotas. Looking at climatological rankings for the past 60-day period (March 7 to April 7), several locations ranked among their driest on record, including Dodge City, KS (driest on record; -1.51 inches); Goodland, KS (driest on record; -1.05); and Manhattan, KS (2nd driest; -1.81 inches). In terms of hydrologic conditions, the U.S. Geological Survey is reporting below to much below normal streamflows across southwestern South Dakota, southern Nebraska, and central/western Kansas…
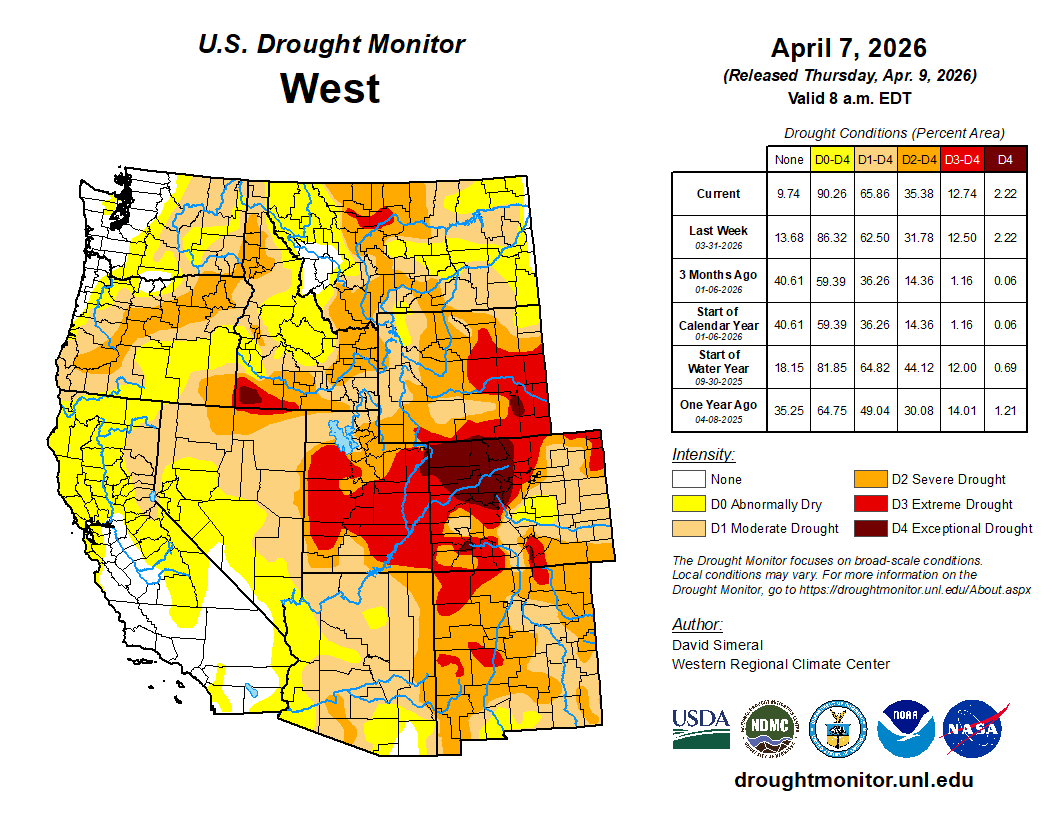
West
Conditions continued to deteriorate in the region with degradations made across southern Oregon, Northern California, southwestern Montana, northwestern Wyoming, and New Mexico. Despite some precipitation falling across the mountain ranges of the region this week, the snowpack conditions remain extremely poor with the remaining snowpack primarily restricted to the highest elevations. In Colorado, NRCS is reporting statewide SWE at the lowest on record. Historically, median peak SWE in Colorado occurs on April 8, however, this year peak SWE occurred on March 8. In Washington state, the Department of Ecology issued a statewide emergency drought declaration as projected water supplies are expected to be well below normal levels. In the Colorado River Basin, Lake Powell is 24% full, while Lake Mead is 33% full, according to the U.S. Bureau of Reclamation. Across areas of the Far West, very dry conditions were observed during the past 30-day period (March 7 to April 7), with record to near-record dryness at the following locations: Eugene, OR (10th driest; -2.57 inches); Medford, OR (9th driest; -1.38 inches); Crescent City, CA (2nd driest; -5.58 inches); Mount Shasta, CA (driest on record; -5.35 inches); San Francisco, CA (5th driest; -2.34 inches); Santa Cruz (driest on record; -3.13 inches); Monterey, CA (3rd driest; -2.8 inches), and San Diego, CA (driest on record; -1.24 inches)…
South
On this week’s map, improvements were made in drought-affected areas of Texas, Oklahoma, Louisiana, and Arkansas, while areas of Tennessee saw degradations. In terms of precipitation during the past week, moderate to heavy rainfall accumulations (ranging from 3 to 6 inches) were observed in Texas, Oklahoma, and isolated areas of Louisiana. In Arkansas, some beneficial rains fell in the far-western portion of the state, which led to a boost in streamflow conditions. However, dry soils and significant precipitation deficits remain across the state with the NDMC CMOR tool showing many new impact reports during the past week. Looking at climatological rankings for the past 60-day period (February 7 to April 7), record to near-record dryness was observed in the region, including in Monticello, AR (4th driest; -5.7 inches), and Monroe, LA (7th driest; -6.69 inches). In Texas, Water for Texas (April 7) reports statewide reservoirs at 74% full, with eastern reservoirs in good condition while many western and southern reservoirs remain below normal. Average temperatures for the week were above normal across the region (2 to 12+ °F)…
Looking Ahead
The NWS Weather Prediction Center 7-Day Quantitative Precipitation Forecast calls for precipitation accumulations generally ranging from 1 to 4 inches across eastern portions of the Southern Plains, Midwest, and Northeast, with the heaviest totals (locally 3 to 4 inches) along a corridor extending from eastern Oklahoma and Arkansas through the Mid-Mississippi Valley into eastern portions of the Upper Midwest. Across the Southeast and Mid-Atlantic, very dry conditions are expected, with little or no precipitation across most areas. The highest totals in the region are expected in isolated areas of eastern Florida, where accumulations may reach 2 to 3 inches. Across the High Plains, light-to-moderate precipitation accumulations ranging from 0.25 to 1.5 inches are expected, with the greatest totals across the eastern extent of the region. In the West, moderate-to-heavy liquid precipitation accumulations are expected across areas of California, particularly along the central and northern Sierra Nevada and coastal ranges, as well as portions of the central and northern Rockies, with lighter to moderate totals across portions of the Pacific Northwest. Dry conditions are expected to prevail across much of the Southwest, including areas of the southeastern California deserts, southern Nevada, Arizona, and New Mexico.
The NWS 6–10-Day Temperature Outlook (valid April 14–18, 2026) calls for above-normal temperatures across nearly all of the contiguous U.S., with the highest probabilities across the eastern half of the country, including the Midwest, Southeast, Mid-Atlantic, and Northeast. Below-normal temperatures are limited to areas along the broader U.S.–Canada border region in the Northern Plains and Upper Midwest, while near-normal temperatures are expected across parts of the Pacific Northwest.
In terms of precipitation, the 6–10-Day Outlook calls for above-normal precipitation across the Far West, northern Rockies, New Mexico, Texas, the South (eastern extent), portions of the central and southern Plains, Midwest, and Northeast. Near-normal precipitation is expected across the Intermountain West, Desert Southwest, areas of the South, Mid-Atlantic, and coastal New England. Below-normal precipitation is favored across the Southeast and portions of the Mid-Atlantic.
Just for grins here’s a slideshow of early April US Drought Monitor maps for the past few years.

US Drought Monitor map April 7, 2026. 
US Drought Monitor map April 1, 2025. 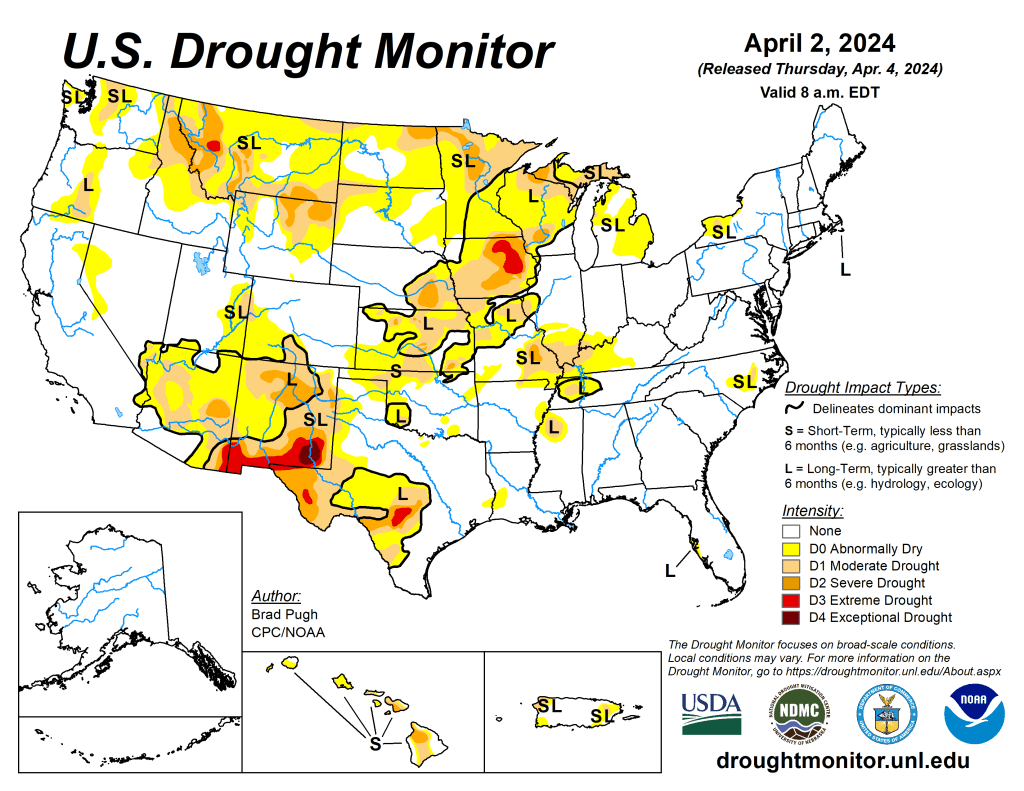
US Drought Monitor map April 2, 2024. 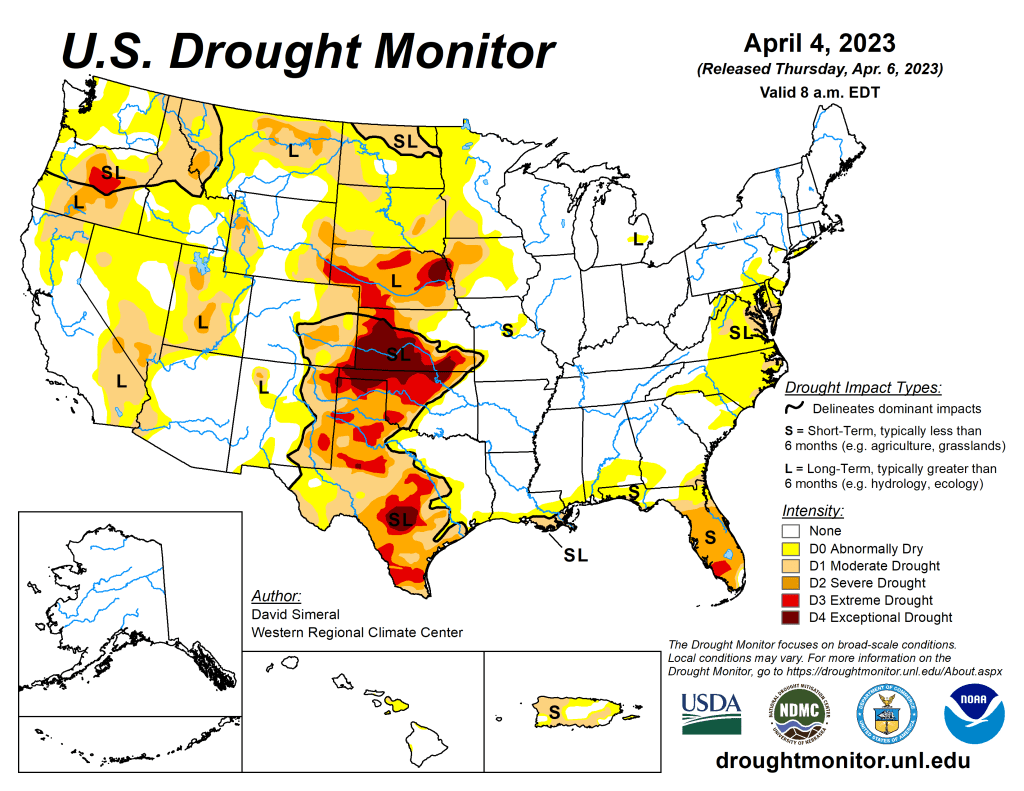
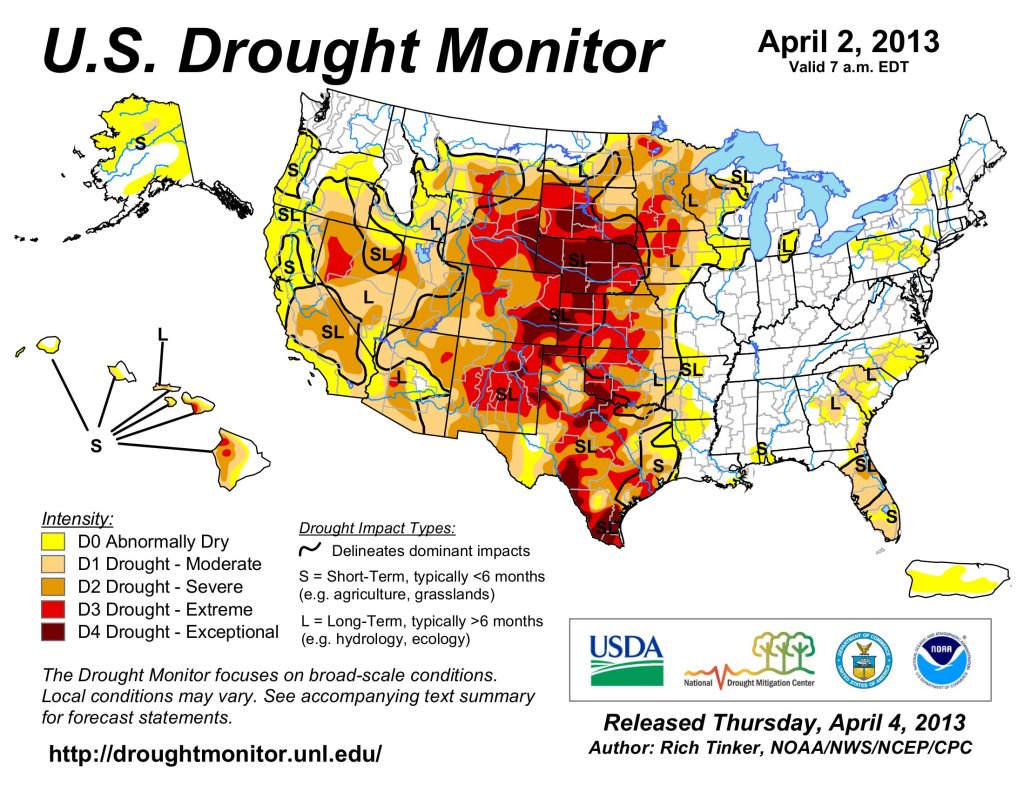
US Drought Monitor map April 4, 2023. 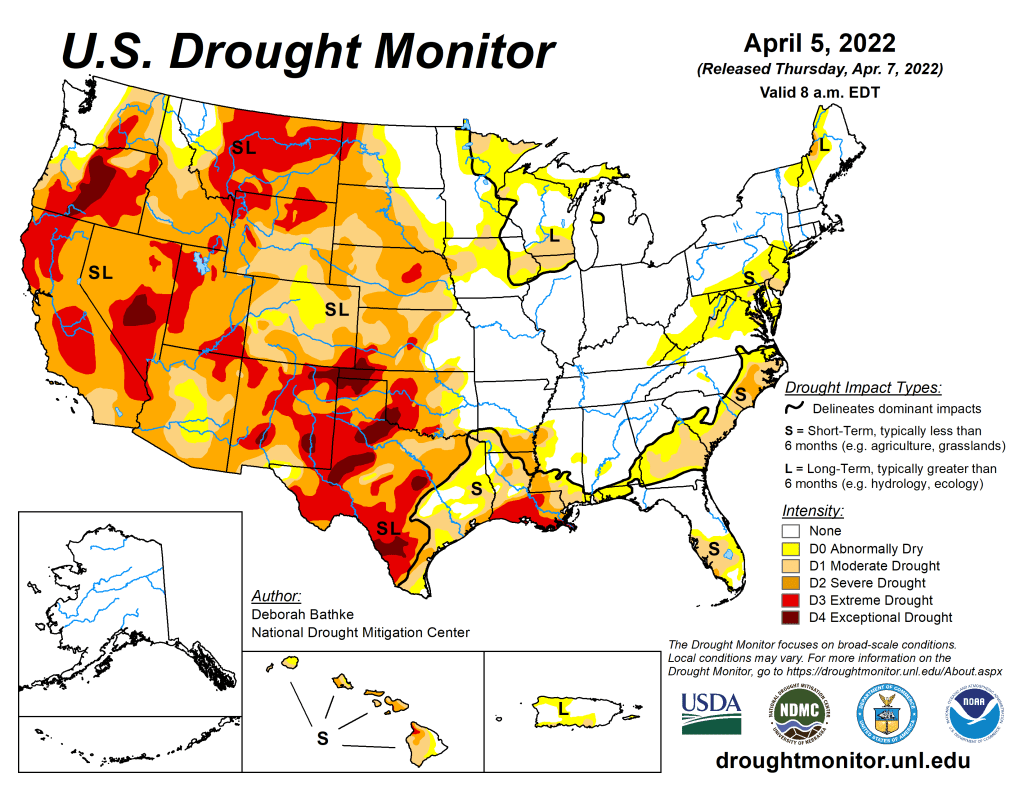
US Drought Monitor map April 5, 2022. 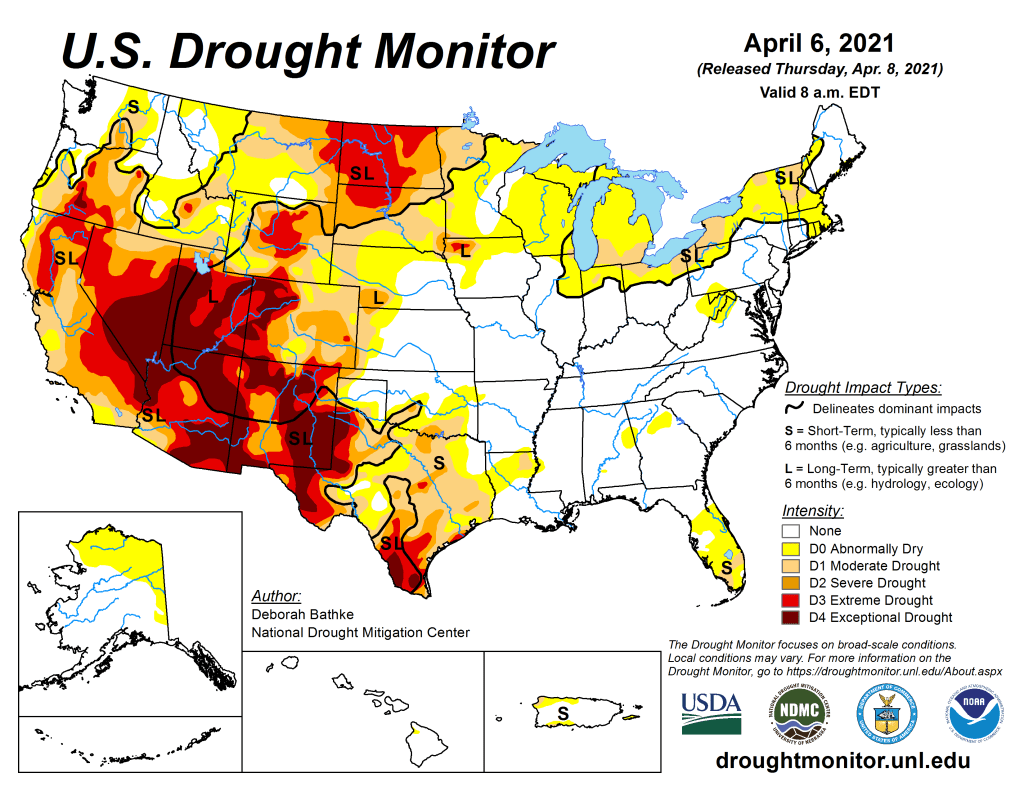
US Drought Monitor April 6, 2021. 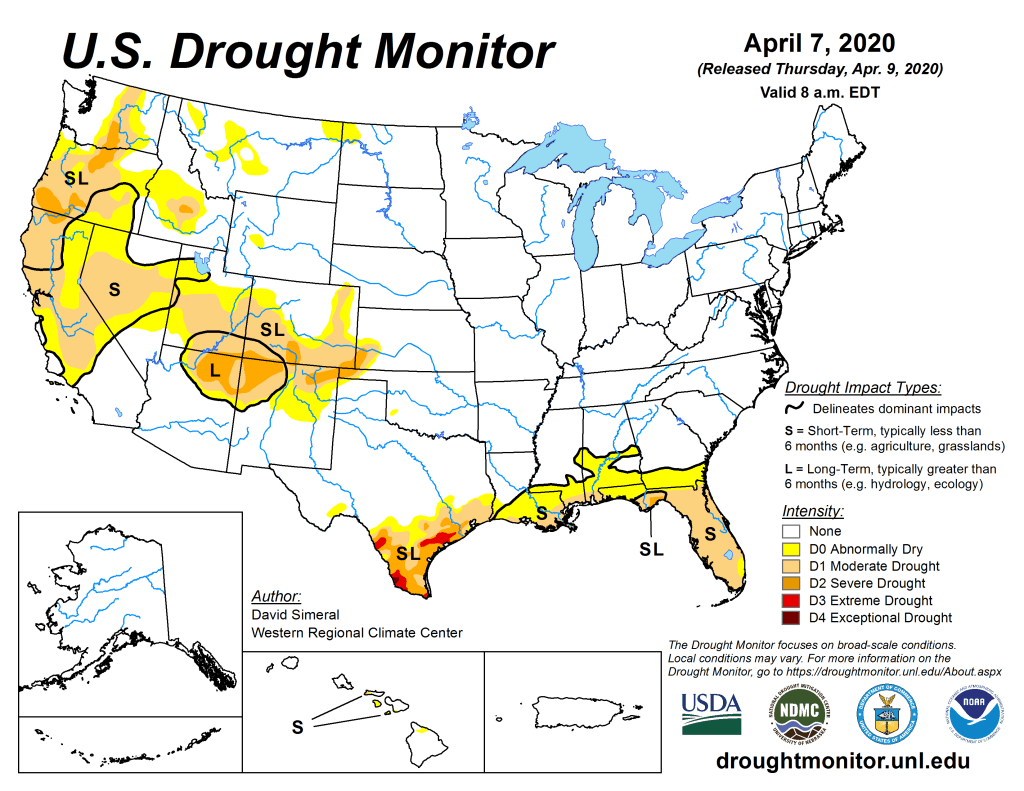
US Drought Monitor April 7, 2020. 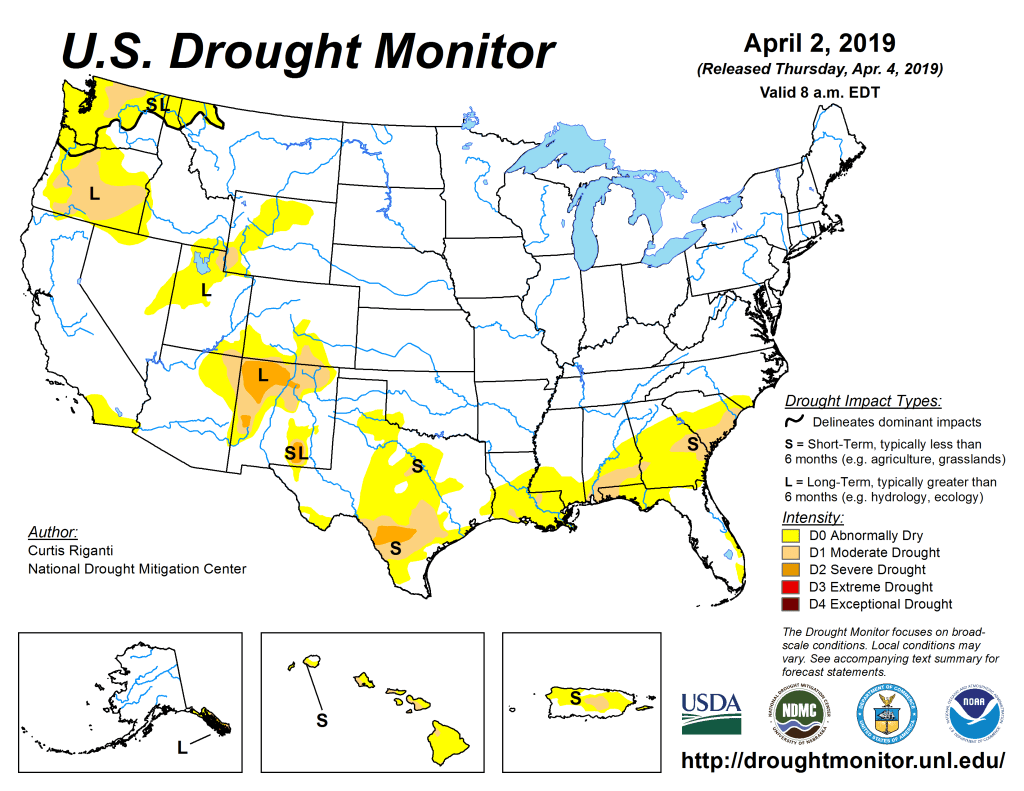
US Drought Monitor April 2, 2019. 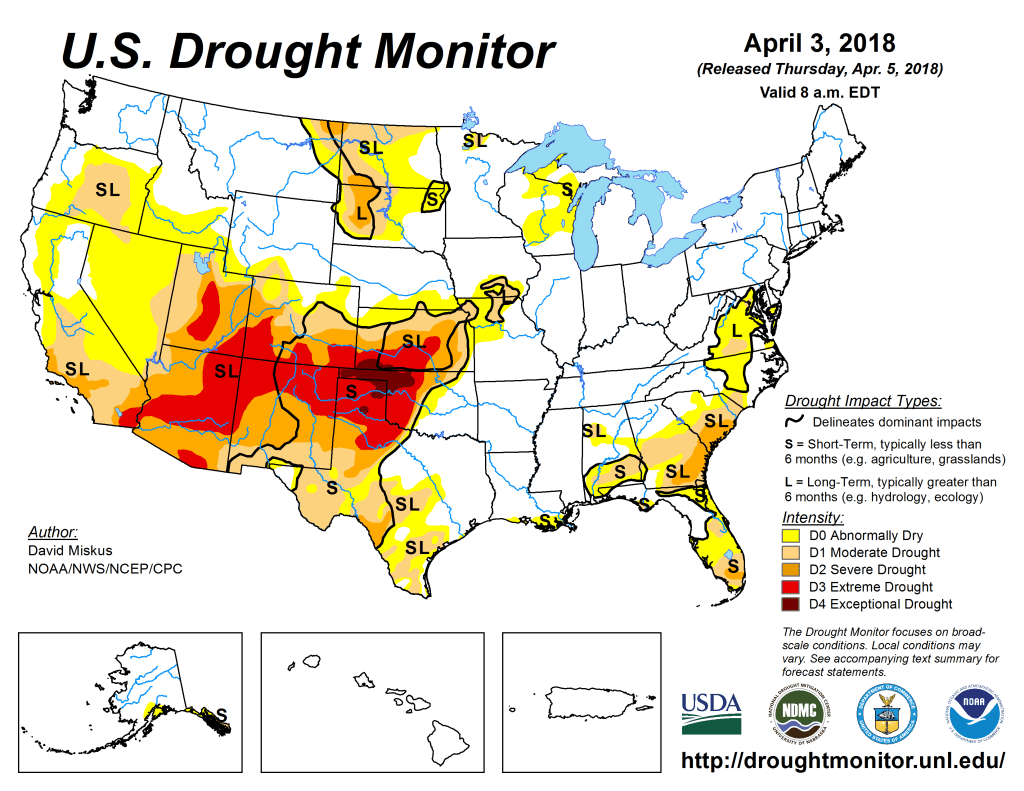
US Drought Monitor April 3, 2018. 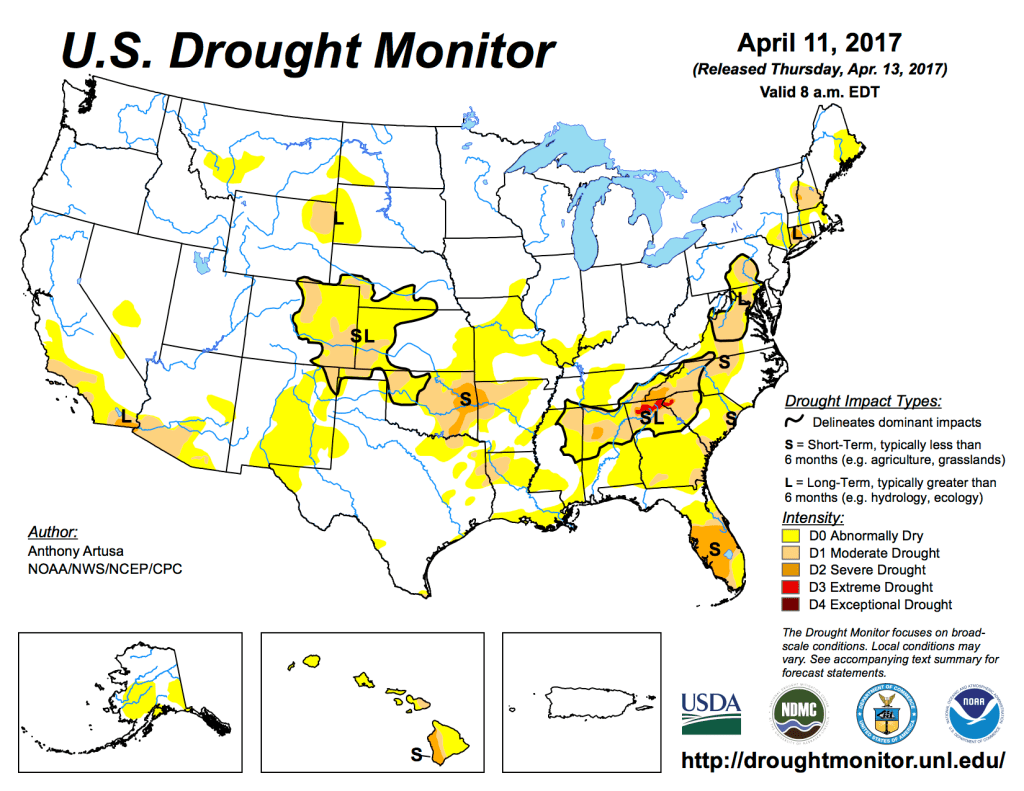
US Drought Monitor April 11, 2017. 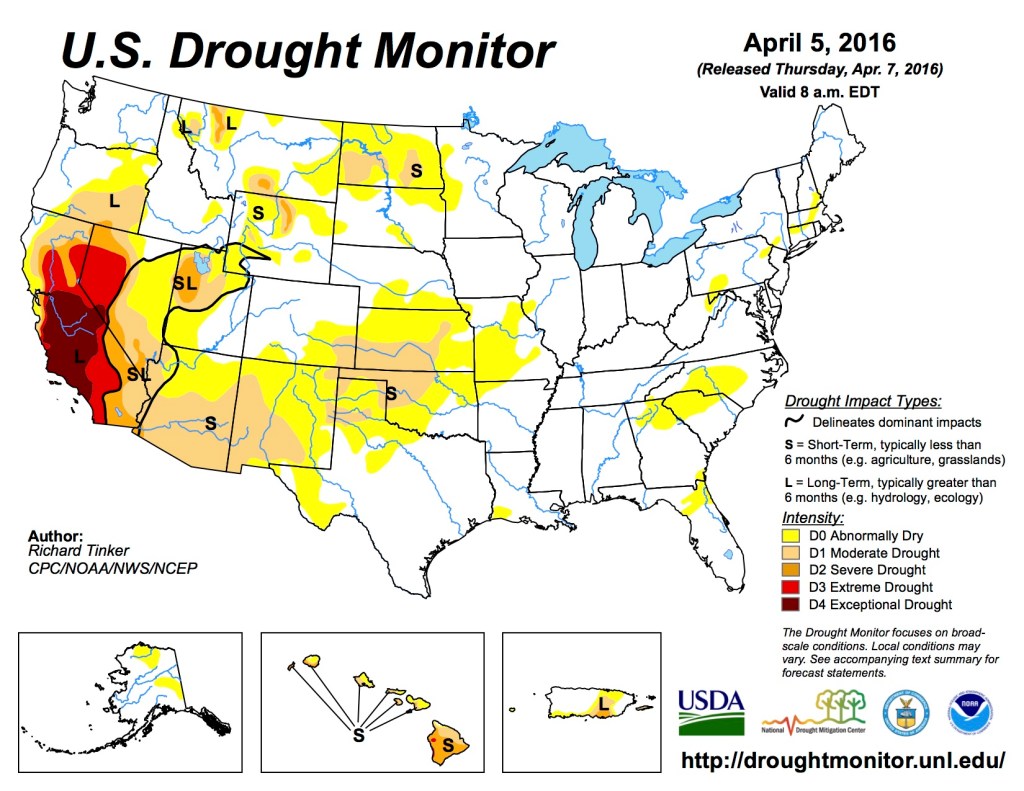
US Drought Monitor April 5, 2016. 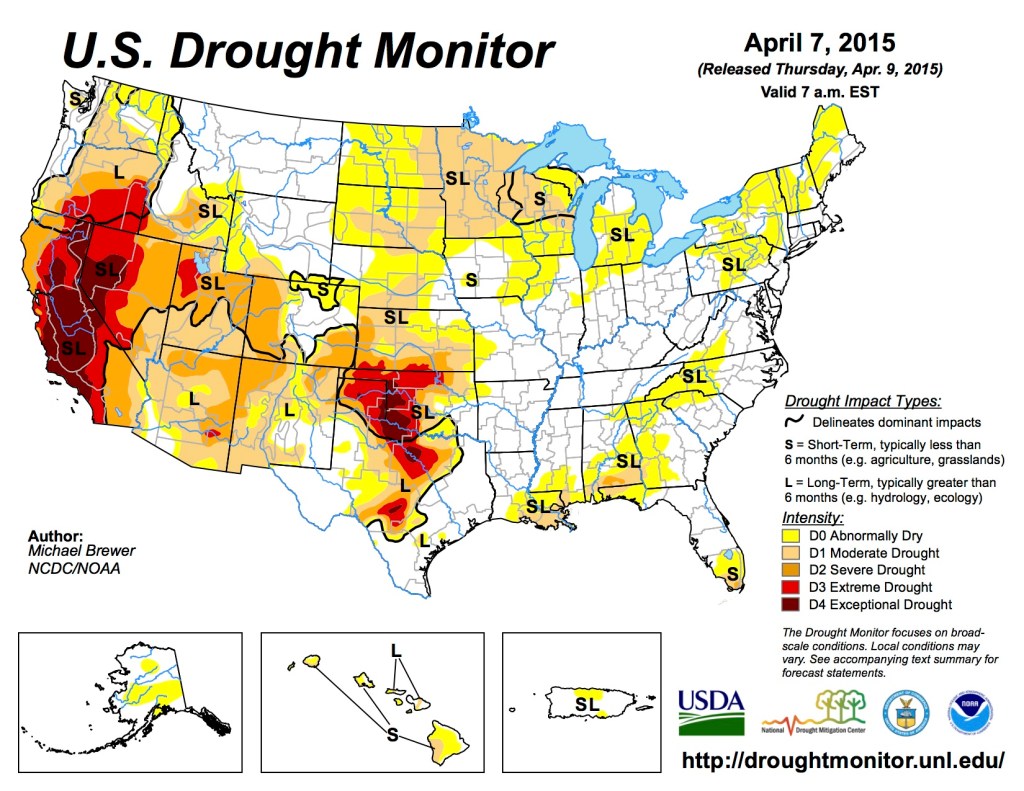
US Drought Monitor April 7, 2015 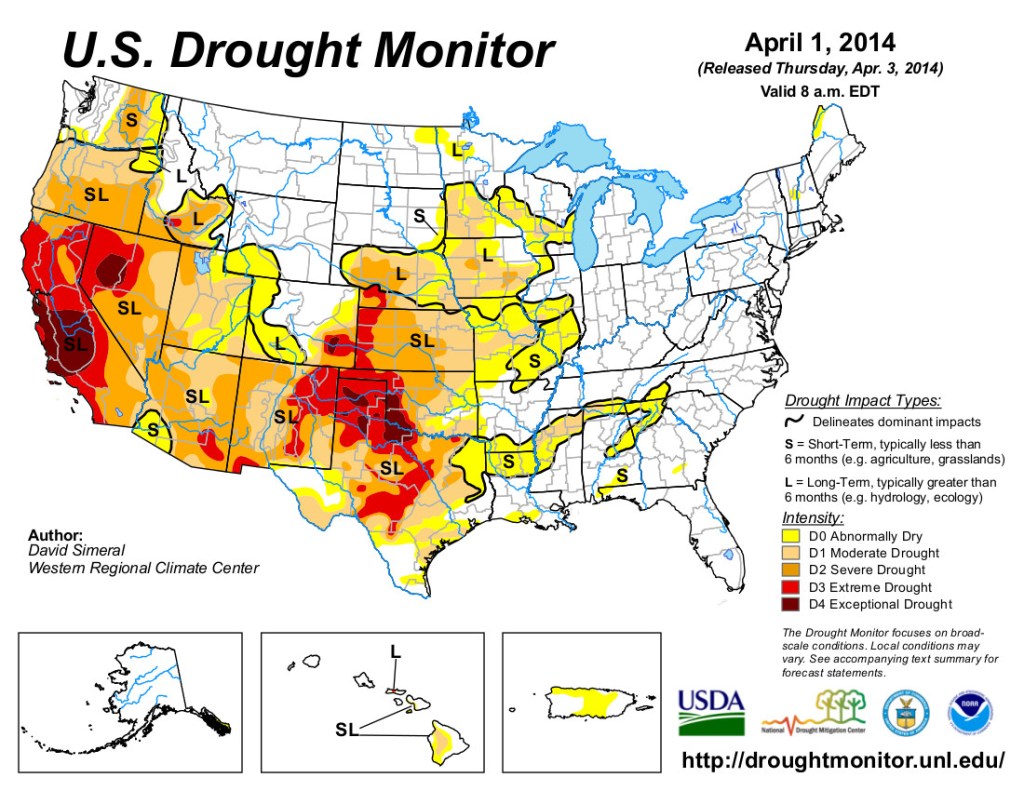
US Drought Monitor April 1, 2014