The latest ENSO Diagnostic Discussion is hot off the presses from the Climate Prediction Center

midjanuary2015plumeofmodelensoperdictions

Click here to read the discussion. Here’s an excerpt:

ENSO Alert System Status: El Niño Watch

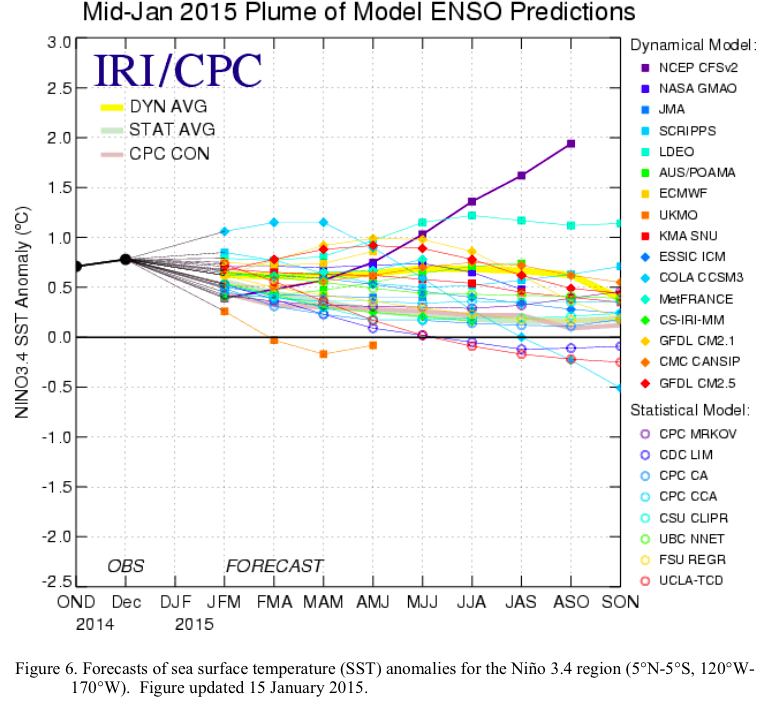
Synopsis: There is an approximately 50-60% chance of El Niño within the late Northern Hemisphere winter and early spring, with ENSO-neutral slightly favored thereafter.

Equatorial sea surface temperatures (SST) remained above average in the western and central Pacific during January 2015 and cooled across the eastern Pacific. Accordingly, the latest weekly Niño indices were +0.5°C in the Niño-3.4 region and +0.9°C in the Niño-4 region, and closer to zero in the Niño-3 and Niño-1+2 regions. Subsurface temperature anomalies across the eastern half of the equatorial Pacific also averaged near zero during the month. However, an extensive area of positive subsurface anomalies persisted near the Date Line, while negative anomalies were prevalent closer to the surface east of 110°W. During the last couple of weeks of January, several aspects of the tropical Pacific atmosphere showed some movement toward El Niño. However, for the month as a whole, the equatorial low-level winds were mostly near average across the Pacific, while upper-level easterly anomalies continued in the east-central Pacific. Also, convection remained below average near the Date Line and enhanced in the western equatorial Pacific. While the tropical Pacific Ocean is at the borderline of El Niño, the overall atmosphere-ocean system remains ENSO-neutral.

Similar to last month, most models predict a weak El Niño (3-month values of the Niño-3.4 index between 0.5°C and 0.9°C) during the Northern Hemisphere late winter and spring. The forecaster consensus also favors Niño-3.4 SST index values in excess of 0.5°C within the coming season. However, climatologically, ocean-atmosphere coupling tends to weaken into the spring, which increases uncertainty over whether El Niño conditions will emerge. In summary, there is an approximately 50-60% chance of El Niño within the late Northern Hemisphere winter and early spring, with ENSO-neutral slightly favored thereafter.

USBR: Study Reveals Climate Change Impacts on Irrigation Demand and Reservoir Evaporation in the West

Hockey Stick based on Mann & Jones 2003

Click here for the release:

Reflecting current climate projections for the western United States, a new report issued by the Bureau of Reclamation reveals a projected shift in demand for crop irrigation across eight major river basins. The study evaluated irrigation water requirements for the second half of the 20th century and, as compared to projected demand for the second half of the 21st century, found that net irrigation water requirements in the West may be six percent higher. Another area of study revealed in the report – based on a projected temperature increase of approximately 5 degrees Fahrenheit in the region – estimates that annual evaporation at most of the 12 reservoirs modeled by the study could increase 2 to 6 inches by 2080.

The report on irrigation demand and reservoir evaporation projections is the latest in a series of West-Wide Climate Risk Assessments – analyses of overall impacts from climate change on water resources in the West through the Department of the Interior’s WaterSMART Program.

In announcing the report, Reclamation Commissioner Estevan López said the study was an important piece of information about climate change imposing stresses on water resources and will ultimately help inform water planners and stakeholders in confronting future climate-related supply and demand challenges.

“Reclamation and its partners are engaged in critical work to confront a future with increasing disparity between water supply and demand in basins throughout the West,” Commissioner López said. “Understanding how climate change will impact crop irrigation demand and reservoir evaporation provides vital information for the development of alternatives and solutions to meet those challenges and support the nation’s economy.”

Projected future irrigation demands are only estimates and provide a starting point for further analyses and discussions with customers and stakeholders. The results do not account for changing crop patterns and other socioeconomic considerations that are best addressed with stakeholder input within a basin study or other process.

Using climate projections for temperature and precipitation, scientists considered projected irrigation demand in eight major river basins: Colorado, Rio Grande, Sacramento-San Joaquin, Truckee, Columbia, Missouri and Klamath. The water evaporation model was applied to 12 reservoirs in many of those major Reclamation river basins: Lake Powell, Lake Mead, American Falls Reservoir, Lake Roosevelt, Upper Klamath Lake, Canyon Ferry Reservoir, Boysen Reservoir, Elephant Butte Reservoir, Lake Shasta, Millerton Lake, Lake Tahoe and Lahontan Reservoir. This table provides one set of projections of irrigation demand by basin and potential changes in evaporation for the twelve reservoirs when compared to actual figures from 1950 to 1999:

evaportationinwestunderclimatechangeusbr

Scientists utilized climate change data to project alterations in precipitation and temperature and to assess evaporation for 12 reservoirs within those river basins, when considering observed and projected climate change impacts. Precipitation projections are highly variable and basin dependent, and they can vary significantly within individual basins as well.

“Through these studies, Reclamation is highlighting climate change impacts and encouraging a collaborative dialogue on the effective management of our water and power resources,” López said. “Facing the challenge in meeting future irrigation demands is one way we are working to underscore our commitment to a strong agricultural economy and national food security.”

Reclamation’s West-Wide Climate Risk Assessment is part of the Department of the Interior’s WaterSMART Program, which focuses on improving water conservation and sustainability, while helping water resource managers make sound decisions about water use. The report may be found at http://www.usbr.gov/WaterSMART/wcra.

Snowpack news: Colorado January driest since 1986 — statewide 1.4 inches of SWE

Click on a thumbnail graphic to display a gallery of snowpack data from the Natural Resources Conservation Service.

Here’s the latest snowpack news release from the Natural Resources Conservation Service (Brian Domonkos):

Looking back at Colorado’s mountain snowpack over the course of January, it is becoming increasingly difficult to find promising water supply outlooks for spring and summer 2015. At the very end of December a dry spell began that persisted through the entire month of January, with the only relief being a few brief periods of active weather. While actual observed snowpack values in no way decreased over the course of January 2015, the snowpack percents of normal in every basin across the state did decline, in some cases drastically. The North Platte and combined Yampa/White River basins experienced deficits in snowfall which decreased snowpack percents of normal 23 and 26 percentage points respectively over the course of January. The combined Yampa/White watersheds saw the lowest snow accumulation in the calculated period of record back to 1986. According to statewide SNOTEL data, 1986 was the only drier January going back 29 years. January 1992 saw the same snow accumulation totals as this January with an increase of only 1.4 inches of snow water equivalent. “With nearly one third of the winter remaining, Colorado is running short of time to catch up.” commented Brian Domonkos, Colorado Snow Survey Supervisor. He went on to mention, “Statewide snowfall would need to amount to 124% of normal from now until mid- April to achieve normal snowpack peak levels.”

There are a few bright spots around the state. Watersheds that still retain an above normal snowpack include the Blue River at 122% as well as a few other sub-watersheds within the Colorado and South Platte River basins. Of the major basins, the South Platte, Colorado, and Arkansas all remain near normal at 97%, 95% and 94% respectively.

January is an important month for mountain precipitation over the course of the average year. The month of April typically provides the most mountain precipitation at 3.6 inches, followed by March at 3.4 inches, and January coming in the third highest at 3.2 inches. This January provided only 1.4 inches of mountain precipitation, 45% of the average. The South Platte saw the greatest precipitation totals compared to normal at 62% of average.

In terms of normal, statewide reservoir storage is only slightly below where it was last month, down one percentage point to 104% of average. The South Platte, combined Yampa, White & North Platte and Colorado River basins are riding higher than normal on carry over storage from the 2014 water year at 119%, 117%, and 116% of average respectively.

As always spring and summer outlooks for streamflow volumes vary greatly across the state, but the bulk are below normal between 60% and 85% of average.

Colorado February 1 snowpack and reservoir storage via the NRCS

Water Values podcast: @westgov’s great webinar series on western #drought

Sterling: New RO water plant online and slowly winning over rate payers

Reverse Osmosis Water Plant

From Radio Colorado College (Maeve Conran):

Coloradans pride themselves on the quality of their drinking water, most of which originates high up in the Rocky Mountains. But many communities on the Eastern plains have water that not only tastes bad, it’s out of compliance with federal drinking water standards.

Many diners at the J and L Cafe in downtown Sterling are sipping on glasses of tap water as they enjoy lunch on this December morning. That was not the case just a year ago.

“You couldn’t hardly drink it,” says Kathy Orchid, who says she never used to drink the tap water. “You could hardly drink it. It’s much better.”

The difference lies in the new multi-million dollar water treatment plant, less than a mile from the diner.

“The EPA…put the city on an enforcement order where we were basically told we had to fix the problem,” says Jeff Reeves, Sterling’s utilities superintendent, who supervises operations.

The city and the state had long been aware of problems with the drinking water, specifically that it contained radium and uranium, contaminants that can lead to kidney problems and bone cancer.

“All of these problems are naturally occurring,” says Ron Falco, who manages the Safe Drinking Water Program for the State of Colorado. “So this problem happens in the ground water as it’s moving through formations that may just have naturally high levels of radium or uranium.”

Falco says dozens of other communities, all on the Eastern Plains, are also struggling with water quality because like Sterling, they rely on ground water.

The EPA issued new drinking water standards in 2008, which meant those locations were now out of compliance with federal standards. Falco and other state health officials started working with the communities to improve the water systems.

“Historically, about 55 systems in the state of Colorado serving about 32000 people have struggled with uranium and radium in their drinking water,” says Falco. “By 2008, that number was at about 37 systems and about 21000 people.”

Sterling’s new water treatment plant is about a year old, and has put a dent in those numbers. This town of about 15,000 people in the South Platte River Basin was the largest municipality in the state facing this water quality issue.

The plant uses reverse osmosis to remove the uranium and radium. Reverse osmosis forces the water through a membrane, trapping contaminants which then form a concentrated brine.

But there are a couple of challenges. One is a 15% loss in usable water due to the treatment process, a significant figure for a region grappling with water quantity AND quality. The other problem is what to do with that wastewater.

Deep injection well
Deep injection well

Utilities manager Jeff Reeves says they’re storing that wastewater in an underground reservoir. “That’s down below an impermeable layer so it can’t get back up into the drinking water.”

Despite those two challenges, Reeves says the city of Sterling now has water that is well within federal standards. In addition, the reverse osmosis process has also improved the taste.

“We thought that we might as well make the water much more aesthetically pleasing,” says Reeves. “If you’re going to produce a product that people are going to have to pay for it’s a lot easier to get along with the customers if the water is good.”

More water treatment coverage here.

The February 1, 2015 Colorado Water Supply Outlook report is hot off the presses from the NRCS

Click here to read the report. Here’s an excerpt (Click on a graphic for a larger view):

streamflowforecast02012015nrcs
snowpacksummarymap02012015
precipitationsummary02012015nrcs