Click on a thumbnail graphic to view a gallery of snowpack data from the NRCS. Since the melt-out has started focus on percent of peak instead of percent of normal.

Statewide snowpack basin-filled map April 25, 2017 via the NRCS.

Statewide Basin High/Low graph April 24, 2017 via the NRCS.

Yampa and White Basin High/Low graph April 24, 2017 via the NRCS.

South Platte River Basin High/Low graph April 24, 2017 via the NRCS.

San Miguel, Dolores, Animas, and San Juan Basin High/Low graph April 24, 2017 via the NRCS.

Upper Rio Grande River Basin High/Low graph April 24, 2017 via the NRCS.

Laramie and North Platte Basin High/Low graph April 24, 2017 via the NRCS.

Gunnison River Basin High/Low graph April 24, 2017 via the NRCS.

Upper Colorado River Basin High/Low graph April 24, 2017 via the NRCS.

Arkansas River Basin High/Low graph April 24, 2017 via the NRCS.
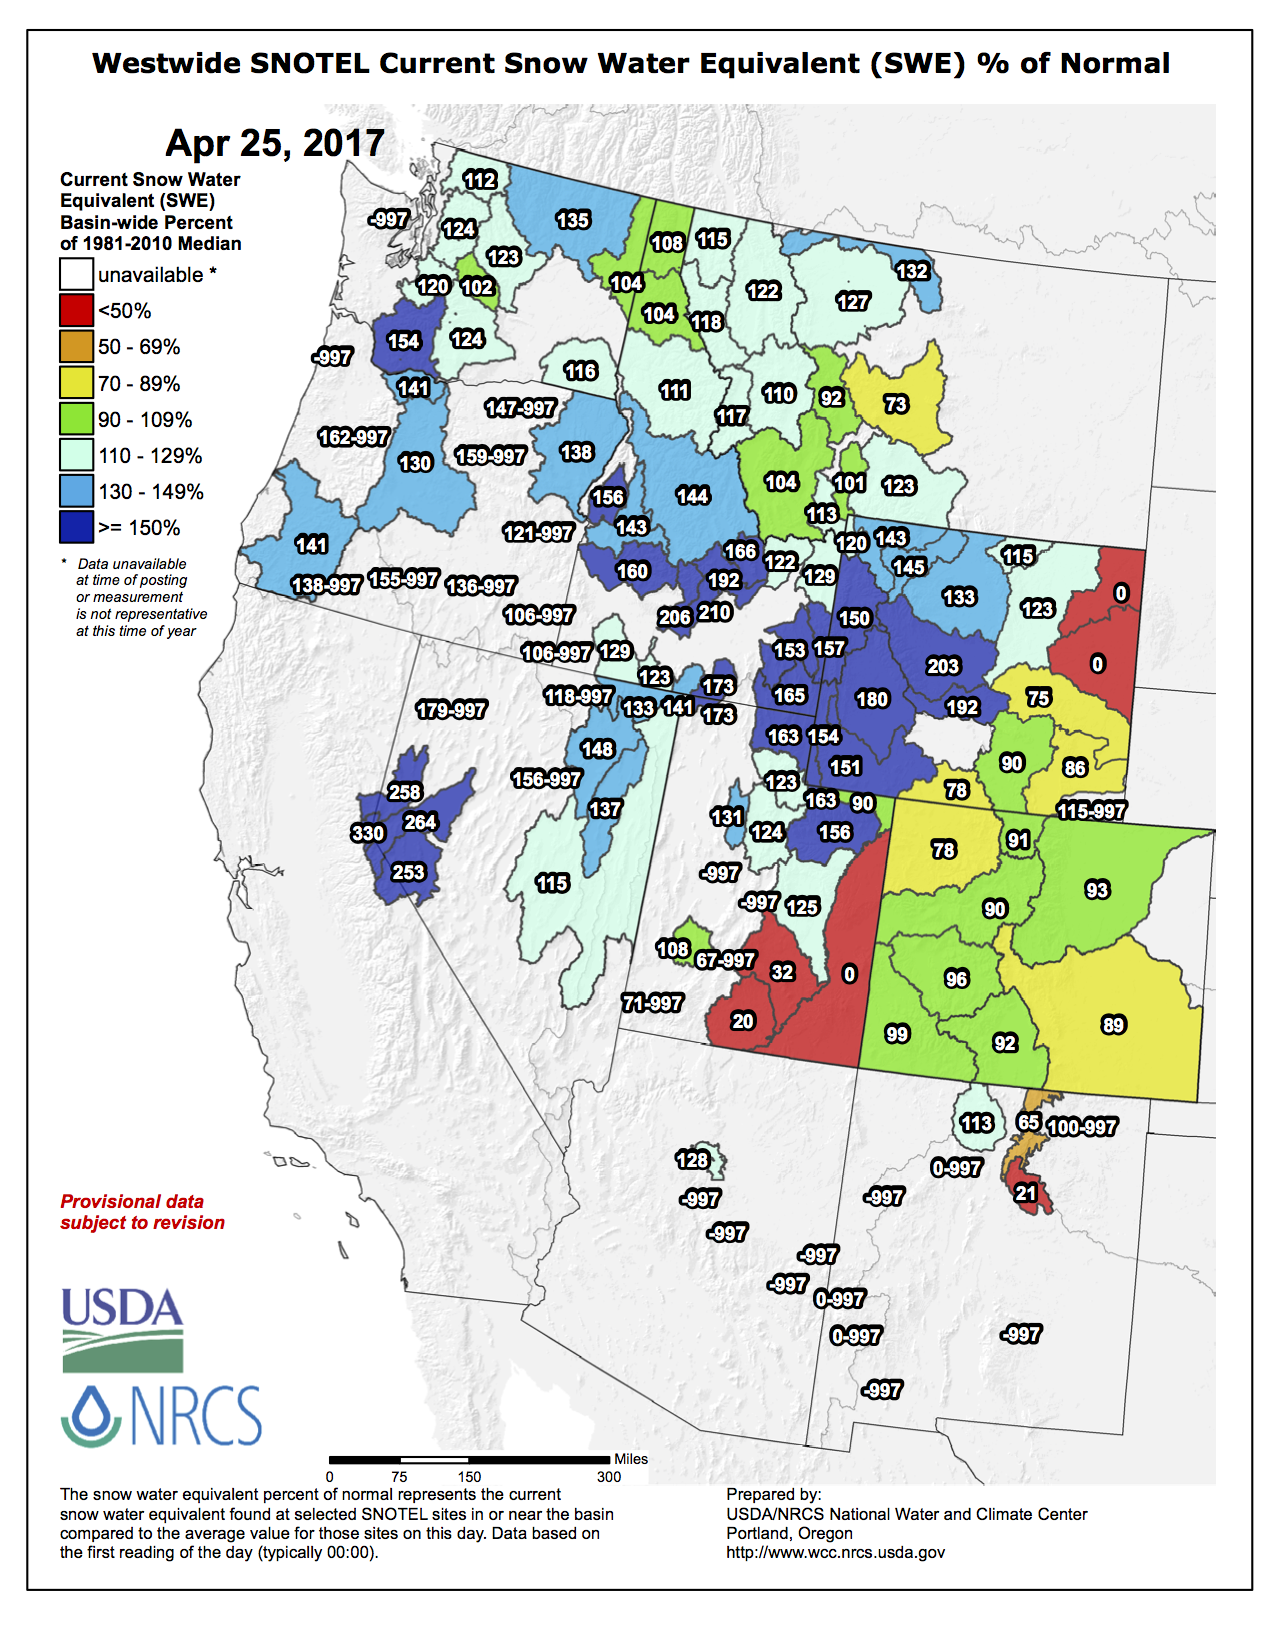
Here’s the westwide SNOTEL basin-filled map for April 25, 2017 from the NRCS.