Northern Water, the U.S. Forest Service, the U.S. Bureau of Reclamation, Grand County and additional regional health, water and recreation officials are closely monitoring a potentially harmful algal bloom that developed at Willow Creek Reservoir in July, a component of the Colorado-Big Thompson Project in Grand County.
In late July, monitoring teams found the presence of blue-green algae (cyanobacteria), which can sometimes produce toxins (cyanotoxins) that can be harmful to humans and animals. With this discovery, the U.S. Forest Service’s Arapaho National Forest placed restrictions on water contact recreation and posted signs informing the public of the issue.
Recent tests indicate the concentration of cyanotoxins in the two samples collected to be nearly negligible. However, because of evidence of algae in other parts of the reservoir where sampling has not occurred the reservoir remains under the existing restrictions for contact recreation.
Willow Creek Reservoir is part of the collections system for the Colorado-Big Thompson Project, which gathers water in the headwaters of the Colorado River for delivery to cities, farms and industries in northeast Colorado.
In the East Troublesome Fire of 2020, as much as 90 percent of the watershed that feeds into the reservoir sustained damage. This summer, the arrival of monsoonal moisture has increased the delivery of nutrients from the burn scar to the reservoir, and made these nutrients available to support increased growth of all kinds of algae. However, the vast majority of algae species are not harmful. Water recreation enthusiasts can learn more by viewing the Colorado Parks and Wildlife video and visiting the Colorado Department of Public Health and Environment links available from Grand County.
Water from Willow Creek Reservoir is pumped intermittently into Lake Granby to make room in Willow Creek Reservoir should future flooding occur. However, with a maximum capacity of 10,600 acre-feet, Willow Creek Reservoir is dwarfed by the 540,000 acre-foot Lake Granby, meaning the overall impact to the region’s water supply is negligible. In addition, water quality testing equipment installed in the aftermath of the East Troublesome Fire will be able to monitor key water quality metrics in the Colorado-Big Thompson Project. A monitoring program has been implemented to watch for algae blooms and potential toxins in the Three Lakes, as well as in Willow Creek Reservoir. Agencies will continue to review data and monitor the issue until the bloom disappears.
For information about water recreation opportunities on the Arapaho National Forest, visit http://www.fs.usda.gov/arp.
A joint press release among Northern Water, U.S. Forest Service, U.S. Bureau of Reclamation and Grand County.
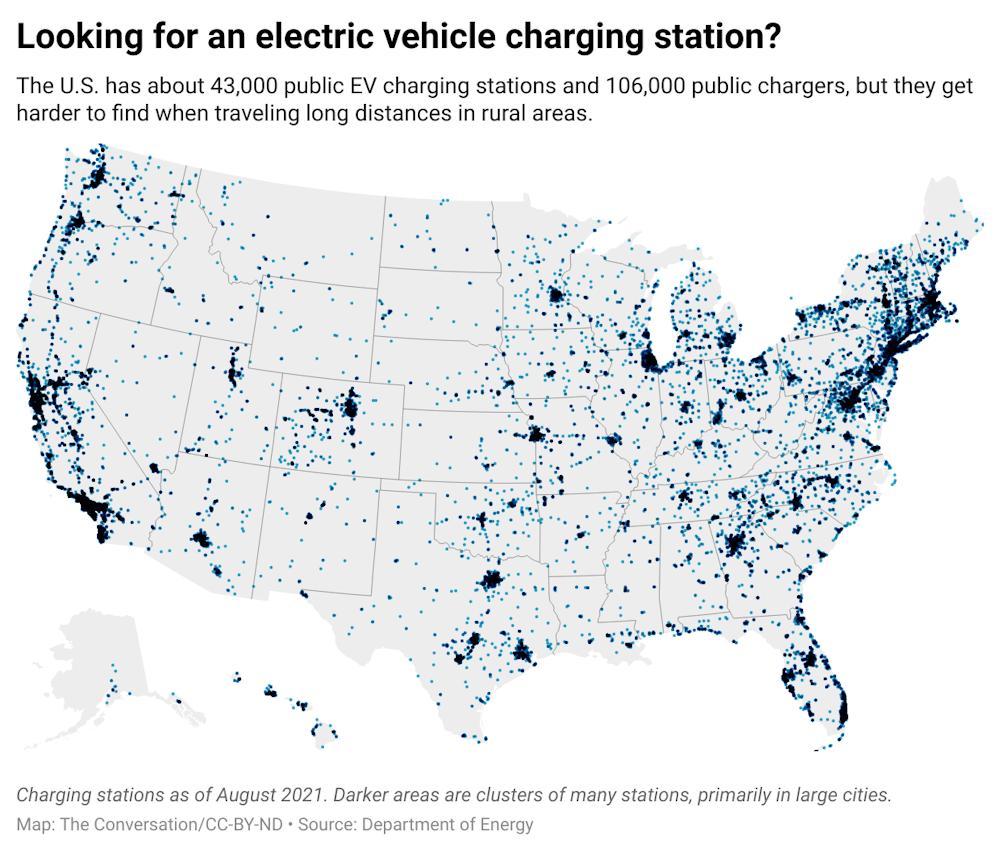
Most of America’s 107,000 gas stations can fill several cars every five or 10 minutes at multiple pumps. Not so for electric vehicle chargers – at least not yet. Today the U.S. has around 43,000 public EV charging stations, with about 106,000 outlets. Each outlet can charge only one vehicle at a time, and even fast-charging outlets take an hour to provide 180-240 miles’ worth of charge; most take much longer.
The existing network is acceptable for many purposes. But chargers are very unevenly distributed; almost a third of all outlets are in California. This makes EVs problematic for long trips, like the 550 miles of sparsely populated desert highway between Reno and Salt Lake City. “Range anxiety” about longer trips is one reason electric vehicles still make up fewer than 1% of U.S. passenger cars and trucks.
This uneven, limited charging infrastructure is one major roadblock to rapid electrification of the U.S. vehicle fleet, considered crucial to reducing the greenhouse gas emissions driving climate change.
It’s also a clear example of how climate change is an infrastructure problem – my specialty as a historian of climate science at Stanford University and editor of the book series “Infrastructures.”
Over many decades, the U.S. has built systems of transportation, heating, cooling, manufacturing and agriculture that rely primarily on fossil fuels. The greenhouse gas emissions those fossil fuels release when burned have raised global temperature by about 1.1°C (2°F), with serious consequences for human lives and livelihoods, as the recent report from the U.N. Intergovernmental Panel on Climate Change demonstrates.
The new assessment, like its predecessor Special Report on Global Warming of 1.5°C, shows that minimizing future climate change and its most damaging impacts will require transitioning quickly away from fossil fuels and moving instead to renewable, sustainable energy sources such as wind, solar and tidal power.
That means reimagining how people use energy: how they travel, what and where they build, how they manufacture goods and how they grow food.
Gas stations were transport infrastructure, too
Gas-powered vehicles with internal combustion engines have completely dominated American road transportation for 120 years. That’s a long time for path dependence to set in, as America built out a nationwide system to support vehicles powered by fossil fuels.
Gas stations are only the endpoints of that enormous system, which also comprises oil wells, pipelines, tankers, refineries and tank trucks – an energy production and distribution infrastructure in its own right that also supplies manufacturing, agriculture, heating oil, shipping, air travel and electric power generation.
Without it, your average gas-powered sedan wouldn’t make it from Reno to Salt Lake City either.
Gas-powered vehicles have dominated U.S. road transportation for 120 years and have a web of infrastructure supporting them. Jim Watson/AFP via Getty Images
Fossil fuel combustion in the transport sector is now America’s largest single source of the greenhouse gas emissions causing climate change. Converting to electric vehicles could reduce those emissions quite a bit. A recent life cycle study found that in the U.S., a 2021 battery EV – charged from today’s power grid – creates only about one-third as much greenhouse gas emissions as a similar 2021 gasoline-powered car. Those emissions will fall even further as more electricity comes from renewable sources.
Despite higher upfront costs, today’s EVs are actually less expensive than gas-powered cars due to their greater energy efficiency and many fewer moving parts. An EV owner can expect to save US$6,000-$10,000 over the car’s lifetime versus a comparable conventional car. Large companies including UPS, FedEx, Amazon and Walmart are already switching to electric delivery vehicles to save money on fuel and maintenance.
All this will be good news for the climate – but only if the electricity to power EVs comes from low-carbon sources such as solar, tidal, geothermal and wind. (Nuclear is also low-carbon, but expensive and politically problematic.) Since our current power grid relies on fossil fuels for about 60% of its generating capacity, that’s a tall order.
To achieve maximal climate benefits, the electric grid won’t just have to supply all the cars that once used fossil fuels. Simultaneously, it will also need to meet rising demand from other fossil fuel switchovers, such as electric water heaters, heat pumps and stoves to replace the millions of similar appliances currently fueled by fossil natural gas.
The infrastructure bill
The 2020 Net-Zero America study from Princeton University estimates that engineering, building and supplying a low-carbon grid that could displace most fossil fuel uses would require an investment of around $600 billion by 2030.
The infrastructure bill now being debated in Congress was originally designed to get partway to that goal. It initially included $157 billion for EVs and $82 billion for power grid upgrades. In addition, $363 billion in clean energy tax credits would have supported low-carbon electric power sources, along with energy storage to provide backup power during periods of high demand or reduced output from renewables. During negotiations, however, the Senate dropped the clean energy credits altogether and slashed EV funding by over 90%.
Of the $15 billion that remains for electric vehicles, $2.5 billion would purchase electric school buses, while a proposed EV charging network of some 500,000 stations would get $7.5 billion – about half the amount needed, according to Energy Secretary Jennifer Granholm.
As for the power grid, the infrastructure bill does include about $27 billion in direct funding and loans to improve grid reliability and climate resilience. It would also create a Grid Development Authority under the U.S. Department of Energy, charged with developing a national grid capable of moving renewable energy throughout the country.
The infrastructure bill may be further modified by the House before it reaches President Joe Biden’s desk, but many of the elements that were dropped have been added to another bill that’s headed for the House: the $3.5 trillion budget plan.
As agreed to by Senate Democrats, that plan incorporates many of the Biden administration’s climate proposals, including tax credits for solar, wind and electric vehicles; a carbon tax on imports; and requirements for utilities to increase the amount of renewables in their energy mix. Senators can approve the budget by simple majority vote during “reconciliation,” though by then it will almost certainly have been trimmed again.
[Over 100,000 readers rely on The Conversation’s newsletter to understand the world.Sign up today.]
Overall, the bipartisan infrastructure bill looks like a small but genuine down payment on a more climate-friendly transport sector and electric power grid, all of which will take years to build out.
But to claim global leadership in avoiding the worst potential effects of climate change, the U.S. will need at least the much larger commitment promised in the Democrats’ budget plan.
Click on a thumbnail graphic to view a gallery of drought data from the US Drought Monitor.
US Drought Monitor map August 31, 2021.
High Plains Drought Monitor map August 31, 2021.
West Drought Monitor map August 31, 2021.
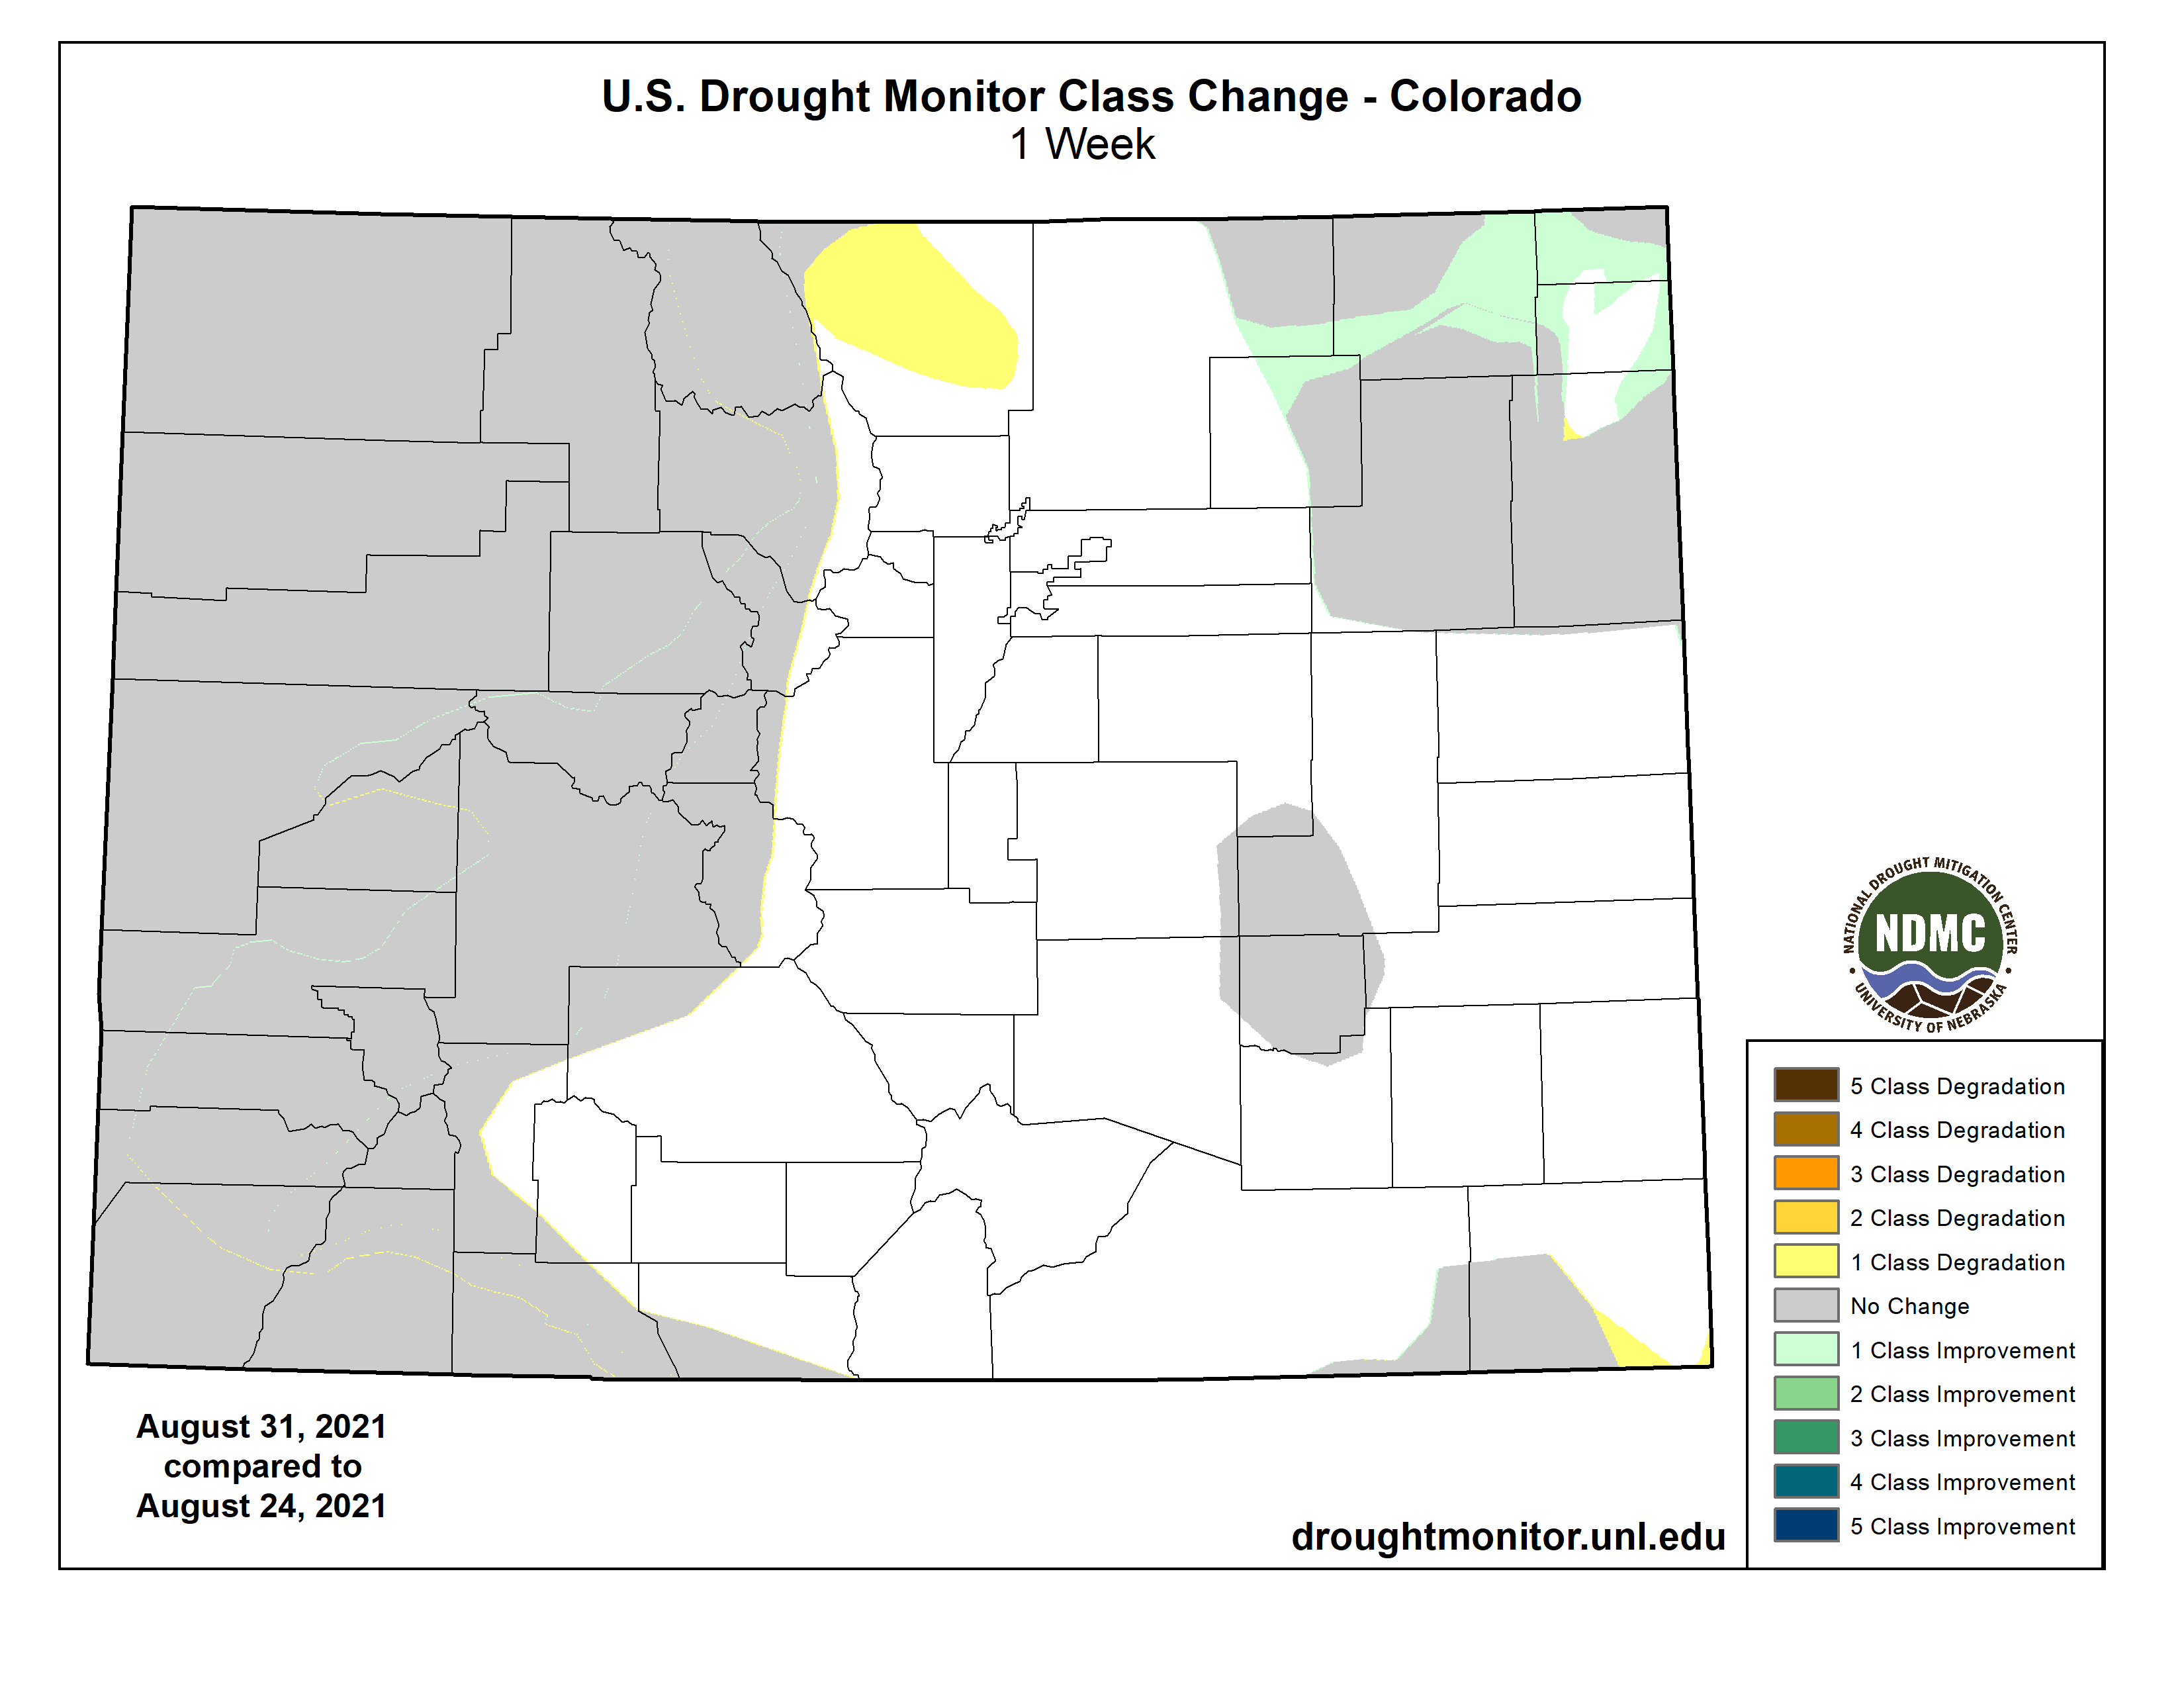
Colorado Drought Monitor map August 31, 2021.
Click here to go to the US Drought Monitor website. Here’s an excerpt:
This Week’s Drought Summary
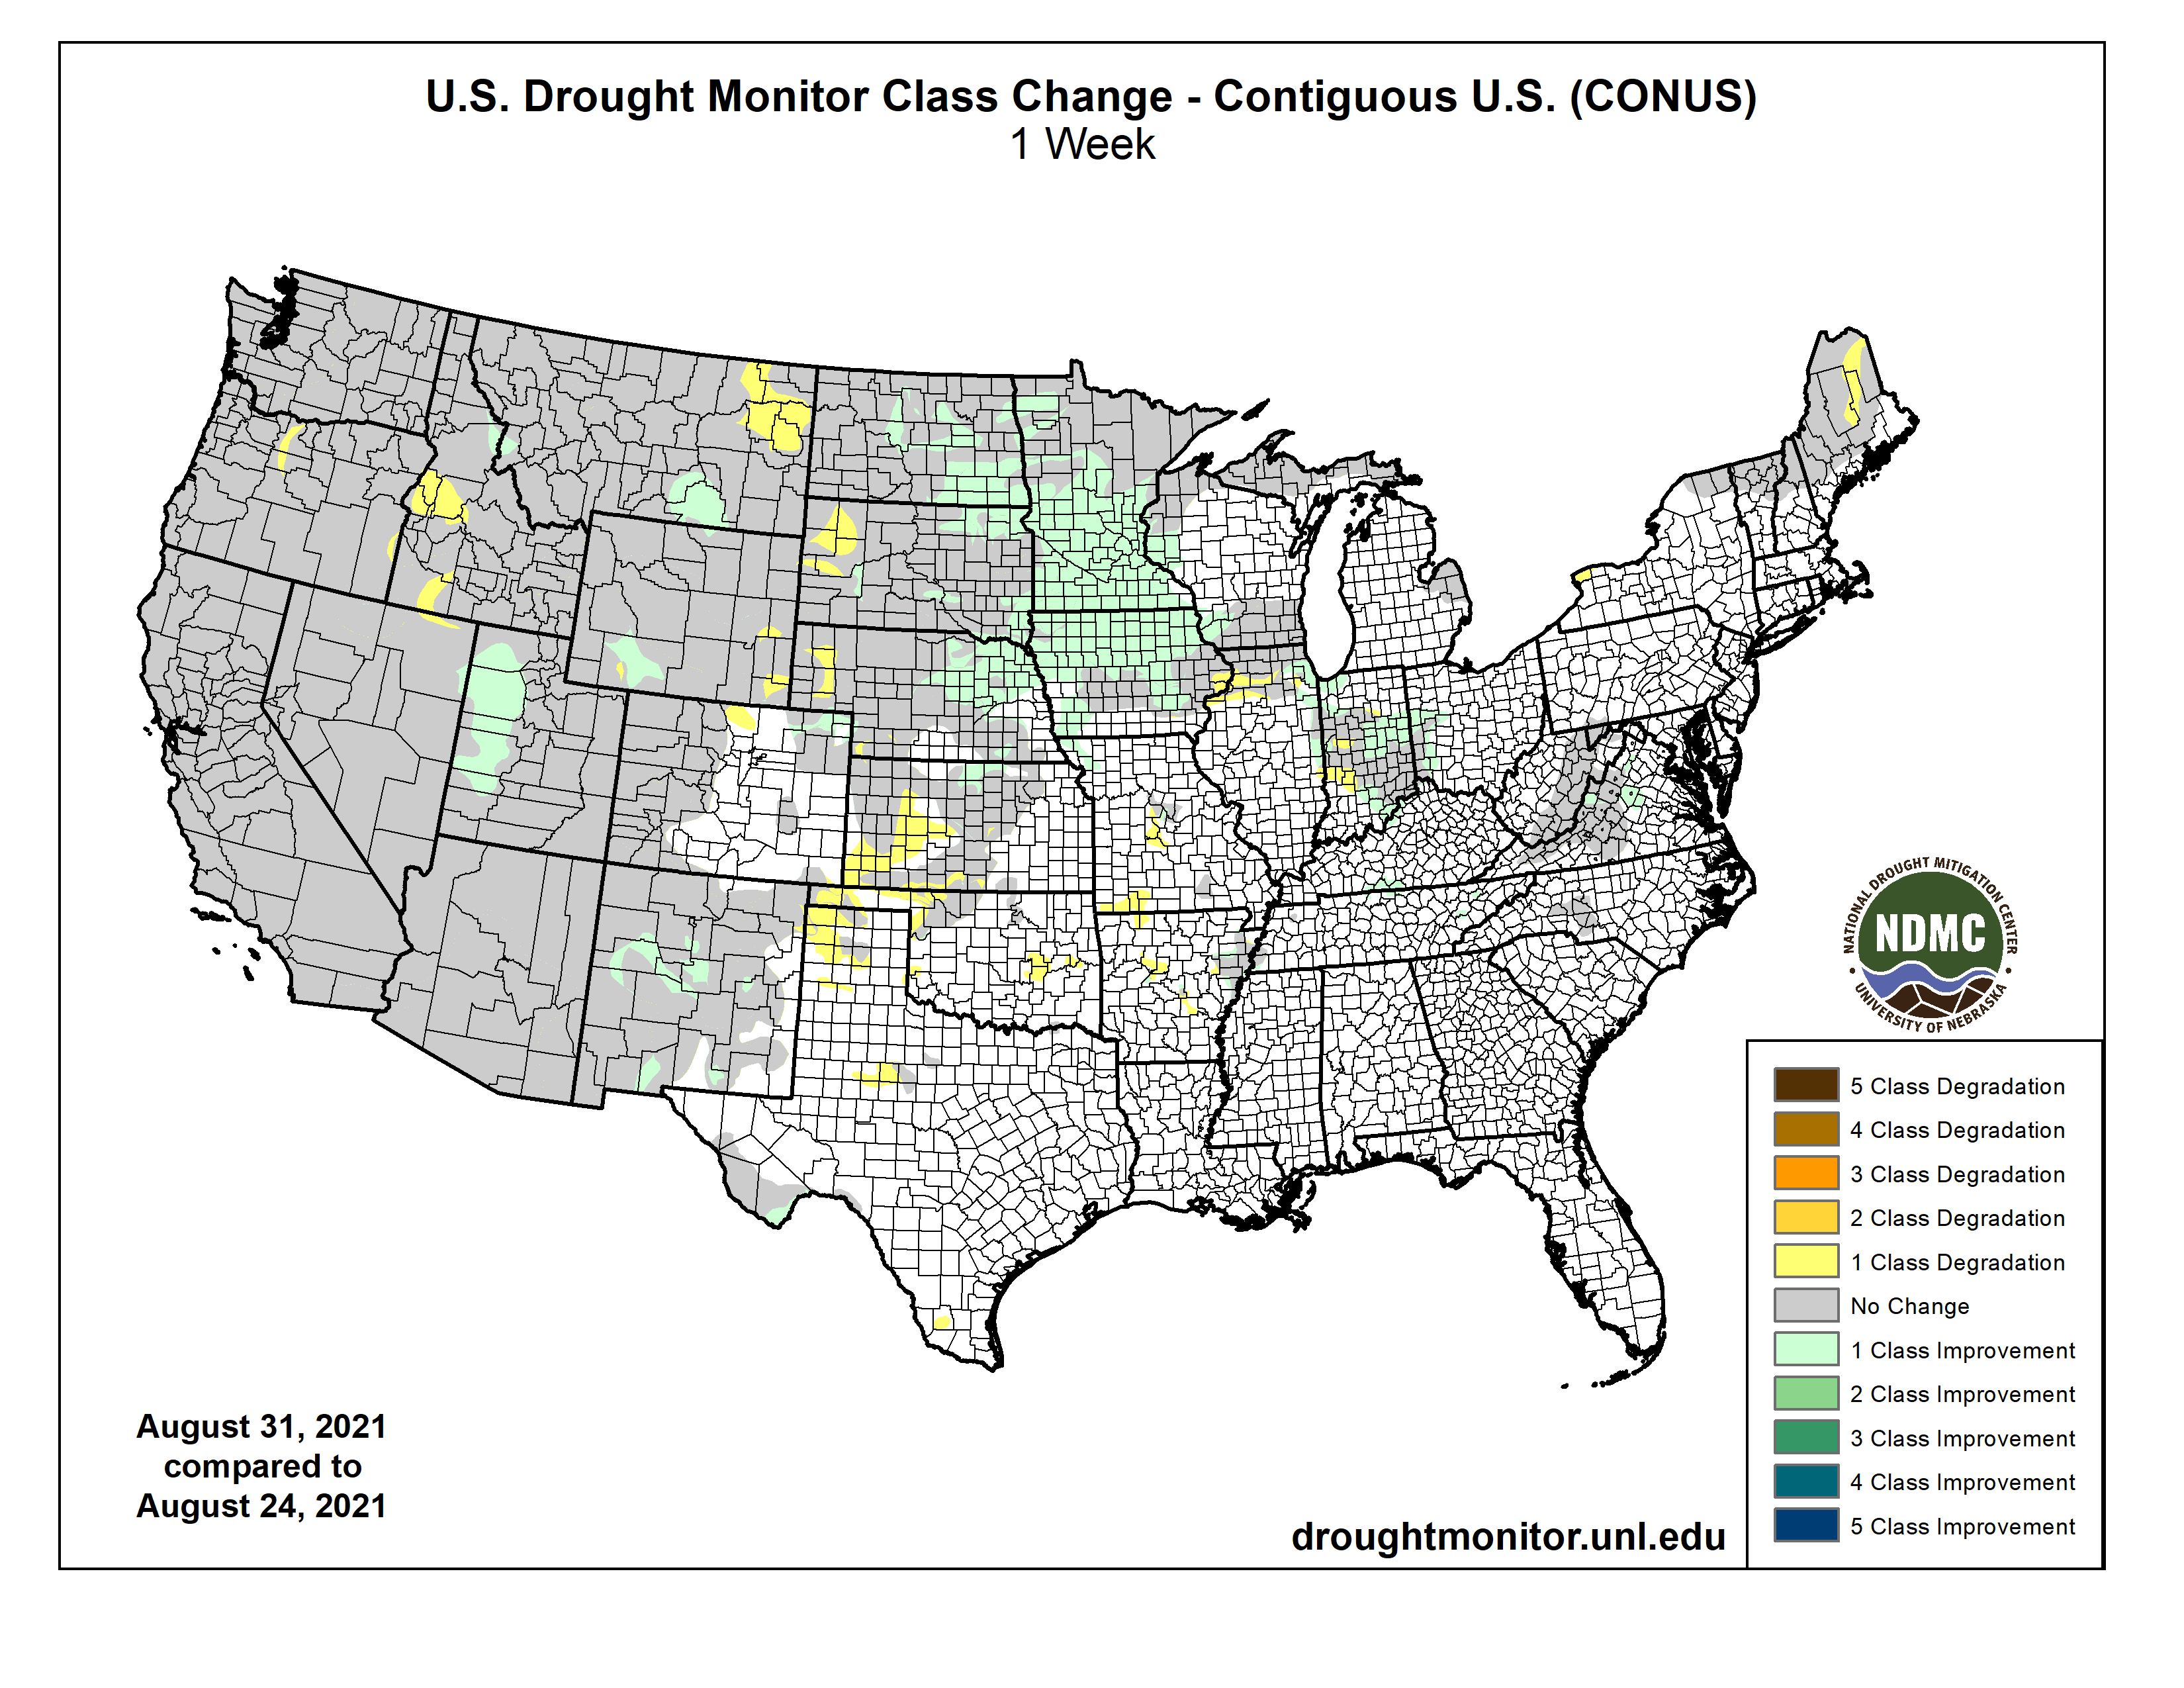
This U.S. Drought Monitor (USDM) week saw widespread improvements across areas of the Midwest and eastern portions of the Central and Northern Plains states in response to beneficial rainfall. Rainfall accumulation in these areas ranged from 2 to 12+ inches leading to one-category improvements across areas of the Dakotas, Nebraska, Kansas, Iowa, Minnesota, and Wisconsin. In the South, Hurricane Ida made landfall along the Gulf Coast of Louisiana on Sunday as a Category 4 hurricane with maximum sustained winds of 150 mph. The hurricane caused extensive infrastructure damage including widespread power outages in Louisiana and Mississippi, impacting more than 1 million homes and businesses as well as stranding residents amongst the floodwaters. In the West, dry conditions persisted across most of the region with approximately 90% of the region currently categorized as “in drought”. In California, two major wildfires (Dixie and Caldor fires) continued to intensify and expand due to the dry and windy conditions. In El Dorado County, California, the Caldor Fire continued to rapidly spread this week leading to the evacuation of residents in communities on the southern end of the Lake Tahoe Basin—including the City of South Lake Tahoe. In addition to impacting fire conditions, the on-going drought in California continues to strain the state’s water resources. This is reflected in the reservoir levels of California’s two largest reservoirs, Lake Shasta and Lake Oroville, which are currently at 43% and 34% of historical averages, respectively. In the Southwest, Lake Powell is currently 31% full and Lake Mead is 35% full. The total Lower Colorado system is at 40% full, according to the U.S. Bureau of Reclamation, compared to 50% full at the same time last year…
On this week’s map, areas of the region—including eastern portions of the Dakotas, Nebraska, and Kansas—saw widespread improvements in drought-stricken areas experiencing Exceptional Drought (D4), Extreme Drought (D3), Severe Drought (D2), and Moderate Drought (D1). The improvements were made in response to heavy rainfall during the past week (ranging from 2 to 5 inches) and minor improvements to soil moisture levels in some areas. Conversely, western portions of the Dakotas have continued to experience rainfall and soil moisture deficits which have severely impacted crops as well as pasture and rangeland conditions. According to the latest (August 29) USDA North Dakota Crop Progress and Condition report, pasture and range conditions across the state were rated 61% very poor and 24% poor, while stock water supplies were rated 58% very short and 31% short. According to the most recent (August 29) USDA South Dakota Crop Progress and Condition report, pasture and range conditions across the state were rated 48% very poor and 36% poor, while corn condition was rated 16% very poor and 29% poor. In terms of NOAA NCEI’s climatological rankings, North Dakota observed its 11th driest (-3.11-inch anomaly) May-July period as well as its 3rd driest (-7.40-inch anomaly) August-July period on record. Similarly, South Dakota had its driest (-3.17-inch anomaly) May-July on record as well as its 7th driest (-5.45-inch anomaly) August-July period on record…
Colorado Drought Monitor one week change map ending August 31, 2021.
Currently, ~90% of the West region (including Colorado and Wyoming) is categorized as “in drought” on the map with 54% in Extreme Drought (D3) or Exceptional Drought (D4). On this week’s map, some improvements were made in New Mexico and Utah in response to the cumulative impact of this summer’s active monsoon and its associated short-term improvements to vegetative health, soil moisture, and streamflow activity. Elsewhere, degradations were made on the map in the eastern plains of Montana, southeastern Wyoming, southern Idaho, and central Oregon. In Northern California, dry and windy conditions led to further expansion and intensification of the Dixie and Caldor fires during the past week. According to CalFire, the Dixie Fire is now the second largest wildfire in California history, while Caldor Fire is now the 15th largest. According to the National Interagency Coordination Center’s Incident Management Situation Report (Sept 1), the Dixie Fire had burned 819,956 acres (49% contained) and the Caldor Fire totals 199,632 acres (18% contained). During the past week, the Caldor Fire spread rapidly eastward up the Highway 50 corridor and into the Lake Tahoe Basin, leading to evacuation of the largest town in the basin—South Lake Tahoe. Looking at reservoir conditions across the region, statewide reservoir storage levels (August 1) were below normal across all the western states with the exception of Montana and Washington. In California, the state’s two largest reservoirs, Lake Shasta and Lake Oroville, were at 43% and 34% of historical averages on August 31, respectively. In the Colorado River Basin, Lake Mead is currently 35% full and Lake Powell is at 31% full (August 31). On a positive note, this summer’s monsoonal rains have led to some modest reservoir inflows in the Salt and Verde River system reservoirs in Arizona where the total reservoir system was at 71% full (85% full one year ago) as of August 31. For the week, rainfall activity (accumulations generally <2 inches) across the region was restricted to isolated areas of Arizona and New Mexico as well as central and eastern Montana. Average temperatures during the past week were slightly above normal (1 to 8 deg F degrees) across the southern half of the region, while cooler-than-normal temperatures were observed in northern portions ranging from 1 to 8 deg F below normal. According to NOAA NCEI, Arizona experienced its 2nd wettest July on record as well as its 3rd wettest May-July period on record...
On Sunday, Hurricane Ida made landfall along the Louisiana coast as a Category 4 hurricane with maximum sustained wind of 150 mph. Hurricane Ida was the second most intense hurricane to impact the state of Louisiana, causing major widespread damage to infrastructure across the southeastern part of the state. Rainfall accumulations in the direct path of Ida ranged from 2 to 15+ inches with the heaviest accumulations observed along the coastal areas of southeastern Louisiana and Mississippi. On this week’s map, drought-related conditions deteriorated in north-central as well as in the Oklahoma Panhandle where short-term dryness (past 30-day period) and reports of poor crop conditions led to the introduction of an area of Moderate Drought (D1). In the Texas Panhandle, precipitation deficits during the past 30- to-90-day period led to expansion of areas of Abnormally Dry (D0), while conditions improved to the south in the Big Bend region where precipitation has been above normal during the past month. According to NOAA NCEI, the May-July 2021 period was the 4th wettest on record in the South Climate Region and the 3rd and 5th wettest May-July period statewide for Texas and Louisiana, respectively…
Looking Ahead
The NWS WPC 7-Day Quantitative Precipitation Forecast (QPF) calls for moderate-to-heavy liquid accumulations ranging from 2 to 4+ inches across areas of the Northern and Central Plains as well as along the western portion of the Midwest. In the Northeast, heavy rainfall accumulations (2 to 7 inches) are expected in an area extending from Pennsylvania to Maine, with the highest rainfall totals expected in eastern Pennsylvania and coastal areas of New England. In the Southeast and the South, light rainfall accumulations (generally <1 inch) are expected with the exception of central Gulf Coast of Florida where moderate-to-heavy accumulations (2 to 5 inches) are forecasted. In the West, monsoonal showers are expected across isolated areas of the Four Corners states with the heaviest accumulations expected in southern New Mexico, while the remainder of the West is forecasted to experience dry conditions. The CPC 6-10-day Outlooks calls for a moderate-to-high probability of above-normal temperatures across the western half of the conterminous United States as well as along coastal areas of the Eastern Seaboard. Elsewhere, there is a moderate probability of below-normal temperatures across the Midwest, Mid-Atlantic, and northern portions of the South. In terms of precipitation, there is a low-to-moderate probability of above-normal precipitation across portions of California, Nevada, Arizona, and Utah as well as across areas of the Upper Midwest and the Northeast. In contrast, below-normal precipitation is expected across the Pacific Northwest, and areas east of the Continental Divide extending across the Plains states to the Southeastern U.S.
US Drought Monitor one week change map ending August 31, 2021.
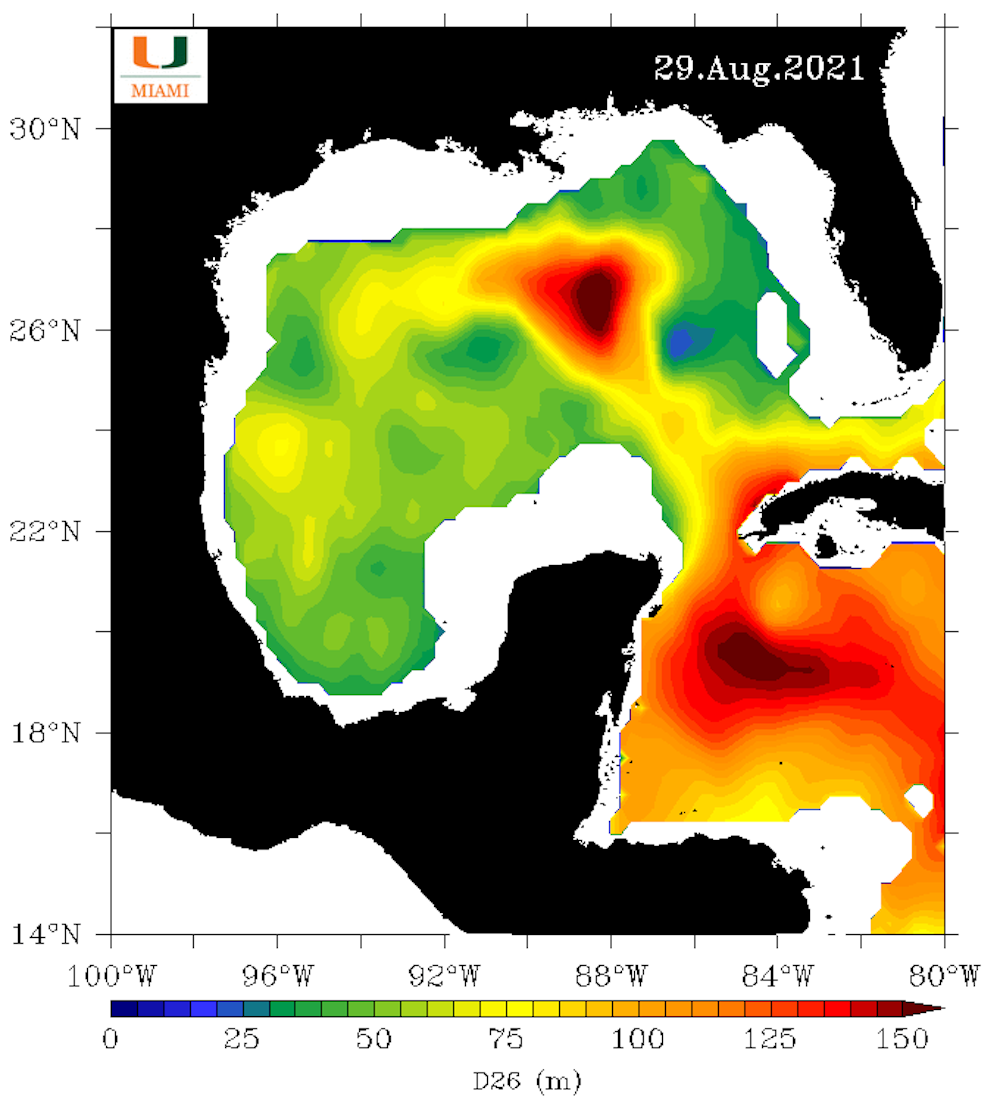
As Hurricane Ida headed into the Gulf of Mexico, a team of scientists was closely watching a giant, slowly swirling pool of warm water directly ahead in its path.
That warm pool, an eddy, was a warning sign. It was around 125 miles (200 kilometers) across. And it was about to give Ida the power boost that in the span of less than 24 hours would turn it from a weak hurricane into the dangerous Category 4 storm that slammed into Louisiana just outside New Orleans on Aug. 29, 2021.
The Loop Current is a key component of a large gyre, or circular current, rotating clockwise in the North Atlantic Ocean. Its strength is related to the flow of warm water from the tropics and Caribbean Sea into the Gulf of Mexico and out again through the Florida Straits, between Florida and Cuba. From there, it forms the core of the Gulf Stream, which flows northward along the Eastern Seaboard.
In the Gulf, this current can start to shed large warm eddies when it gets north of about the latitude of Fort Myers, Florida. At any given time, there can be as many as three warm eddies in the Gulf, slowly moving westward. When these eddies form during hurricane season, their heat can spell disaster for coastal communities around the Gulf.
Subtropical water has a different temperature and salinity than Gulf common water, so its eddies are easy to identify. They have warm water at the surface and temperatures of 78 degrees Fahrenheit (26 C) or more in water layers extending about 400 or 500 feet deep (about 120 to 150 meters). Since the strong salinity difference inhibits mixing and cooling of these layers, the warm eddies retain a considerable amount of heat.
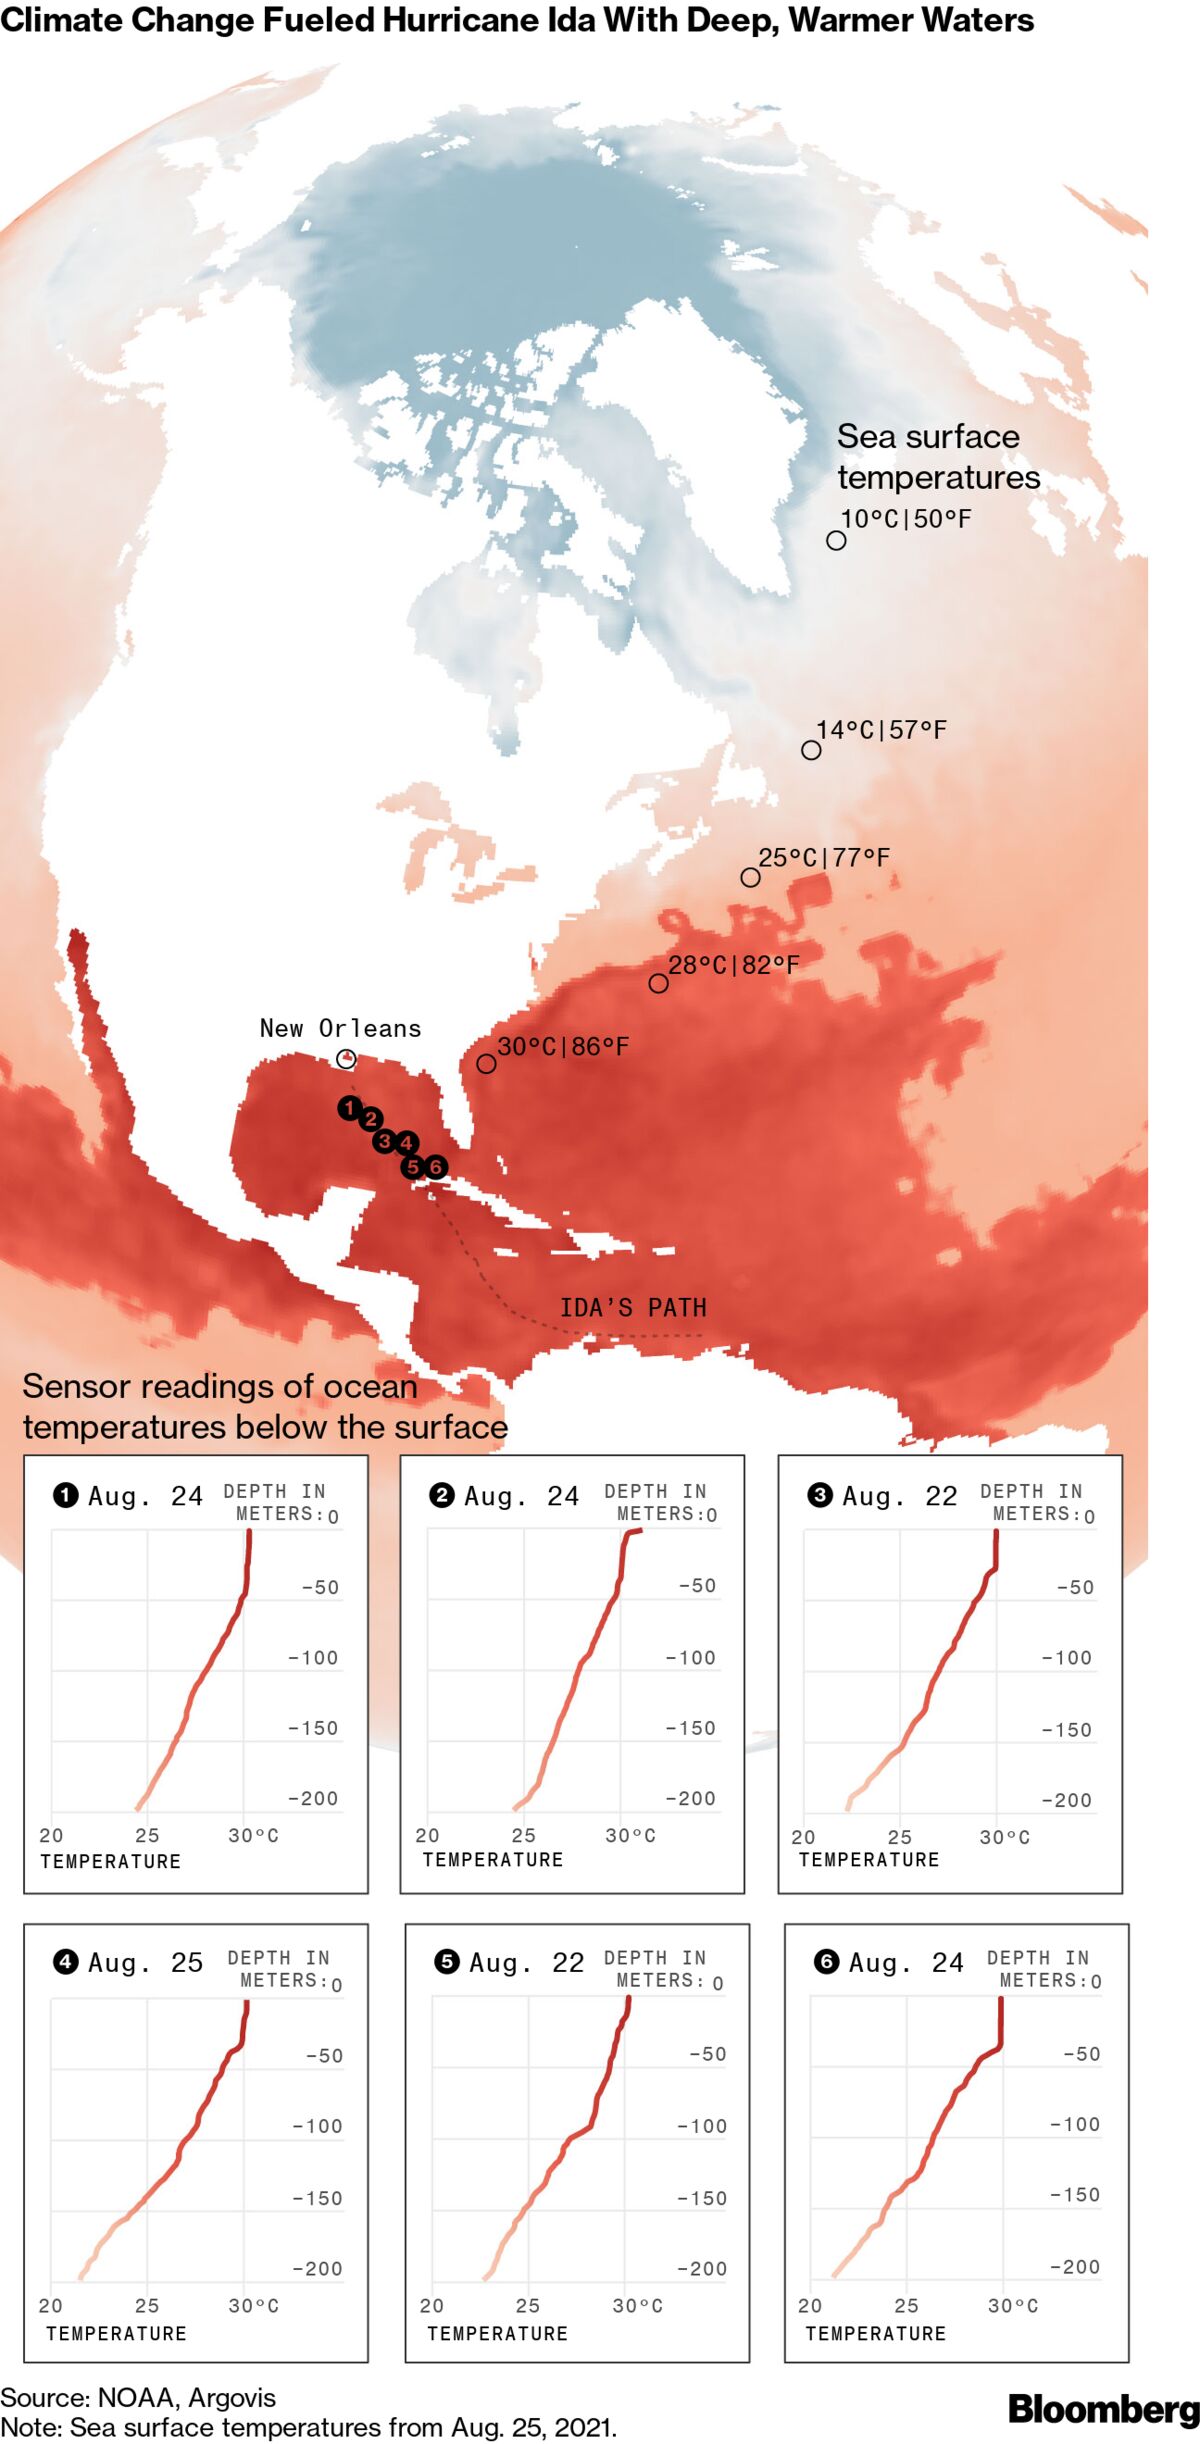
When heat at the ocean surface is over about 78 F (26 C), hurricanes can form and intensify. The eddy that Ida passed over had surface temperatures over 86 F (30 C).
How did you know this eddy was going to be a problem?
We monitor ocean heat content from space each day and keep an eye on the ocean dynamics, especially during the summer months. Keep in mind that warm eddies in the wintertime can also energize atmospheric frontal systems, such as the “storm of the century” that caused snowstorms across the Deep South in 1993.
To gauge the risk this heat pool posed for Hurricane Ida, we flew aircraft over the eddy and dropped measuring devices, including what are known as expendables. An expendable parachutes down to the surface and releases a probe that descends about 1,300 to 5,000 feet (400 to 1,500 meters) below the surface. It then sends back data about the temperature and salinity.
This eddy had heat down to about 480 feet (around 150 meters) below the surface. Even if the storm’s wind caused some mixing with cooler water at the surface, that deeper water wasn’t going to mix all the way down. The eddy was going to stay warm and continue to provide heat and moisture.
Ida’s route to Louisiana passed through very warm water. The scale, in meters, shows the maximum depth at which temperatures were 78 degrees Fahrenheit (26 C) or greater. University of Miami, CC BY-ND
When warm water extends deep like that, we start to see the atmospheric pressure drop. The moisture transfers, or latent heat, from the ocean to atmosphere are sustained over the warm eddies since the eddies are not significantly cooling. As this release of latent heat continues, the central pressures continue to decrease. Eventually the surface winds will feel the larger horizontal pressure changes across the storm and begin to speed up.
That’s what we saw the day before Hurricane Ida made landfall. The storm was beginning to sense that really warm water in the eddy. As the pressure keeps going down, storms get stronger and more well defined.
When I went to bed at midnight that night, the wind speeds were about 105 miles per hour. When I woke up a few hours later and checked the National Hurricane Center’s update, it was 145 miles per hour, and Ida had become a major hurricane.
How hurricanes draw fuel from water water. Credit: NOAA
Is rapid intensification a new development?
We’ve known about this effect on hurricanes for years, but it’s taken quite a while for meteorologists to pay more attention to the upper ocean heat content and its impact on the rapid intensification of hurricanes.
In 1995, Hurricane Opal was a minimal tropical storm meandering in the Gulf. Unknown to forecasters at the time, a big warm eddy was in the center of the Gulf, moving about as fast as Miami traffic in rush hour, with warm water down to about 150 meters. All the meteorologists saw in the satellite data was the surface temperature, so when Opal rapidly intensified on its way to eventually hitting the Florida Panhandle, it caught a lot of people by surprise.
Today, meteorologists keep a closer eye on where the pools of heat are. Not every storm has all the right conditions. Too much wind shear can tear apart a storm, but when the atmospheric conditions and ocean temperatures are extremely favorable, you can get this big change.
Hurricanes Katrina and Rita, both in 2005, had pretty much the same signature as Ida. They went over a warm eddy that was just getting ready to be shed form the Loop Current.
Hurricane Michael in 2018 didn’t go over an eddy, but it went over the eddy’s filament – like a tail – as it was separating from the Loop Current. Each of these storms intensified quickly before hitting land.
Of course, these warm eddies are most common right during hurricane season. You’ll occasionally see this happen along the Atlantic Coast, too, but the Gulf of Mexico and the Northwest Caribbean are more contained, so when a storm intensifies there, someone is going to get hit. When it intensifies close to the coast, like Ida did, it can be disastrous for coastal inhabitants.
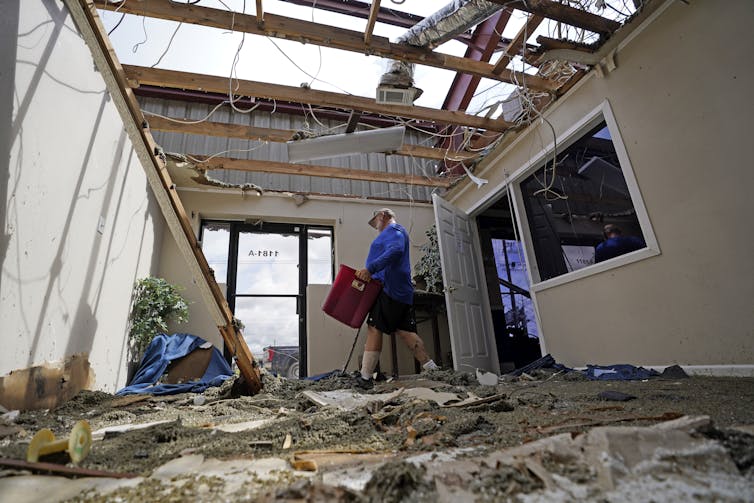
Hurricane Ida hit the coast with 150 mph winds that tore roofs off homes and buildings. Its storm surge caused widespread flooding outside the region’s levee system. AP Photo/David J. Phillip
What does climate change have to do with it?
We know global warming is occurring, and we know that surface temperatures are warming in the Gulf of Mexico and elsewhere. When it comes to rapid intensification, however, my view is that a lot of these thermodynamics are local. How great a role global warming plays remains unclear.
This is an area of fertile research. We have been monitoring the Gulf’s ocean heat content for more than two decades. By comparing the temperature measurements we took during Ida and other hurricanes with satellite and other atmospheric data, scientists can better understand the role the oceans play in the rapid intensification of storms.
Once we have these profiles, scientists can fine-tune the computer model simulations used in forecasts to provide more detailed and accurate warnings in the futures.
[Over 100,000 readers rely on The Conversation’s newsletter.Sign up today.]
A recent study assessed 29 PFAS coming into and out of the Arctic Ocean.
In the last five years, the environmental problem known as PFAS has become mainstream public knowledge and a growing public concern. Aided by popular movies, books, and environmental advocates, including dozens of recently-formed citizen action groups, many have now heard of PFAS — shorthand for per- and polyfluoroalkyl substances — and are familiar with one or more potential health consequences from prolonged exposure to these chemicals — e.g., cancer, immune system malfunctions, hypertension, thyroid and kidney disease.
When introduced to the marketplace in the early 1950’s due to features like oil and water repellency, flame retardancy, and general indestructibility, PFAS have been used in industrial and product manufacturing for at least eight decades. Their seemingly ubiquitous usage in a wide range of consumer products and frequent daily contact with these “forever chemicals” is assured for most people. For instance, PFAS is found in:
Carpets and upholstery (including child car seats!);
Cosmetic and personal hygiene products such as dental floss and makeup;
Food wrappers and carry-out containers;
Water resistant shoes and clothing;
and Cookware.
While exposure to PFAS in these everyday items is becoming increasingly well known, new information continues to surface pointing to some of the more surprising places PFAS can be found, from the far away to the very local.
PFAS in the Remote Arctic
A recent study assessed 29 PFAS coming into and out of the Arctic Ocean. The study identified the widespread distribution of 11 PFAS, including PFOA, which has mostly been phased out of the industry, and a newer replacement PFAS: HFPO-Dimer Acid (sold under the trade name Gen-X). Higher levels of PFAS were detected in the water exiting the Arctic Ocean compared with the water entering the Arctic from the North Atlantic, suggesting that more of these compounds arose from atmospheric sources than from ocean circulation. PFAS has also been shown to bioaccumulate in the Arctic marine ecosystem, including in seals, waterfowl and even the brain tissue of polar bears.
PFAS in Fracking Chemicals
Many are not looking for another reason to disfavor the practice of using hydraulic fracturing (i.e., fracking) to extract oil and gas from the ground. And by now, many more communities are becoming less enamored with the thought that PFAS has been so widely used in so many products and processes for so long. But the idea of using PFAS chemicals for fracking represents a severe double negative. And yet, a recent report, Fracking with “Forever Chemicals,” published by the Physicians for Social Responsibility, suggests that the practice of using certain PFAS in the fracking chemical mixture has been going on for the past decade. Despite environmental concerns posited by the EPA, the use of “trade-secret non-ionic fluorosurfactants” was approved by the agency and has been applied at more than 1,200 wells in six states.
PFAS in The Vegetable Drawer?
Dietary intake is a major potential exposure pathway for PFAS that continues to be assessed. A 2018 study by the U.S. Food and Drug Administration (FDA) sampled foods, including lettuce, cabbage, corn and tomatoes, from areas of the country with known PFAS contamination. Of the 20 samples, 16 were found to contain PFAS. Produce using irrigation water or soil contaminated with PFAS readily uptake the chemicals, with contaminant transfer influenced by concentrations and mixtures of PFAS, plant species, soil organic carbon and other factors. Thus, dietary exposure to PFAS is very likely when contaminated irrigation water is used, pointing to the need for further studies, testing and eventually the establishment of PFAS limits for irrigation water.
PFAS in Blood
According to the U.S. Center for Disease Control (CDC) data, PFAS is found in almost all Americans’ blood, regardless of age, race, or gender. And although the CDC states, “Human health effects from PFCs at low environmental doses or at bio-monitored levels from low environmental exposures are unknown,” the fact that the average total PFAS in blood serum currently exceeds 5,000 parts per trillion (ppt) should make one pause. Trends over time indicate these levels are slowly decreasing as PFAS materials are gradually phased out of manufacturing. Nevertheless, there is much work to be done to identify and remove the PFAS sources contributing to all the various source of PFAS in our blood…
PFAS in Drinking Water
After nearly 80 years of manufacturing, uncontrolled releases, and disposal practices, it should not be too surprising that PFAS is found in drinking water. It is, however, the vast extent of these impacts that is both surprising and unsettling. According to recent estimates by the Environmental Working Group, more than 200 million Americans may be exposed to PFAS simply by drinking a glass of water. And to date, more than 2,200 public water supplies have been identified with PFAS contaminants. From the lens of human health and risk assessment, much of the nation’s drinking water is now considered a source of PFAS exposure.
Groundwater supplies approximately 40% of U.S. drinking water. The risk of PFAS groundwater contamination is most significant where it is encountered at shallow depths and where there are PFAS sources nearby (e.g. a fire training area at a military base). It is impossible to know, as we are only beginning to comprehend, how many PFAS-contaminated groundwater sites exist, but there are undoubtedly many thousands. Fortunately, a field-proven method is available and being used now to effectively address PFAS contamination in groundwater near these source areas and cut off these contaminants from potential human and environmental exposure.
Colloidal Activated Carbon Barriers for PFAS Removal
This PFAS treatment approach uses a colloidal form of activated carbon applied in situ – i.e. directly into the groundwater. The colloidal activated carbon (CAC) treatment works by intercepting contaminants that move naturally through established groundwater pathways. To accomplish this, CAC is injected along a line of delivery points into the affected aquifer zone to form a permeable reactive barrier (PRB). As groundwater migrates across the PRB, PFAS sorbs onto the carbon, removing it from the water. With PFAS removed from the water, the exposure pathway is eliminated and so is the risk.
Schematic of an in situ CAC PRB preventing migration of PFAS to sensitive receptors. Graphic via Water & Wastes Digest
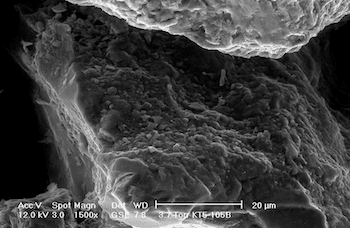
Material scientists developed CAC to overcome the challenge of evenly dispersing a solid injected material (i.e., activated carbon) through aquifer soils. Activated carbon particles are ground to 1 to 2 microns — the size of a red blood cell — and treated with a proprietary and drinking water-safe, anti-clumping agent that allows the CAC to permeate through and then adhere to the surface of individual soil grains.
In situ CAC treatments have been used to capture and treat groundwater contaminants since 2014 and applied at numerous PFAS-contaminated groundwater sites. Over one hundred PFAS projects have been implemented or are in the planning stages. The longest-running application has reduced PFAS for five years, with the treatment expected to be maintained 50 years based on independent, peer-reviewed modeling estimates.9 The approach is substantially more cost effective and technically feasible compared to any other treatment alternative. Performance-based warranty options are available from the manufacturer that can be tailored to a project’s needs.
PFAS contamination in the U.S. via ewg.org. [Click the map to go to the website.]
ALAMOSA just experienced its driest August ever, .01 inches of precipitation. The year also has seen Alamosa tie or break 12 high temperature records, according to the National Weather Service in Pueblo.
Don’t let the raindrops in the forecast fool you, either. What little precipitation falls now won’t change the trends of a warmer San Luis Valley and the challenges the change in climate is bringing to the Valley’s surface water and groundwater management practices. The average temperature this year to date is running 3.1f above the long term average for the January-to-July period.
Why it matters
“The concern for me is, we’re in months like August when we expect to get some of the monsoonal moisture,” said Heather Dutton, manager of the San Luis Valley Water Conservancy District, “and when we don’t, we go into the winter time dry. Even if we get above average precipitation in the winter months we can’t expect average stream flows in the spring because the moisture has to go back into wetting the landscape that was dried out this summer.”
If you’re looking for a silver lining, 2021 isn’t as warm as 2020. But then again, the January to July period of 2020 was also the 9th warmest of the past 73 years for maximum temperatures, according to NWS data.
Alamosa Record Temps 2021
Aug. 28 Temp 87, tied the record set in 2017
July 10 Temp 94, old record of 92 set in 2020 and 1992
July 9 Temp 92, tied the record set in 2003
July 8 Temp 91, tied the record set in 1989
June 17 Temp 92, old record of 89 set in 2012
June 16 Temp 94, old record of 87 set in 1950.
June 15 Temp 90, tied the record set in 1946 and 2000
June 14 Temp 91, old record of 88 set in 1952 and 2004
Protecting and improving habitat for wildlife is at the core of Colorado Parks and Wildlife’s mission. This video provides an intimate look at a recent habitat and forest-restoration project at the Spanish Peaks Wildlife Area near Trinidad, Colorado.


