Click on a thumbnail graphic to view a gallery of drought data from the US Drought Monitor.
US Drought Monitor map September 7, 2021.
High Plains Drought Monitor map September 7, 2021.
West Drought Monitor map September 7, 2021.
Colorado Drought Monitor map September 7, 2021.
Click here to go to the US Drought Monitor website. Here’s an excerpt:
This Week’s Drought Summary
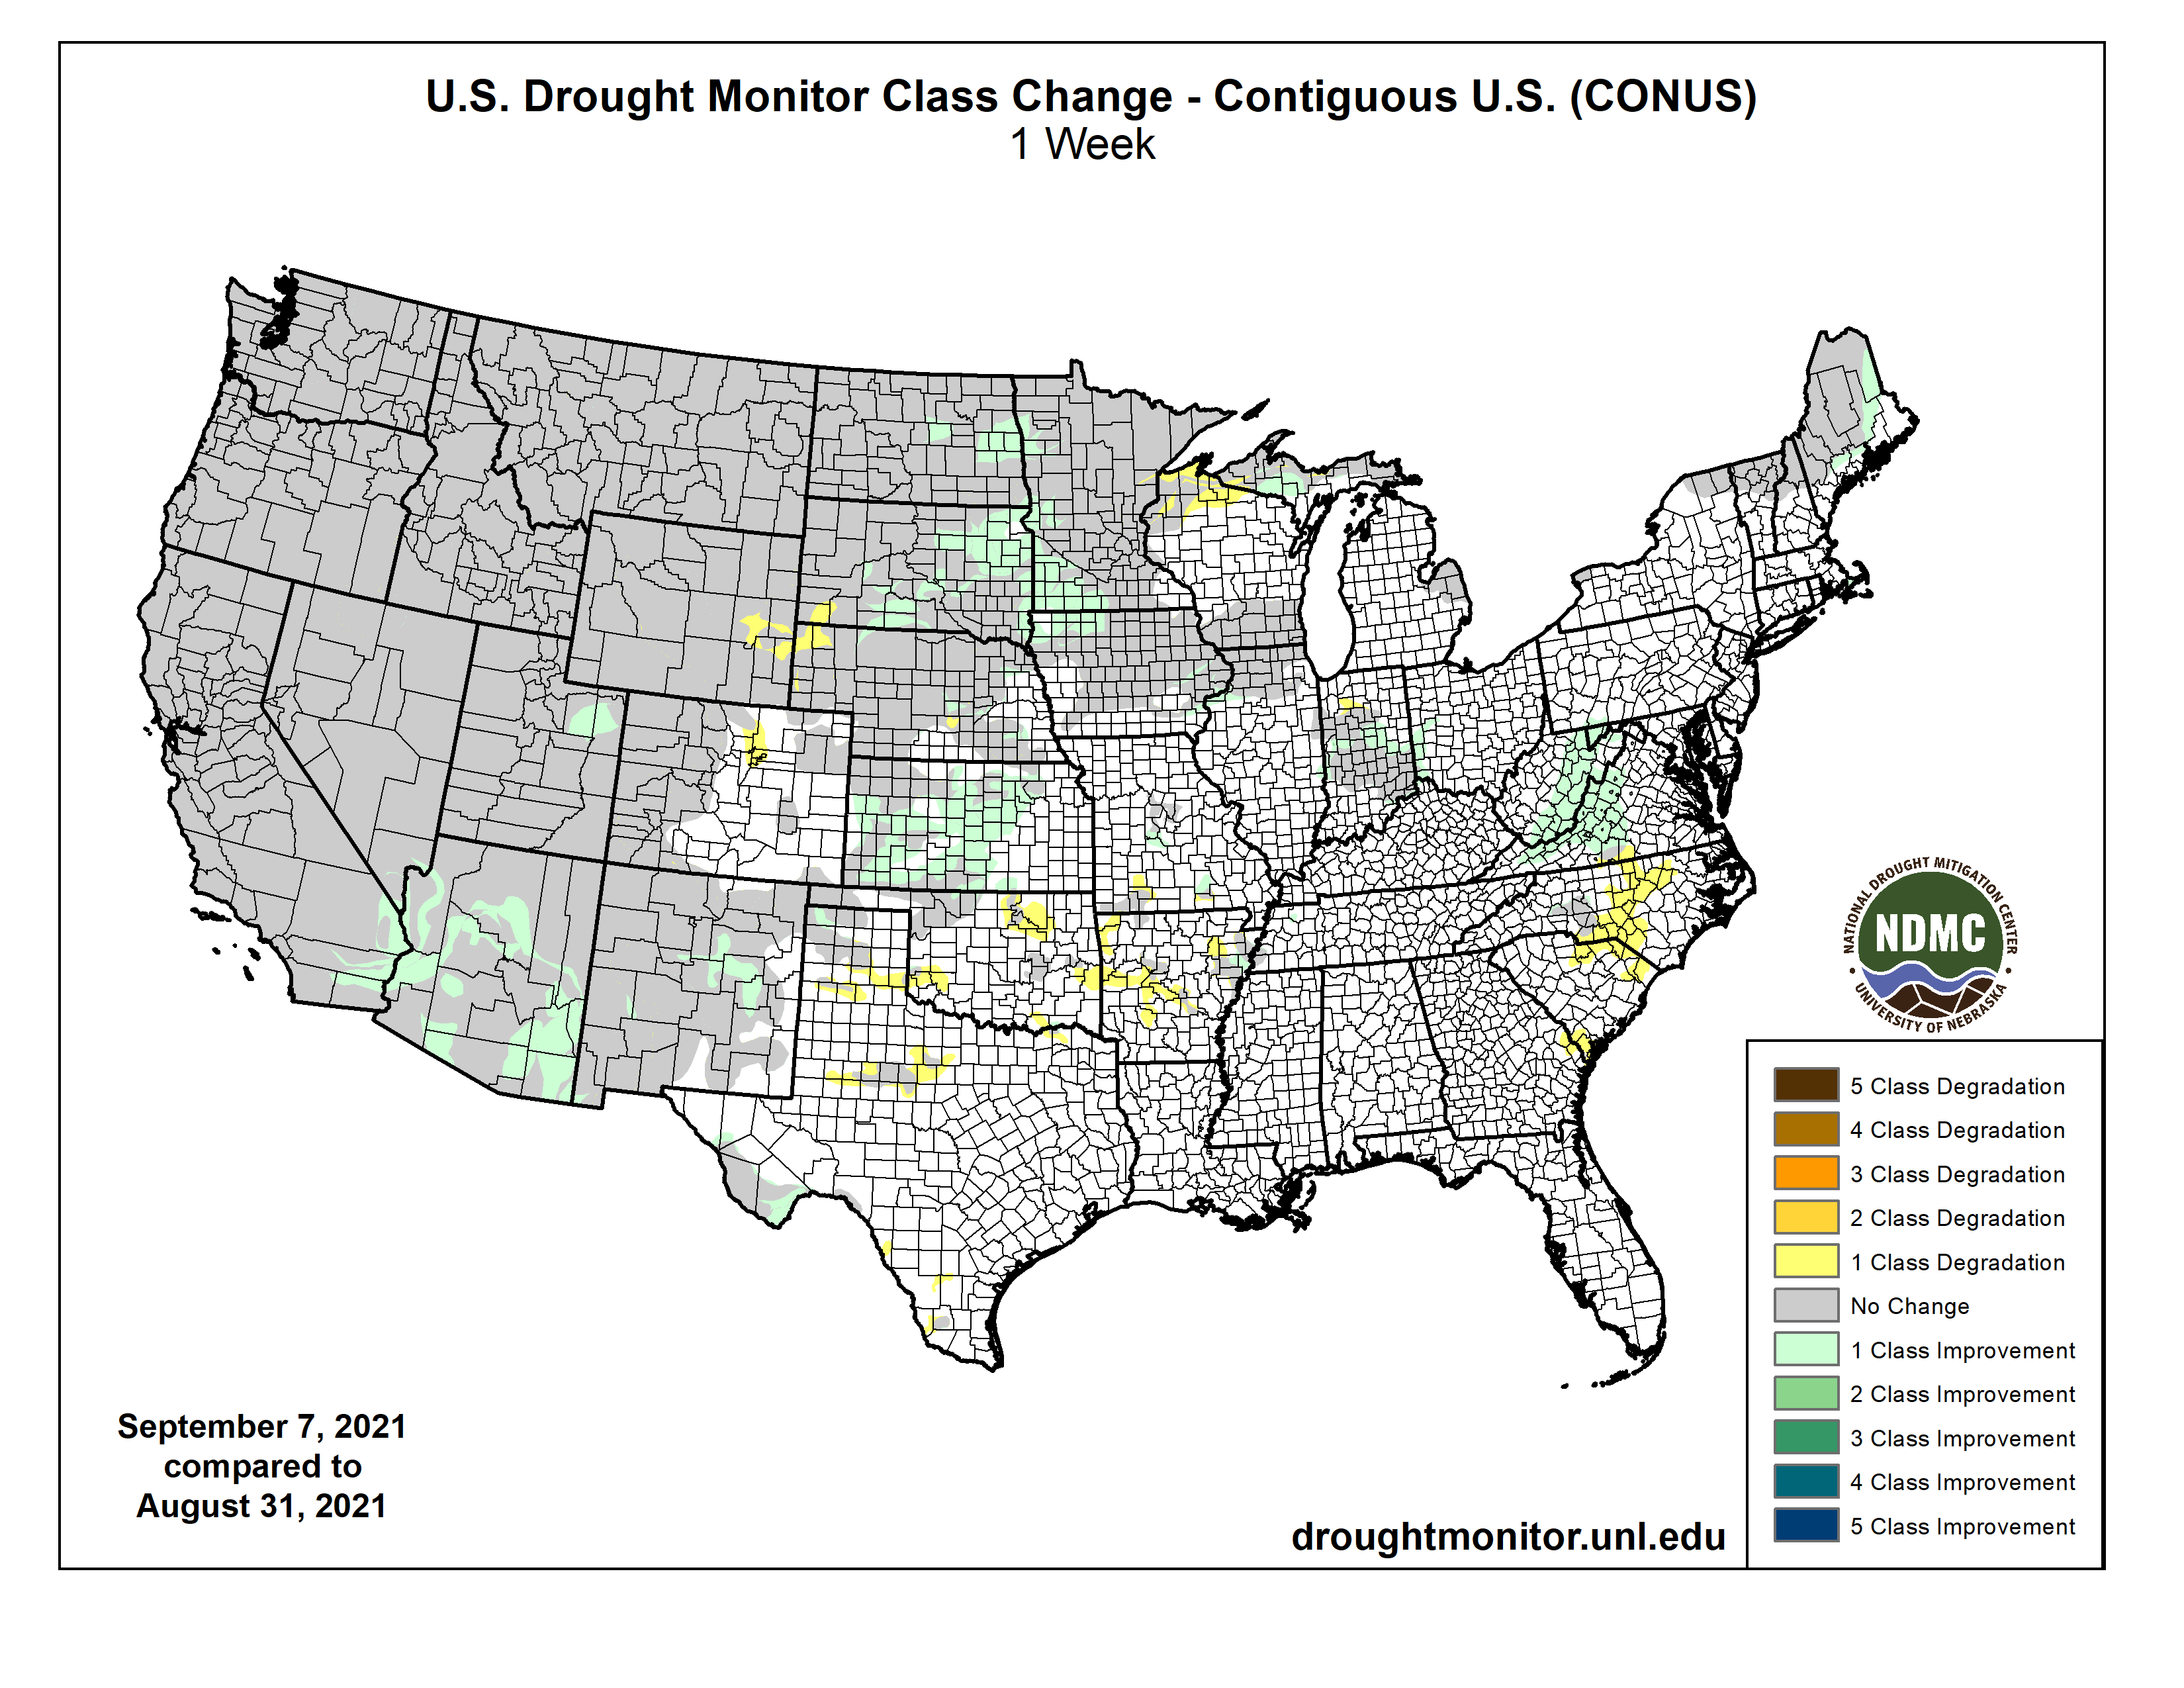
This U.S. Drought Monitor (USDM) week saw continued improvement in conditions across drought-stricken areas of the Central and Northern Plains states as well as in Iowa and Minnesota where light-to-moderate rainfall accumulations were observed. Despite recent precipitation in the Northern Plains, hay shortages and the associated costs of purchasing and transporting supplemental feed are forcing some ranchers to sell livestock. In response to the emerging situation, the U.S. Department of Agriculture (USDA) announced expansion of emergency assistance through the ELAP program to help cover feed transportation costs for drought-impacted ranchers. In the Northeast, the remnants of Hurricane Ida brought intense, heavy rains (5 to 10+ inches) and devastating flooding to areas of Pennsylvania, New Jersey, New York, and Connecticut. In the Southeast, short-term dryness (past 30- to 60-day period) and declining soil moisture and streamflow levels led to degradation on the map in portions of the Carolinas. In the South, short-term precipitation shortfalls and declining soil moisture levels led to some degradation of conditions in areas of Arkansas and Oklahoma that have largely missed out on recent rainfall events. Out West, dry conditions prevailed across most of the region this week. However, some beneficial rainfall was observed across isolated areas of the Southwest in association with the remnants of Hurricane Nora…
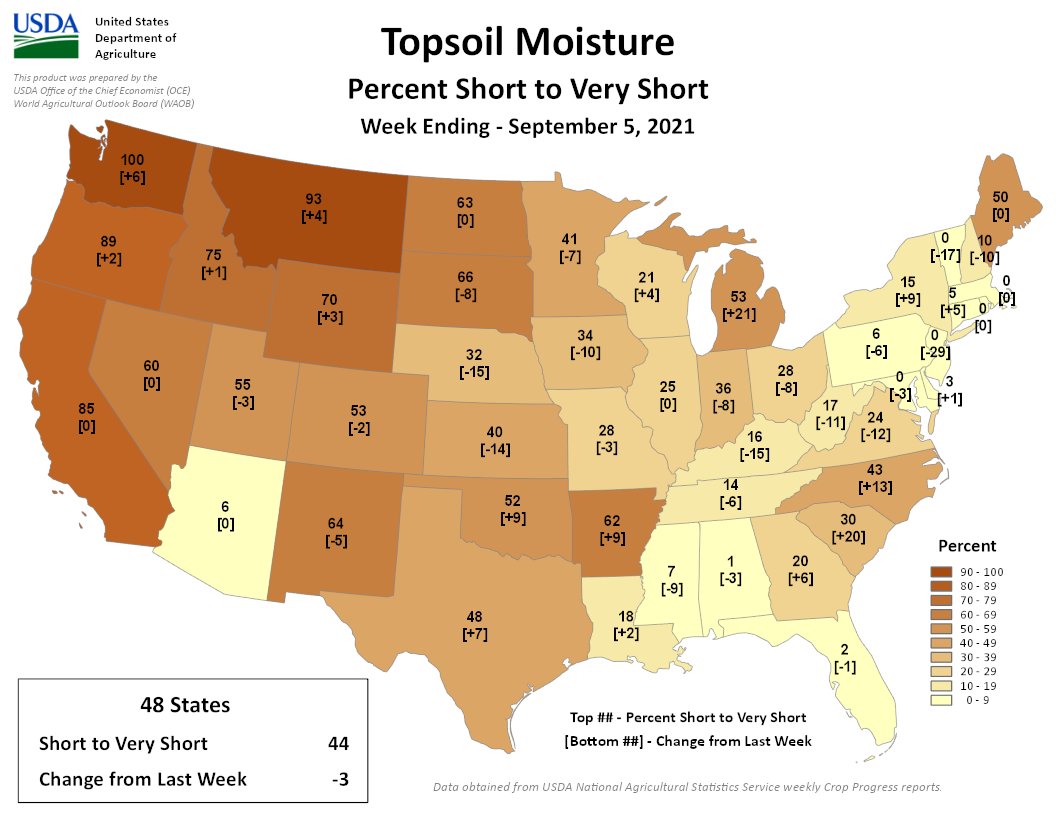
On this week’s map, areas of the region—including eastern portions of North Dakota, South Dakota, Nebraska, and Kansas—saw isolated improvements in response to continued rainfall activity. The heaviest rainfall in the region was observed in eastern Kansas where accumulations ranged from 2 to 7 inches, while areas further to the north in Nebraska and the Dakotas received 1-to-4-inch accumulations in isolated areas. For the last 30-day period, the percentage of normal precipitation has ranged from 100 to 300% of normal across a widespread area of the Central and Northern Plains. However, isolated pockets of dryness have persisted—particularly in western portions of the region that have not benefited from the recent rainfall events. According to the USDA for the week ending September 5, the percentage of topsoil in North Dakota rated short to very short was 63%, while neighboring South Dakota was rated 66% short to very short…
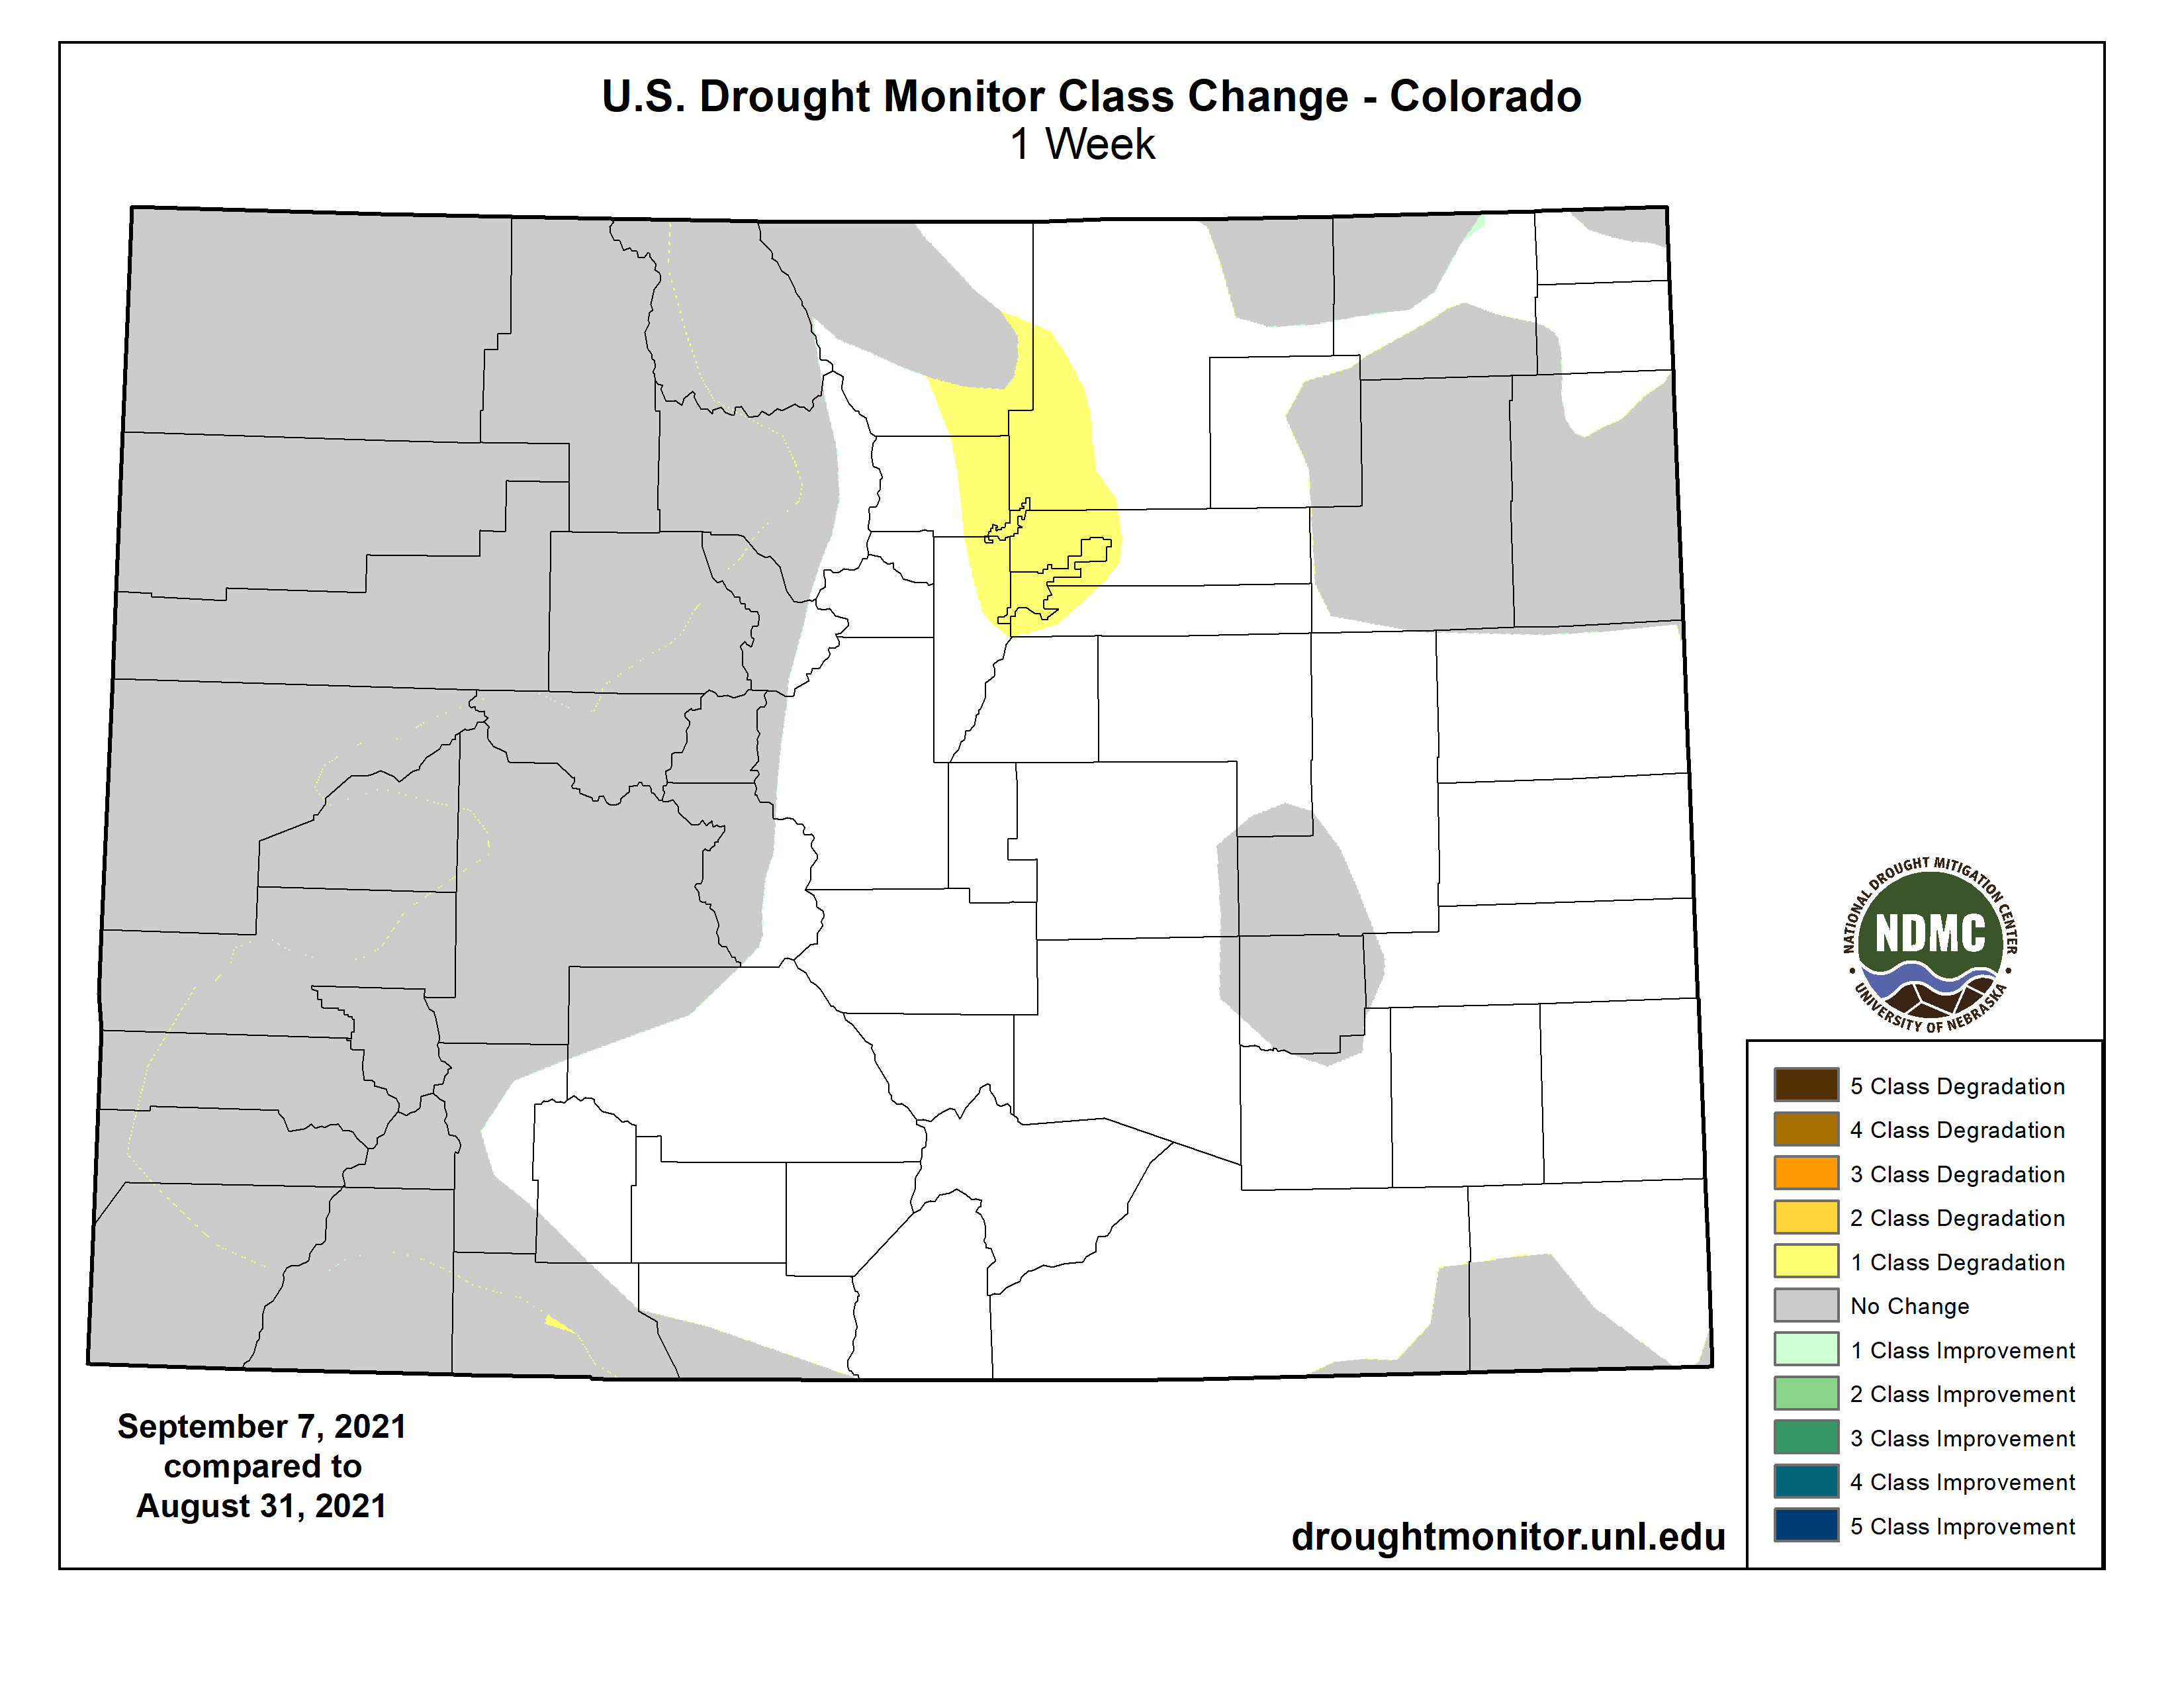
Colorado Drought Monitor one week change map ending September 7, 2021.
For the week, most of the region continued to experience dry conditions, although some residual moisture from Hurricane Nora worked its way into the Southwest leading to some isolated shower activity. On this week’s map, improvements were made in isolated areas of Arizona, New Mexico, and Utah where recent monsoonal rainfall has continued to improve drought conditions on a shorter-term basis. For the monsoon season (to date), some impressive rainfall totals have been observed in areas of southern and central Arizona and New Mexico as well as in areas of Utah. In Arizona, Tucson is currently having its 3rd wettest monsoon season on record with 12.41 inches (as of September 7), Flagstaff 10.35 inches (4th wettest), Payson 13.06 inches (2nd wettest), and Las Cruces, New Mexico 5.06 inches (3rd wettest). Elsewhere in the region, much of California, western Great Basin, Pacific Northwest, and the Northern Rockies have experienced drier-than-normal conditions during the past 90-day period. In Washington, drought and associated precipitation deficits dating back to the springtime, combined with extreme summer heat, have severely impacted the state’s wheat crop which is reportedly had its lowest output since 1973. According to the USDA, the percentage of topsoil rated short to very is as follows: Washington 100%, Oregon 89%, Idaho 75%, Montana 93%, Wyoming 70%, and California 85%. According to the Natural Resources Conservation Service (Sept 1), reservoir storage levels were below normal across all the western states except for Washington state (data not yet available for Montana)…
After the passing of Hurricane Ida, the region experienced some drying out this week as compared to the previous week’s deluge. For the past 30-day period, above-normal precipitation levels (130 to 300% of normal) have been observed across southeastern Louisiana, Mississippi, and much of Tennessee. Conversely, precipitation has been below normal across much of Arkansas, Texas, and Oklahoma during the past month, leading to expansion of areas of Abnormally Dry (D0). This includes around Tulsa, Oklahoma, which observed only 0.85 inches (normal 3.64 inches) for the month of August and no precipitation to date for September. Elsewhere, some minor improvements were made in an area of Moderate Drought (D1) in the Trans-Pecos region in the vicinity of Big Bend National Park where the Chisos Basin observing station reported 10.42 inches of rain (340% of normal) for the month of August. Likewise, the Pine Springs Guadalupe National Park observing station in the Trans-Pecos logged 8.98 inches (560% of normal) during August 2021. For the week, average temperatures were above normal (3 to 9 deg F) across Texas, Oklahoma, and western portions of Louisiana and Arkansas while areas to the east were 1 to 6 deg F below normal…
Looking Ahead
The NWS WPC 7-Day Quantitative Precipitation Forecast (QPF) calls for moderate-to-heavy rainfall accumulations ranging from 2 to 5+ inches along the Gulf Coast of Texas, Louisiana, Florida Panhandle, and areas of southern Georgia. Across the Mid-Atlantic and the Northeast, light rainfall accumulations (generally < 1 inch) are expected; except for coastal areas of Massachusetts and Maine where accumulations of approximately 2 inches are predicted. In the Midwest, light precipitation accumulations (generally < 1 inch) are forecasted across the eastern half of the region, while areas in the western extent will be drier over the coming week. From the Plains to the West Coast, mainly dry conditions will prevail with the exception of areas of isolated, light precipitation possible across the Central and Southern Rockies and the northern Great Basin, while slightly greater accumulations (generally around 1 inch) are expected in the Northern Rockies. The CPC 6-10-day Outlooks are for a moderate-to-high probability of above-normal temperatures across the northern half of the conterminous United States as well as along the Eastern Seaboard extending into New England. Across much of the Pacific Northwest, North Dakota, and the Upper Midwest, normal temperatures are expected. In terms of precipitation, there is a low-to-moderate probability of above-normal precipitation across New England, the Midwest, the South, and the eastern half of Texas. Below-normal precipitation is expected across most of the Western U.S.
US Drought Monitor one week change map ending September 7, 2021.
Just for grins, here’s a gallery of early September US Drought Monitor maps for the past several years.
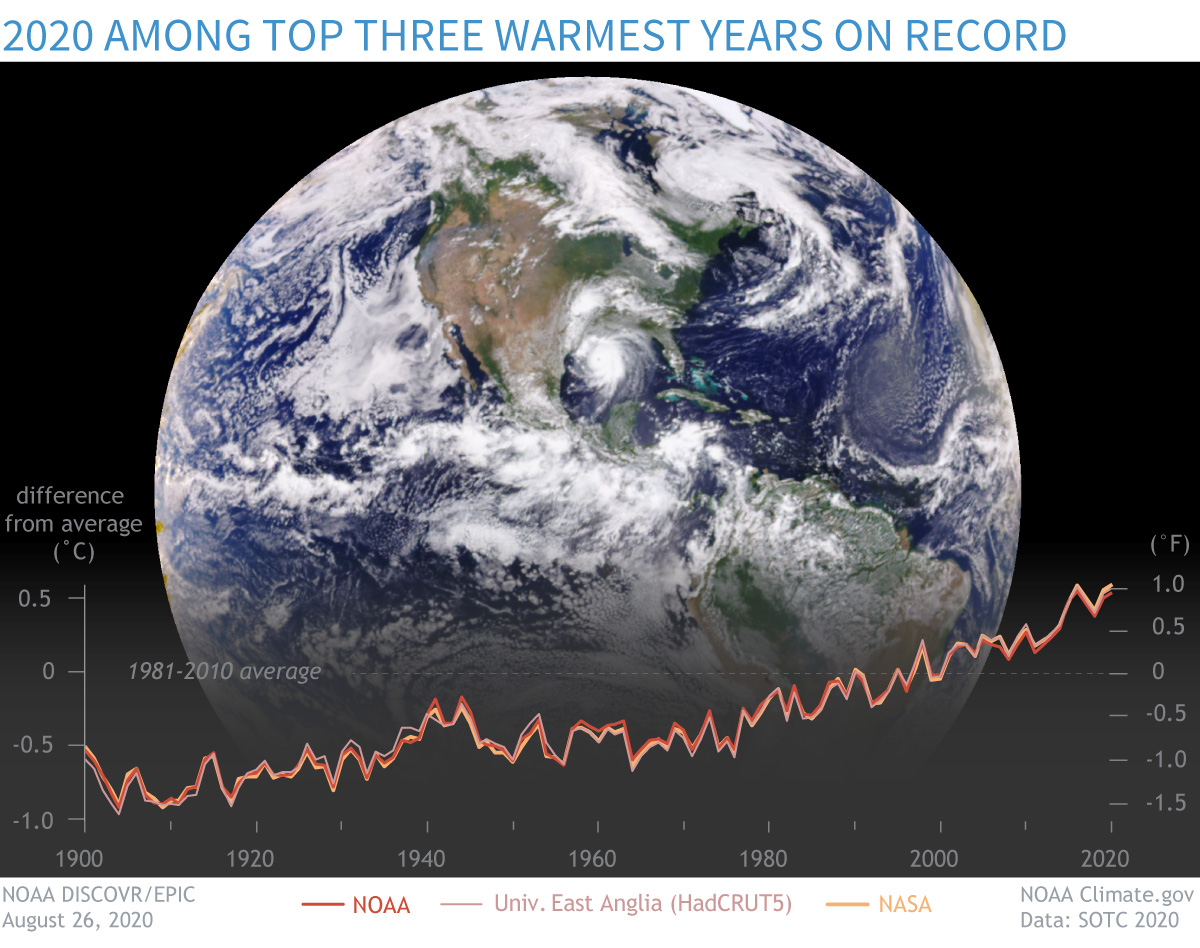
Global surface temperature each year compared to the 1981-2010 average from three datasets: NOAA (red line), NASA (orange), and University of East Anglia (pink). The background image from the NOAA DISCOVR/EPIC mission shows Hurricane Laura coming ashore in Louisiana on August 26, 2020. Image by NOAA Climate.gov, adapted from State of the Climate in 2020. [Correction (08-25-21): The original version of this graphic and the caption indicated the temperature data were compared to the 20th-century average. They are compared to the 1981-2010 average.]From NOAA (Jessica Blunden):
A new State of the Climate report confirmed that 2020 was among the three warmest years in records dating to the mid-1800s, even with a cooling La Niña influence in the second half of the year. New high temperature records were set across the globe. The report found that the major indicators of climate change continued to reflect trends consistent with a warming planet. Several markers such as sea level, ocean heat content, and permafrost once again broke records set just one year prior. Notably, carbon dioxide (CO2) levels in the atmosphere also reached record highs in 2020, even with an estimated 6%–7% reduction of CO2 emissions due to the economic slowdown from the global pandemic.
These key findings and others are available from the State of the Climate in 2020 report released online today [August 25, 2021] by the American Meteorological Society (AMS).
The 31st annual issuance of the report, led by NOAA National Centers for Environmental Information, is based on contributions from more than 530 scientists from over 60 countries around the world and reflects tens of thousands of measurements from multiple independent datasets (full report). It provides a detailed update on global climate indicators, notable weather events and other data collected by environmental monitoring stations and instruments located on land, water, ice and in space.
The report’s climate indicators show patterns, changes and trends of the global climate system. Examples of the indicators include various types of greenhouse gases; temperatures throughout the atmosphere, ocean, and land; cloud cover; sea level; ocean salinity; sea ice extent and snow cover.
Report highlights include these indications of a warming planet:
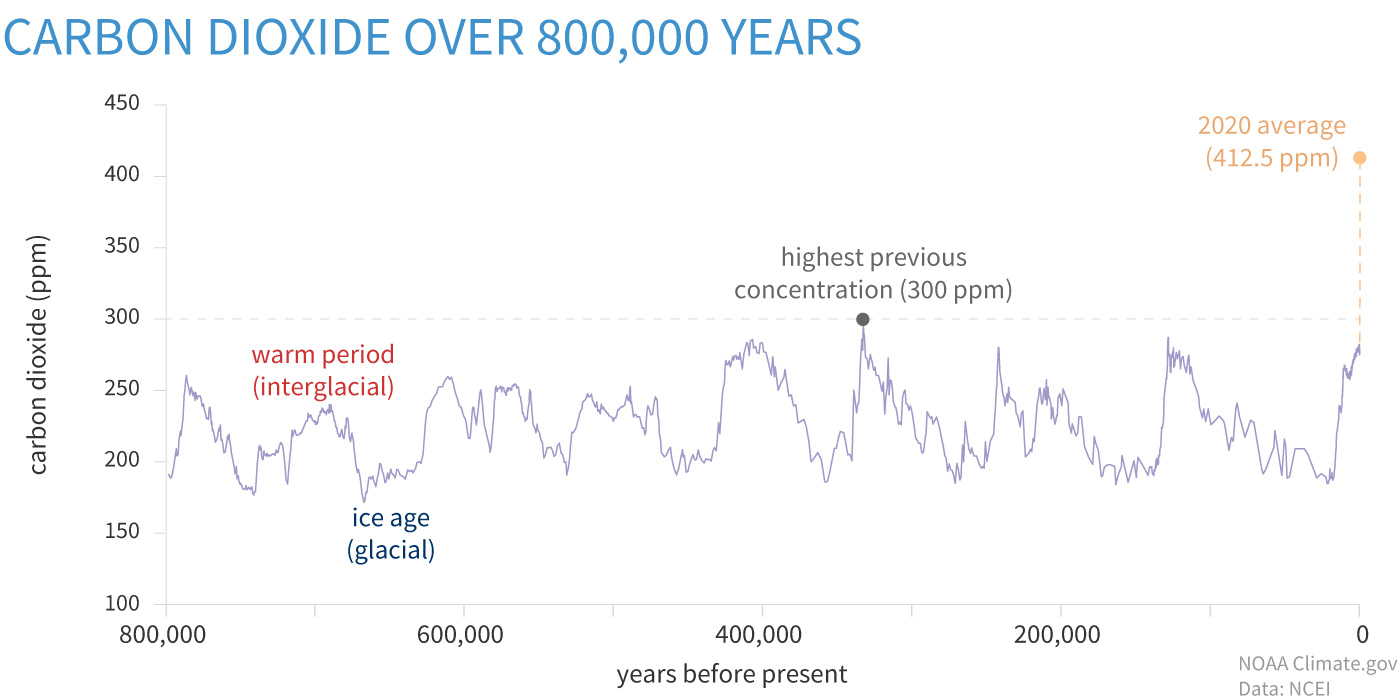
Greenhouse gases were the highest on record. As they do each year, and again in the midst of a global pandemic that slowed economic activity around the world, the major greenhouse gas concentrations, including CO2, methane (CH4) and nitrous oxide, rose to new record high values during 2020. The global annual average atmospheric CO2 concentration was 412.5 parts per million.
Atmospheric carbon dioxide concentrations (CO2) in parts per million (ppm) for the past 800,000 years. On the geologic time scale, the increase to today’s levels (orange dashed line) looks virtually instantaneous. Graph by NOAA Climate.gov based on data from Lüthi et al., 2008, via the NOAA NCEI Paleoclimatology Program.
This was 2.5 parts per million greater than 2019 amounts and was the highest in the modern 62-year measurement record and in ice core records dating back as far as 800,000 years. The year over year increase of methane (14.8 parts per billion) was the highest such increase since systematic measurements began.
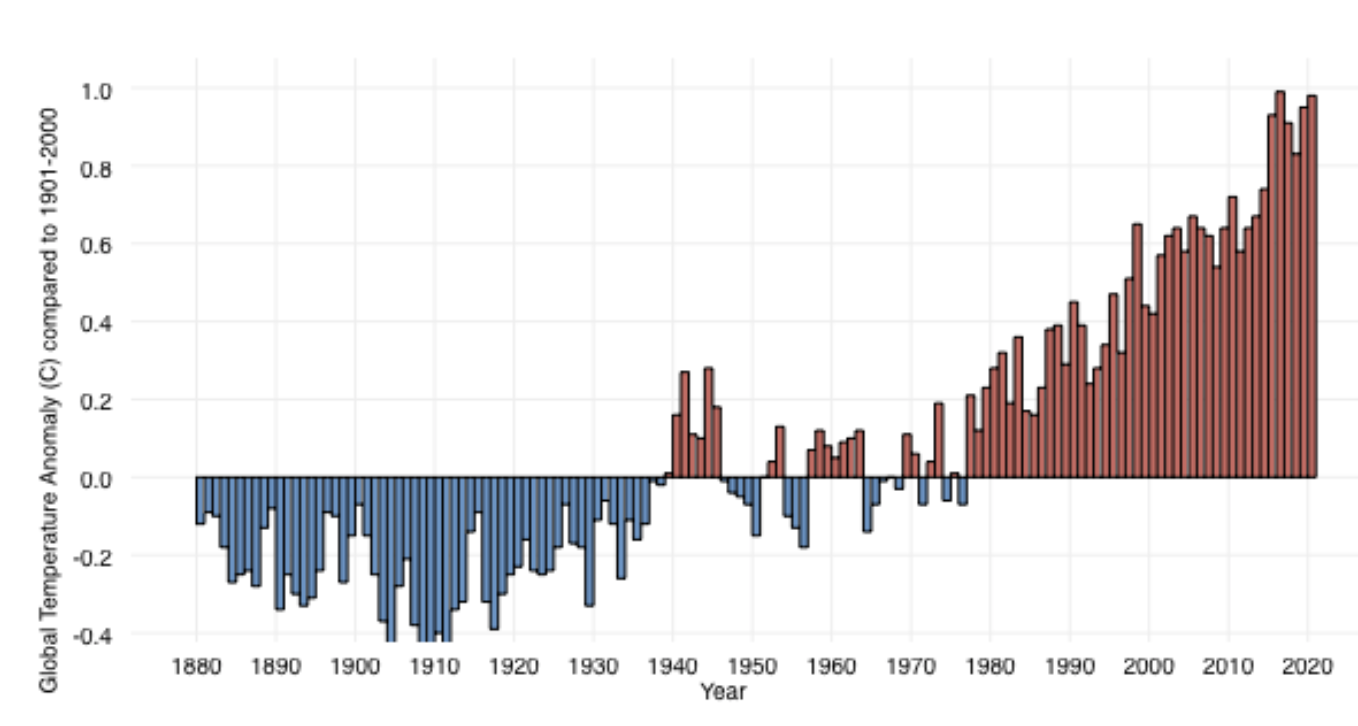
Global surface temperature was near-record high. Annual global surface temperatures were 0.97°–1.12°F (0.54°–0.62°C above the 1981–2010 average, depending upon the dataset used). This places 2020 among the three warmest years since records began in the mid- to late 1800s.
The graph shows average annual global temperatures since 1880 (source data) compared to the long-term average (1901-2000). The zero line represents the long-term average temperature for the whole planet; blue and red bars show the difference above or below average for each year. (These data were among the sources of data used in the State of the Climate in 2020’s temperature analysis, but here are compared to the 20th-century average. In the report, they are compared to the 1981-2010 average.)
This was the warmest year on record without the presence of El Niño. The seven warmest years on record have all occurred in the past seven years, since 2014. The global average surface temperature has increased at an average rate of 0.14°F (0.08°C) per decade since the start of the record; since 1981, the rate of increase has been more than twice as high.
Upper atmospheric temperatures were record or near-record setting. In the region of the atmosphere just above Earth’s surface, the globally averaged annual lower troposphere temperature equaled the record high of 2016. In the layer above that, the lower stratosphere temperature continued to decline, as expected in a warming world.
Sea surface temperatures were near-record high. The globally averaged 2020 sea surface temperature was the third highest on record, surpassed only by 2016 and 2019, both of which were associated with El Niño conditions.
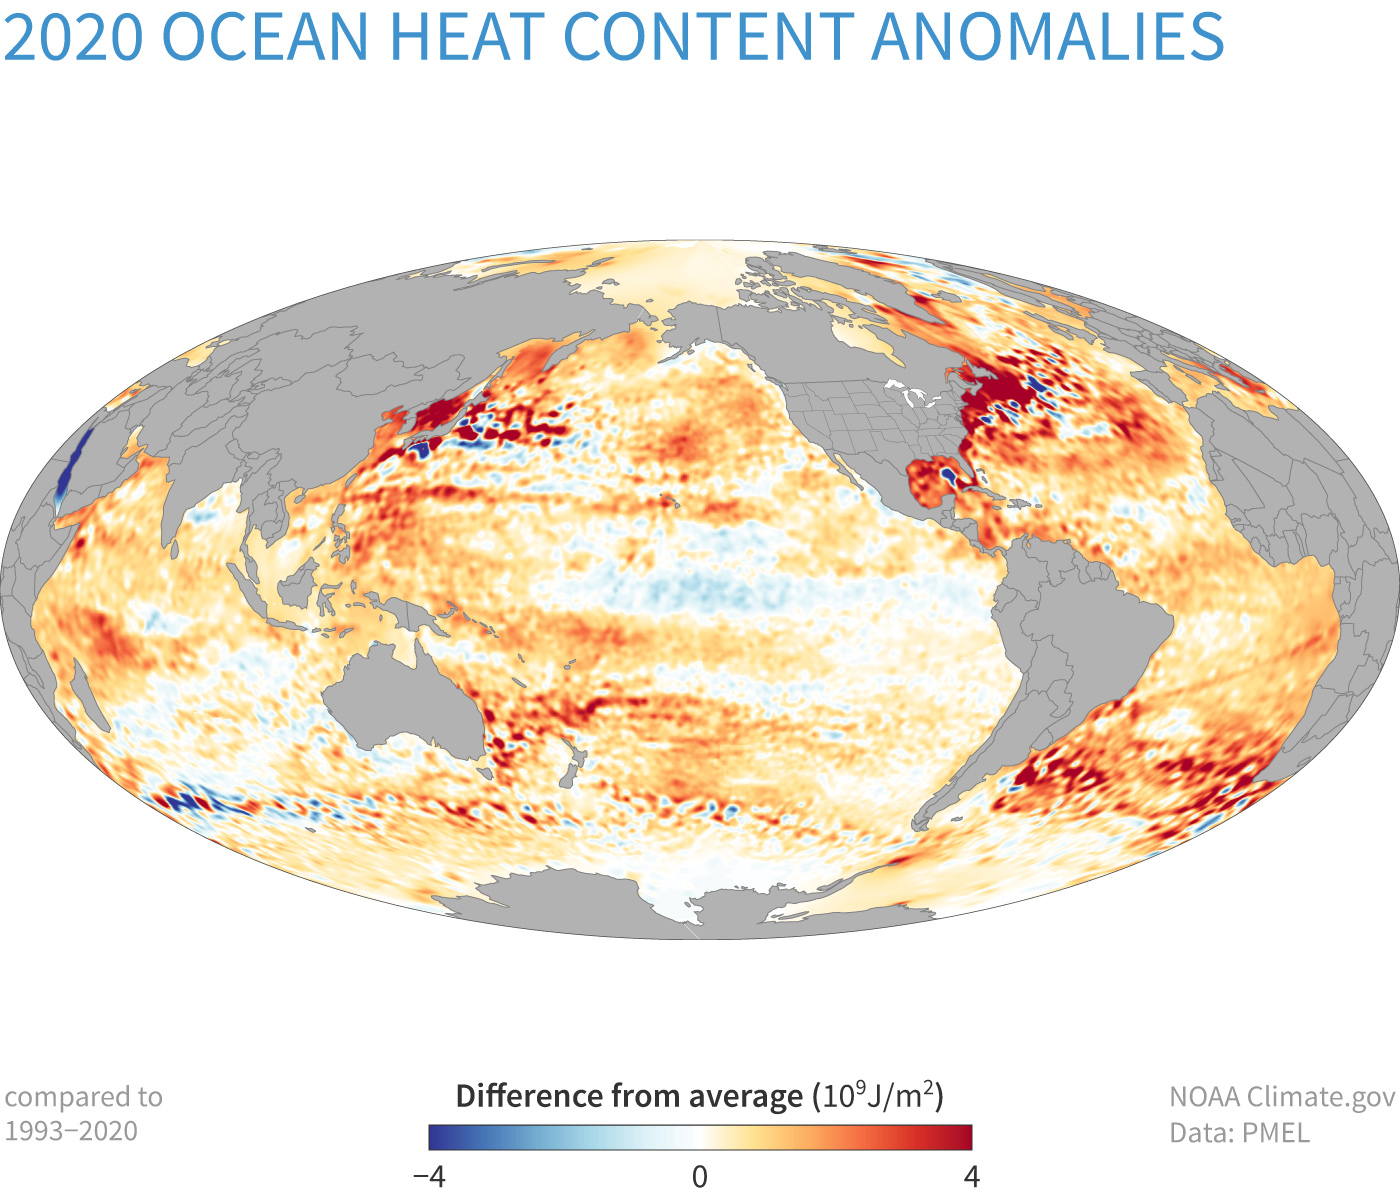
Global upper ocean heat content was record high. Globally, upper ocean heat content reached record highs in 2020 in the upper layer measured from the surface to 2,300 feet (700 meters), according to four of the five datasets analyzed in the report. This record heat reflects the continuing accumulation of thermal energy in the top 2,300 feet of the ocean.
This map shows heat content anomalies—differences from the long-term average—in the top 700 meters (~2,100 feet) of the global ocean. Positive anomalies mean the ocean gained heat in 2020 (orange); negative anomalies mean the ocean lost heat energy (blue) in 2020. NOAA Climate.gov image, based on data provided by John Lyman.
Ocean heat content was also record high in the deeper layer beneath, from 700 to 2,000 meter depth, according to all five datasets. Oceans absorb more than 90% of Earth’s excess heat from global warming. The warmer upper ocean waters can drive stronger hurricanes and increase melting rates of ice sheet glaciers around Greenland and Antarctica.
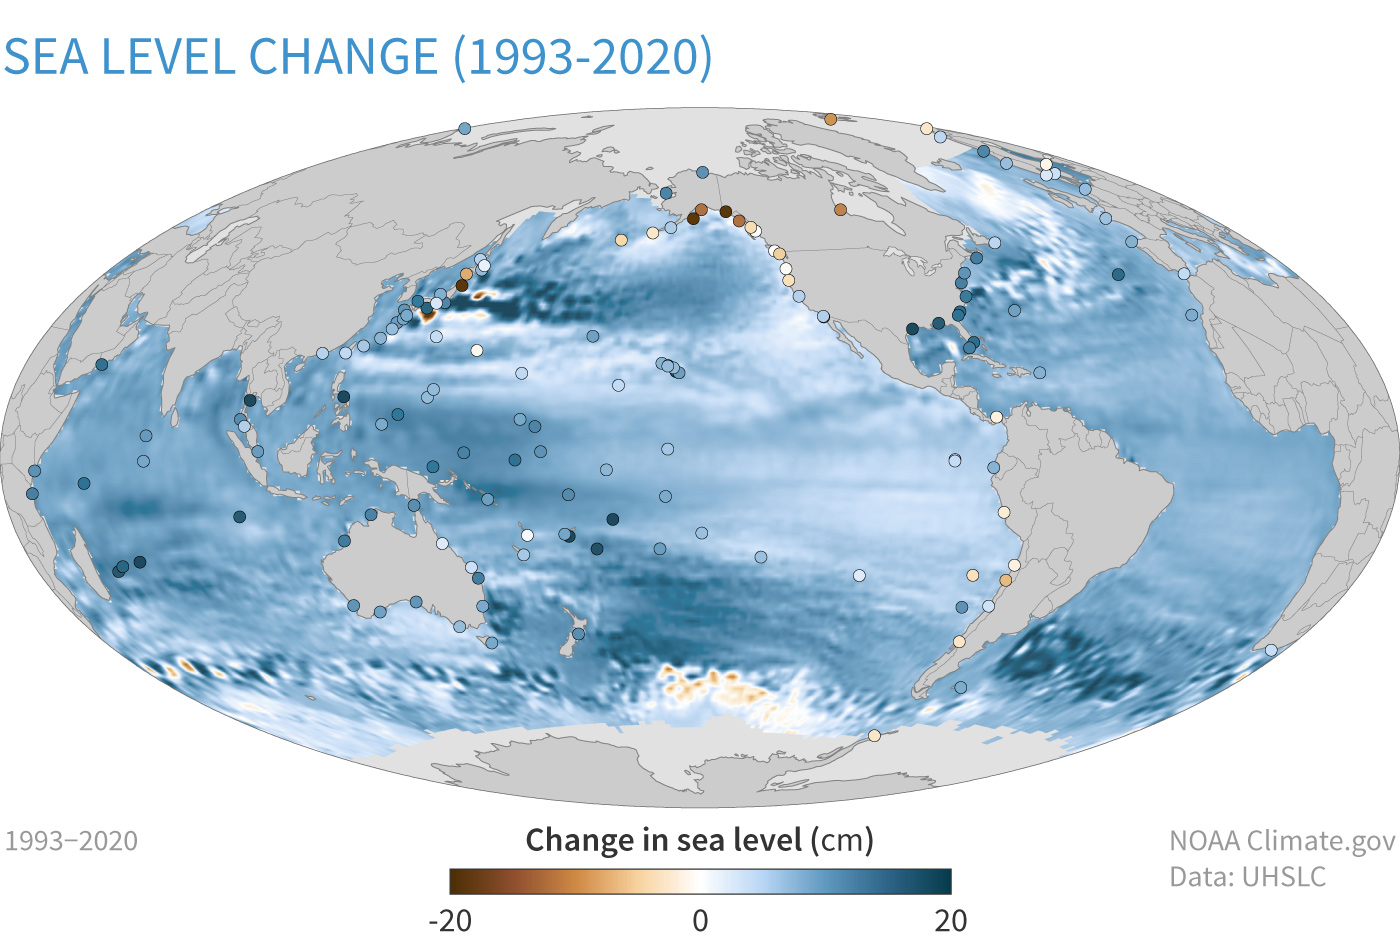
Global sea level was highest on record. For the ninth consecutive year, global average sea level rose to a new record high and was about 3.6 inches (91.3 millimeter) higher than the 1993 average, the year that marks the beginning of the satellite altimeter record.
Increase in global mean sea level based on satellite altimeter data. NOAA Climate.gov, adapted from Figure 3.15a in State of the Climate in 2020.
Global sea level is rising at an average rate of 1.2 inches (3.0 centimeter) per decade due to changes in climate. Melting of glaciers and ice sheets, along with warming oceans, account for the trend in rising global mean sea level.
Change in sea level since the 1993. Blue indicates places where sea level has increased by up to 20 centimeters (8 inches); brown indicates places where sea level has dropped by the same amount. NOAA Climate.gov image, based on data from P. Thompson, UHSLC.
Oceans absorbed a record amount of CO2. The ocean absorbed about 3.0 billion metric tons more CO2 than it released in 2020. This is the highest amount since the start of the record in 1982 and almost 30% higher than the average of the past two decades. More CO2 stored in the ocean means less remains in the atmosphere, but this also leads to increasing acidification of the waters, which can greatly harm or shift ecosystems.
The report also documents key regional climate and climate-related events.
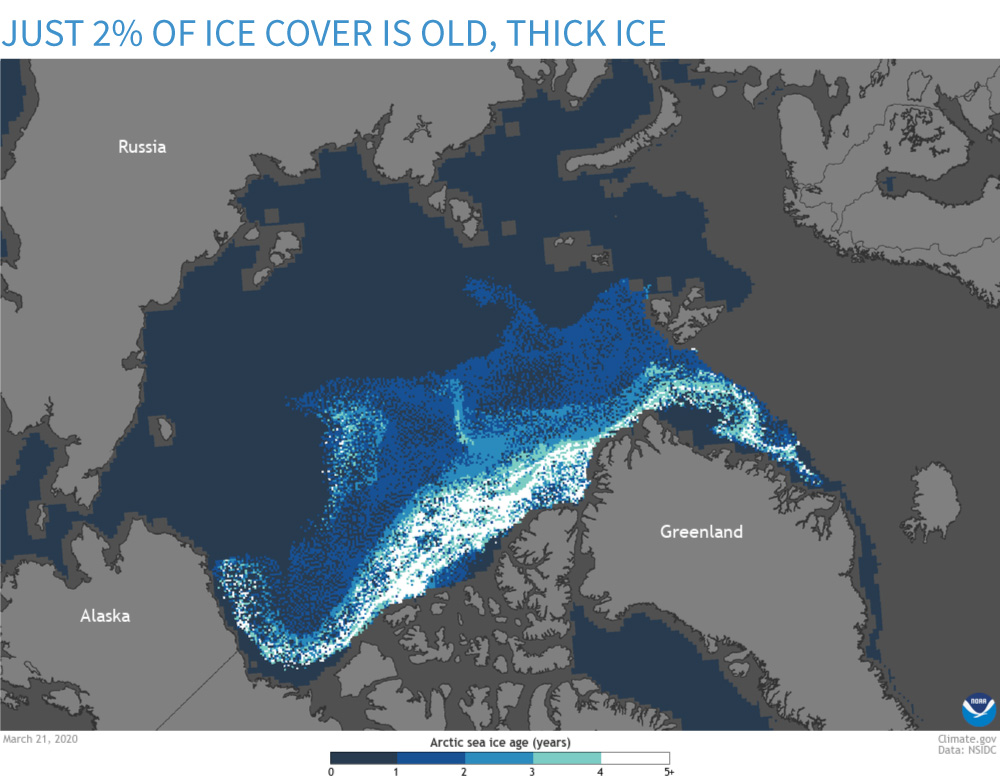
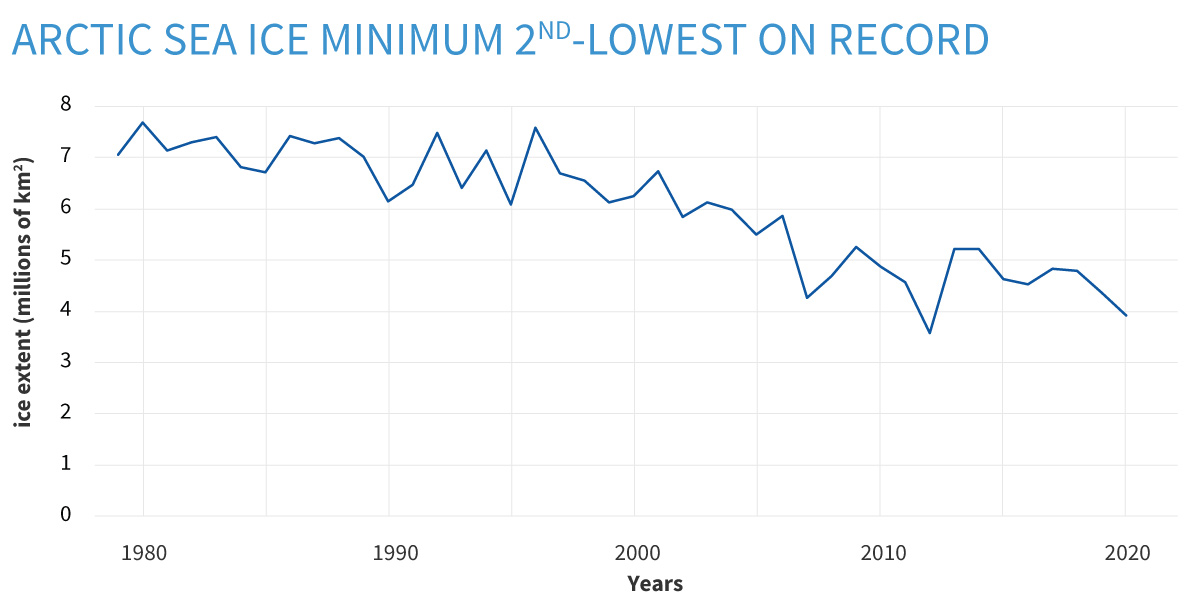
The Arctic continued to warm; minimum sea ice extent was near-record low. The annual mean surface air temperature for the Arctic land areas was the highest in the 121-year record, at 3.8°F (2.1°C) above the 1981–2010 average. This was the seventh straight year with an annual temperature more than 1°C higher than the 1981–2010 average. On June 20, a temperature of 38°C was observed at Verkhoyansk, Russia (67.6°N), provisionally the highest temperature ever measured within the Arctic Circle. The Arctic continues to warm at a faster pace than lower latitudes. With the warmth came fires. The Arctic experienced its highest fire year in terms of the amount of carbon released into the atmosphere, surpassing the record set in 2019 by 34%. The majority of the fires occurred in northeastern Siberia where abnormally high temperatures also occurred.
At the annual maximum ice extent in March 2020, only 2% of the Arctic ice cover consisted of old, thick ice (white). Most of the ice cover consist of ice that was less than a year old—i.e. seasonal ice that doesn’t survive the summer. NOAA Climate.gov image, based on data from the National Snow and Ice Data Center.
In March, when sea ice reached its annual maximum extent, thin, first-year ice comprised ~70% of the ice; the thickest ice—usually more than four years old—had declined by more than 86% since 1985 to make up just 2% of total ice in 2020. When the minimum sea ice extent was reached in September, it was the second smallest in the 42-year satellite record, behind 2012.
Sea ice concentration across the Arctic Ocean on September 15, 2021, the day of the summer minimum. The yellow line shows the median extent (middle value) of the ice cover between 1981 and 2020. NOAA Climate.gov image based on data from the National Snow and Ice Data Center.
The Northern Sea Route along the Siberian coast was open for about 2.5 months, from late July through mid-October, compared to less than a month typically.
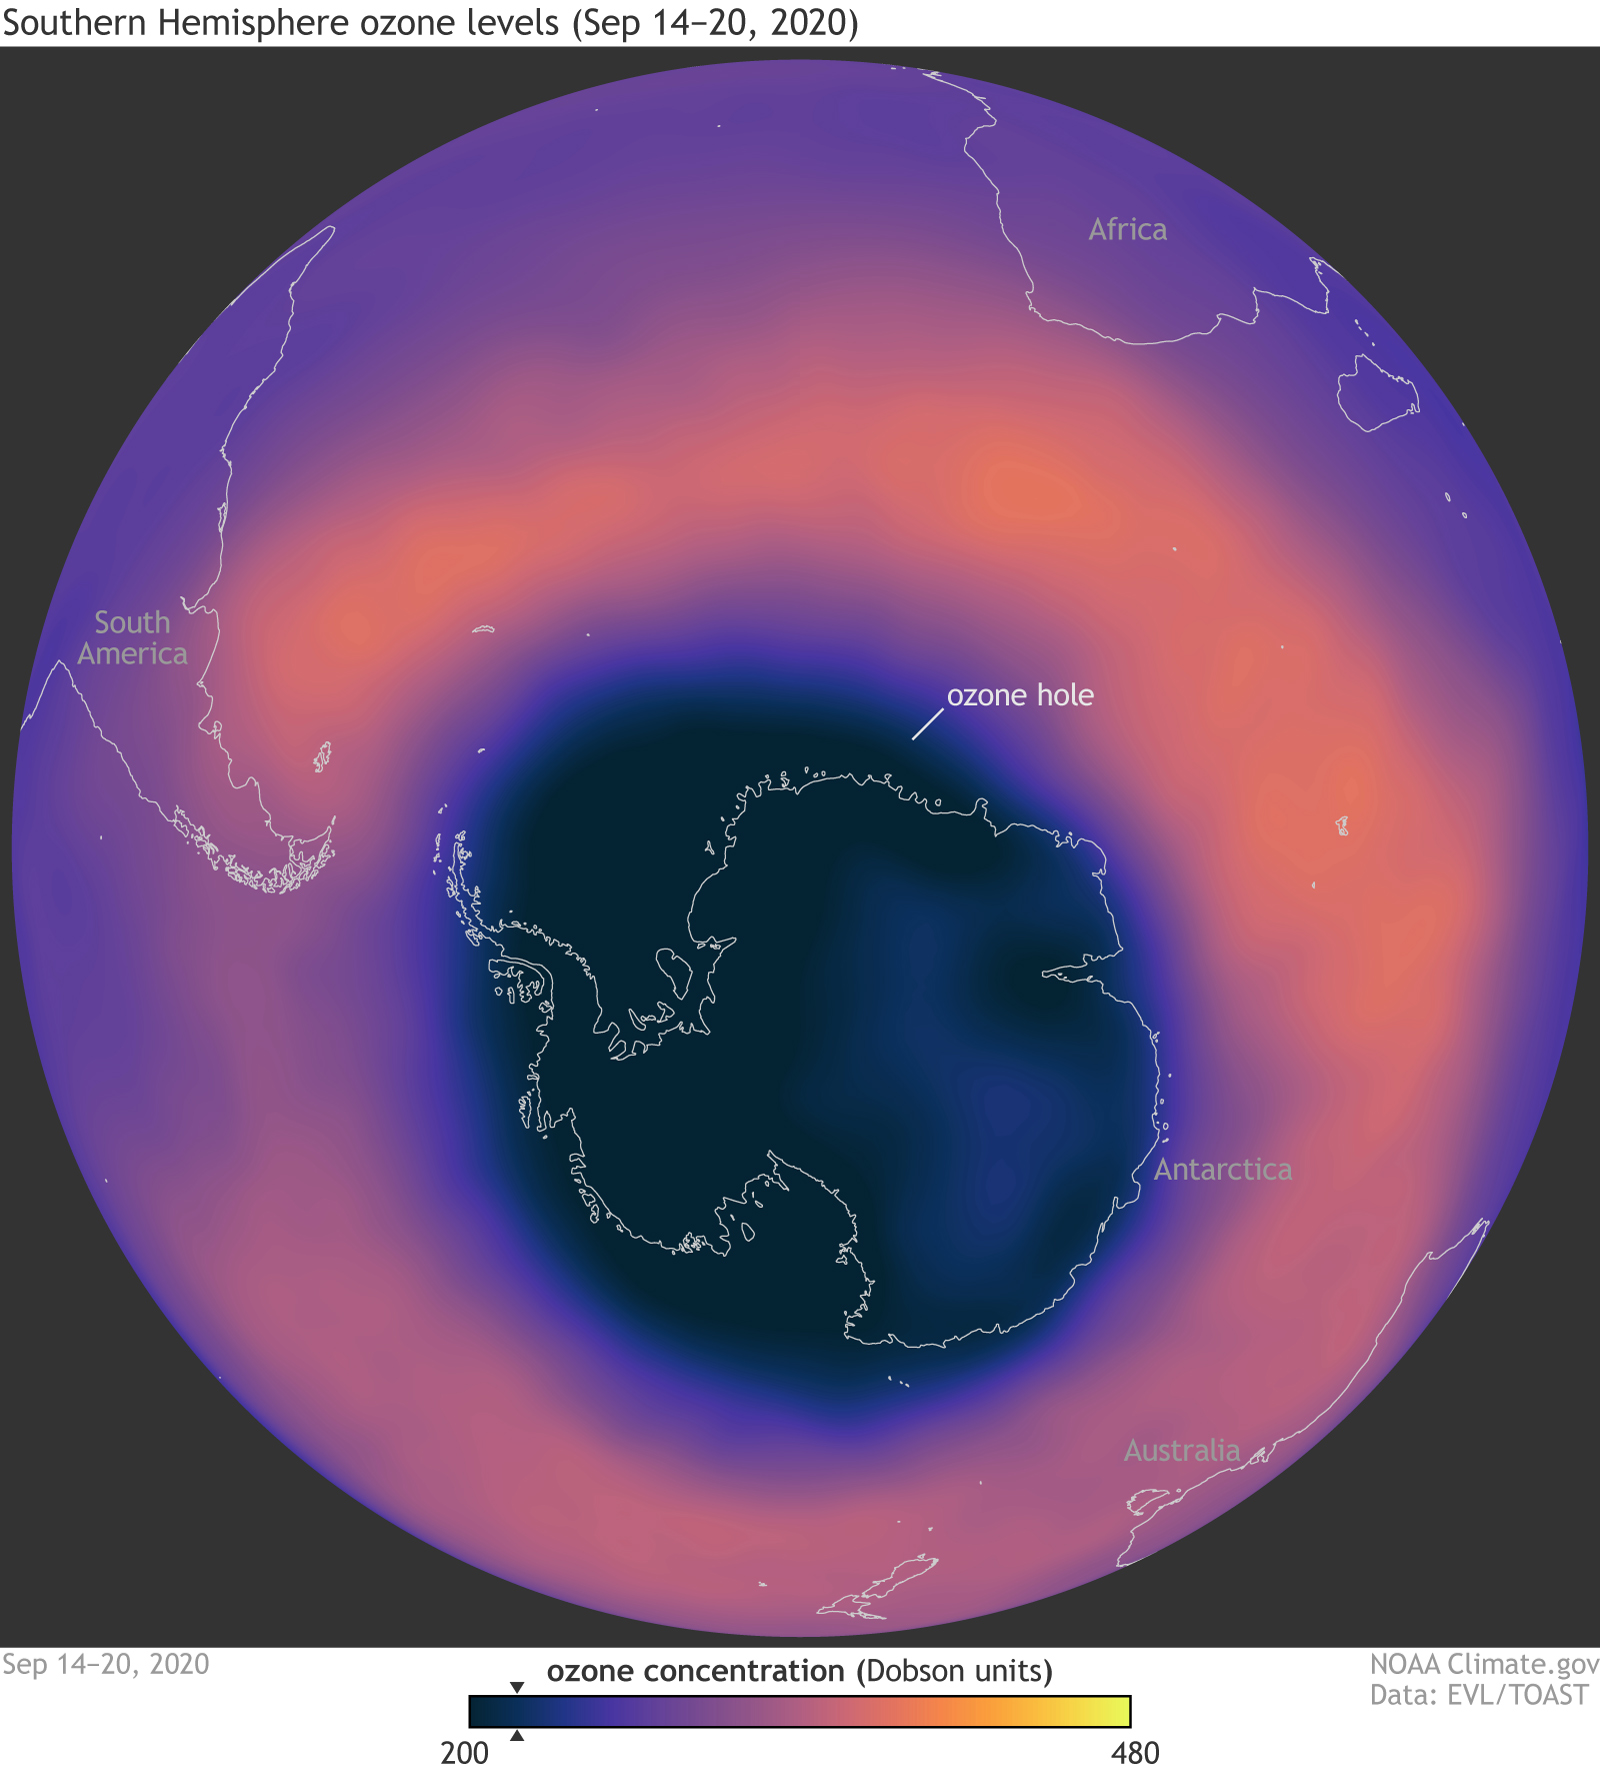
Antarctica saw extreme heat and a record-long ozone hole. Extreme warmth was observed across parts of Antarctica during austral summer, contributing to a major heat wave. On February 6, Esperanza Station reached 64.9°F (18.3°C), the highest temperature ever recorded on the continent, surpassing the previous record set in 2015 by 2.0°F (1.1°C). The warmth also led to the largest late-summer surface melt event in the 43-year record, affecting more than 50% of the Antarctic Peninsula and impacting elevations as high as 1,700 meters.Later in the year, the Antarctic polar vortex was unusually strong and persistent, with polar temperatures in the stratosphere at record low levels throughout November and December. This strong vortex was linked to the longest-lived ozone hole over the Antarctic region, which lasted to the end of December. Record-low ozone values in late austral spring and early summer led to unusually high levels of UV radiation across the Antarctic region.
Ozone concentration over Antarctica the week of September 14–20, 2020. To allow comparisons from year to year, experts define the “ozone hole” as the area in which ozone levels are below 220 Dobson Units (dark blue, marked with black triangle on color bar). NOAA Climate.gov image, based on TOAST data from the NOAA Environmental Visualization Lab.
Tropical cyclones were well-above average overall. There were 102 named tropical storms during the Northern and Southern Hemisphere storm seasons, well above the 1981–2010 average of 85. Three tropical cyclones reached Saffir–Simpson scale Category 5 intensity. The North Atlantic hurricane basin recorded a record 30 named storms, surpassing the previous record of 28 in 2005. Seven of those storms became major hurricanes, matching 2005 for a record number. Major Hurricanes Eta and Iota made landfall along the eastern coast of Nicaragua in nearly the same location within a two-week period, impacting over seven million people across Central America. In the western North Pacific, Super Typhoon Goni was the strongest tropical cyclone to make landfall in the historical record and led to the evacuation of almost one million people in the Philippines. Very Severe Cyclonic Storm Gati made landfall over Somalia, the first storm of such intensity to do so.
Geographical Regional Highlights
North America
Mexico reported its warmest year in its 49-year record, tied with 2017 and 2019.
The contiguous United States reported its fifth-warmest year. Alaska reported its coolest year since 2012, although it was still warmer than its 1981–2010 average. The annual temperature for Alaska has increased at an average rate of 0.50°C per decade over the past half century.
Most of Mexico was drier than average in 2020 due to the late onset of a weak North American Monsoon and a lack of tropical cyclones on the Pacific side. The United States was dominated by warm, dry air in the West and an active storm track that brought wet conditions to much of the East. In Canada, the Avalon Peninsula in Newfoundland was hit by a strong blizzard with hurricane force winds in January. The storm contributed to the snowiest January on record for Saint John’s.
Central America and the Caribbean
The annual average temperature over the Caribbean basin was the second highest since the start of the record in 1891. Annual average maximum temperatures were record high for stations in The Bahamas, Dominica, and Trinidad and Tobago.
Powerful Category 4 Hurricanes Eta and Iota impacted Central America in November, making landfall along the eastern coast of Nicaragua in nearly the same location within a two-week period.
South America
Most of South America had above-average temperatures during the year. Central South America reported its second-warmest year for the region in its 61-year record, behind only 2015. During a strong heat wave in October, the city of São Paulo, Brazil, recorded four of its five all-time daily maximum temperatures.
The Bolivian lowlands suffered one of its most severe droughts on record during autumn. Drought also spanned the Chaco and Pantanal in Bolivia, Paraguay and southern Brazil. The Paraguay River shrank to its lowest levels in half a century. A decadal “mega drought” in south-central Chile continued through its 11th year, with extreme conditions in the most populated areas. Argentina reported its driest year since 1995.
Africa
Seychelles, an archipelago in the Indian Ocean off East Africa, observed its highest annual temperature in the record dating to 1972. In West Africa, Nuguru, Nigeria, observed about 80 days of maximum temperatures exceeding 104°F (40°C) in 2020, surpassing its previous record of 77 days in 2019.
Extremely heavy rains in April triggered widespread flooding and landslides in Ethiopia, Somalia, Rwanda and Burundi. The Lake Victoria region was the wettest in its 40-year record, and the lake itself rose more than three feet (one meter) due to the excessive rain.
Europe
The year 2020 was the warmest year on record for Europe, with all five of the warmest years occurring since 2014. Record warmth was reported for Belarus, Belgium, European Russia, Estonia, Finland, France, Kazakhstan, Lithuania, Luxembourg, the Netherlands, Norway, Poland, Spain, Sweden, Switzerland and Ukraine.
In February, almost all areas in Europe observed temperatures more than 5°F (3°C) higher than average. Biarritz in southern France reached a temperature of 80.0°F (26.6°C), which is higher than the monthly average for July and August.
The Middle East experienced an extreme drought during autumn, with most places reporting 0%–20% of their typical precipitation in September and no precipitation at all in October.
Asia
In 2020, Japan and Russia each observed their highest annual temperature on record. In northern Siberia, annual temperatures were more than 9°F (5°C) above average across vast territories. The average winter temperature for all of Russia was 5°C above normal. In East Asia, Hong Kong, China, reported 50 hot nights, where the daily minimum temperature did not dip below 82.4°F (28.0°C), and 47 very hot days, where the daily maximum temperature reached at least 91.4°F (33.0°C), both of which set new annual records.
The 2020 Southwest Asian Monsoon season (June–September) was the wettest since 1981, coincident with the emergence of La Niña. The Meiyu season (July–August), a typical rainy season over the Yangtze and Huaihe River Valleys of China, doubled its typical duration by two months in 2020. The May–October total rainfall averaged over the area was the most since the start of the record in 1961. Associated severe flooding affected about 45.5 million people.
As is typical, several tropical cyclones impacted Asia in 2020. Super Typhoon Goni was the strongest storm on record anywhere in the world to make landfall. More than one million people were evacuated from its path in the Philippines. Eight tropical cyclones directly affected Vietnam. Typhoon Molave was one of the most intense storms to reach the country in the past 20 years.
Oceania
Most locations across Micronesia were drier than average during the first half of 2020 and wetter than average at all locations in the second half. For the year, Kosrae was record wet, while Kapingamarangi and Saipan observed near-record low annual rainfall totals.
The last days of 2019 and first days of 2020 saw particularly hazardous fire weather in eastern Australia, where multiple fires had been burning since austral spring 2019. The emergence of La Niña was a welcome change for the Australian region, with this phase of ENSO contributing to increased rainfall over the continent, after a very significant 2019/20 fire season. Even with increased rainfall, this was Australia’s fourth-warmest year in its 111-year record. Both November and spring as a whole had record high temperatures.
Aotearoa, New Zealand, reported its seventh-warmest year since records began in 1909, in part due to its warmest winter on record. La Niña conditions contributed to higher temperatures in the latter part of the year. From late-December 2019 through February 2020, several areas across New Zealand observed record or near-record dry spells, that is, at least 15 consecutive days with less than one millimeter of rain each day. A 64-day dry spell, the longest on record, was reported in Blenheim, a town on the northern tip of the South Island.
The State of the Climate in 2020 is the 31st edition in a peer-reviewed series published annually as a special supplement to the Bulletin of the American Meteorological Society. The journal makes the full report openly available online.
Researchers are finding that when pulverized rock is applied to agricultural fields, the soil pulls far more carbon from the air and crop yields increase. More studies are underway, but some scientists say this method shows significant benefits for farmers and the climate.
On a hot and humid August day near Geneva, New York, Garrett Boudinot stands in a field of hemp, the green stalks towering a foot or more over his 6-foot, 4-inch frame. Today, the mustached Cornell University research assistant will harvest six acres of the crop, weigh it in red plastic garbage bins, and continue to analyze the hundreds of water samples taken with measuring devices called lysimeters that have been buried in the field over the last three months.
Boudinot, part of a research team at Cornell University, will sweat through the next two days of field work to see whether an unusual component added to the soil earlier in the year helped increase yields and sequester carbon. This soil amendment “we just call lovingly ‘rock dust,’ which isn’t very descriptive,” says Boudinot. “But it’s really silicate rocks that have been pulverized to a fine powder.”
The hemp field trial is just one of the projects being led by Ben Houlton, dean of Cornell’s College of Agriculture and Life Sciences. For the last two years, he and colleagues at the Working Lands Innovation Center, a research consortium based at the University of California, Davis, have been testing various soil amendments that grab carbon from the air and trap it below ground. They’ve tested biochar, manure, and rock dust used on the New York land and California farm plots, and so far, the most effective soil treatment is basalt pulverized into dust.
“As far as I can tell,” says Houlton, “ours is the largest-scale project of its kind, using this intensive sort of scientific approach.”
The hemp field experiments go beyond testing which amendments increase yields and sequester carbon and examine how much rock dust should be applied for best results. Some sections got 20 tons of rock dust per acre, while others got 40, allowing the researchers to get a more fine-tuned picture of the relationship between the dust, the soil, and the crops. The research adds to a growing body of scientific work showing the potential for these soil amendments to become one of the many measures needed to help solve our climate crisis.
Agriculture accounts for nearly a quarter of the world’s carbon dioxide emissions, making the farming sector an important part of efforts to reach net zero by 2050 and limit global warming to 1.5 degrees Celsius, an increase scientists warn the world should not surpass if we want to avert some of the more drastic consequences of climate change. To help reduce carbon in the atmosphere, scientists once proposed seeding the oceans with iron. That tactic was criticized as environmentally damaging and ineffective and has not gained widespread acceptance. But seeding soils with carbon-capturing rock dust could.
In addition to Houlton, scientists from the United Kingdom to Canada are testing various soil amendments on agricultural lands, assessing how much carbon they sequester through a process called enhanced weathering. While Houlton’s researchers apply basalt to hemp in New York and to alfalfa and olive trees in California, scientists working with the University of Sheffield’s Leverhulme Centre for Climate Change Mitigation in the U.K. are spreading basalt on cornfields in Illinois and on sugarcane in Australia. In Ontario, Canada, researchers are applying wollastonite from a nearby mine on soybean and alfalfa fields.
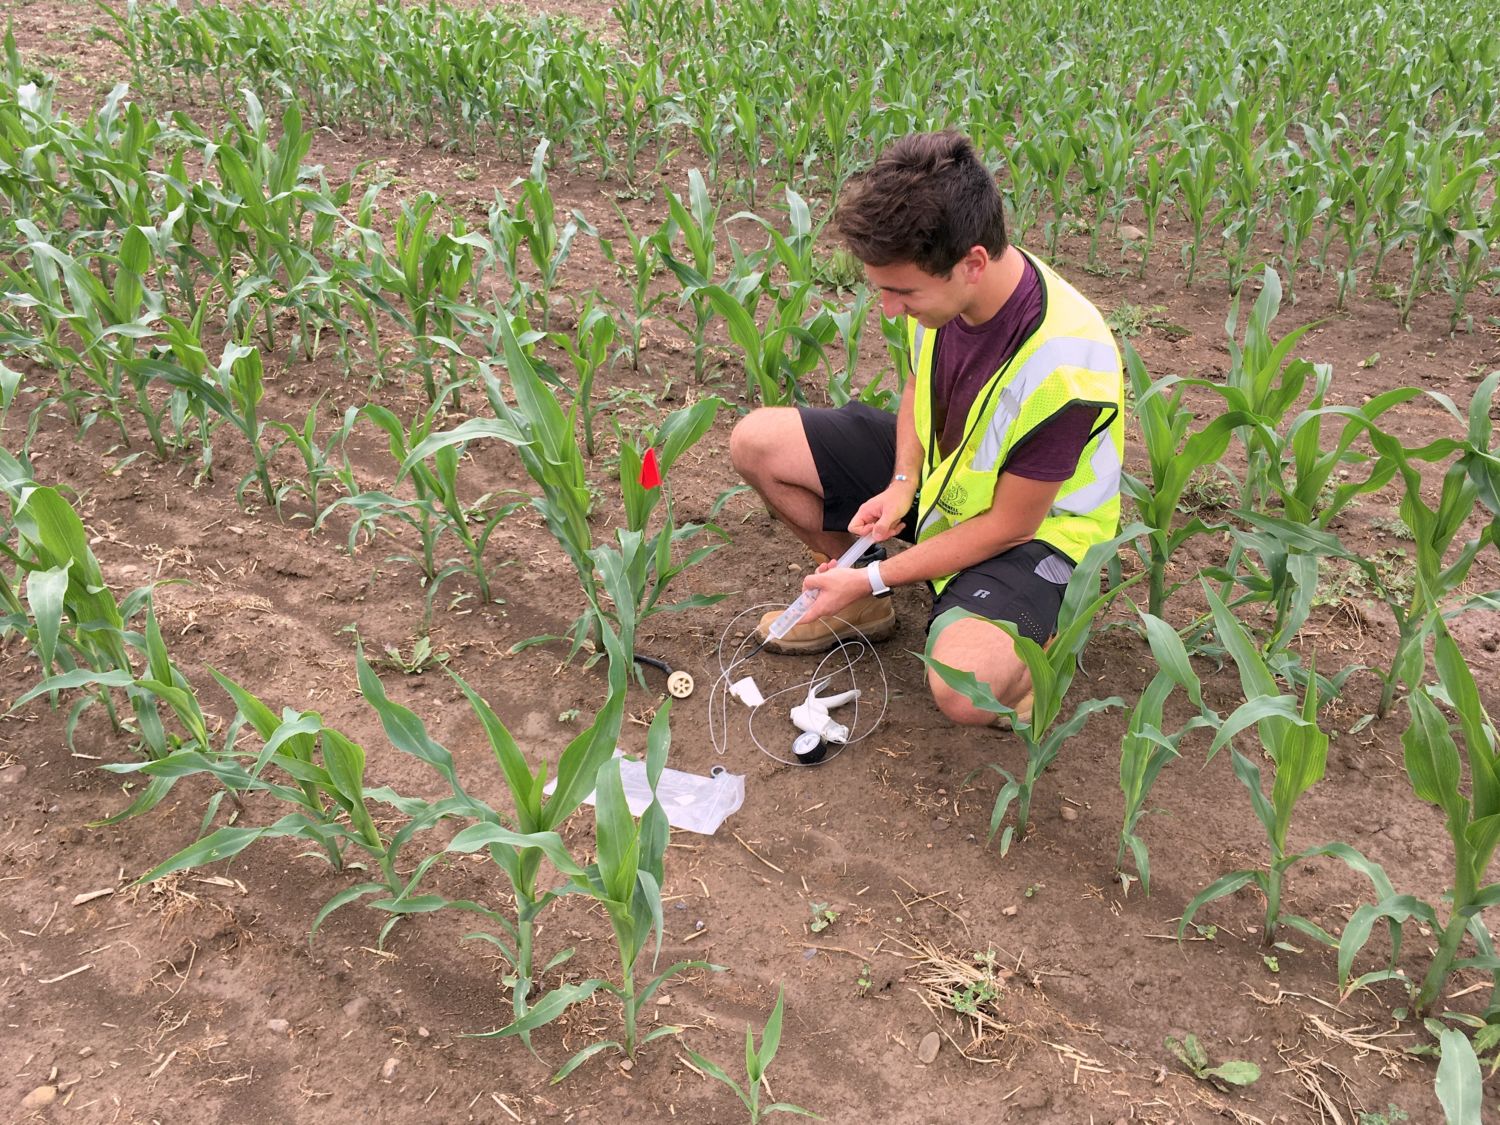
esearcher Zack Kozma gathers a water sample from a field where rock dust has been added to the soil at Cornell’s AgriTech Agricultural Experiment Station. Photo credit: GARRETT BOUDINOTA clump of soil containing rock dust. Photo credit: SOPHIE NASRALLAH
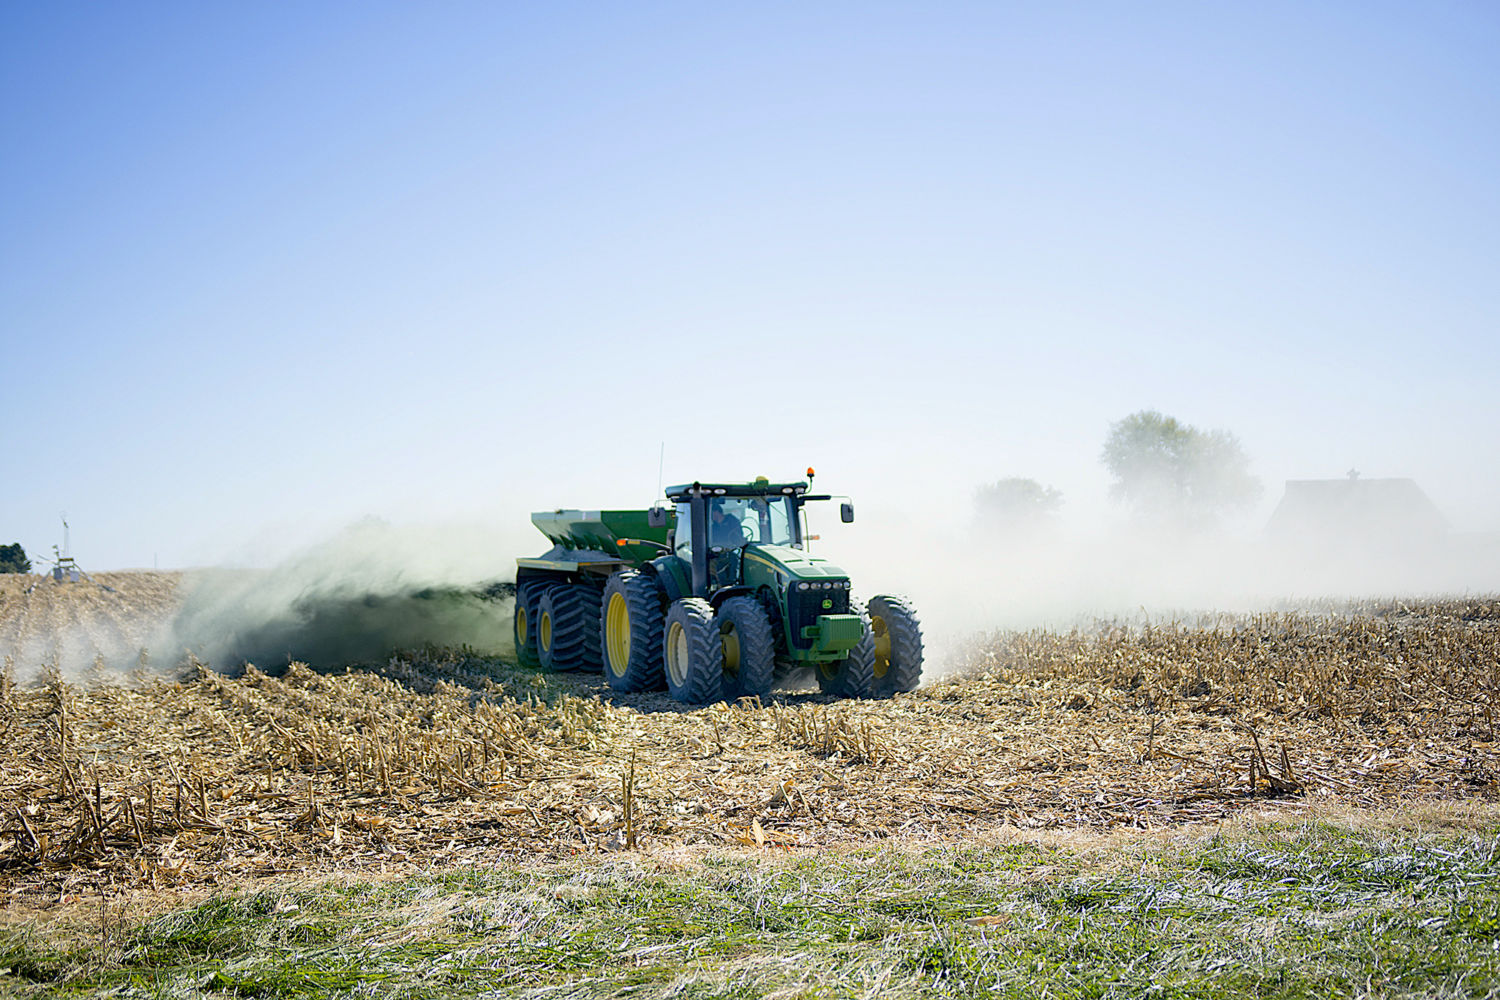
According to the U.N. Intergovernmental Panel on Climate Change (IPCC), rocks naturally remove 1 gigaton (1 billion tons) of carbon dioxide a year from the atmosphere (a number that has changed over time). Adding rock dust to agricultural lands speeds up the chemical reactions that lock carbon up — for thousands of years — in soil. If applied to croplands globally, rock dust could theoretically help suck an estimated 2 to 4 billion tons of carbon dioxide from the air every year, between 34 and 68 percent of the global greenhouse gas emissions produced by agriculture annually. And though treating so much land might be unrealistic, the process has the potential to scale up quickly because rock dust isn’t in short supply and farmers don’t need to purchase new gear to apply it: They’ve already got fertilizer-spreading equipment in their barns.
“This is an incredibly exciting technology that has a lot of wins for society and, frankly, we could deploy this very quickly,” says Houlton.
Basalt, the additive being used in the Cornell project, is a byproduct of mining and manufacturing operations and is found all over the world. Some estimates show that there’s enough basalt rock dust stockpiled to treat the planet’s croplands for several years.
“Rock extraction is one of the largest things we do as a species,” says Phil Renforth, an engineer at Heriot-Watt University in Edinburgh, who works on carbon capture. “By mass we do more than twice as much rock extraction as we do food production.”
Basalt contains magnesium, calcium, and silica, among other components. When the rock is pulverized and applied to soils, magnesium and calcium are released from the silica and dissolve in water as it moves through the soil. The minerals in the soil react with the water and carbon that would otherwise go back into the atmosphere, forming bicarbonates, which can hang around in water for thousands of years, eventually making their way to the oceans where they can precipitate out as limestone and stay on the seafloor for millions of years.
Different amendments result in slightly different chemical reactions in the soils, and the soils provide various conditions, such as different pHs. Some amendments, like wollastonite, may be better at sequestering carbon but aren’t as abundant. Others may contain heavy metals, which can harm crops and groundwater. “There’s the chemistry of the rock; there’s the availability of the rock; and then there’s the carbon benefits of the material, as well as the potential for what I would call ‘negative consequences’ to emerge,” says Houlton.
The varied lands on which crops are grown require a number of field trials to assess how much more carbon stays in the soil, but the results are encouraging. On plots in California, initial results show a doubling of carbon uptake. That’s surprising, says Houlton, considering that the crops were grown under the driest conditions in the state’s history.
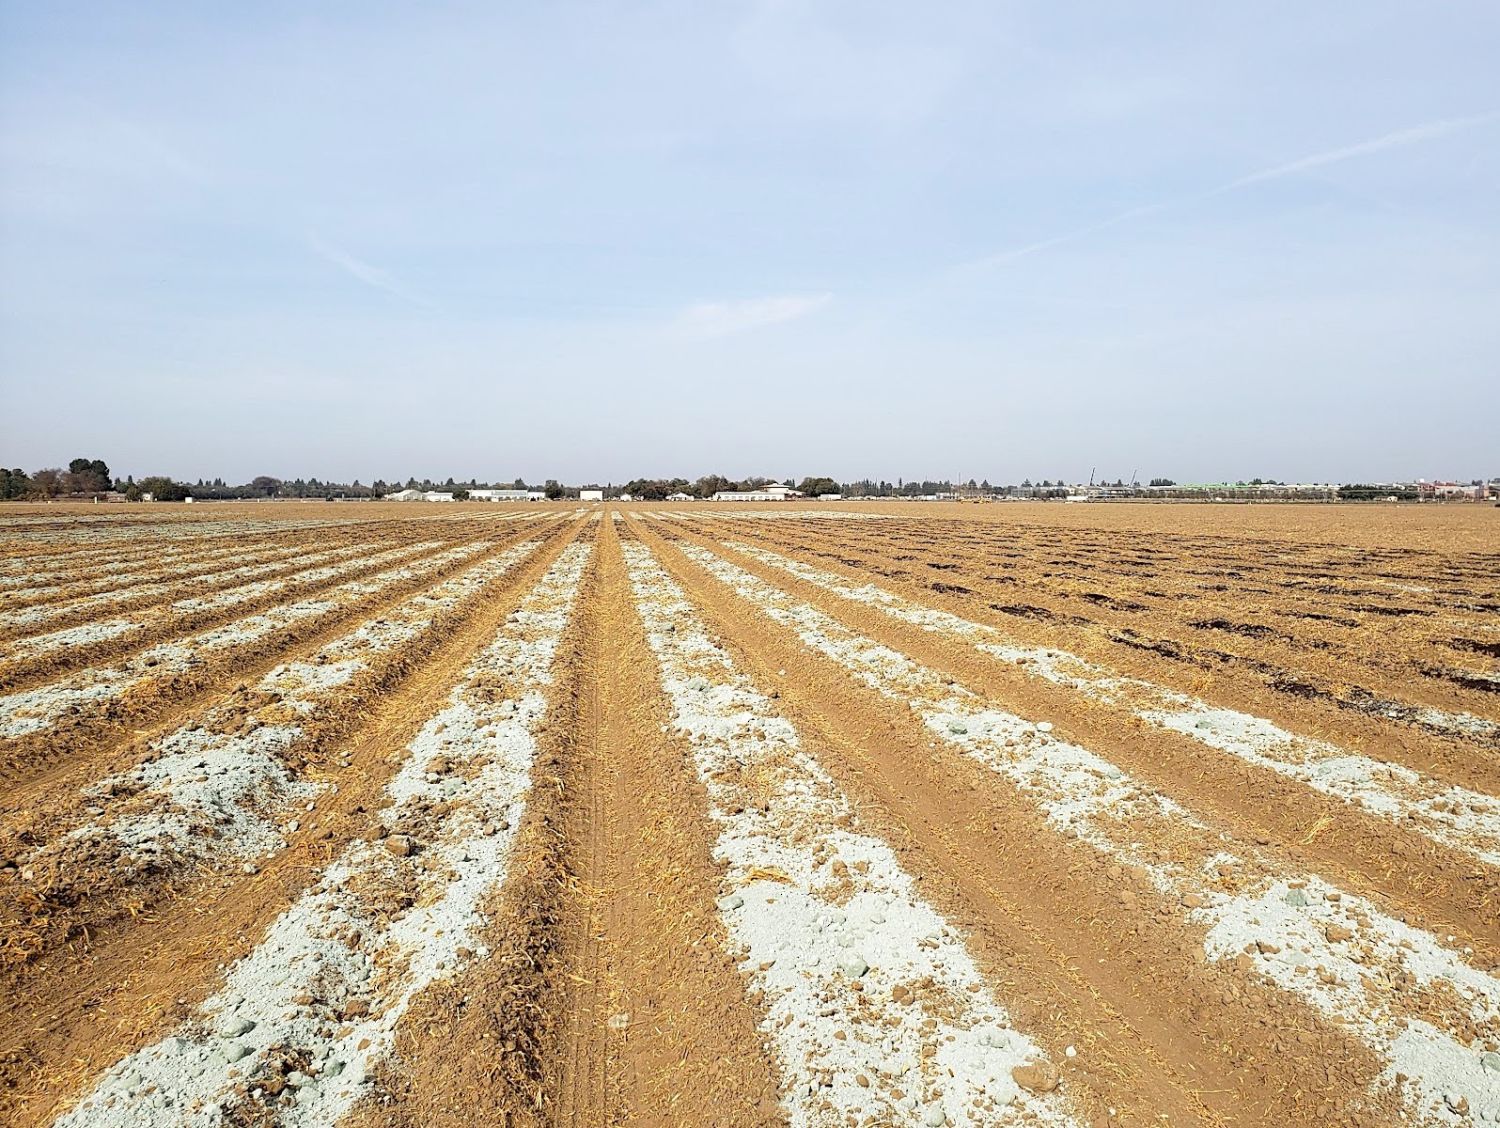
ock dust applied to an experimental field at the University of California, Davis. Photo credit: IRIS HOLZER
Leverhulme Centre director David Beerling, who is five years into a decade-long effort to investigate enhanced weathering on croplands, published a paper last year in Nature that demonstrated the potential of the method. He and colleagues found that if China, India, and the United States applied rock dust to all of their agricultural lands, 1 billion tons of carbon dioxide could be removed from the atmosphere.
The research results so far are significant enough that the IPCC mentioned enhanced weathering in its most recent report, listing the method of spreading ground-up rocks on soils as a way to capture more carbon and stimulate cropland productivity.
But scientists are still weighing the costs and benefits of such applications, including the expense of transporting the material and better calculating the carbon storage and crop yield benefits. Researchers may have more data to draw on soon: Results of much larger trials by Houlton and Beerling could be published as soon as next year.
Rock dust applications could benefit more than just the climate — they could help farmers, too. Field tests on corn and alfalfa show increases in crop yields thanks to rock dust, which releases other essential nutrients like phosphorous and potassium. In some cases, yields are 30 percent higher, results that could entice farmers looking to decrease inputs while increasing harvest. Initial weight measurements show potentially higher yields on the hemp fields in New York as well.
The rock dust may also affect the nitrogen cycle, Beerling points out, ultimately allowing farmers to apply less nitrogen fertilizer. That could lead to fewer nutrient pollution issues, especially in Corn Belt states where runoff drains into the Mississippi watershed and down into the Gulf of Mexico. Beerling and researchers are currently working on a map of available basalt and crops on which it could be applied in 13 states in the Midwest.
Reducing atmospheric carbon doesn’t yet provide an income stream to farmers, although incentivizing “carbon farming” has been floated by the Biden administration. Both Houlton and Beerling are looking to quantify exactly how much carbon a crop can capture so that if a market does come to fruition, farmers could be paid for the amount of carbon they sequester.
To accomplish that, Boudinot is looking at the soil water chemistry from the hemp fields to see how much bicarbonate formed at a foot below the surface. That data, along with information from the experimental plots in California and results from the first five years of research led by the Leverhulme Centre, could provide critical evidence for the farming community.
“What do you think of a carbon dioxide removal technology that reuses waste rock dust, captures carbon, improves soils, restore soils, and improves yields?” asks Beerling. “It’s a no-brainer, at least in the short term, if you’ve got this material and the evidence stacks up. Why wouldn’t you do it?”
This story was produced in collaboration with the Food & Environment Reporting Network, a nonprofit investigative news organization.
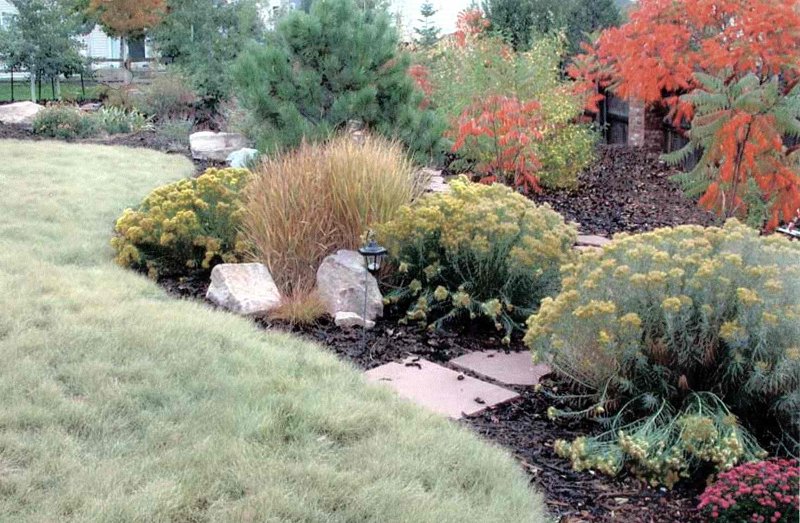
Liz Gardener remembers how some people worried that a new water-saving landscaping concept could alter Denver’s image as the Emerald City of the Plains. “We have to keep it green,” they warned.
The concept “is green,” replied Gardener, a former Denver Water conservation officer who so enjoyed gardening that she’d changed her name to reflect that passion. “But it’s also red and yellow and purple.”
Spurred by the droughts of the late 1970s, a task force led by Denver Water employees had set out to create a new kind of gardening, one that would counteract the effects of a growing population on Denver’s water supply. One novel idea was a landscaping technique that prioritizes water conservation.
In 1981, Denver Water adopted the concept and named it “xeriscape landscaping,” or xeriscaping.
“Nancy [Leavitt] came up with the term,” Gardener recalls. “She had a background in botany and biology, and she knew about xeros.” The Greek word means “dry,” and Leavitt thought to combine it with “scape.” But others immediately said, “People are going to hate that word,” she remembers. They worried that “xeri,” similar to “zero” in pronunciation, would be equated only with rocks and cacti — gardens that didn’t need water at all.
People don’t always see the connection between water supply and water demand, Gardener continues. And they often have different perceptions of what makes a beautiful garden — especially if they previously lived in lush places that receive more than Denver’s 14.5 inches of rain a year.
But over the past forty years, xeriscaping has inspired a cultural shift in Colorado. The practice has become part of the city’s ecosystem, enshrined in ordinances and included in planning documents, and can be credited with helping decrease Denver water usage even as the city’s population has exploded over the past four decades.
Xeriscape was not an easy sell in the early days, however, and its confusing name was only part of the problem…
Xeriscape has served as “a powerful teaching methodology,” says Kelaidis. It illustrates how thoughtful planning can conserve water, which leads to conversations about where the water comes from and why it’s important to be prudent with its use…
The seven principles of xeriscape take into consideration how a garden might most efficiently use water. For example, families may choose to keep a portion of their yard covered in grass. But they can plan to irrigate the lawn so that runoff water hydrates other plants instead of trickling into the street. They can also plant flowers, shrubs and trees that need less water to begin with…
Along with Denver Water, the Denver Botanic Gardens, Colorado State University and the Associated Landscape Contractors of Colorado have worked to get the principles of xeriscape out through books, seminars, demonstration gardens and plant cultivation…
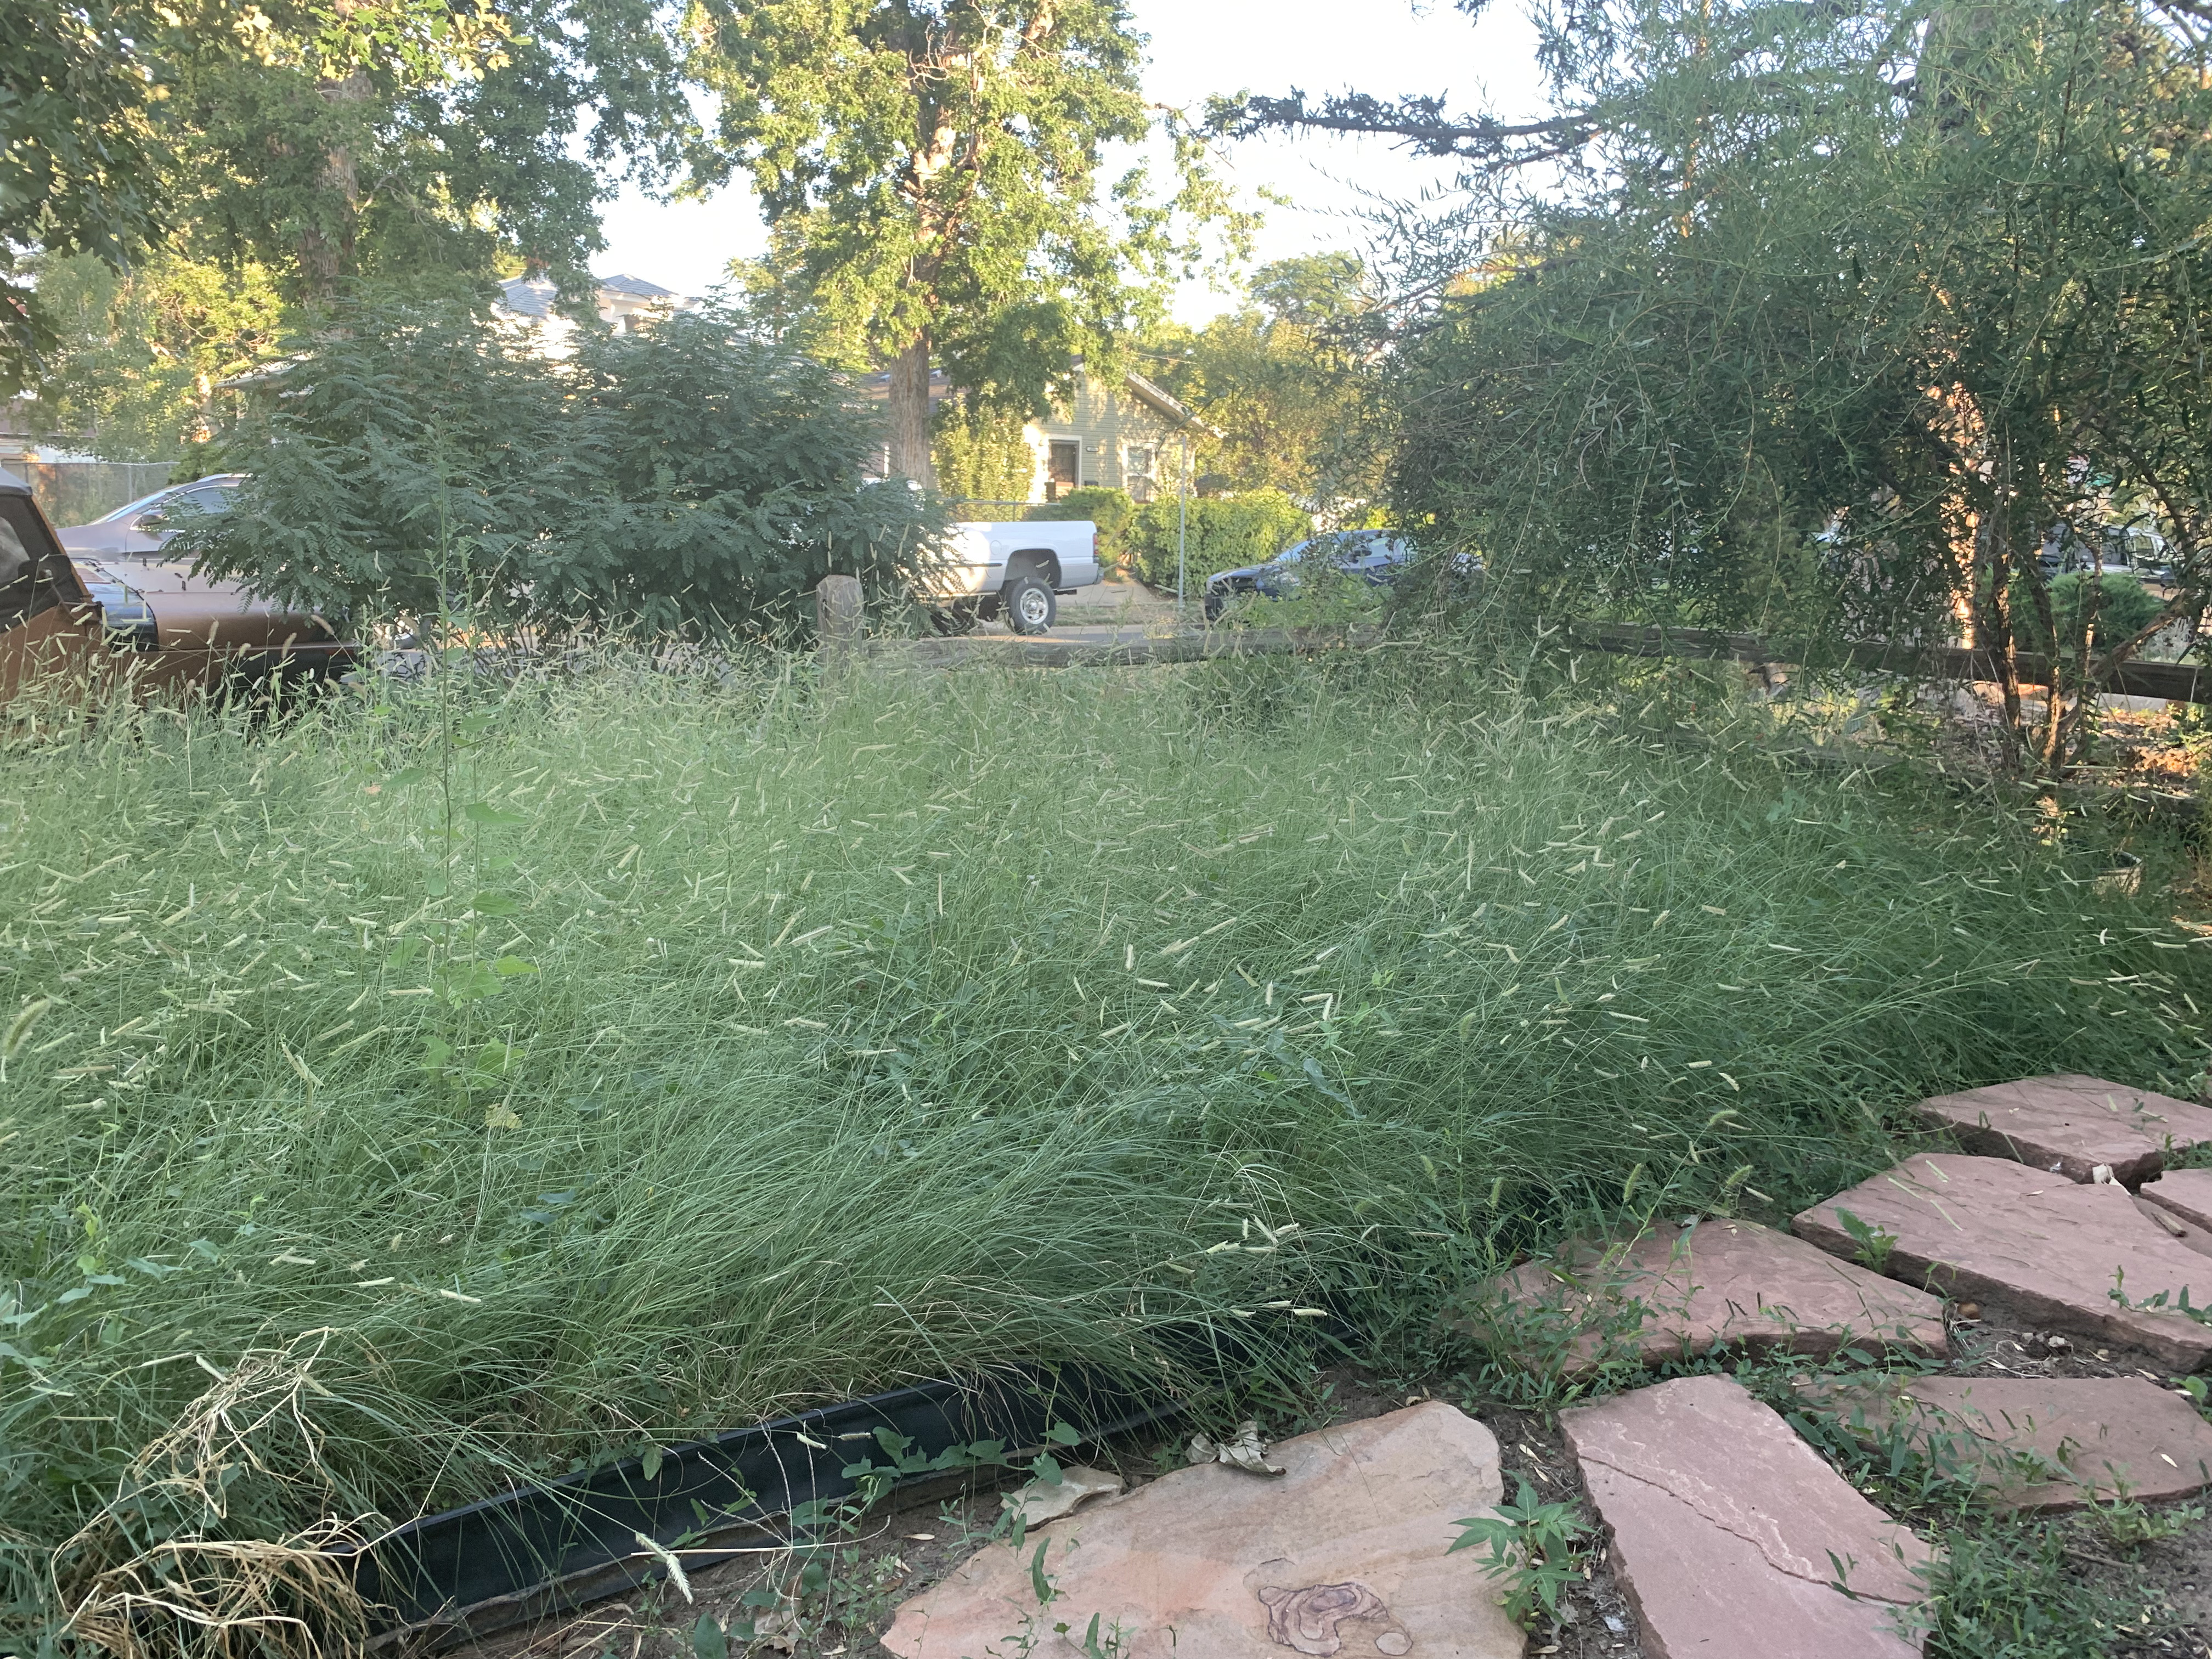
Mrs. Gulch’s Blue gramma “Eyelash” patch August 28, 2021.
The Denver Botanic Gardens has one of a number of demonstration gardens meant to connect these concepts and create a blueprint for ways to garden beautifully yet consciously. When people first enter the grounds, the plants and design reflect European and coastal environments, but farther down the pathways are more native and drought-tolerant gardens. “People end up saying, ‘Hey, these are beautiful, too,’” says Kelaidis.
But a sizable portion of those native plants weren’t available when xeriscaping principles were first adopted forty years ago. “Many of these plants were out there, but they’re kind of rangy and look a little scruffy,” Kelaidis explains.
So Kelaidis personally brought back native plants such as “red birds in a tree” and a hardy form of Arizona cypress from Cookes Peak, New Mexico, as well as the Pawnee Buttes sand cherry that grows northeast of Denver. He also traveled to similar semi-arid and steppe regions around the world, such as South Africa, where he found the “ice plant.” Kelaidis explains that while some believe in only cultivating native species, there are many garden flowers that originated in steppe regions, including lilacs, bearded irises, peonies and the Persian rose.
Kelaidis and others at the DBG also teamed up with CSU, as well as local nurseries, garden centers and gardening professionals, to create Plant Select in 1997. The nonprofit helps to educate gardeners and sell and distribute plants that grow well in high plains and intermountain regions. In addition to finding species with beautiful blooms and textures, Plant Select cultivates plants that can better handle fluctuations in temperature, lack of water and different kinds of soil; many are also more pest-resistant.
Although Plant Select caters primarily to Colorado, it also provides plants to out-of-state retailers in Wyoming, Montana, Texas, Oregon, New Mexico, South Dakota, Nebraska, Utah and California.
According to Plant Select’s Demonstration Garden Survey Summary in 2020, seven of its 24 gardens were watered three times a week, seven were watered bi-weekly, and seven were watered once a week. “They’re always coming out with new native varieties, with a new list of plants that are adaptable to the Colorado environment,” says Phil Steinhauer, president of the Associated Landscape Contractors of Colorado board of directors. “They’re marketing it so that people are asking for it.”
[…]
The more water-wise gardening there is, the more xeriscaping becomes normal — which is exactly what proponents hoped for when they coined the concept forty years ago.
Still, there is work to be done. Xeriscaping gets a boost every time there is a drought cycle, such as the years from 1999 to 2003. But afterward, the demand recedes.
The Republican River’s South Fork near Hale, Colorado, with the region’s seemingly endless fields. Credit: Wikimedia Commons/Jeffrey Beall
FromThe La Junta Tribune-Democrat (Candace Krebs):
The Republican River Water Conservation District is hosting a series of meetings this week to discuss changes in rates paid for conservation contracts along the South Fork. Due to a 2016 resolution approved by the Republican River Compact Administration, Colorado was granted 100% credit for water delivered by the compact compliance pipeline now located in northeastern Colorado. In exchange for this, Colorado agreed to retire up to 25,000 acres in the South Fork Republican drainage area. The agreement requires 10,000 acres be retired by the end of 2024 and the remaining 15,000 acres by the end of 2029. To offset the added expense for increased conservation payments, the RRWCD is considering increasing the annual water use fee to a total of $30 per irrigated acre next year. This increase would be on the 2022 tax-roll and would be payable in early 2023. The last informational meeting on the topic is scheduled for 1:30 p.m. Friday at the Burlington Event Center.
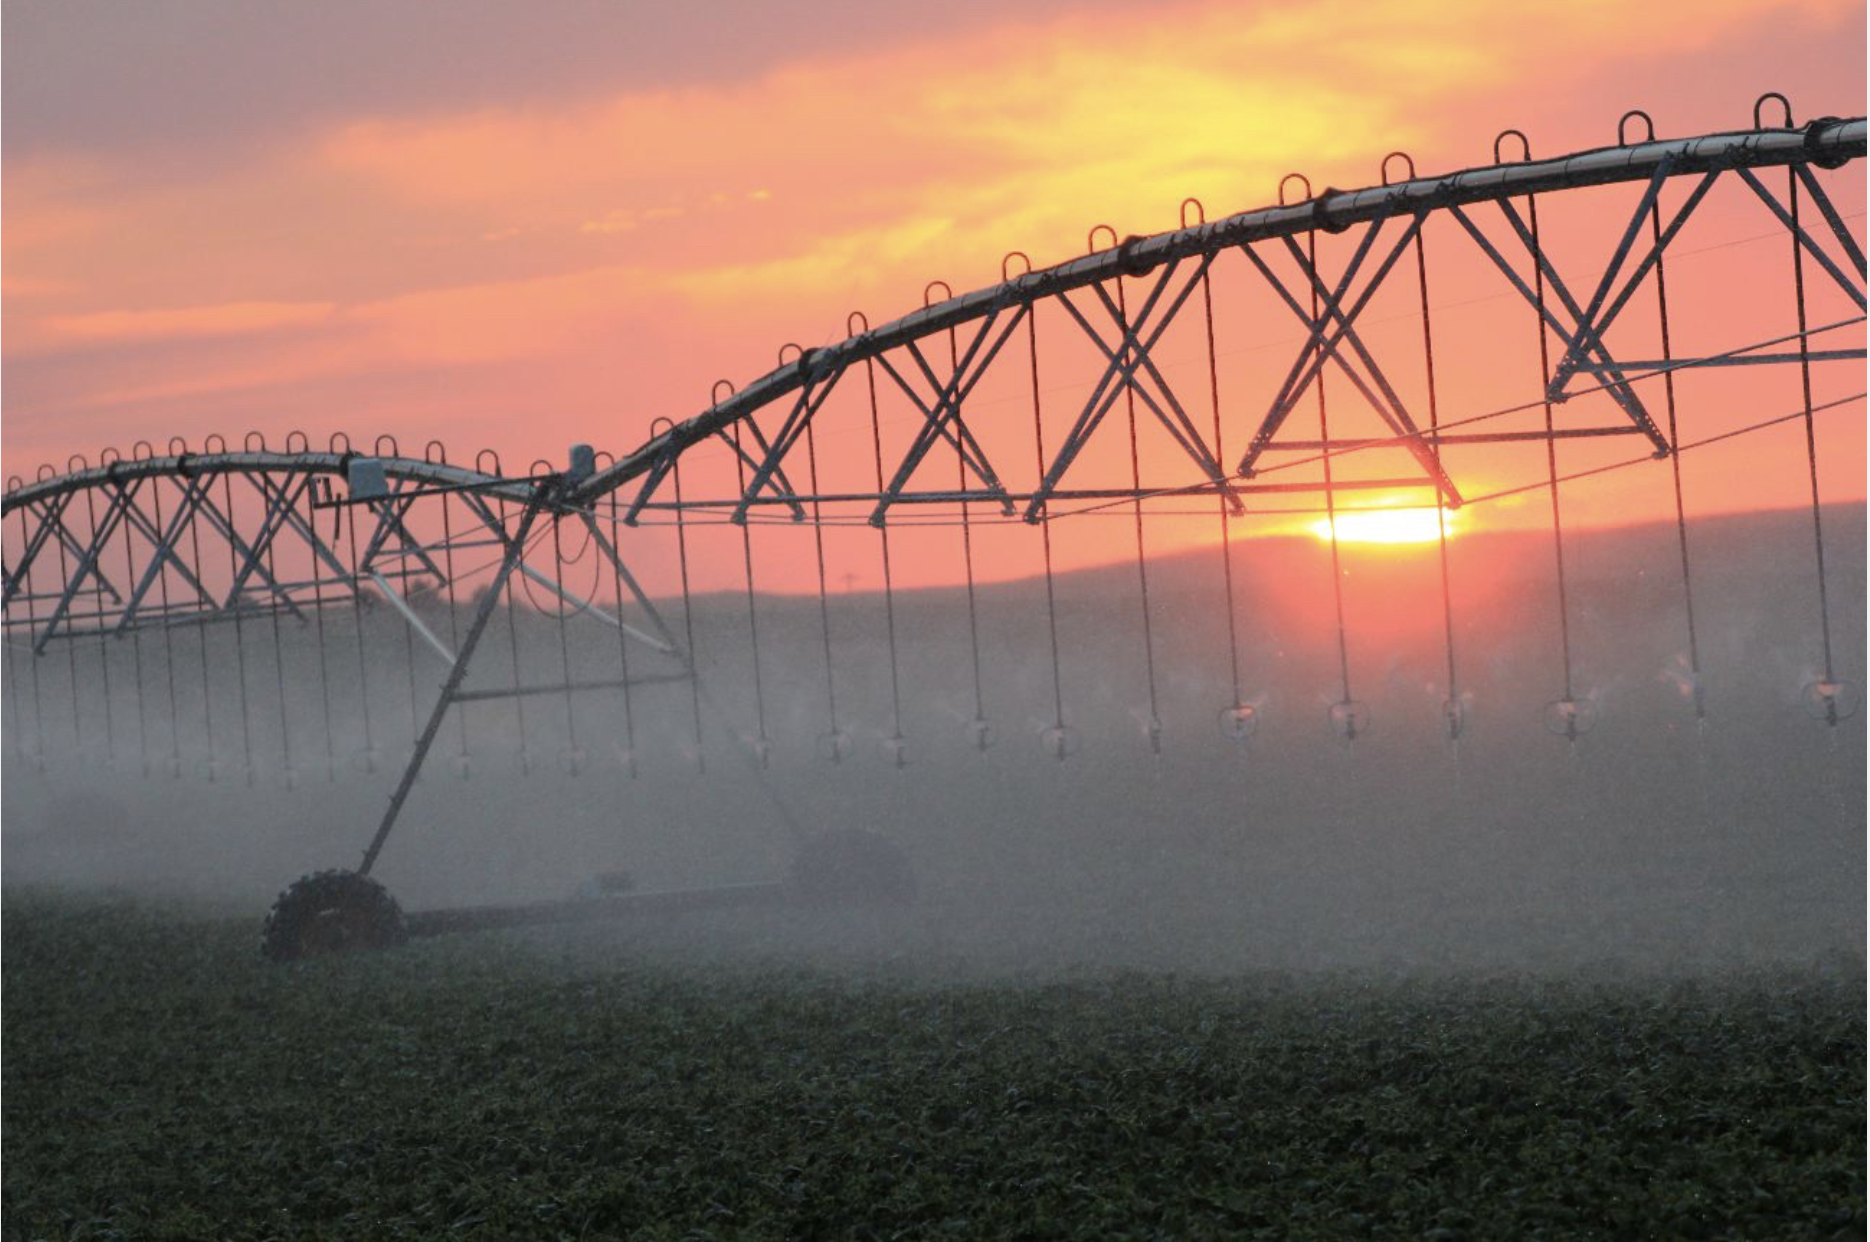
A center-pivot sprinkler near Wray, Colo. Photo/Allen Best
Click here to read the report (Neal T. Graham, Gokul Iyer, Mohamad I. Hejazi, Son H. Kim, Pralit Patel & Matthew Binsted). Here’s the abstract:
Governance measures such as restrictions on groundwater pumping and adjustments to sectoral water pricing have been suggested as response strategies to curtail recent increases in groundwater pumping and enhance sustainable water use. However, little is known about the impacts of such sustainability strategies. We investigate the implications of such measures, with the United States (U.S.) as an example. Using the Global Change Analysis Model (GCAM) with state-level details in the U.S., we find that the combination of these two governance measures can drastically alter agricultural production in the U.S. The Southwest stands to lose upwards of 25% of their total agricultural production, much of which is compensated for by production increases in river basins on the east coast of the U.S. The implementation of future sustainable water governance measures will require additional investments that allow farmers to maximize production while minimizing water withdrawals to avoid potentially detrimental revenue losses.
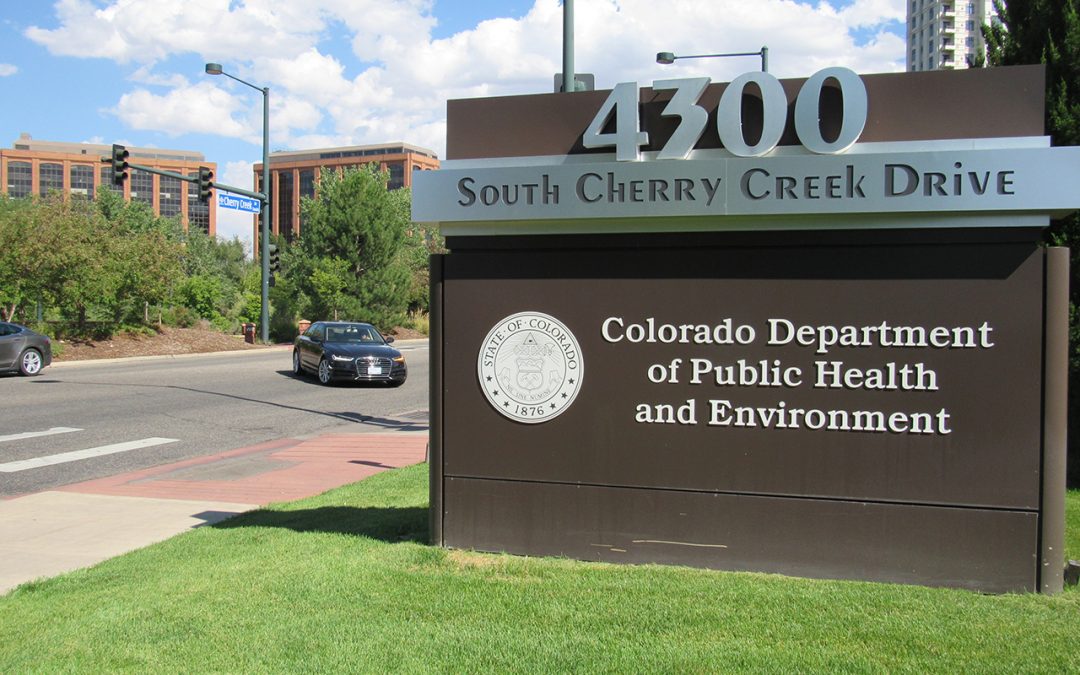
Colorado state health officials said they’re hopeful a recent federal court ruling that effectively overturned Trump-era rules reducing oversight of Western rivers and streams will allow states to revert back to a more protective standard.
“We are aware of Arizona’s court decision and are following what it means for other states, especially arid states such as Colorado. We are hopeful the Arizona ruling will apply nationwide because it has the potential to allow states to revert back to standards that protected our state waters more,” said Trisha Oeth via email.
Oeth, who is the environmental health and protection policy director at the Colorado Department of Public Health and Environment (CDPHE), also said the state understood the need to ensure that more certainty regarding the regulations was critical to protect all the interest groups affected by them.
The Trump rule sought to overturn Obama Administration rules that expanded the scope of the Clean Water Act. But Aug. 30, the Arizona court rejected it, saying it harmed streams in Western states and ignored important science. It has directed regulators across the country to use a set of rules developed prior to the Obama Administration’s actions until the Biden Administration can develop new regulations.
Since 2019, when the Trump-era rule was finalized, the CDPHE has been working, without success, on a proposed permitting program that lawmakers would have to approve. The permitting program would have covered streams and rivers left unprotected by the Trump rule. The so-called dredge-and-fill permits proposed by the state would be required when activities such as road and home building affect streams no longer covered by the Trump rule.
But farm interests, developers and contractors remain concerned that the Clean Water Act (CWA) rule, known as the Waters of the U.S. (WOTUS) rule, will remain mired in legal battles and regulatory uncertainty, delaying projects and raising their costs.
“It’s a big fear of ours,” said Zach Riley, the Colorado Farm Bureau’s director of public policy. The organization, which has 23,000 members, had supported the narrower WOTUS rule.
The political seesaw has been going on for decades with the CWA legally hamstrung over murky definitions about which waterways fall under its jurisdiction, which wetlands must be regulated, what kinds of dredge-and-fill work in waterways should be permitted, what authority the CWA has over activities on farms and Western irrigation ditches.
Administered by the U.S. Army Corps of Engineers and the Environmental Protection Agency, the CWA is credited with making U.S. waters some of the cleanest in the world. But it has also been difficult to administer, in part because the country is home to widely different geographies and because of numerous court cases that have altered how it is interpreted by different presidential administrations.
Western states have been particularly concerned because in the Midwest and East, for instance, major rivers that carry barge and shipping traffic are clearly “navigable,” the term early courts used to determine how water would be regulated. If a stream was navigable, it was subject to federal law.
But Colorado and other Western states rely on shallow streams that often don’t flow year round and don’t carry traditional commercial traffic. Over the years many of those streams too became protected by the Clean Water Act.
The Trump administration’s WOTUS rule, however, excluded them, saying that only navigable streams would be regulated, meaning that thousands of miles of streams in Colorado and other Western states that don’t flow year round or carry commercial shipping traffic would no longer have been protected.
Whether Colorado can or should craft a new permitting regulation that will remove it from the political back-and-forth that has dogged WOTUS and provide industry and environmental groups with more certainty isn’t clear yet.
The CDPHE has not yet said what it plans to do, saying it is still analyzing the Arizona decision.
“At the state level, it will be interesting,” said Alex Funk, senior counsel and director of water with the Theodore Roosevelt Conservation Partnership, which has advocated for a new state permitting program. “We’re still supportive of a state program to get out of this habit of having new WOTUS rules every four years…we need something that will survive at the federal level.”
Still others want the CDPHE to take a breather, to wait and see how the EPA and other agencies interpret this latest ruling before trying to create a new state regulation.
“Given the pace of change and the multiple rounds of litigation, the state could take more time to discuss what’s needed,” said Gabe Racz, an attorney who represents water utilities and industry at the Colorado Water Congress.
And Racz said he believes there is a chance that the Biden Administration will be able to craft new rules that can endure at the federal level, regardless of who is in the White House.
“The Biden Administration announced they planned to develop a durable rule. I’m hopeful. That’s a step in the right direction,” Racz said.
Jerd Smith is editor of Fresh Water News. She can be reached at 720-398-6474, via email at jerd@wateredco.org or @jerd_smith.
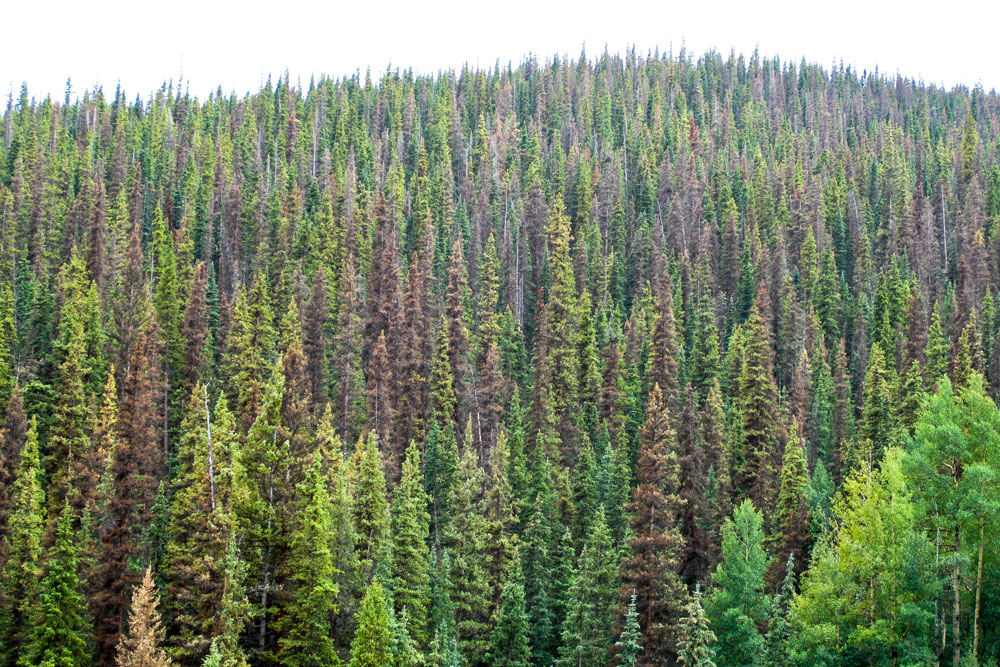
Spruce beetle-impacted forest in Southwestern Colorado with moderate levels of tree mortality. Photo credit: Sarah Hart
Click here for all the inside skinny and to register:
Participate in person or virtually on September 21st
The Southwestern Water Conservation District and Four Corners Water Center at Fort Lewis College are partnering to present “Water Connections: Adaptation from Forests to Deserts.”
This hybrid event will be held on Tuesday, September 21st from 5:00-8:00 p.m. at Fort Lewis College. Register now to reserve your in-person seat for $15.
If you prefer to view the livestream from home, please register to receive the Zoom link at no cost.
Below is a preview of the evening’s agenda:
5:00 p.m. Appetizers and Networking Outdoors
5:30 p.m. Snowtography – Forest Treatments and Hydrology
Joel Biederman, Research Hydrologist with USDA’s Southwest Watershed Research Center, presents his recent hydrology studies tied to forest treatments and upcoming test cases in southwestern Colorado
6:30 p.m. Break
6:45 p.m. Survey of Adaptation Strategies – From Our Forests to Our Deserts
Moderated by Steve Wolff, SWCD’s General Manager
Aaron Kimple, Mountain Studies Institute, regional forest health initiatives.
Selwyn Whiteskunk, Ute Mountain Ute Tribal Councilman, adapting to drought from the water user and tribal perspectives.
Carrie Padgett, Harris Water Engineering, southwest Colorado planning for future water needs.
Becky Mitchell, Colorado Water Conservation Board Director and Colorado Commissioner to the Upper Colorado River Commission, how aridification affects our water management.