Last month, the Intergovernmental Panel on Climate Change released their Working Group 1 report on the Physical Science Basis of Climate Change (1). This huge report, both in terms of importance and length (the thing is nearly 4000 pages!), covers literally everything you can possibly imagine about Earth’s climate. Past changes, current observations, future projections of warming are all in there. So what does this exhaustive summary of climate research have to say about the El Niño-Southern Oscillation (ENSO) and climate change? Let’s dig in!
How has ENSO changed in the past?
Often when discussing climate change, the conversation stays firmly placed in discussing future changes. But it’s clear that the climate is changing already. Before we can jump into what, if any, ENSO changes are expected for the future, it’s important to look back and see if ENSO is ALREADY changing. And then determine if THOSE changes are influenced by our insatiable appetite for emitting greenhouse gases (GHG). So what’s up?
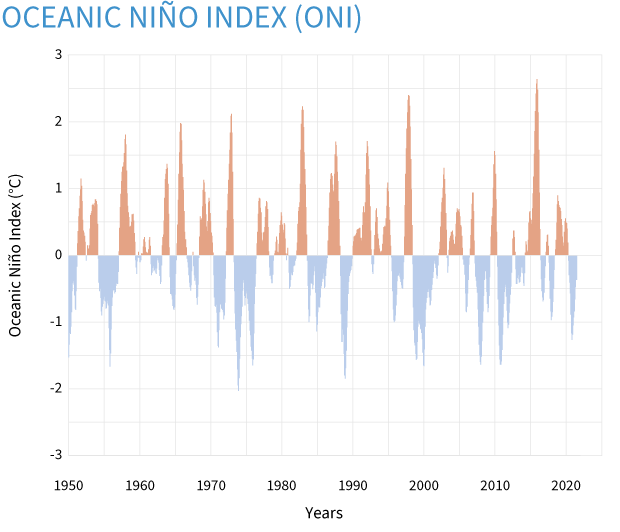
The Oceanic Niño Index, or ONI, from 1950-present. The ONI is the three-month sea surface temperature anomaly in the Niño3.4 region of the tropical Pacific Ocean. Red indicates above-average temperatures and blue indicates below-average temperatures. Climate.gov image using data from NOAA NWS Climate Prediction Center.
It’s changed!… kinda. (WITH LOTS OF NUANCE!) The amplitude (strength) of ENSO along with the frequency of high-magnitude events (aka the BIG ones) are higher since 1950 than from 1850-1950 to as far back at 1400-1950. (2) The IPCC report also noted that a higher number of El Niño events in the last 20-30 years have been associated with temperature changes that are stronger in the central Pacific rather than the east.
But those differences don’t necessarily mean that human-caused climate change is behind them (there’s that nuance!). The instrumental record and paleoclimate proxy evidence (coral, tree rings, sediment cores) all show that throughout the Holocene (the last 11,700 years), ENSO has displayed all sorts of different patterns and amplitudes. There is no clear evidence that any changes since 1950 in ENSO are all that unusual. Plus, climate model simulations that do not include rising greenhouse gases produce similarly large variations in ENSO behavior over long periods of time due solely to the chaotic nature of the climate system.
The same holds true for the trend in recent years for central Pacific El Niño events. Both paleoclimate data and climate models indicate that any changes seen are well within the range of natural variability. That’s just how the earth works sometimes.
It’s like student scores in weekly pop quizzes in high school before and after using a study aide. Before, the scores ranged from 0 to 100 with periods of consistent scores above 90 and other times of consistent 60s (or worse. Hey, it could be senior year and prom is coming up!). If you were the teacher, you wouldn’t feel confident that the student “turned a corner” from using that specific study aide until you saw a long consistent streak of higher scores. You’d seen scores like that on occasion before, after all. Maybe the flash cards work. Maybe they don’t. It’s too hard to say.
What’s going to happen to ENSO in a warming world?
First things first, it is virtually certain that ENSO will not only exist in a warming world, but that it will continue to play a huge role in affecting earth’s climate patterns (3).
But what can we say about climate change changing ENSO in the future? Especially, if we can’t say with much confidence if climate change is affecting ENSO already.
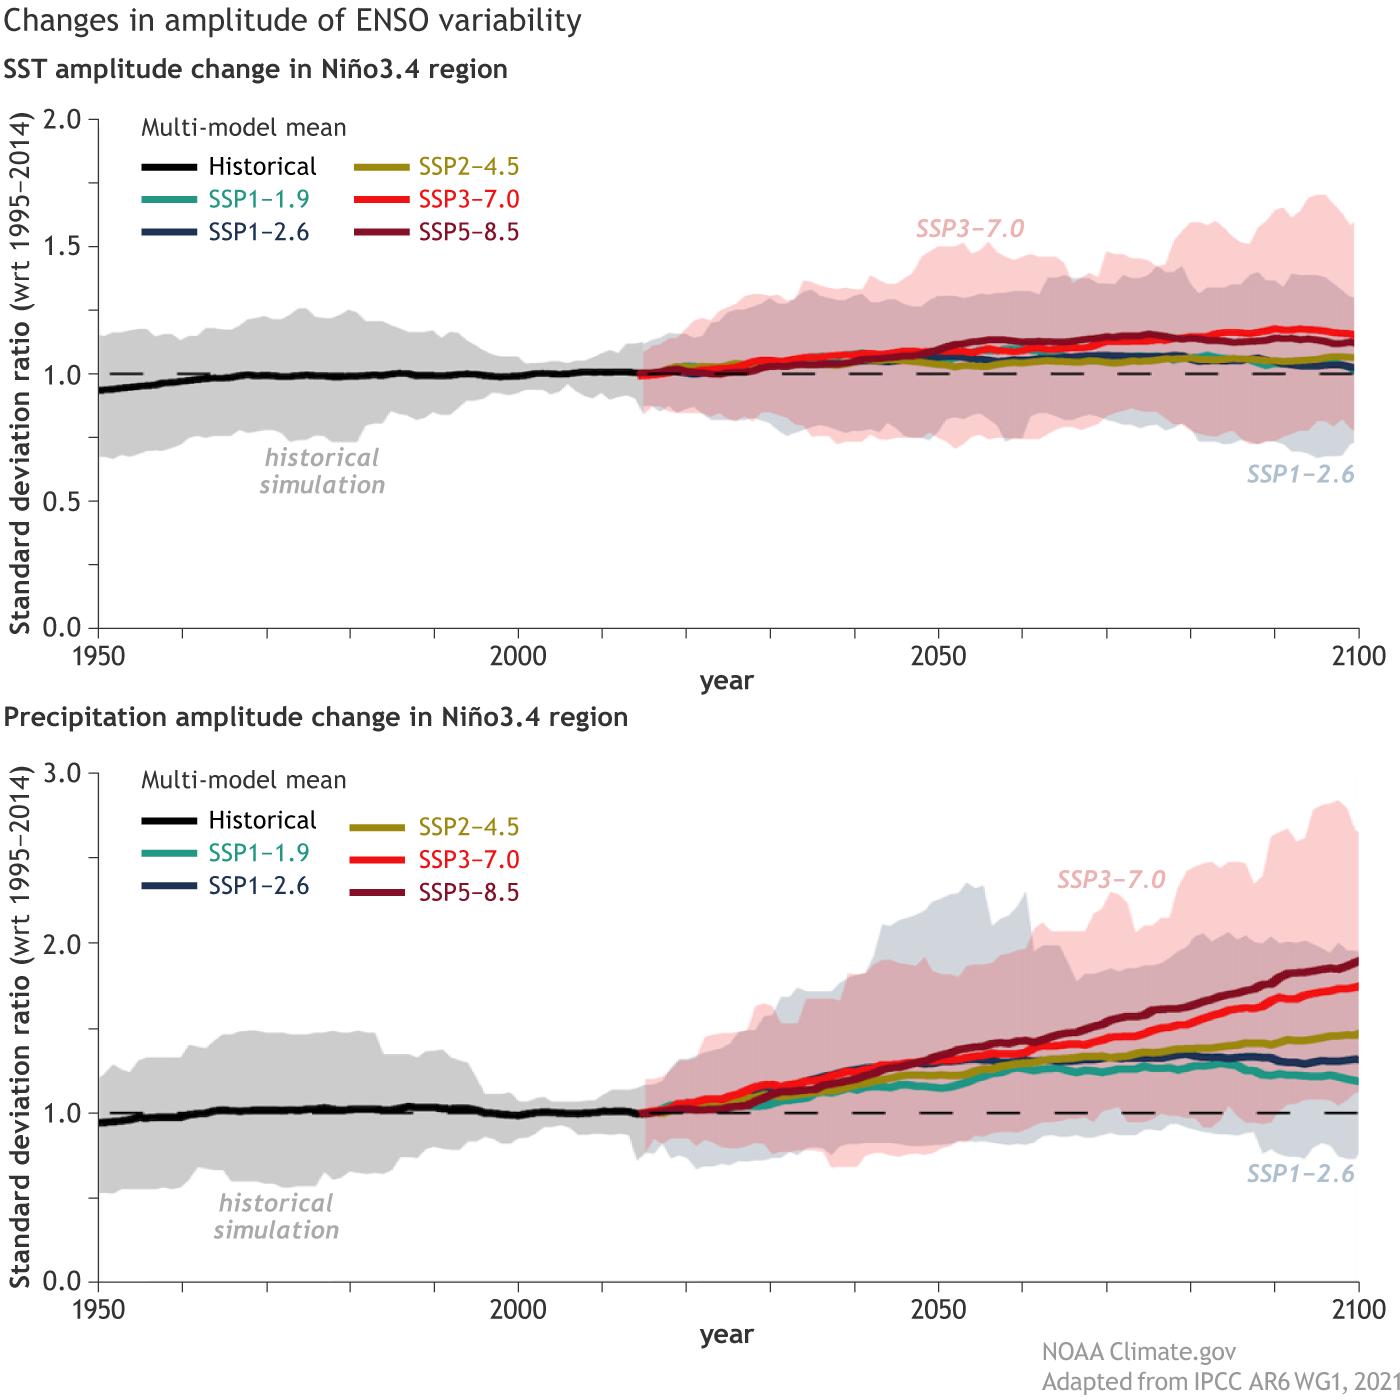
Changes in amplitude of ENSO variability of both (top) sea surface temperatures and (bottom) precipitation anomalies averaged over Niño3.4 region for 1950–2014 from CMIP6 climate model historical simulations and for 2015–2100 four shared socioeconomic pathways (SSP) scenarios. Thick lines stand for multi-model mean and shading is the 5–95% range across CMIP6 models for historical simulation (grey), SSP1-2.6 (blue) and SSP3-7.0 (pink), respectively. Climate.gov figure adapted from Figure 4.10 in IPCC AR6 WG1 Physical Science Basis report.
There is no climate model consensus on a change in ENSO-related sea surface temperature over the next century in any of the greenhouse gas emission scenarios used in the report. But regardless of any changes in ENSO sea surface temperatures, in intermediate to very high GHG scenarios, it is very likely that rainfall variability over the east-central tropical Pacific will increase significantly (4). Basically, we may expect El Niño to be wetter in this region and La Niña may be drier.
Importantly, this is NOT saying that the climate models all show no change in ENSO over the next century in these scenarios. Some of the models certainly do show change. The issue is that there is no clear consistency not just among different models, but also among different runs of the same model made with slightly different initial conditions (ensembles). Some show higher amplitude ENSO events. Others project lower amplitude events. It’s this wide range of outcomes that has led to the IPCC’s low confidence in how ENSO could change in a warming world.
Why is this all so complicated?
ENSO is a super-duper complex give and take between the ocean and the atmosphere. Changes in global surface temperatures…PSHT…that’s easy compared to ENSO.
ENSO mechanisms showing the complexity of processes involved in ENSO. Dashed contour shows the location of the strongest positive SST anomaly during El Niño (the Niño 3 region). NOAA Climate.gov, based on original provided by Eric Guilyardi.
How is it complex? Seven years ago, I described ENSO as the light in a room controlled by hundreds of dimmer switches. This is because ENSO is controlled by multiple feedbacks, which we discussed in this blog post. Climate change is like a bratty kid who goes into the room and fiddles with each switch, turning some up and others down. Whether the end result is a brighter room (stronger or more frequent ENSO) or a darker room (weaker or less frequent ENSO) is hard to predict.
Even without climate change affecting things, modeling ENSO is hard! With so many influences, it’s easy for a climate model to get the “right” answer (the light in the room) for the “wrong” reasons (adjusting different dimmer switches to get the final “correct” amount of light). Climate models can show a wide range of potential ENSO outcomes for the future by slightly changing a whole bunch of “dimmer switches.” It’s hard to say which switches are more “right” than the others.
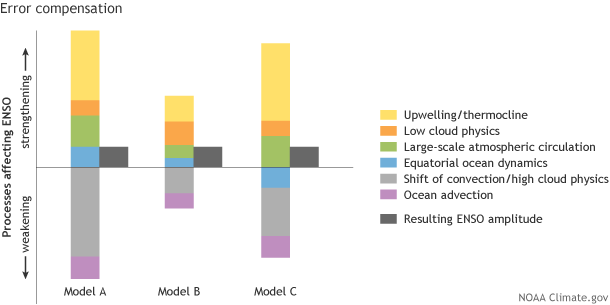
A generalized look at how general circulation models can predict different impacts on ENSO from various mechanisms or processes related to ENSO, yet still predict the same resulting ENSO amplitude. Occasionally, models can even predict a different sign for a mechanism (see equatorial ocean dynamics in blue for model C), and still have the resulting ENSO amplitude be the same. It is therefore important to verify that models correctly predict the final ENSO amplitude as well as the correct ENSO mechanisms, or processes. Graphic by Fiona Martin, based on work by Eric Guilyardi.
And of course, the last complicating thing is just how different ENSO has been over the long-term past. With such a variable history, it makes it more difficult to see a climate change specific signal pop out.
Any new research shed any light on ENSO and Climate Change?
Yes, and no. Yes in a sense that new research is seemingly released monthly. And no in a sense that the new research is still often at odds. One week an article might suggest that ENSO events will get stronger in a warming world. And the next week a paper comes out and says “Nuh uh, it’ll be weaker”.
If anything, this just gives more credence to the conclusions of the IPCC report of low confidence in how ENSO, overall, will change. That’s not to say that it won’t. We just don’t know yet exactly how things will play out.
Any last IPCC WG1 Physical Science Basis report thoughts?
There is no actual new science done in this report. Instead, the scientists who authored this report were tasked with assessing the state of the science to come to conclusions about what can be said about climate change and its impact on everything. It should be expected that some individual scientists might feel that their research wasn’t given enough credence. But the authors’ goal is to reflect the research in totality. Believe me, there will be plenty more research into how ENSO might change due to climate change, so stay tuned!
Footnotes
(1) The report is the first of three reports to be released as part of the sixth assessment report from the Intergovernmental Panel on Climate Change. The next two reports to be released in the first half of 2022 will be on adaptation and mitigation of climate change.
(2) How can scientists reconstruct the state of ENSO back to the 1400s? Through the use of climate proxies like fossil coral. We’ve covered this topic a couple of times on the ENSO Blog. First in a guest post by Dr. Kim Cobb and second in a post by me on volcanos.
(3) The exact phrasing found in the IPCC AR6 WG1 report is that “it is virtually certain that the El Niño–Southern Oscillation (ENSO) will remain the dominant mode of interannual variability in a warmer world.”
(4) The reason for this is that the average sea surface temperatures are expected to warm more in the eastern and central tropical Pacific relative to the rest of the tropics, which makes it easier for an ENSO sea surface temperature anomaly to induce a rainfall anomaly even if the ENSO sea surface temperature anomalies do not change.
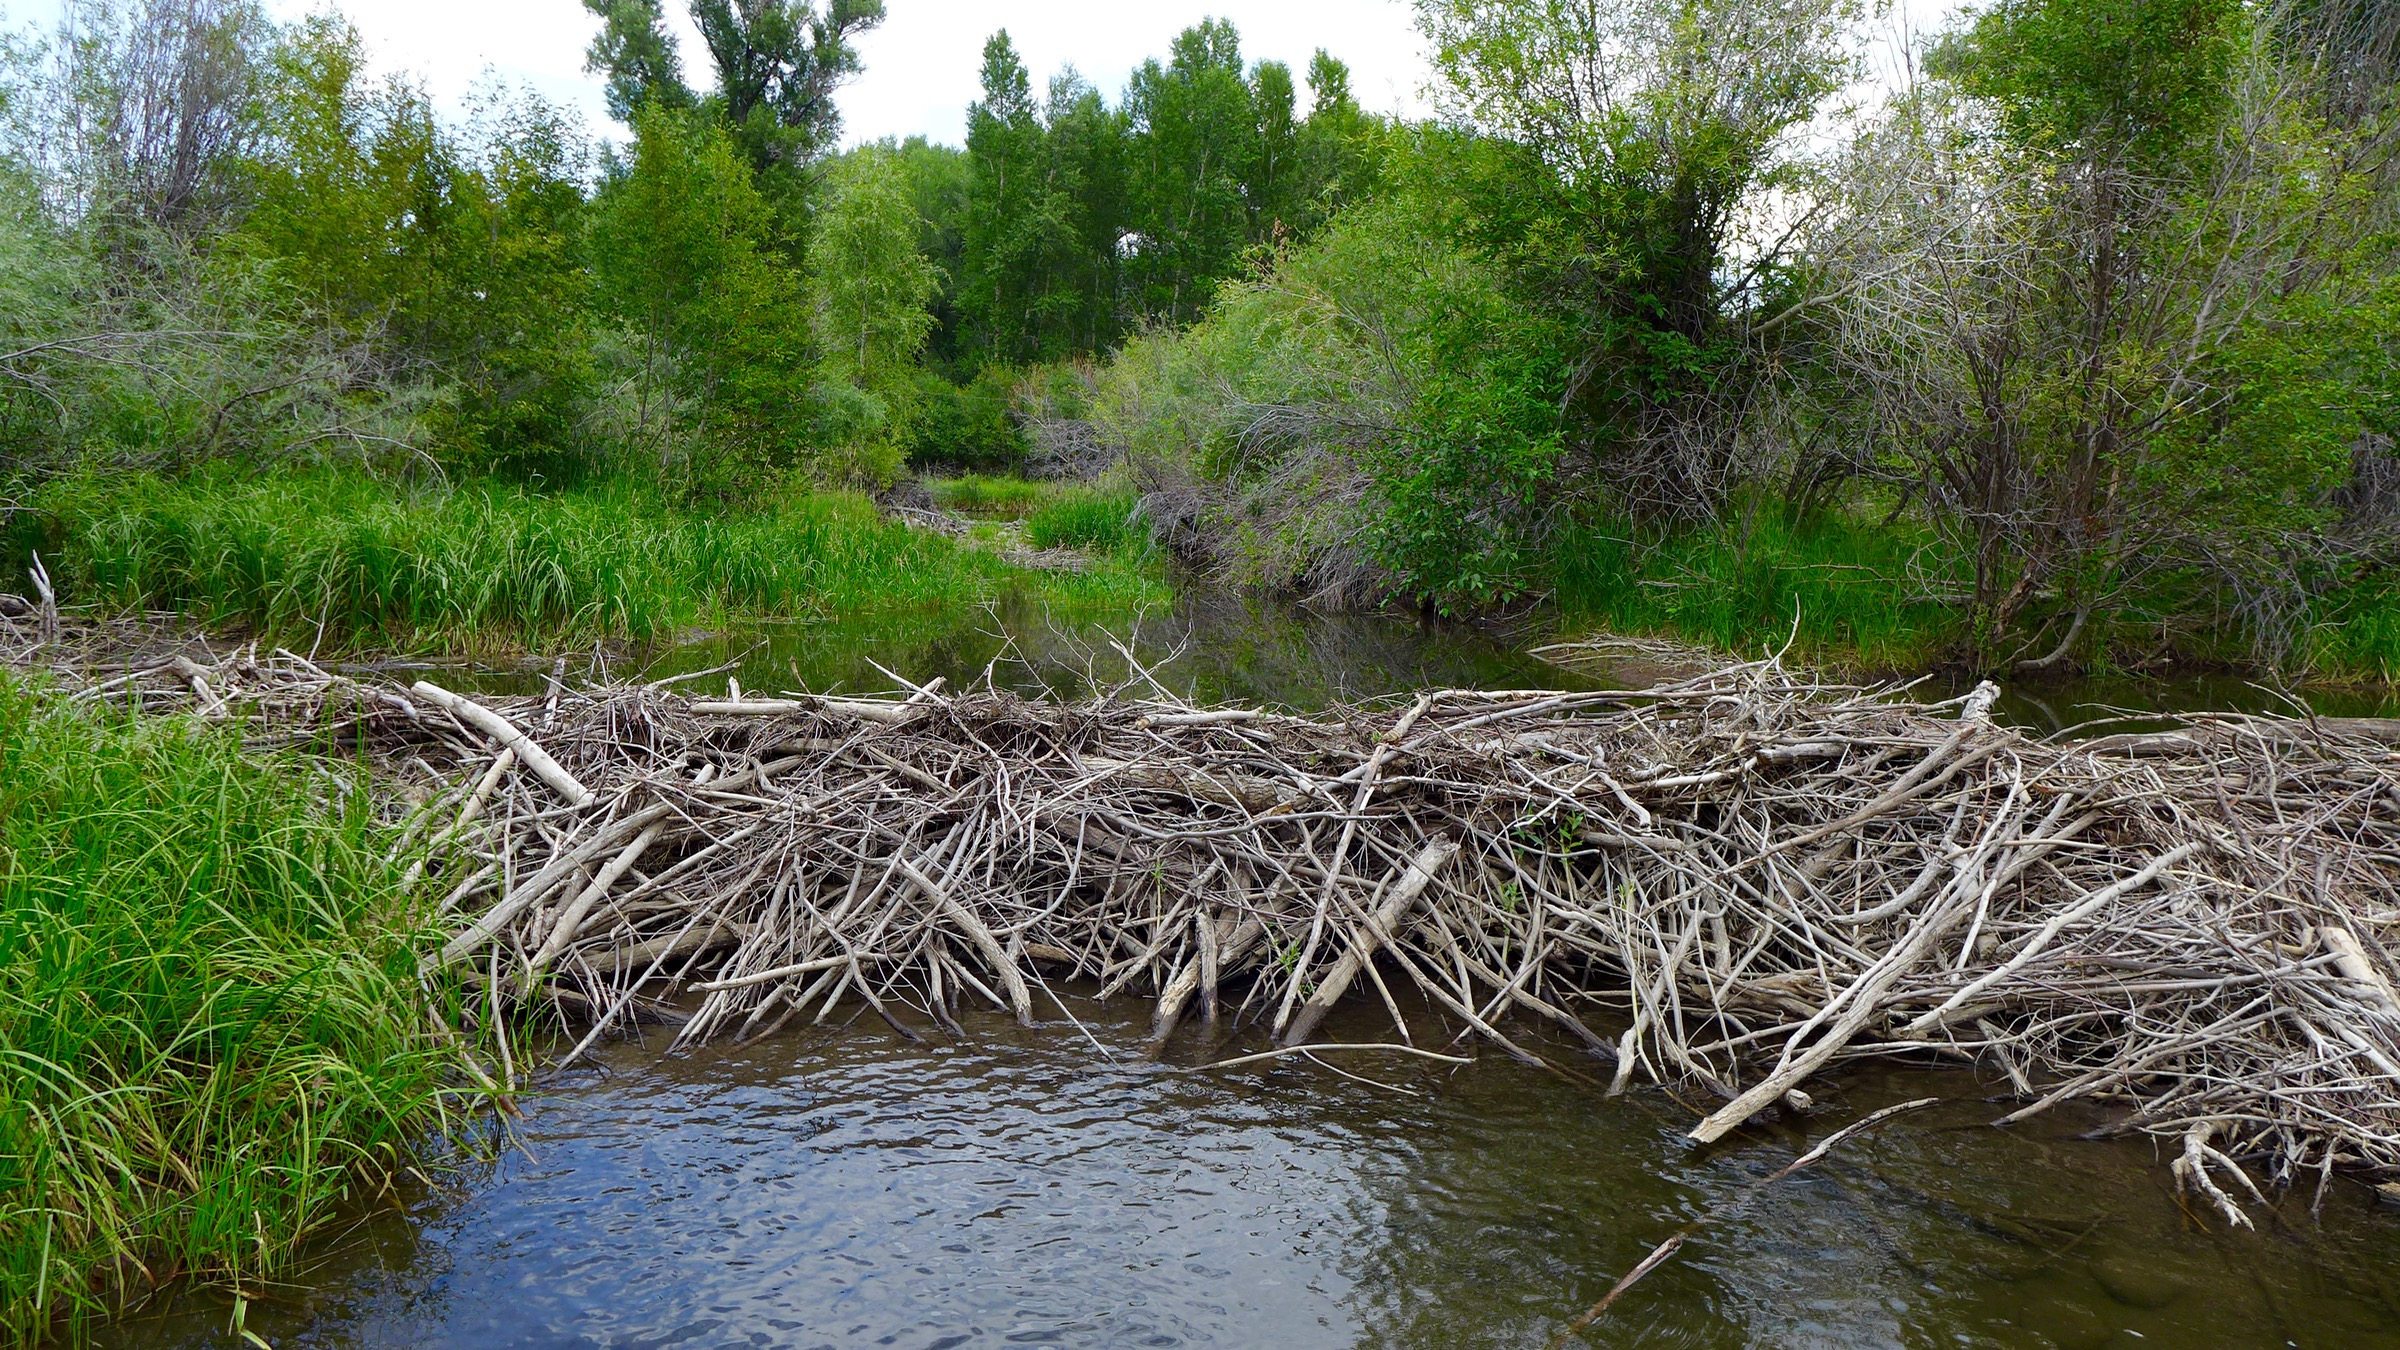
Deep in the Cameron Peak burn scar, nestled among charred hills, there’s an oasis of green — an idyllic patch of trickling streams that wind through a lush grass field. Apart from a few scorched branches on the periphery, it’s hard to tell that this particular spot was in the middle of Colorado’s largest-ever wildfire just a year ago.
This wetland was spared thanks to the work of beavers.
The mammals, quite famously, dam up streams to make ponds and a sprawling network of channels. Beavers are clumsy on land, but talented swimmers; so the web of pools and canals lets them find safety anywhere within the meadow.
On a recent visit to that patch of preserved land in Poudre Canyon, ecohydrologist Emily Fairfax emphasized the size of the beavers’ canal network.
“Oh my gosh, I can’t even count them,” she said. “It’s a lot. There’s at least 10 ponds up here that are large enough to see in satellite images. And then between all those ponds is just an absolute spiderweb of canals, many of which are too small for me to see until I’m here on the ground.”
The very infrastructure that gives beavers safety from predators also helps shield them from wildfire. Their work saturates the ground, creating an abnormally wet patch in the middle of an otherwise dry area. Dams allow the water to pool, and the channels spread it out over a wide swath of valley floor.
Fairfax researches how beavers re-shape the landscapes where they live. Across the West, she’s seen beaver-created wetlands survive wildfires.
“When you’re at this beaver complex,” she said, “it never stops being green. Everything else in the landscape – the hill slopes on either side, they both charred. They lost all their vegetation during this fire. But this spot, it did not. These plants were here last year and they’re still here today.”
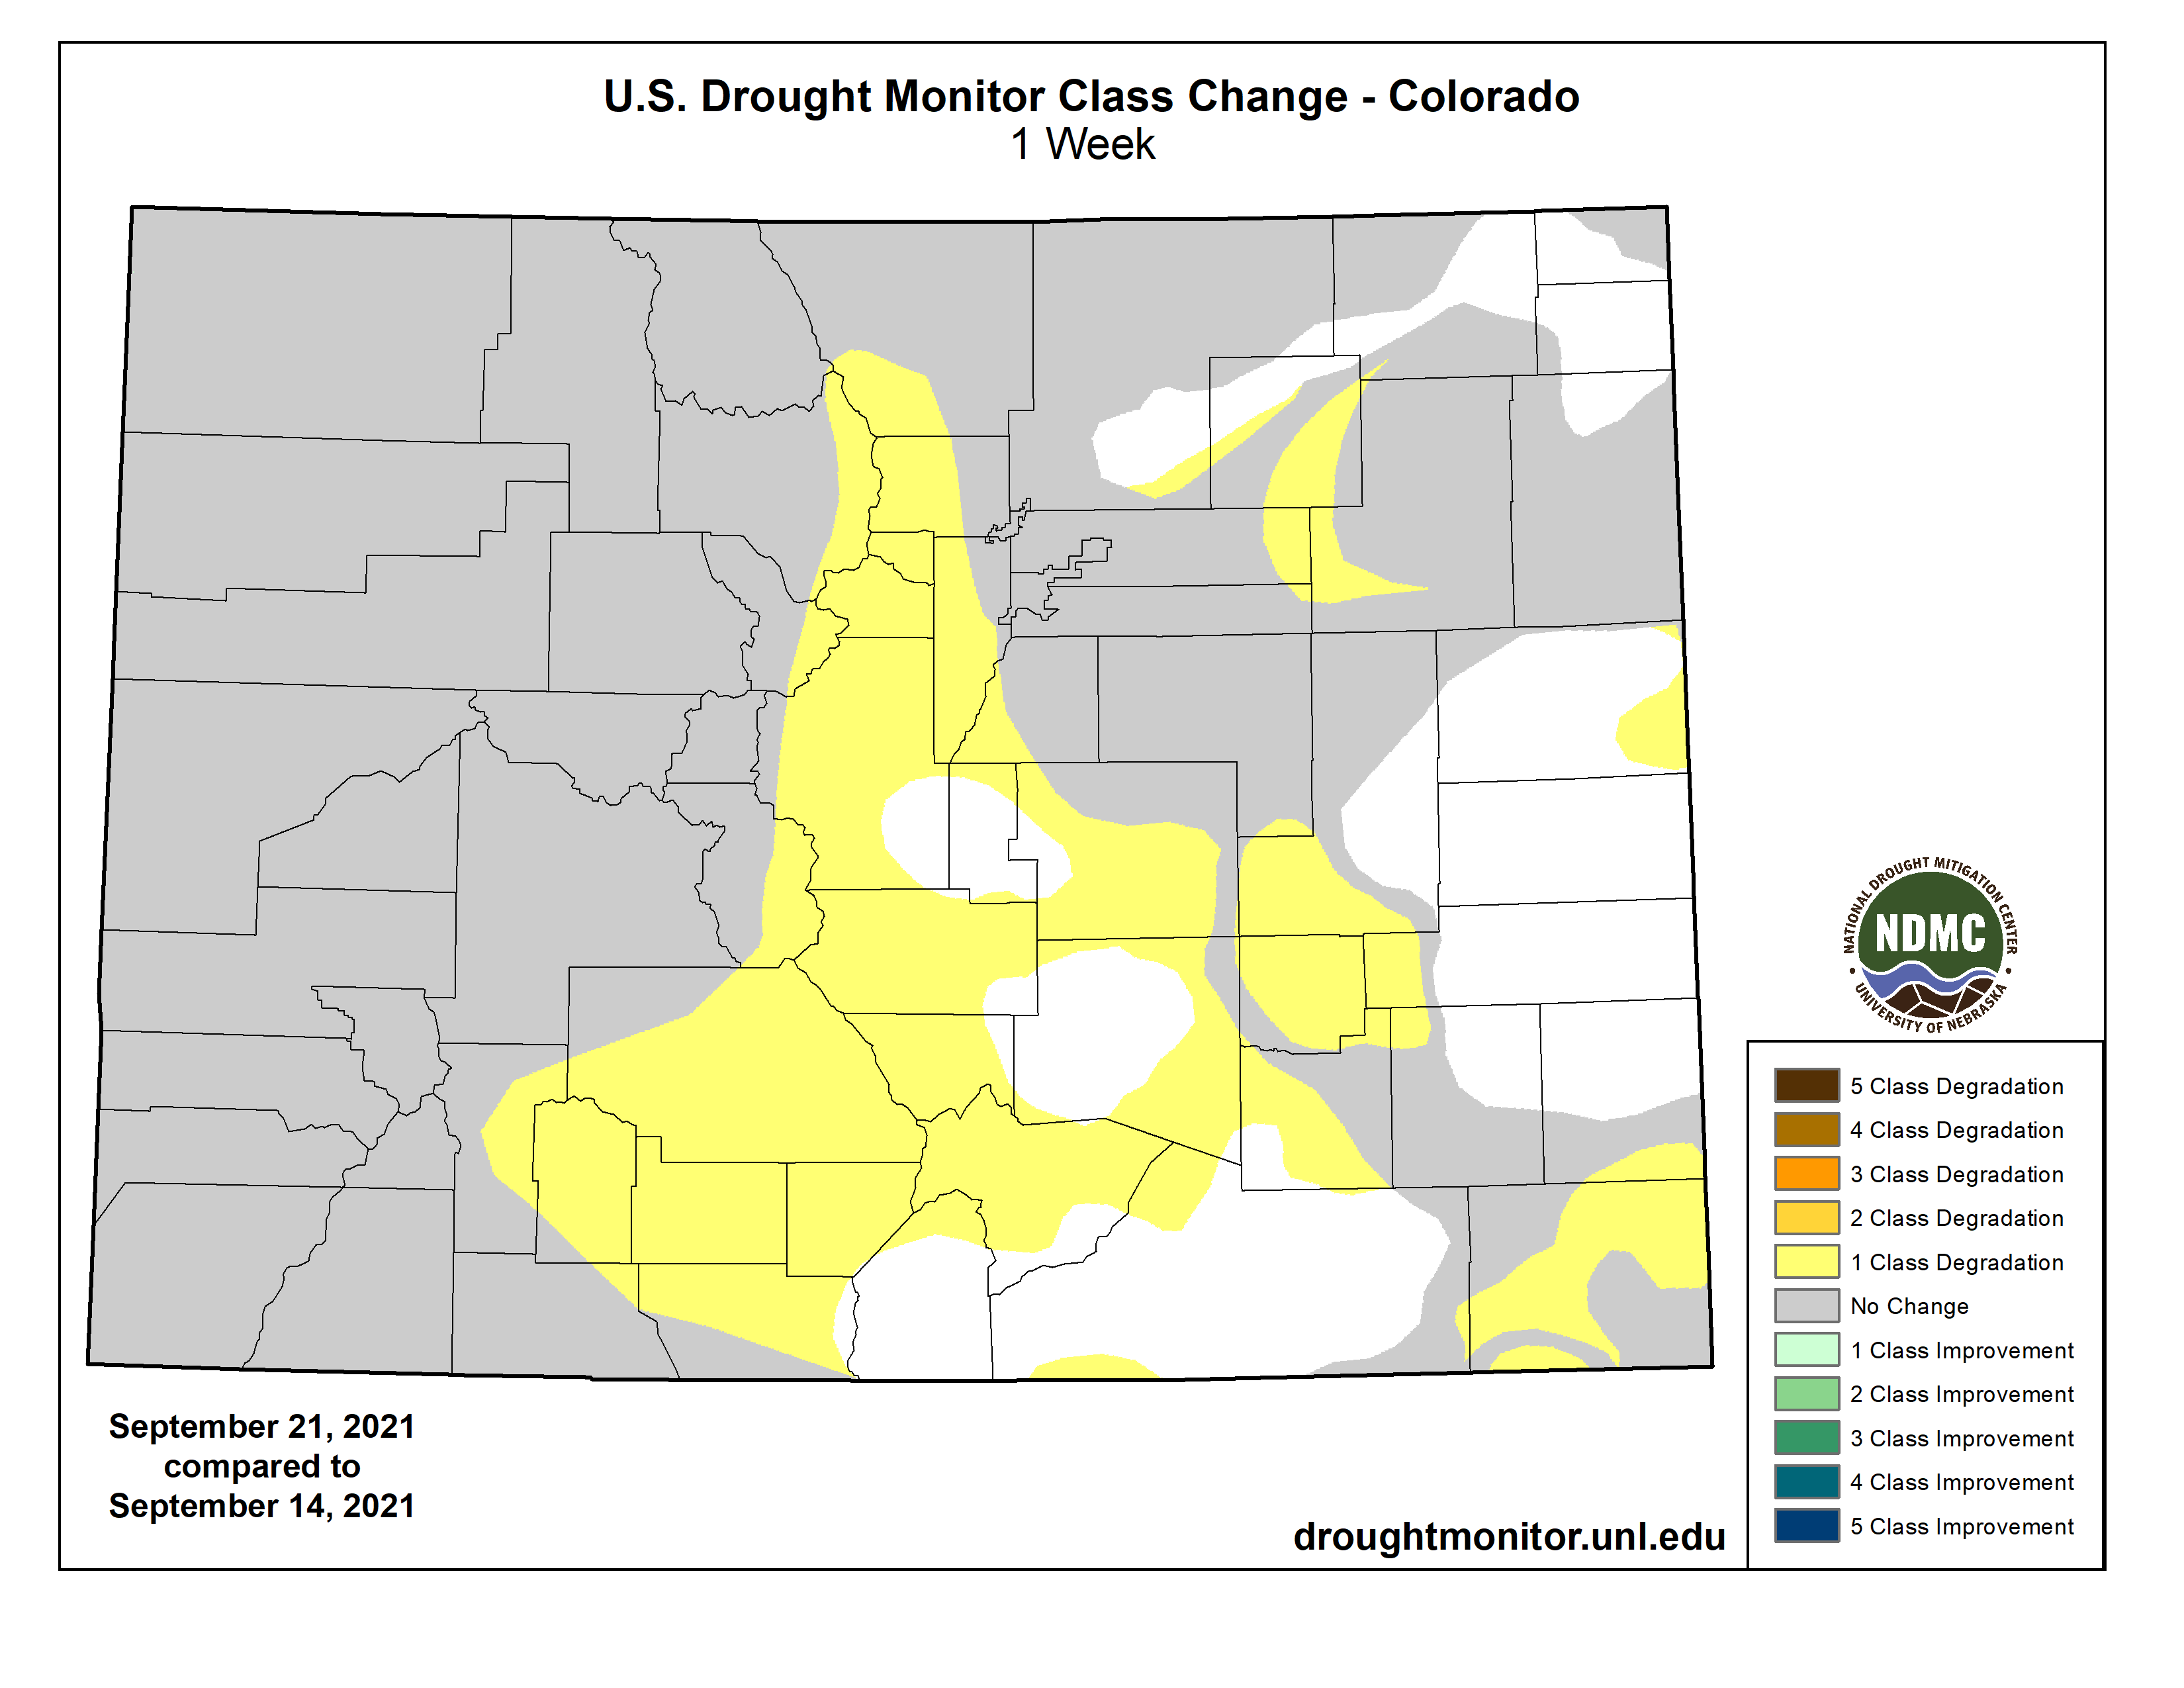
This week, a reintroduction of D1 Moderate drought levels has returned to Crowley county and surrounding areas as well as Baca county.
We are in much better shape this September versus September 2020, where the majority of the state was under severe and extreme drought. And last fall brought one of the worst wildfire seasons in state history.
Colorado Drought Monitor September 22, 2020.
Until now, Colorado Springs has been riding on a precipitation surplus from wet weather in Spring and early Summer. For the first time this year, Colorado Springs is at a deficit for the water year.
Drought is a marathon, not a sprint. It takes a long time to develop and a long time to fix. This summer’s initial improvement in drought across eastern Colorado now seems to be tipping the other way.
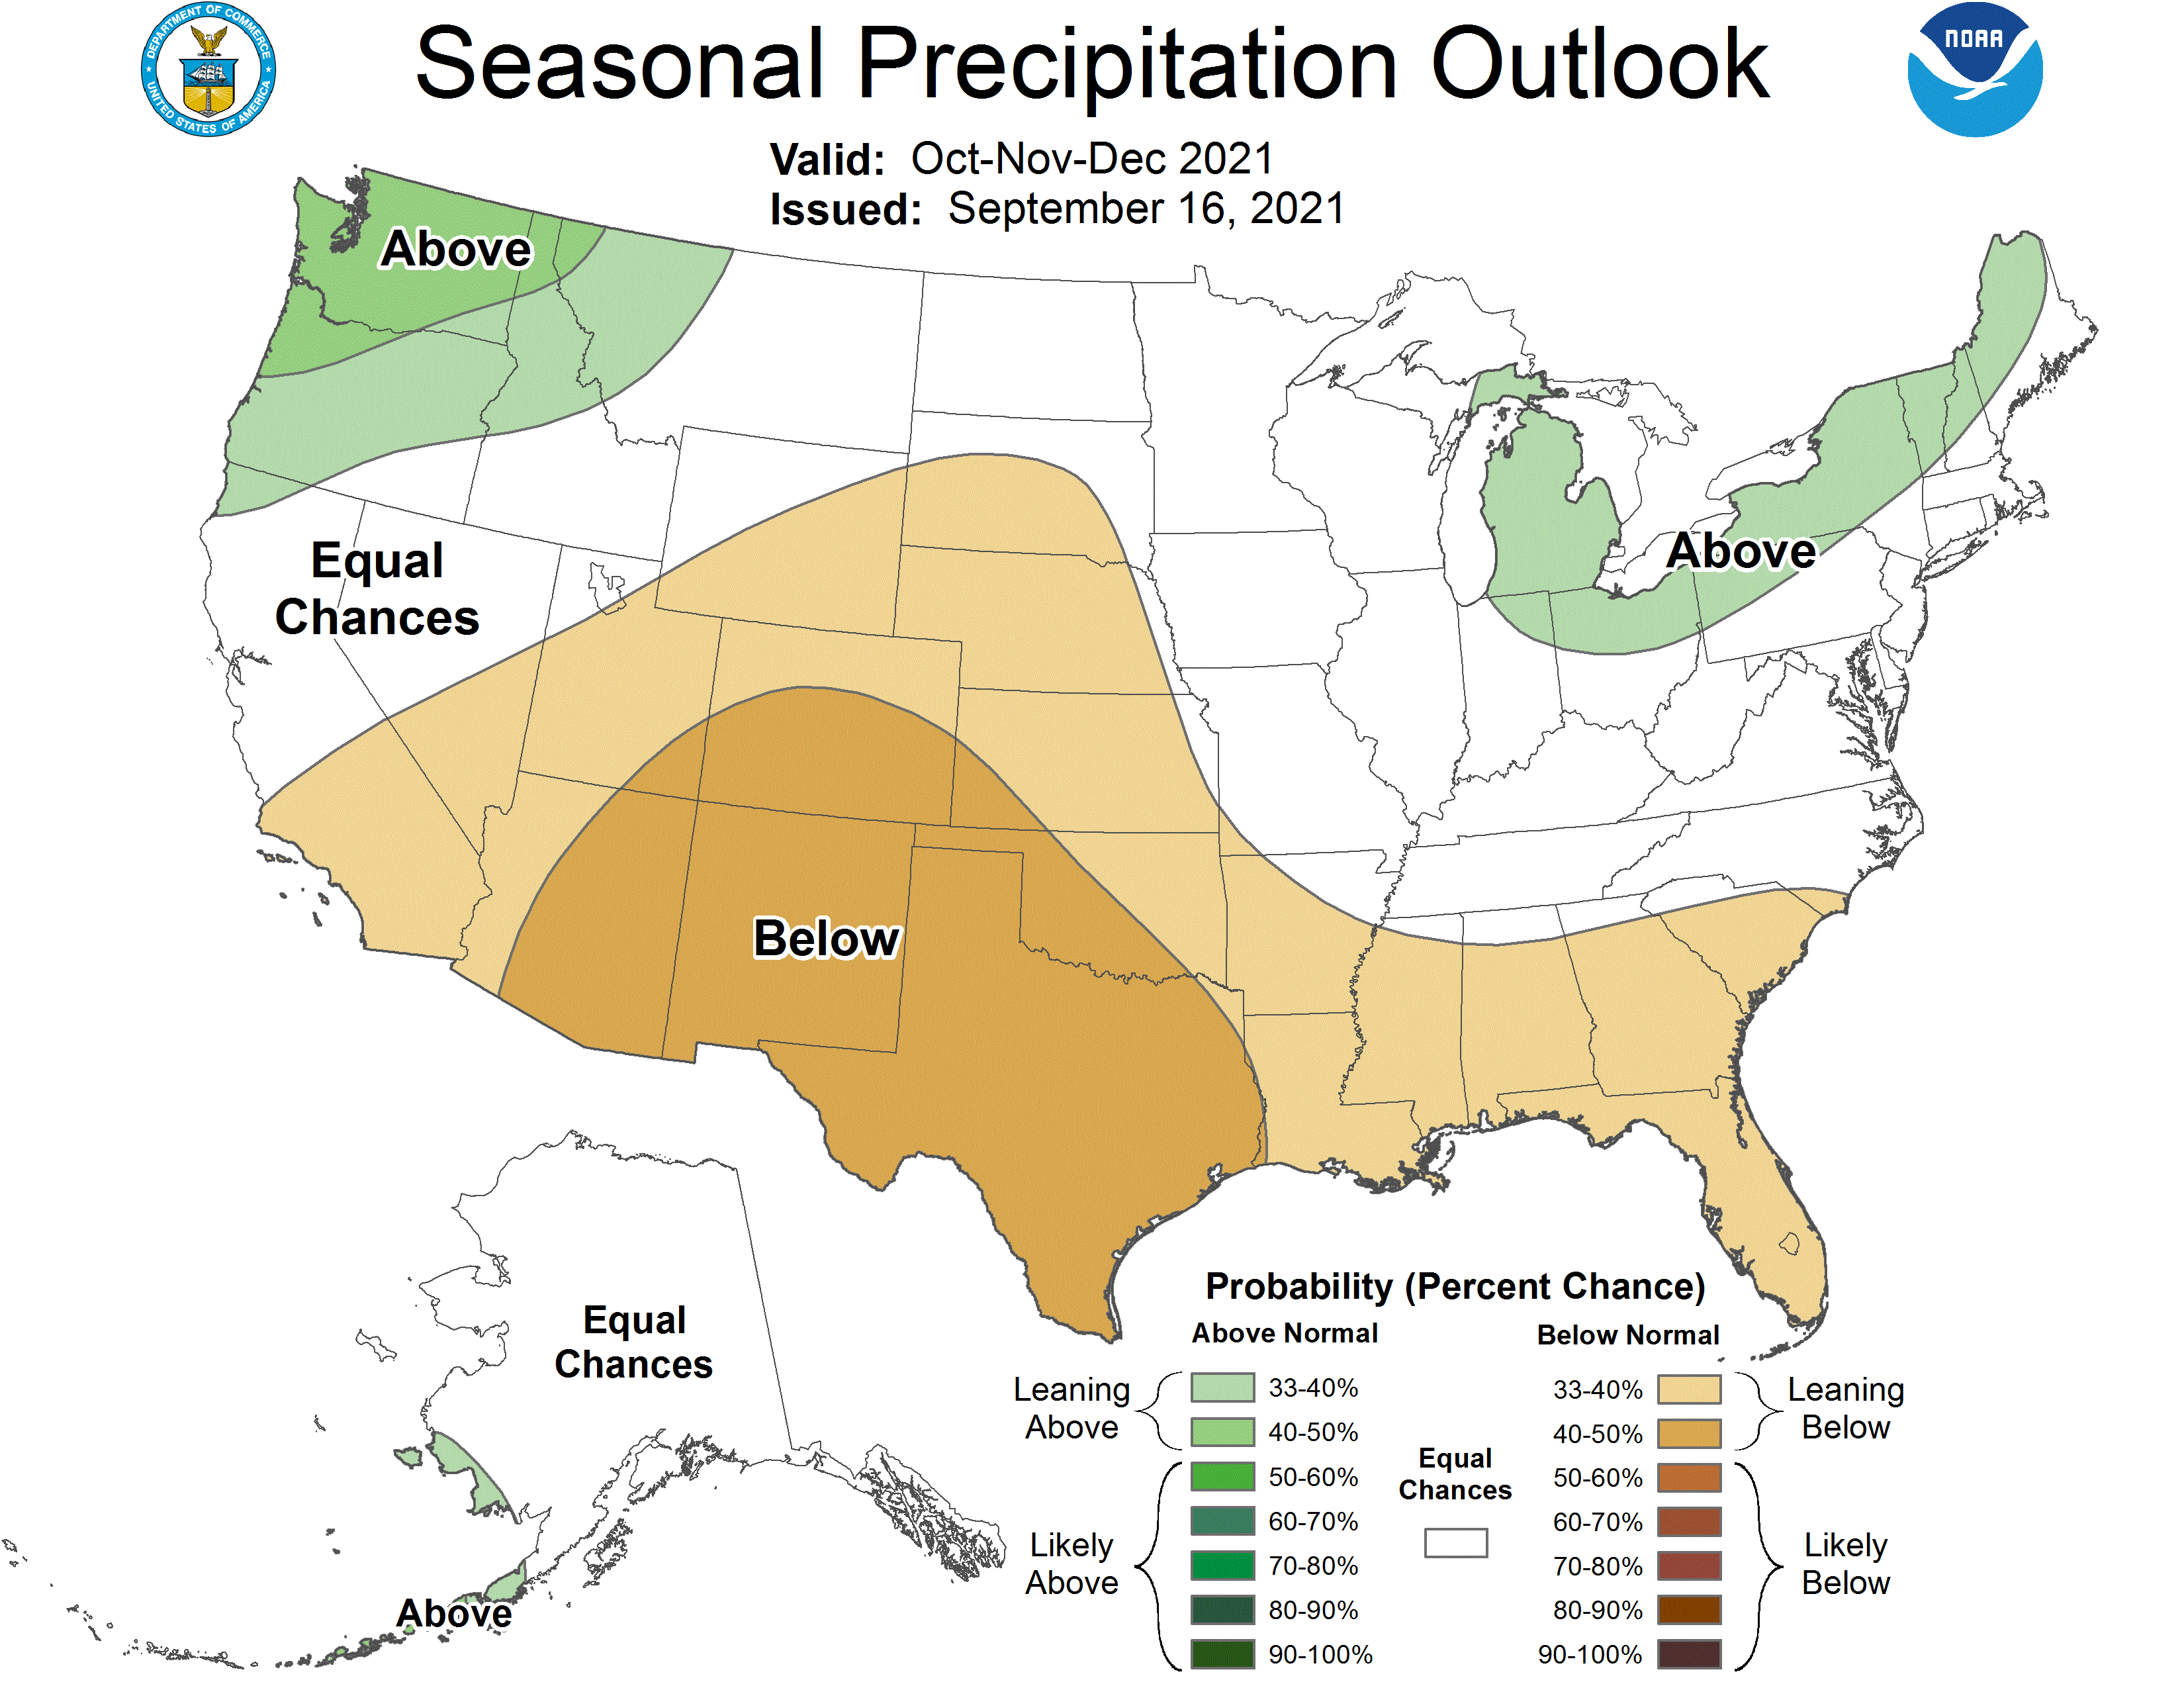
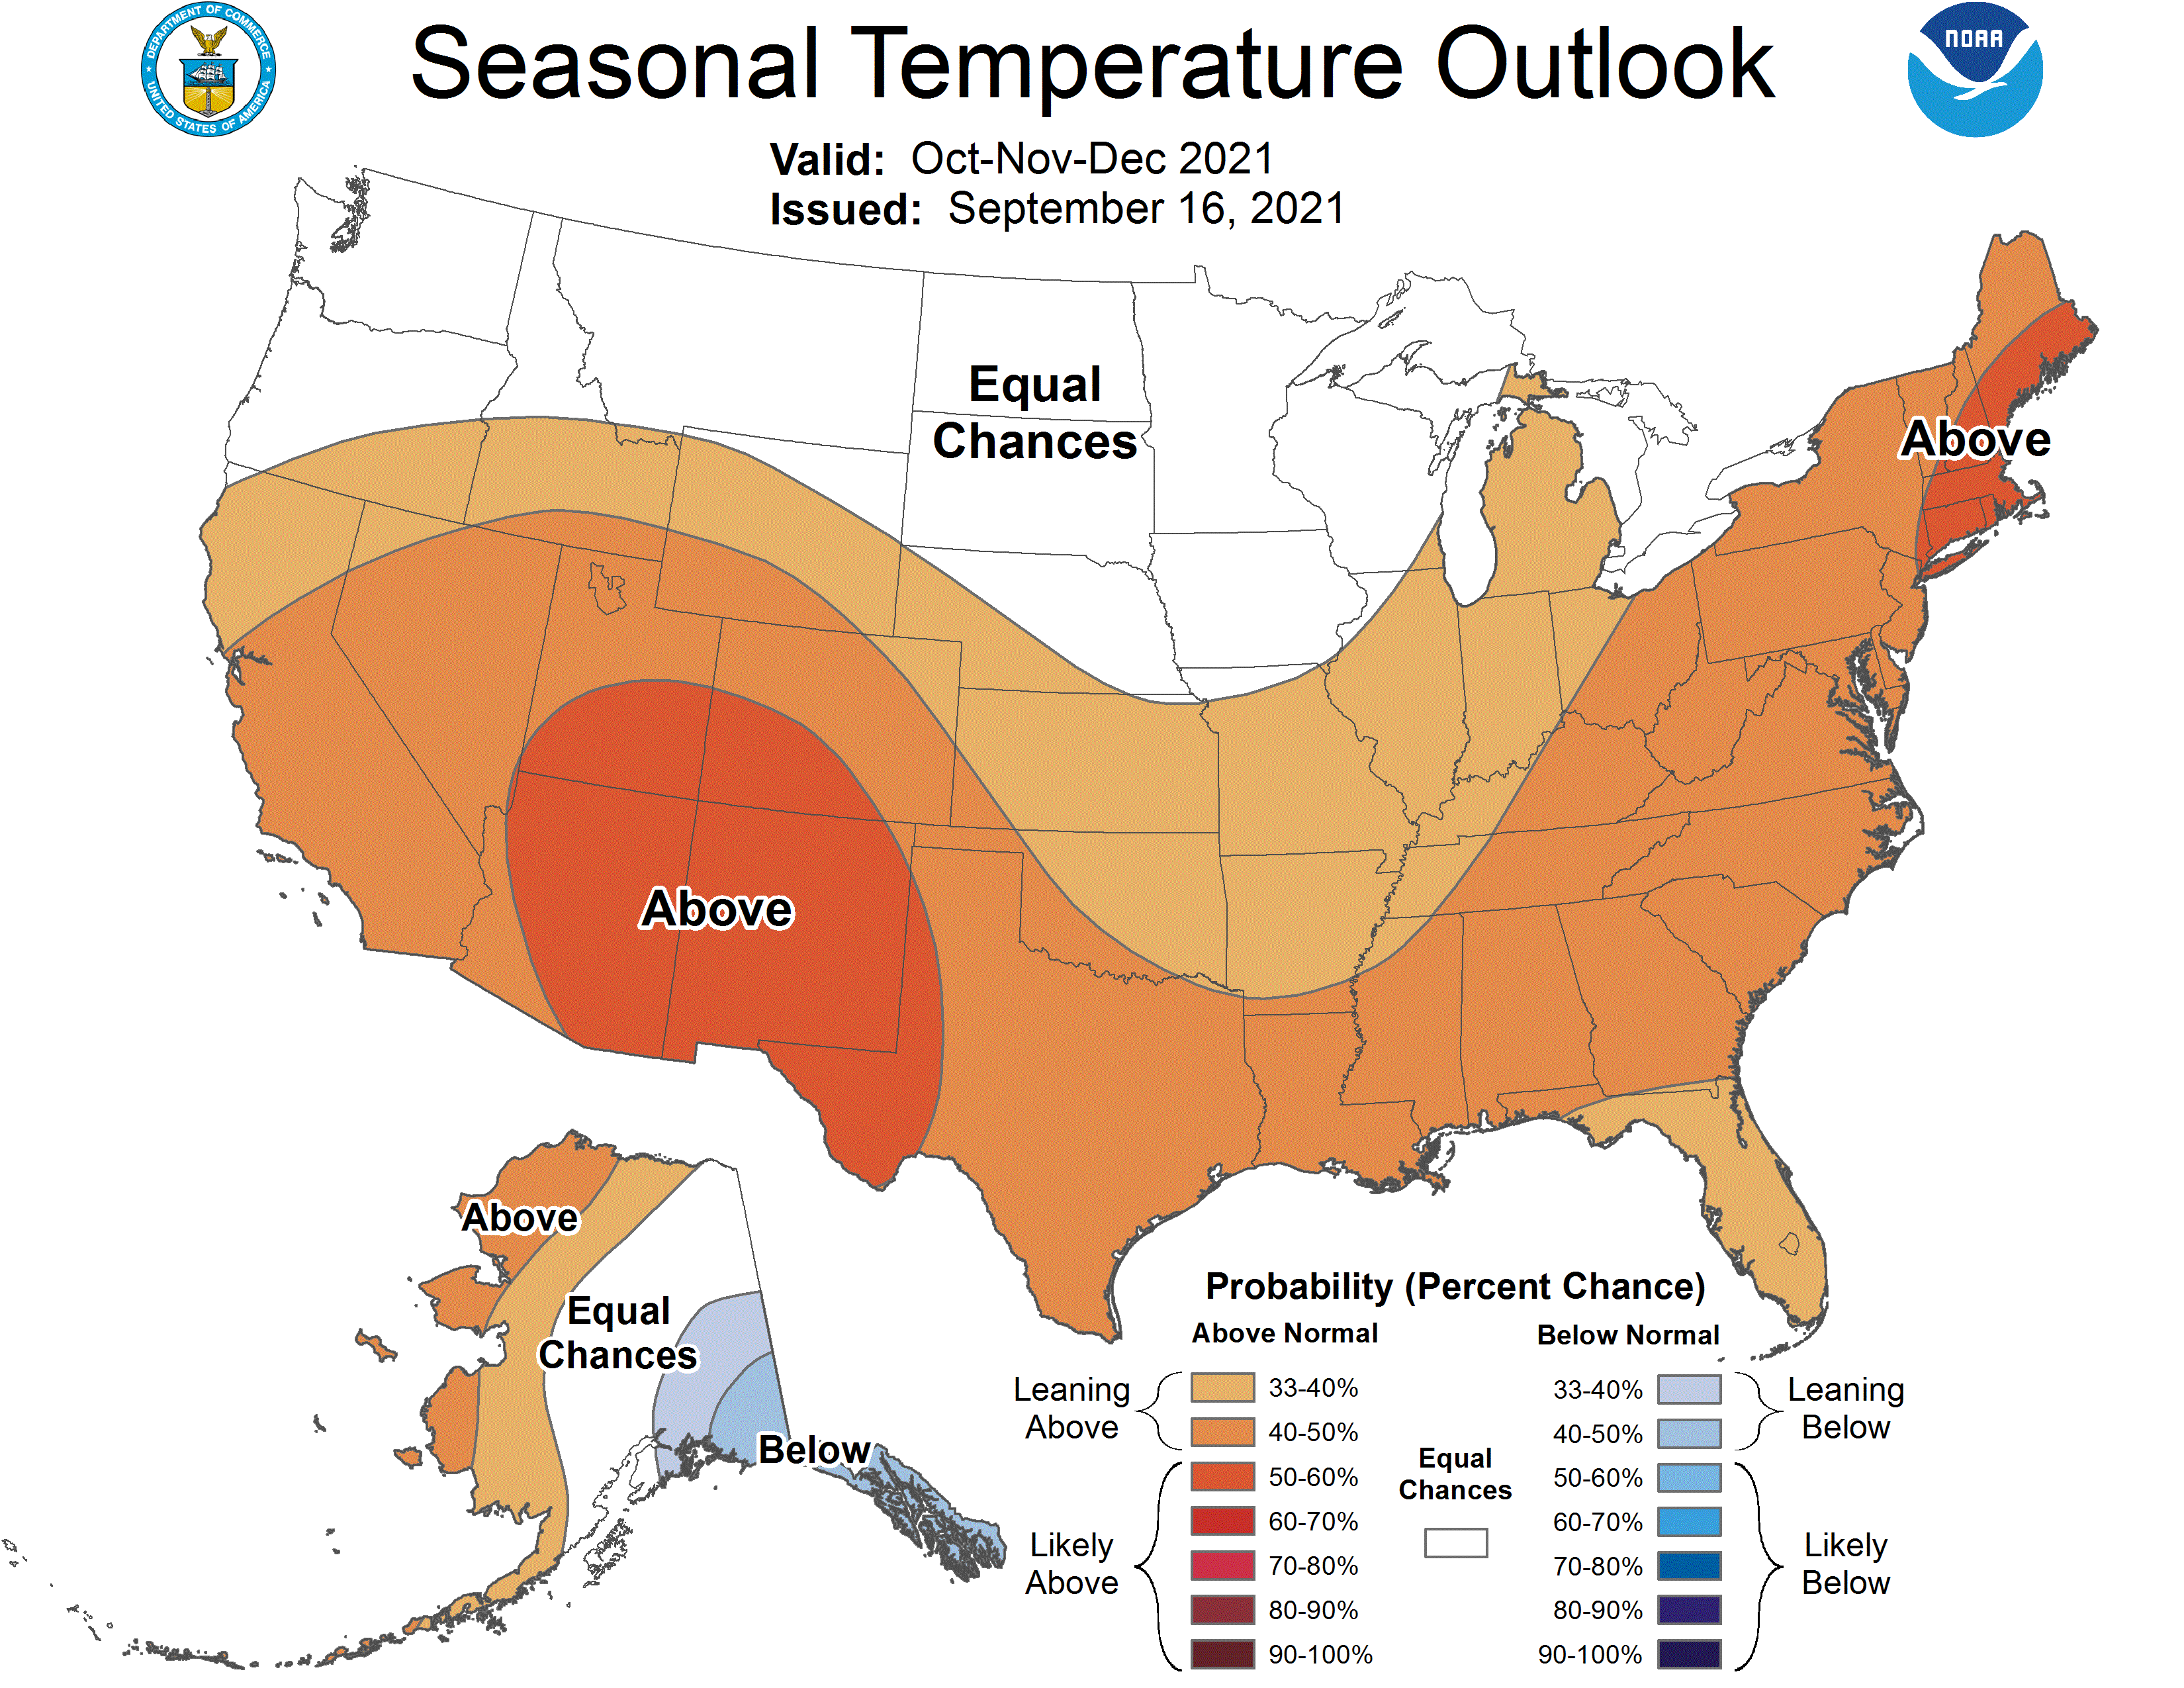
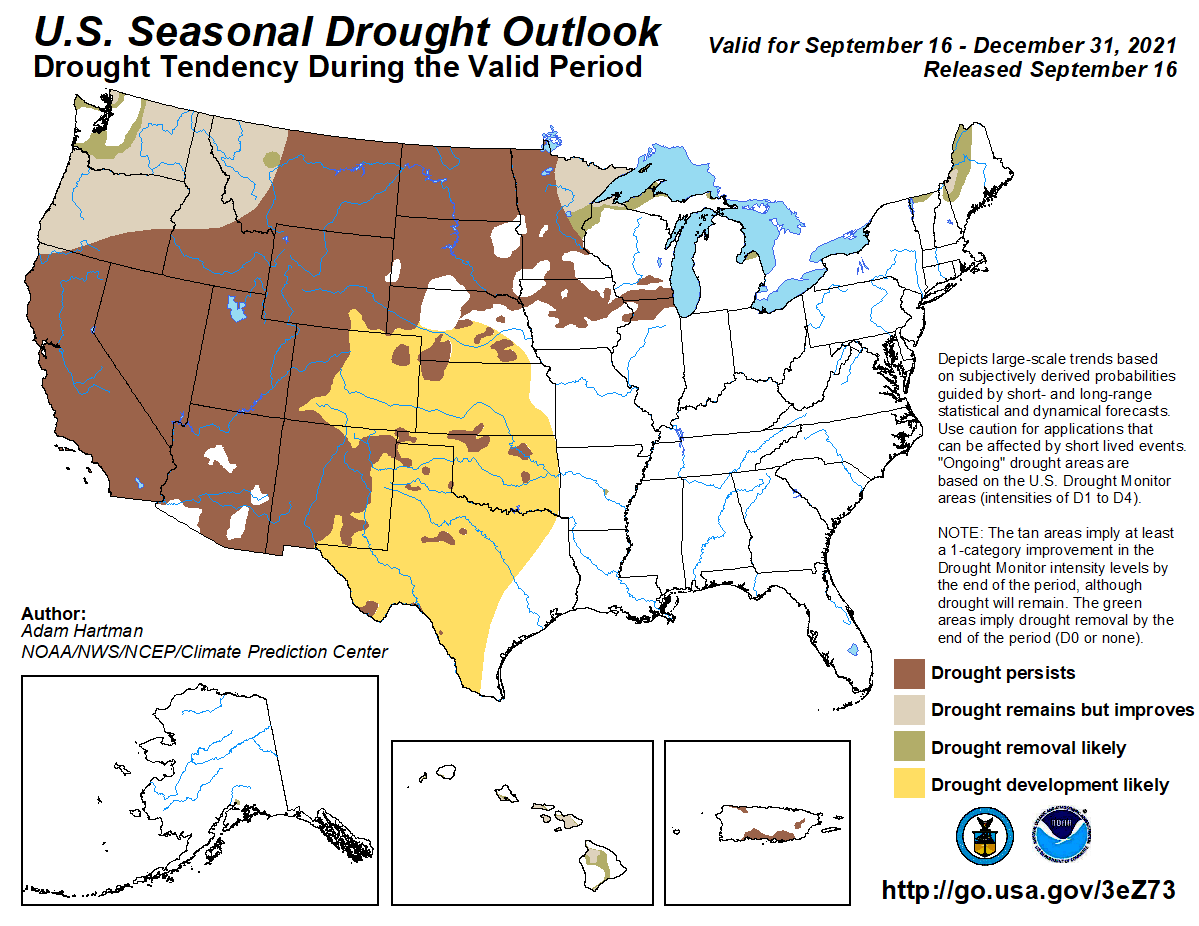
Looking ahead, the Climate Prediction Center anticipates precipitation leaning below average in Fall, and temperatures will likely be above average.
This Fall forecast supports drought persisting or worsening into 2022.
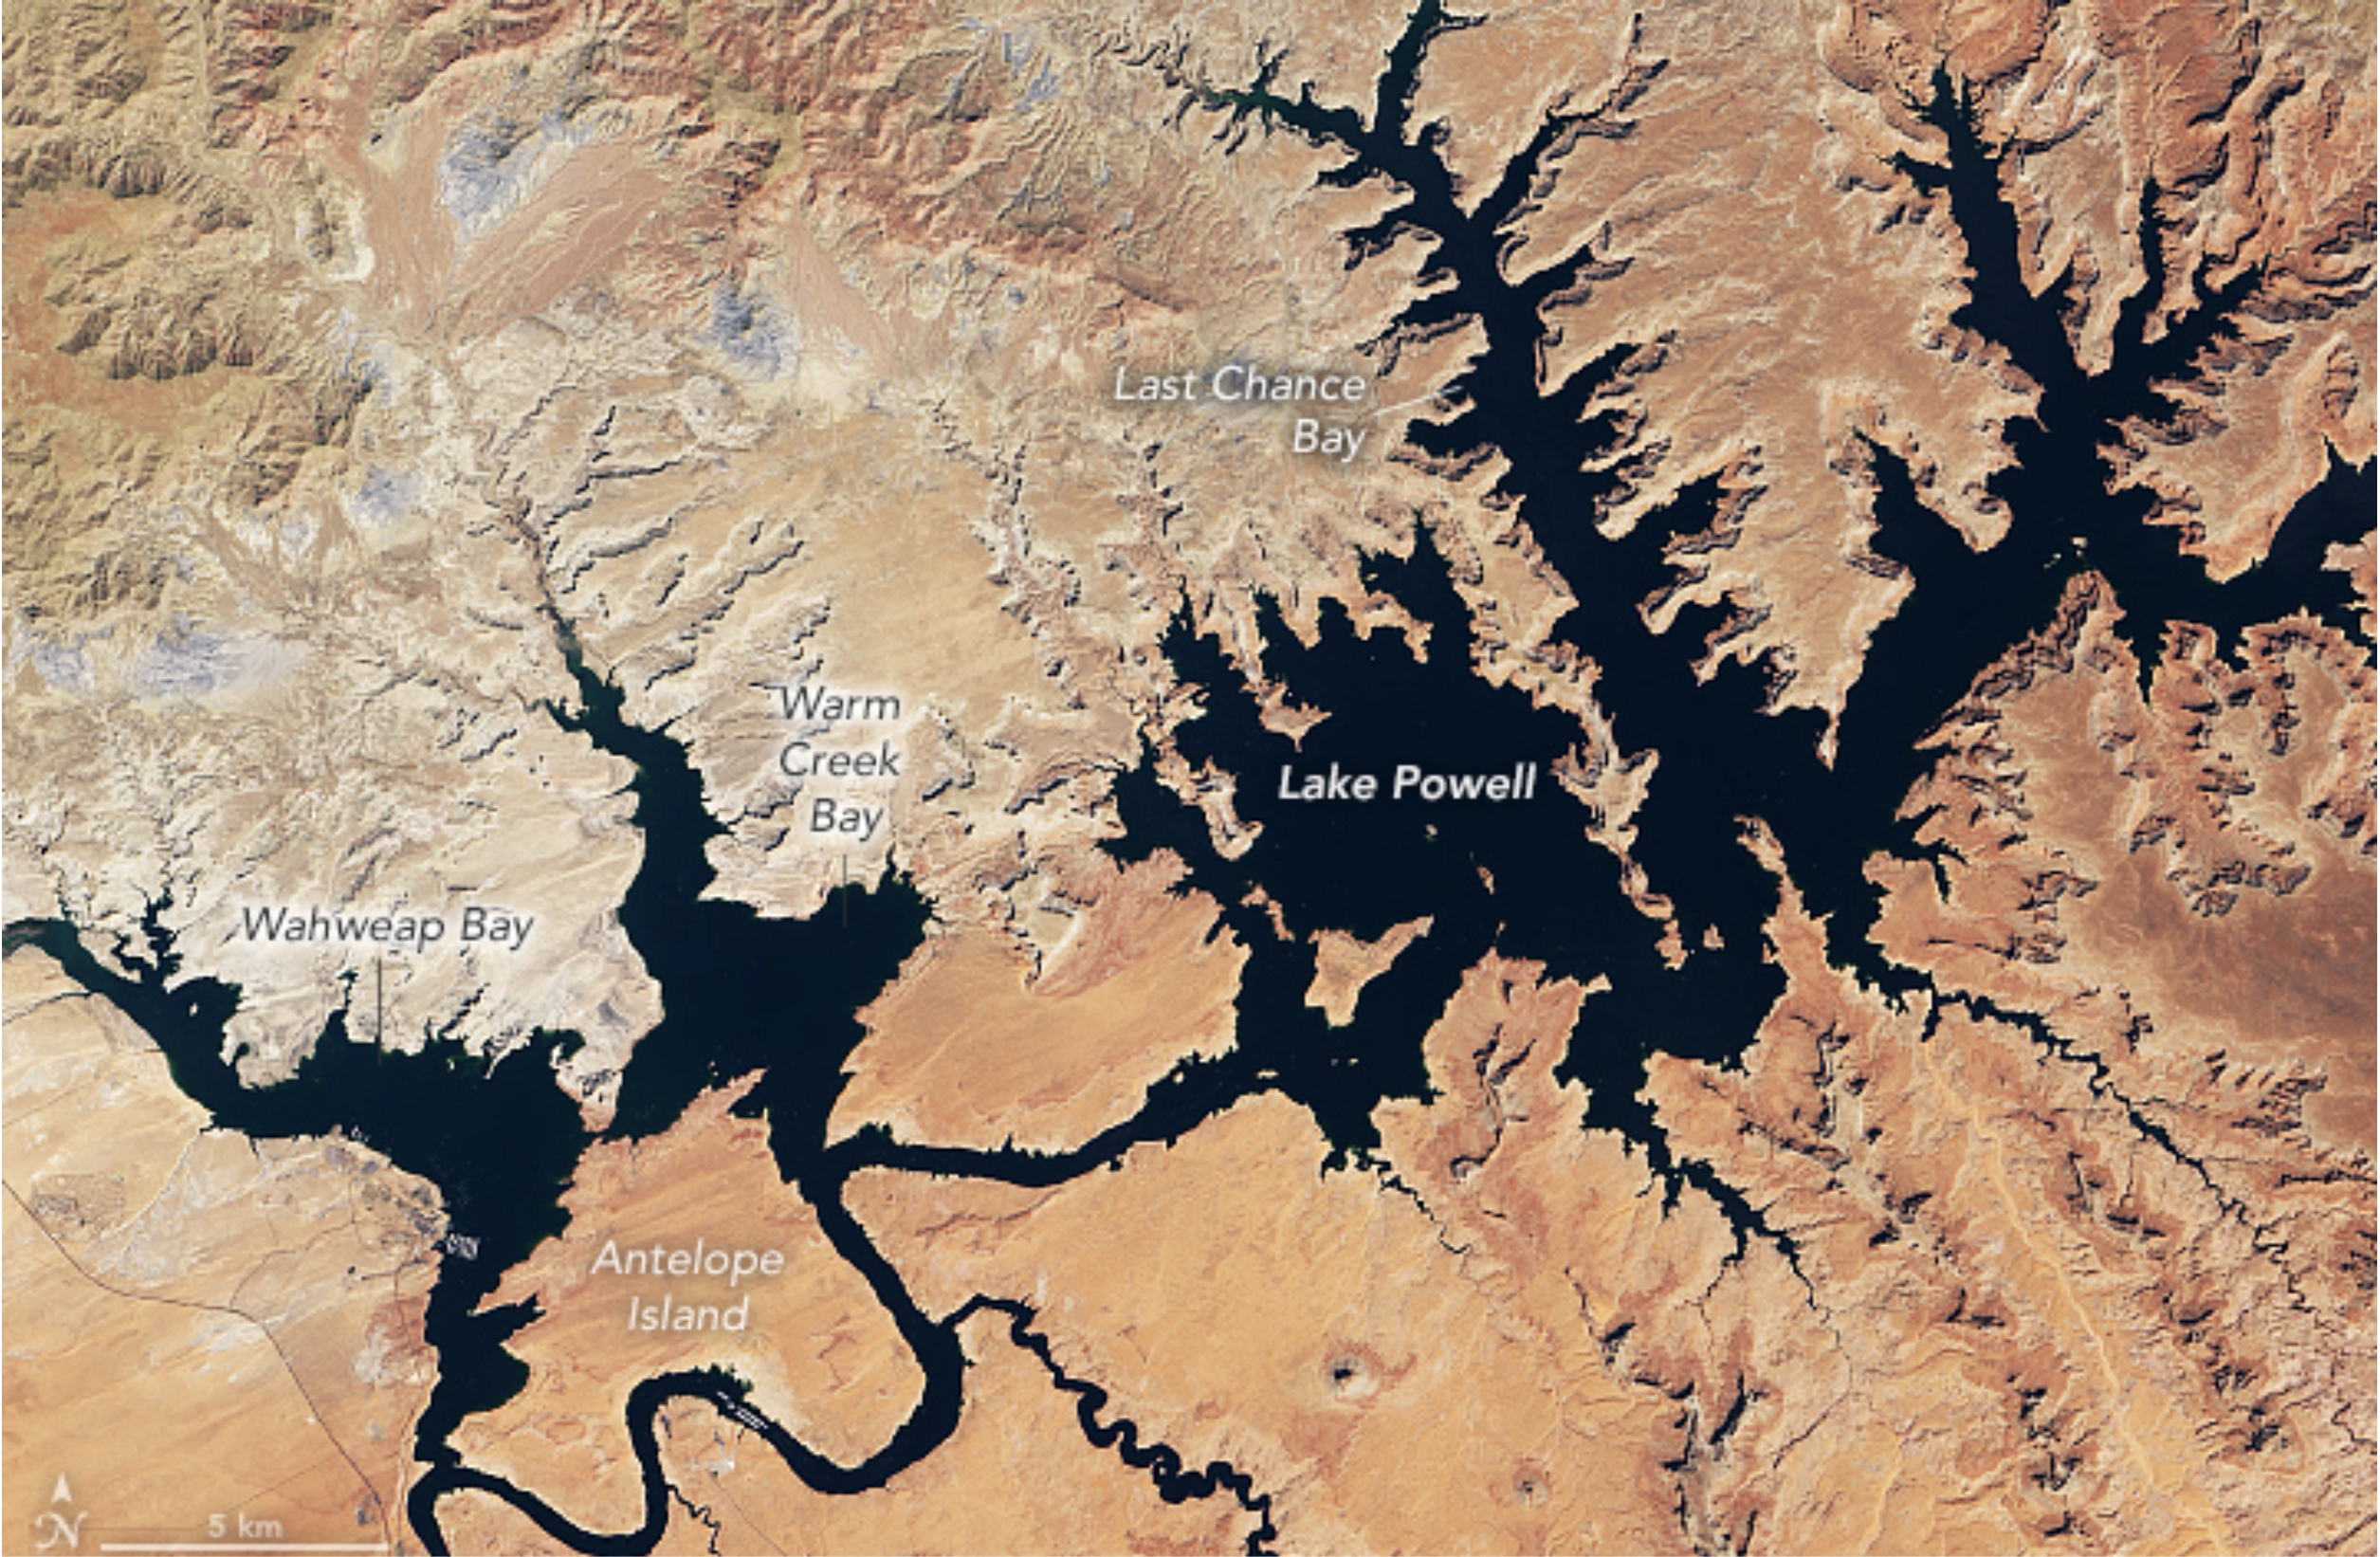
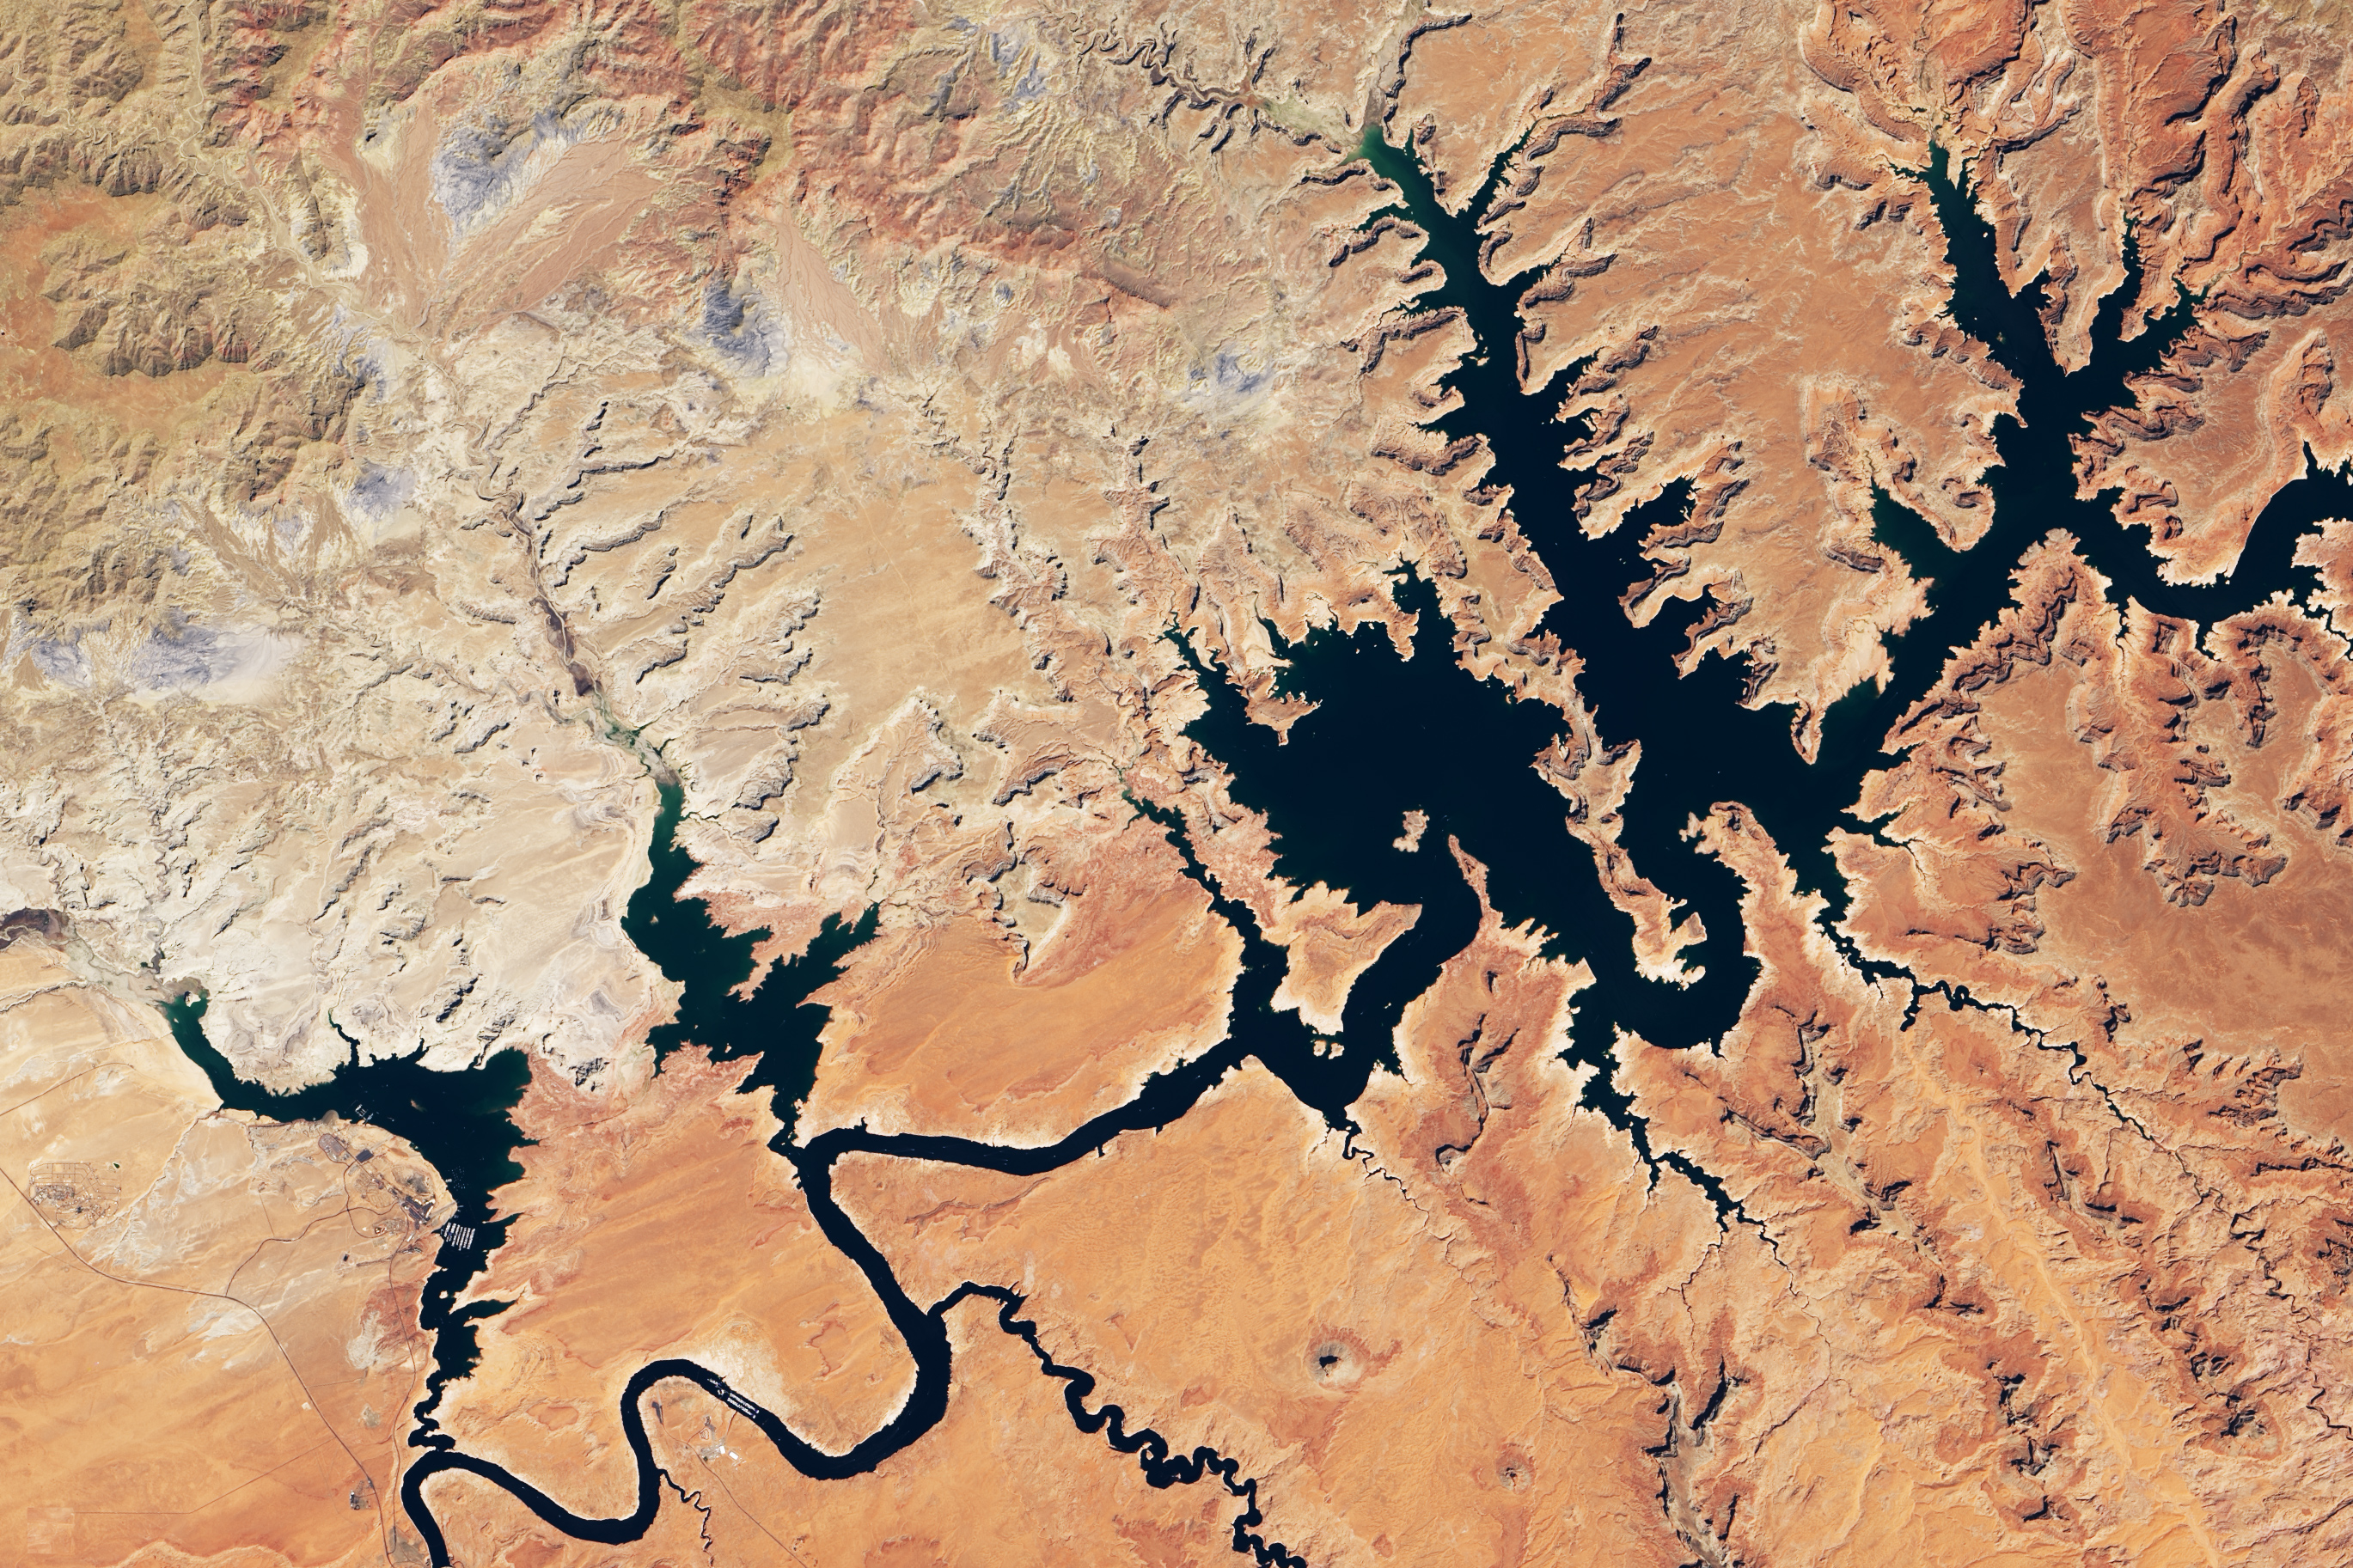
NASA Earth Observatory images by Lauren Dauphin, using Landsat data from the U.S. Geological Survey and lake elevation data from the Bureau of Reclamation. Story by Michael Carlowicz.Lake Powell September 1, 2017. Photo credit: NASA
As North America approaches the end of the 2021 water year, the two largest reservoirs in the United States stand at their lowest levels since they were first filled. After two years of intense drought and two decades of long-term drought in the American Southwest, government water managers have been forced to reconsider how supplies will be portioned out in the 2022 water year.
Straddling the border of southeastern Utah and northeastern Arizona, Lake Powell is the second largest reservoir by capacity in the United States. In July 2021, water levels on the lake fell to the lowest point since 1969 and have continued dropping. As of September 20, 2021, the water elevation at Glen Canyon Dam was 3,546.93 feet, more than 153 feet below “full pool” (elevation 3,700 feet). The lake held just 30 percent of its capacity. To compensate, federal managers started releasing water from upstream reservoirs to help keep Lake Powell from dropping below a threshold that threatens hydropower equipment at the dam.
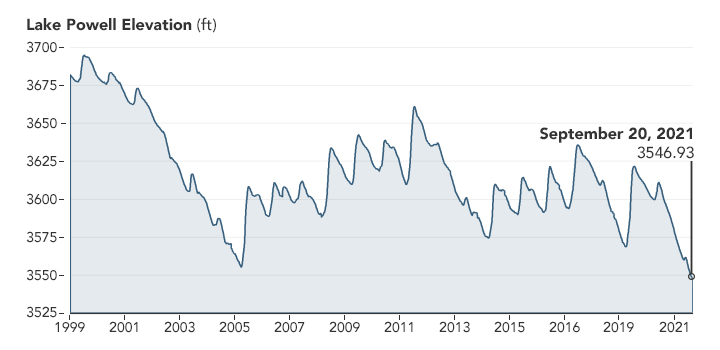
The natural-color images above show Lake Powell in the late summer of 2017 and 2021, as observed by the Operational Land Imager on Landsat 8. The September 2017 image was chosen because it represents the highest water level (3,630.76 feet) from the past decade. The line plot below shows water levels since 1999, when Lake Powell approached 94 percent capacity.
Lake Powell elevation 1999 – 2021. Graphic credit: NASA
Downstream in the Colorado River water management system, Lake Mead is filled to just 35 percent of capacity. More than 94 percent of the land area across nine western states is now affected by some level of drought, according to the September 23 report from the U.S. Drought Monitor.
In an announcement on September 22, the U.S. Bureau of Reclamation (USBR) explained that updated hydrological models for the next five years “show continued elevated risk of Lake Powell and Lake Mead reaching critically-low elevations as a result of the historic drought and low-runoff conditions in the Colorado River Basin. At Lake Powell, the projections indicate the potential of falling below minimum power pool as early as July 2022 should extremely dry hydrology continue into next year.” Minimum power pool refers to an elevation—3,490 feet—that water levels must remain above to keep the dam’s hydropower turbines working properly.
With the entire Lower Colorado River water storage system at 39 percent of capacity, the Bureau of Reclamation recently announced that water allocations in the U.S. Southwest would be cut over the next year. “Given ongoing historic drought and low runoff conditions in the Colorado River Basin, downstream releases from Glen Canyon Dam and Hoover Dam will be reduced in 2022 due to declining reservoir levels,” the USBR statement said. “In the Lower Basin the reductions represent the first “shortage” declaration—demonstrating the severity of the drought and low reservoir conditions.”
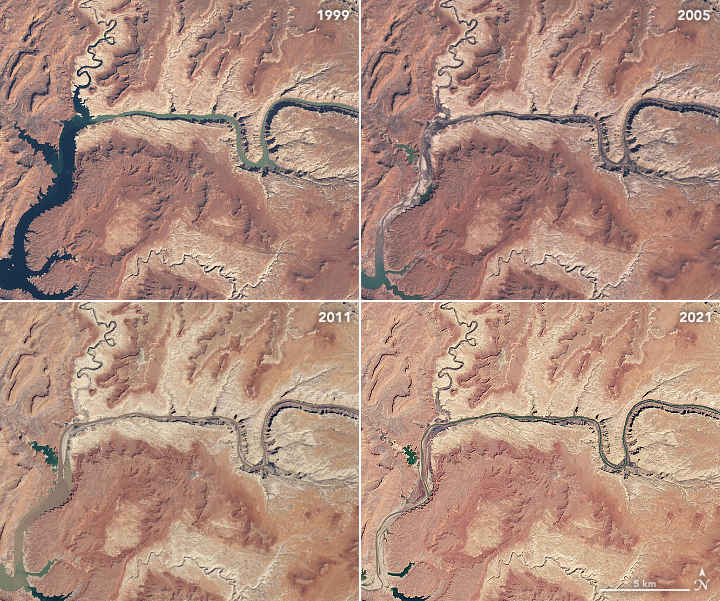
The natural-color images above were acquired in March 1999, April 2005, May 2011, and April 2021 by the Landsat 5, 7, and 8 satellites. Springtime typically marks the lowest water levels before mountaintop snow starts to melt and run down into the watershed. The images capture years with the two highest and lowest levels over the past 22 years. (For a year-by-year view, see the Earth Observatory feature World of Change: Water Level in Lake Powell.)
The Colorado River basin is managed to provide water to millions of people—most notably the cities of San Diego, Las Vegas, Phoenix, and Los Angeles—and 4 to 5 million acres of farmland in the U.S. and Mexico. Water is allotted through laws like the 1922 Colorado River Compact and by a recent drought contingency plan announced in 2019.
In a report and op-ed released on September 22, members of a NOAA Drought Task Force offered some context for the low water levels across the region. “Successive dry winter seasons in 2019-2020 and 2020-2021, together with a failed 2020 summer southwestern monsoon, led precipitation totals since January 2020 to be the lowest on record since at least 1895 over the entirety of the Southwest. At the same time, temperatures across the six states considered in the report (Arizona, California, Colorado, Nevada, New Mexico and Utah) were at their third highest on record. Together, the exceptionally low precipitation and warm temperatures reduced snowpack and increased evaporation of soil moisture, leading to a persistent and widespread drought over most of the American West.“
Redistricting Commissioner Simon Tafoya’s proposed 3rd Congressional District boundary deserves strong consideration
On Aug. 17, 1962, President John F. Kennedy spoke to a capacity crowd at Pueblo’s Dutch Clark Stadium.
“I don’t think there is any more valuable lesson for a President or Member of the House and Senate than to fly as we have flown today over some of the bleakest land in the United States and then to come to a river and see what grows next to it, and come to this city and come to this town and come to this platform and know how vitally important water is.”
Kennedy had traveled to Pueblo to announce the Fryingpan-Arkansas project, an enormous trans-mountain project to divert Western Slope water to the Arkansas River basin. In all, it required six storage dams, 17 diversion dams and structures, hundreds of miles of combined canals, conduits, tunnels and transmission lines, and two power plants, switchyards and substations. The project took 10 years for authorization, spark-plugged throughout by Colorado’s powerful 4th District Congressman Wayne [Aspinall], a Palisade Democrat, and another 20 years to construct.
“This is a national responsibility,” Kennedy said in 1962. “When Theodore Roosevelt became President after being Vice President, the leader of his state said, ‘my God, they have put that cowboy in the White House.’ Well, because he had been a cowboy in North Dakota, and had spent some of the most significant years of his life there, he became committed to the development of the resources of the West, and every citizen who lives in the West owes Theodore Roosevelt, that cowboy, a debt of obligation.”
These words uttered by one of this country’s most-iconic leaders, delivered in a football stadium in the heart of Colorado’s 3 rd Congressional District, are as prescient now as they were nearly 60 years ago.
Consider the Colorado River Compact, a 1922 agreement among seven U.S. states within the Colorado River basin governing the allocation of the water rights among the parties to the compact. It serves to this day as a foundational document in water law.
Colorado transmountain diversions via the State Engineer’s office
Or the Colorado-Big Thompson Project, the largest trans mountain diversion project in the state, which annually delivers some 213,000 acre-feet of water from the headwaters of the Colorado River to the South Platte River Basin.
Then there’s Dillon Reservoir and the Harold Roberts Tunnel, which delivers Colorado River headwaters to the North Fork of the Platte River to serve a thirsty Denver metro area.
The list goes on.
The point is, past projects to divert and share water have been expensive, generational endeavors involving participation and coordination, arm-twisting and teeth gnashing, among all manner of federal, state and local officials. And the fights over Colorado’s headwaters will only gain in importance over the coming decades, as global climate change influences our weather and thirsty citizens clamor for their piece of a dwindling pie.
In pondering the boundaries of a 3rd Congressional District that must by nature encompass nearly half of Colorado’s land area; water policy is the one, clear, universal “community of interest” that has historically impacted the entire area, continues to do so today, and will continue to do so well into the future.
In this context, I urge the Commission to give its utmost consideration to Commissioner Simon Tafoya’s redistricting plan, illustrated in the “P.005.Tafoya” map submitted Sept. 13, 2021.
Tafoya’s plan is the only one among the 120-or-so I have reviewed and continually reported on that puts this vital community of interest front and center in constructing the boundaries of the 3rd District.
It seems like the kind of plan that would have brought the rousing support of a young president from Massachusetts, a powerful Congressman from Palisade, and “that cowboy from South Dakota.”
It is a nod to our region’s past and a powerful recognition of our inevitable future.
Americans are becoming painfully aware that U.S. energy grids are vulnerable to extreme weather events. Hurricanes in the east, wildfires in the west, ice storms, floods and even landslides can trigger widespread power shortages. And climate change is likely making many of these extreme events more frequent, more severe or both.
As a long-time researcher of the electric utility industry, I’ve noticed that the U.S. tends to treat extended power cuts from natural disasters as an unfortunate fact of life. Even in states like Pennsylvania, where I live, that aren’t typically in the path of major tropical storms, a surprising amount of energy infrastructure is potentially vulnerable to extreme weather.
But in my view, major energy disruptions are not inevitable consequences beyond our control. Rather, the rising number of large weather-related blackouts in recent years shows that utilities, regulators and government agencies aren’t planning for these events in the right way. What’s needed is an understanding that extreme weather events are fundamentally different from other kinds of power blackouts, and that resilience is not just about the grid itself, but also the people that it serves.
How power companies plan for disasters
In most areas of the U.S., power grids tend not to fail unless they are pushed really hard. Utilities have built a tremendous amount of redundancy into energy delivery systems – extra generating capacity and transmission lines that can get electricity to customers if part of the system fails. That’s the right approach if major threats are things like equipment overloads on very hot days, or random equipment failures that could cascade into much bigger problems.
Utilities and regulators have planned grid design around these kinds of failures for decades. And for the most part, this approach has worked well. Truly severe power outages from causes other than extreme weather don’t happen very often in the U.S. The last really big one, on Aug. 14-15, 2003, affected some 50 million people across the U.S. Northeast and Midwest and southern Canada.
Redundancy is a good strategy for keeping the grid stable following an unexpected malfunction of one or two pieces of equipment. It also allows utilities to do more of what they are good at – building, maintaining and operating power grid infrastructure.
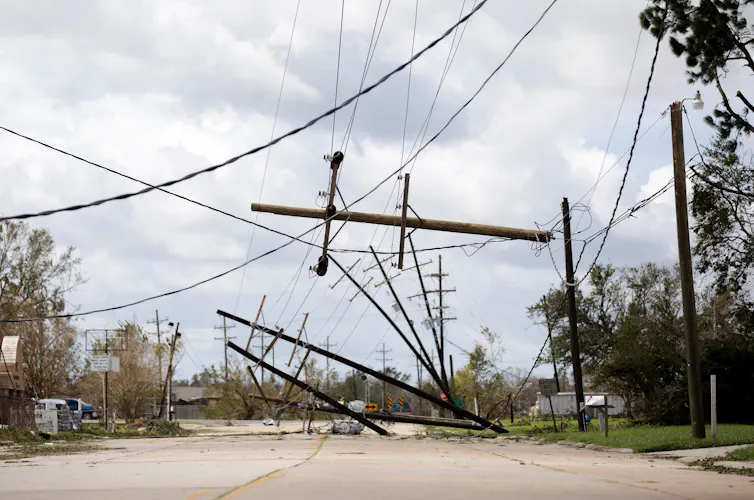
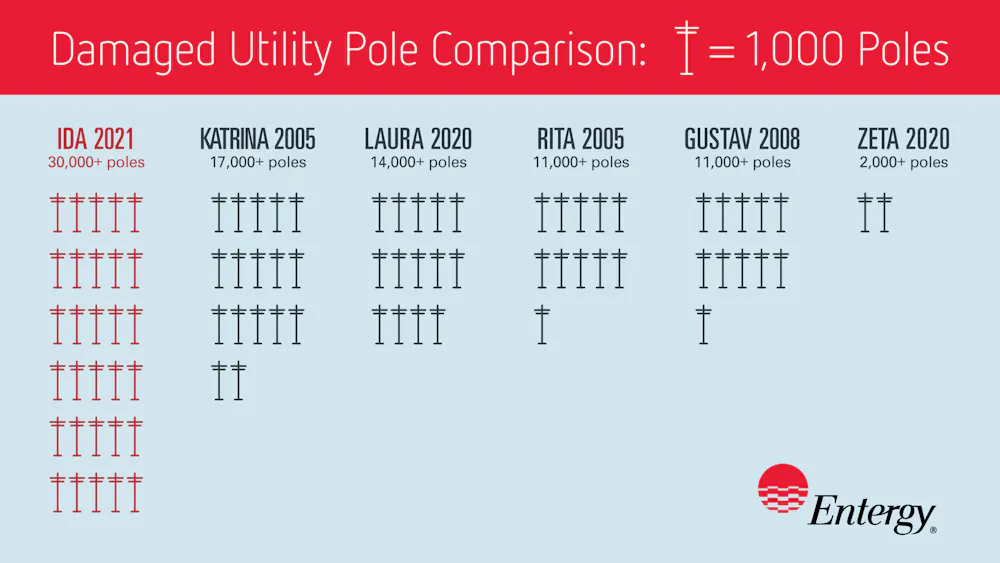
But in the face of extreme weather events, the system needs a different kind of redundancy. Building more equipment in vulnerable places won’t keep the lights on if the entire area is hit by a disruptive event all at once. In Louisiana, Hurricane Ida was so fierce that it took down multiple power transmission lines that feed electricity into New Orleans and surrounding parishes. Some of this damaged infrastructure had been upgraded or put in place following previous severe storms.
Hurricane Ida took down nearly twice as many electric power distribution poles as Hurricane Katrina in 2005. Entergy
Rethinking resilience planning
Planning properly for resilience to extreme weather events requires doing some things differently.
First, it means realizing that a lot of equipment in the same place will be affected all at once. One reason that Ida led to such large blackouts in New Orleans was that some older transmission lines going into the city hadn’t been upgraded to withstand more severe weather, even though they ran beside new equipment.
Second, the goal should be to get people the services that they need, not necessarily to keep the grid up and running, which is very costly and just won’t be possible in all circumstances.
This means thinking about solutions outside of the traditional utility business model – for example, deploying lifeline systems such as solar panels, batteries or generators. This isn’t how utilities traditionally do business, but it will tide people over while power companies make large-scale grid repairs after storms.
Third, it’s time to acknowledge that the risks of extreme events are increasing faster than many utilities have been adapting their plans. For example, Pacific Gas and Electric in California has only recently incorporated wildfire risk into its transmission planning, and now is more seriously considering burying power lines.
Entergy, which serves much of the area hit hardest by Ida, has upgraded its transmission design standards so that newer lines can withstand higher winds. This is a useful step, but it did not prevent catastrophic power outages during a period of dangerously hot weather. Utilities and regulators still assume that the scale and likelihood of many weather-related risks has not changed in the past several decades. As climate change accelerates, utilities and regulators should be working to understand which risks are changing and how.
[Over 110,000 readers rely on The Conversation’s newsletter to understand the world.Sign up today.]
Some utilities, like those in New York, are learning from recent experiences with extreme weather events and trying to solve these problems. Con Edison, for example, has focused not only on restoration plans following extreme events, but has also tried to model and quantify the changing risks that it faces. Others, like those in Vermont and California, are weighing how they can achieve extreme-weather resilience as their grids become more dependent on renewables.
How much money to spend for resilient grids is a major question. What’s already clear is that building more, bigger infrastructure is not necessarily better.
Seth Blumsack, Professor of Energy and Environmental Economics and International Affairs, Penn State