Once an acequia commissioner and now a U.S. congresswoman, Leger Fernández knows how hard it is to tell farmers they won’t get all the water they need — or maybe none at all.
She talks about the annual limpia, or cleaning of acequias in preparation for planting season.
“There was always a sense of accomplishment but now what we’re witnessing is we can’t do it all the time anymore because we don’t have the water,” she said during a tour with acequia officials. “And what you all are facing is not of your making, right? But you are having to work through the struggle of making whatever water is available work for everybody in the community.”
Some earthen canals didn’t get a drop of water this year, another example of parched Western conditions. Like many parts of the world, the region has become warmer and drier over the last 30 years, mainly due to rising levels of carbon dioxide and other greenhouse gases resulting from the burning of coal, oil and natural gas development and transportation.
Boat docks are high and dry at reservoirs around New Mexico, and Lake Powell along the Utah-Arizona line has hit a record low this year. A key Northern California reservoir that helps water a quarter of U.S. crops is shrinking.
For mayordomos — those who oversee acequias and ensure equitable water distribution — it has become a scramble.
Less snow falls, and warmer temperatures melt it sooner. Dry soil soaks up runoff before it reaches streams and rivers that feed acequias.
Paula Garcia, New Mexico Acequia Association executive director, shuns the phrase “new normal” because she said that implies stability in weather patterns the community’s ditches rely on…
Federal water management policies have complicated matters as needs of cities and other users overshadow these Hispanic and Indigenous communities.
Their traditions are rooted in Moorish ingenuity first brought to Europe and then to North America via Spanish settlers. Those water-sharing ideas were blended with already sophisticated irrigation culture developed by Indigenous communities in what is now the southwestern U.S.
What developed were little slices of paradise, with gardens and orchards that have sustained communities for generations.
Roughly 640 New Mexico acequias still provide water to thousands of acres of farmland.
Darel Madrid, Rio Chama Acequia Association president, didn’t grow a garden this year. He wanted to lead by example…
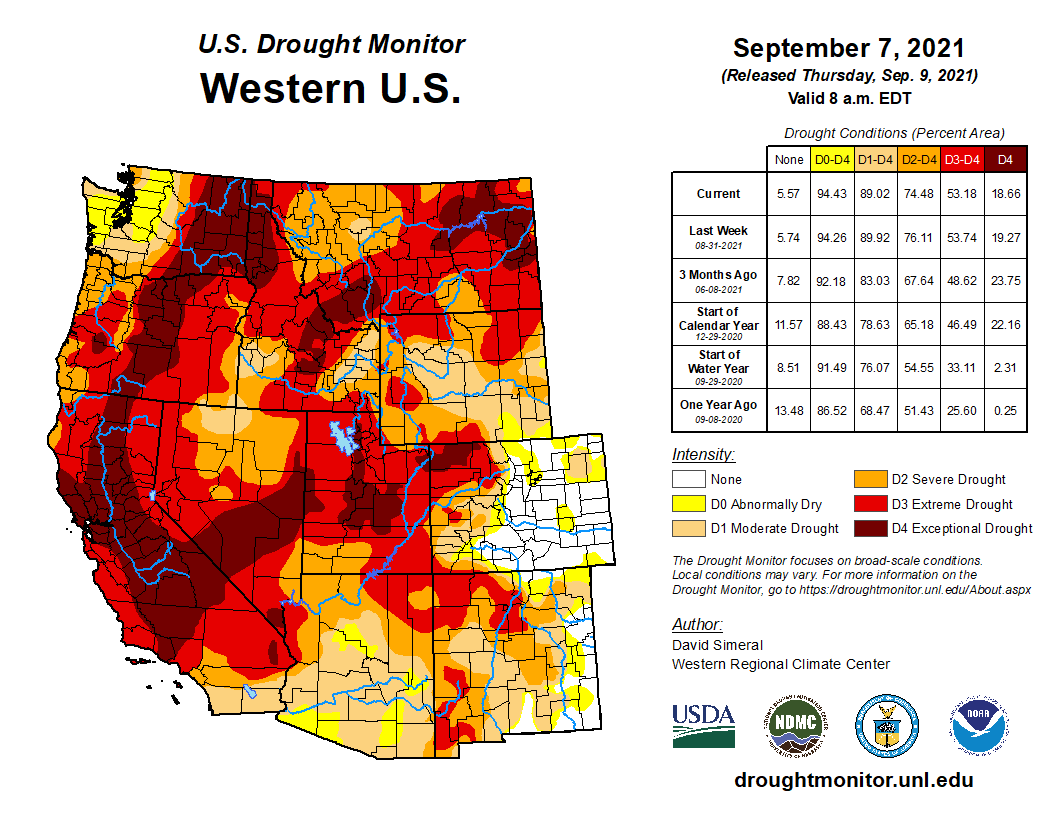
West Drought Monitor map September 7, 2021.
After back-to-back record dry summer rainy seasons, some Southwest areas enjoyed above average rain this year. But maps are still bleak, with nearly 99% of the West dealing with some form of drought…
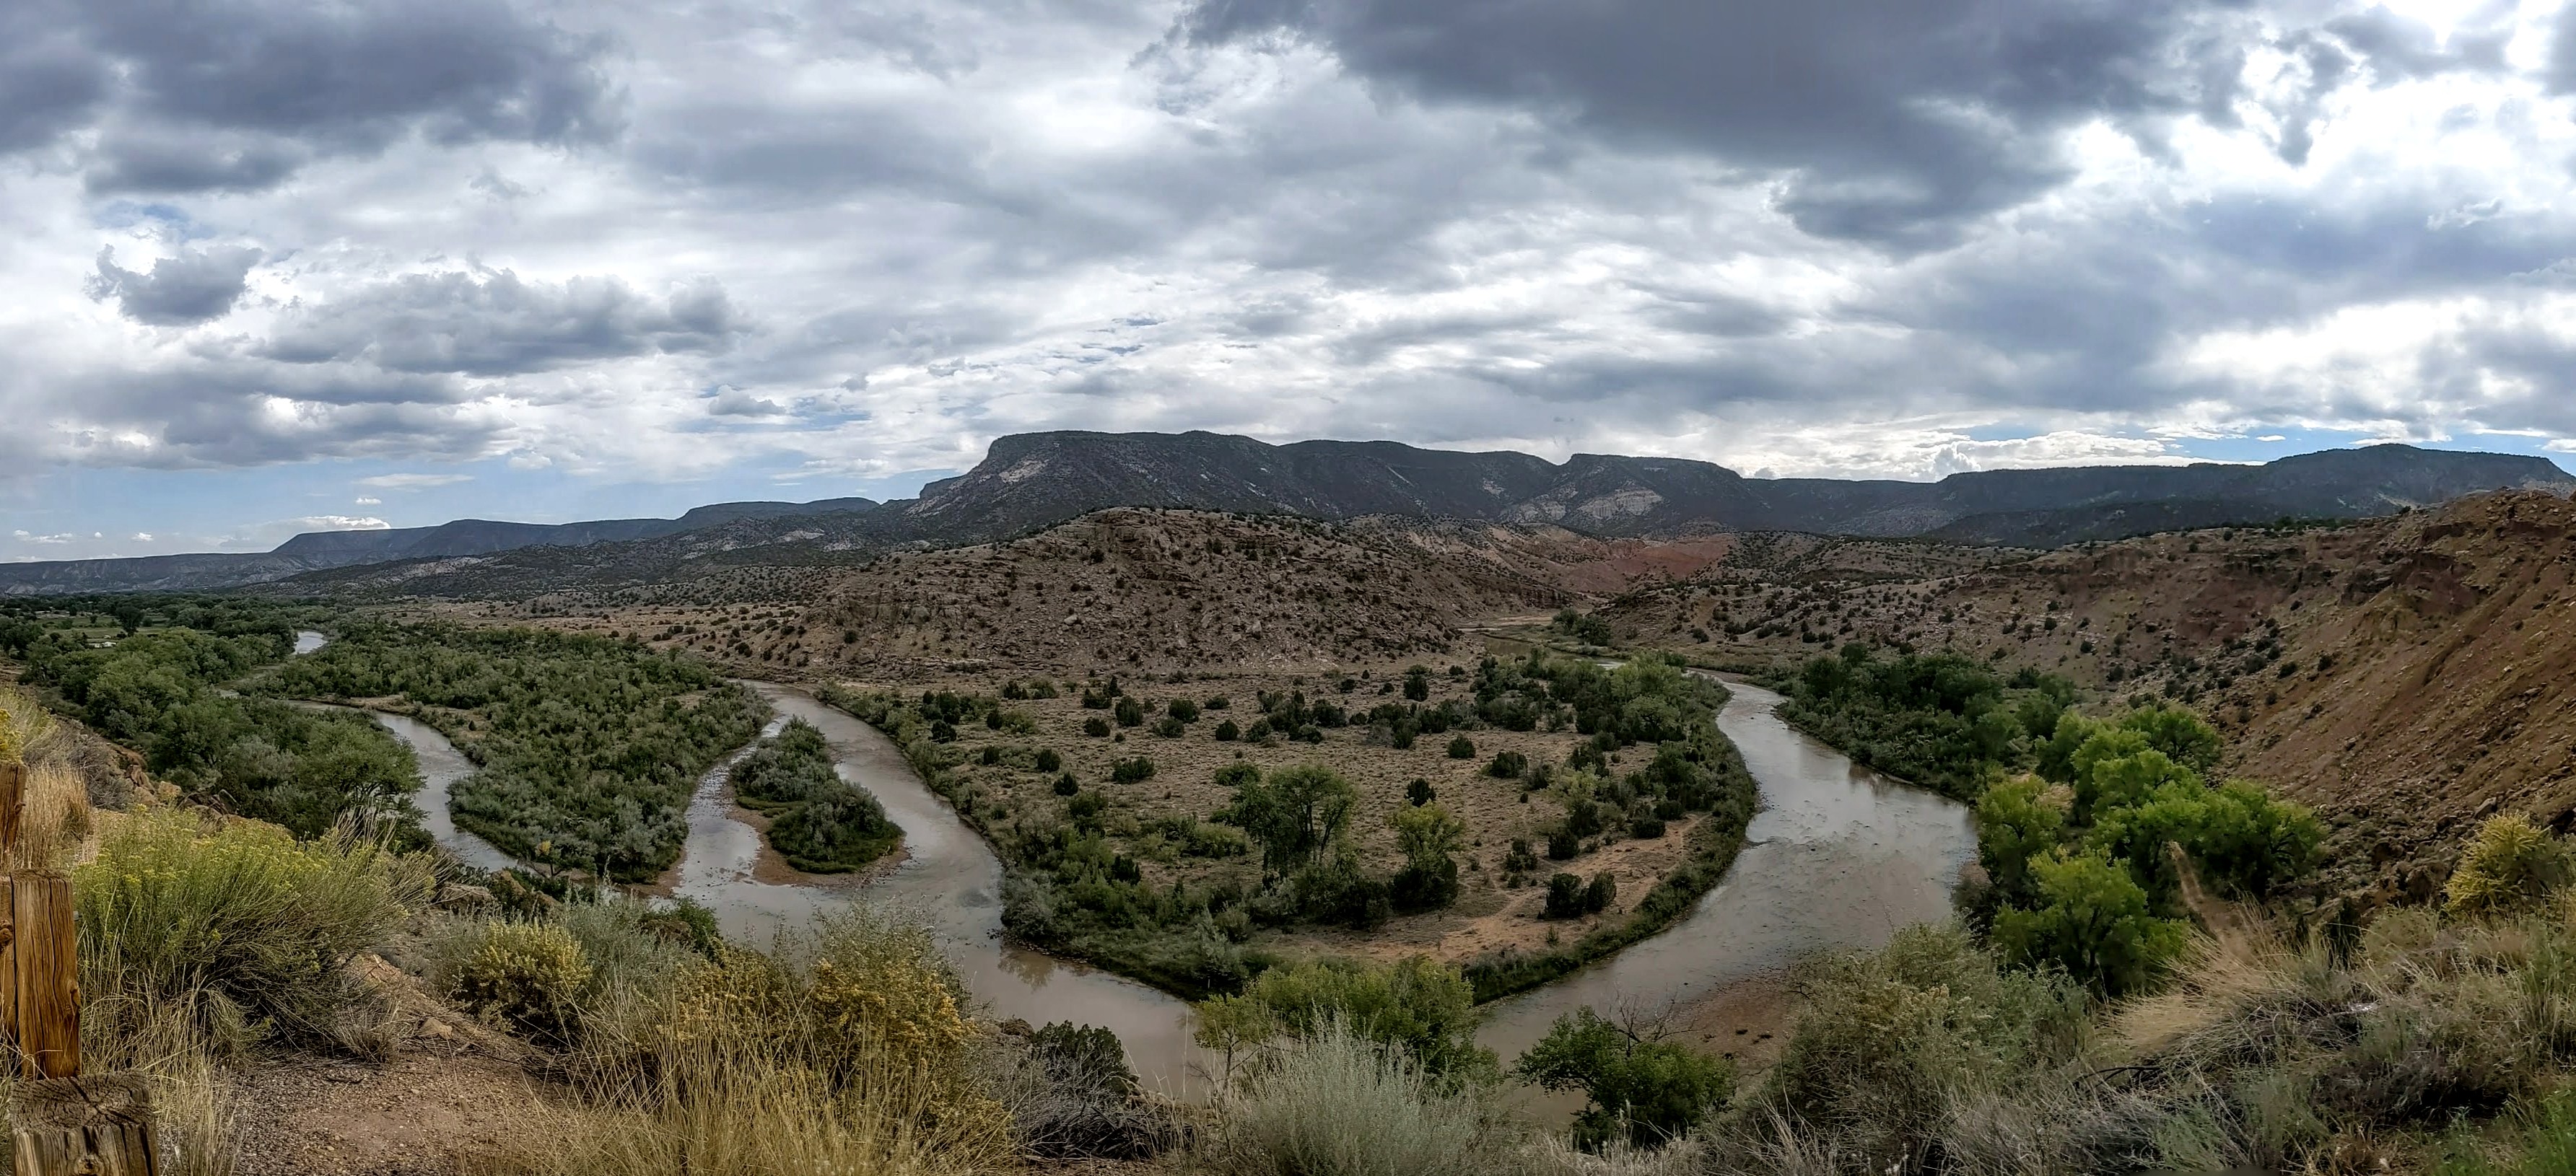
When water-sharing compacts involving some of New Mexico’s largest cities were first negotiated decades ago, Madrid said communities along Rio Chama were left out. Now, as supplies are scarce, acequias around Abiquiu have been forced to seek state funding to buy water from downstream users. If none is available, they go without.
As long as Rio Chama flows above 140 cubic feet per second, water can be diverted by acequias. The flow usually nosedives in May, and rationing starts when it drops below 50 cfs. Aside from isolated spikes from storm runoff, the flow is now less than half that.
Madrid said acequias would benefit from permanent water storage in an upstream reservoir, which would need federal approval…
Part of that means reimagining acequias without giving up the sense of community they command.
At Santa Cruz Farm, owner Don Bustos is growing crops in greenhouses in fall and winter when less water is needed and evaporation is reduced, he said.
In Taos, acequia leaders have bumped up annual cleaning to the fall so they don’t miss out on early runoff…
Acequias have overcome periodic environmental crises, rivalries among water users and profound historical changes, Spanish historian and anthropologist Luis Pablo Martínez Sanmartín noted in a 2020 research report. He said survival has hinged on a common-good design based on cooperation, respect, equity, transparency and negotiation.
A map of the Southern Ute Reservation and nearby reservations. By U.S. Census Bureau – U.S. Census Bureau: American FactFinder, a combination of two maps, Public Domain, https://commons.wikimedia.org/w/index.php?curid=3114932
Click here to read the newsletter. Here’s an excerpt:
The Southern Ute Indian Tribe (the Tribe) is taking public comment on their proposed water quality standards and certification procedures from August 23 to October 22, 2021. Although the standards apply only to Tribal Waters on lands where the tribe has jurisdiction, they can affect permits and licenses issued upstream by EPA, the Army Corps of Engineers, the Federal Energy Regulatory Commission, and/or the State of Colorado, on and off the reservation. Permitting and licensing entities must consider any possible impacts that could cause violations of standards downstream to Tribal Waters.
For several years, the Tribe has been developing its authority to set water quality standards within their reservation boundaries. In 2018, the Tribe was granted “Treatment as a State” (TAS) by the EPA to receive delegated authority for sections 303(c) and 401 of the Clean Water Act to set water quality standards and certify that those standards will not be violated under certain federal permits and licenses. They did not apply for any permitting or enforcement authority. This current step is part of the Tribe’s process to promulgate its initial water quality standards and certification procedures.
Documents related to the Tribe’s TAS application as well as the proposed standards and procedures can be found here and here. Comments can be emailed to SUIT’s Water Quality Standards Committee at wqs@southernute-nsn.gov. The Tribe will hold an online public hearing regarding the proposed standards on October 7th from 3:00 – 5:00pm. To pre-register, visit https://bit.ly/3wnzxAb.
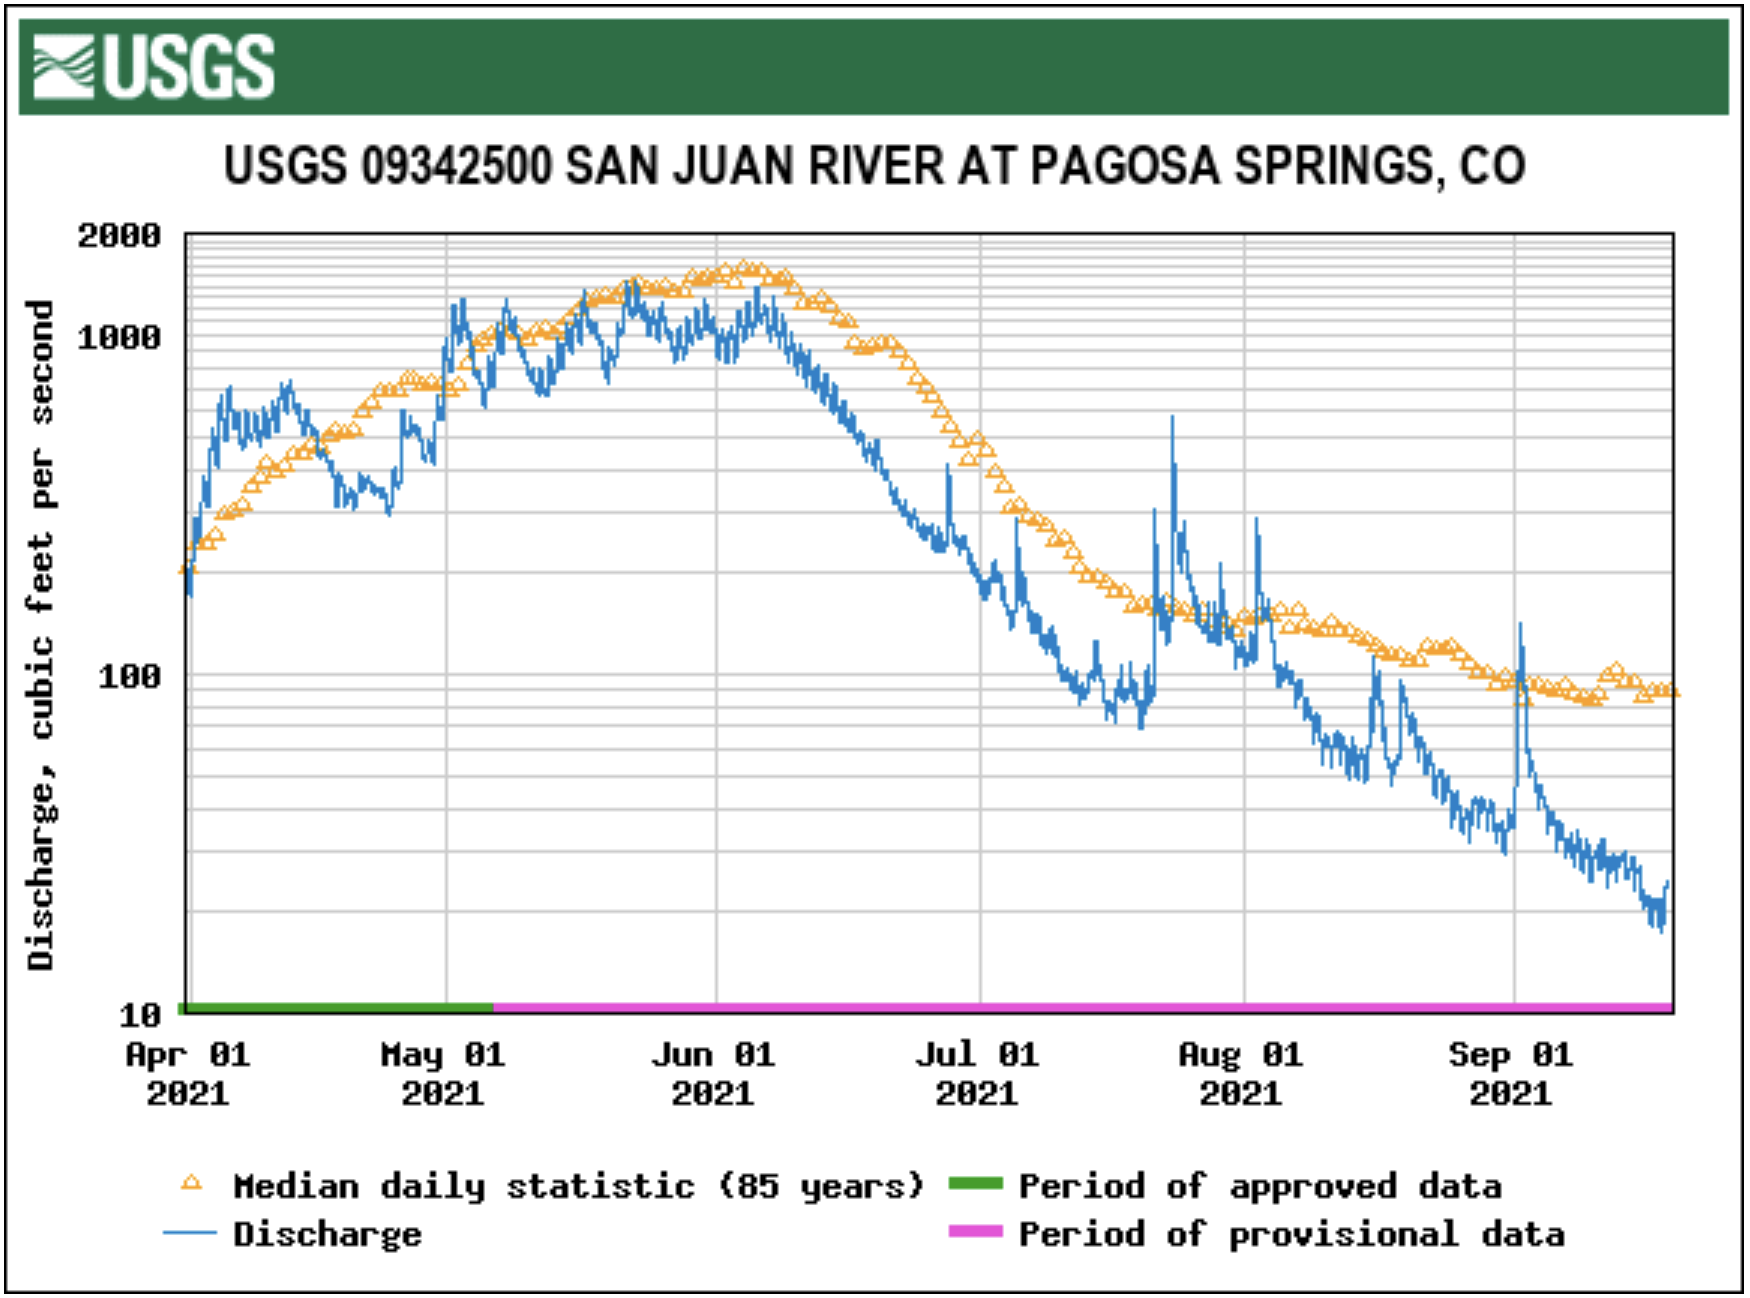
According to the U.S. Geological Survey (USGS), the San Juan River was flowing at a rate of 23.7 cfs in Pagosa Springs as of noon Wednesday, Sept. 15.
Based on 85 years of water re- cords at this site, the average flow rate for this date is 165 cfs.
The highest recorded rate for this date was in 1970 at 2,000 cfs. The lowest recorded rate was 13.5 cfs, recorded in 2018.
As of noon Wednesday, Sept. 15, the Piedra River near Arboles was flowing at a rate of 24 cfs.
Based on 58 years of water records at this site, the average flow rate for that date is 123 cfs.
The highest recorded rate for this date was 2,650 cfs in 1970. The lowest recorded rate was 13.3 cfs in 2002.
Colorado Drought Monitor map September 7, 2021.
Drought report
The National Integrated Drought Information System (NIDIS) was last updated on Sept. 7.
The NIDIS website indicates 95.27 percent of Archuleta County is abnormally dry, this is down slightly from the previous report of 95.29 percent.
The percentage of the county in a moderate drought remains at 67.47 percent, consistent with the previous report.
The NIDIS website also notes that 42.68 percent of the county is in a severe drought stage, which is up slightly from the previous report of 41.75 percent.
Additionally, the NIDIS website notes that 9.12 percent of the county remains in an extreme drought, mostly in the southwestern portion of the county, consistent with the previous report.
The NIDIS website notes that under an extreme drought stage, large fires may develop and pasture conditions worsen.
No portion of the county is in an exceptional drought.
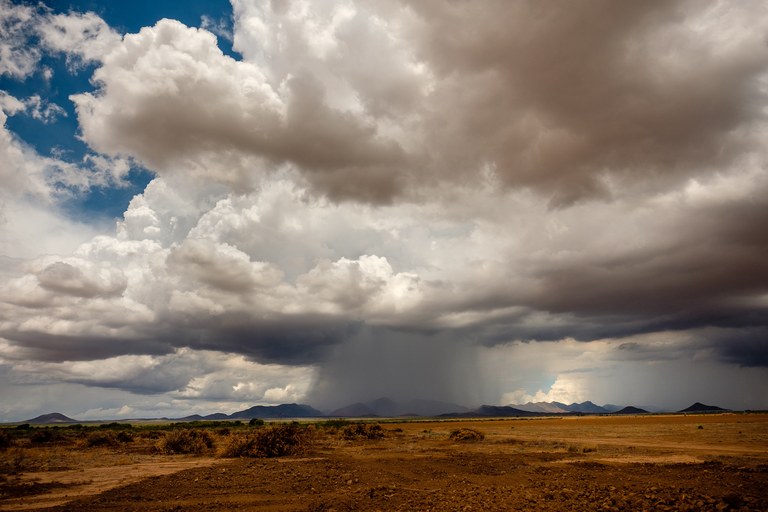
Monsoon storm near Tucson 2021. Image credit: Roberto (Bear) Guerra/High Country News
FromThe High Country News (Jessica Kutz, September 17, 2021):
When I moved to Tucson from western Colorado in the fall of 2019, I knew the weather would be warmer than I was used to. But the summer that followed turned out to be the hottest on record. I waited for the promised monsoon to cool things down, but that relief never came. Instead, I sweltered in my swamp-cooled duplex.
Then, in mid-June this year, the monsoon season finally began. When the first rains hit, my partner, a Tucson resident for more than a decade, ran out into the street in our neighborhood to frolic in the torrent. As he pranced under dim streetlights, I worried that this storm would be like last year’s — the only rain of the season. What if it was the last monsoon ever? Given our increasingly unpredictable world, I decided to embrace the moment. I ran out, letting the rain soak through my clothes as a rush of water stormed down the street, my feet and ankles submerged in a dirty deluge.
By July, the rain was making regular appearances. It was around that time that I first read about the Southwest Monsoon Fantasy Forecasts, an online game where people cast their monsoon predictions. That month turned out to be the wettest on record. It rained 8 inches in Tucson — the largest amount since the city started keeping track in the 1890s — a tremendous amount compared to the previous year’s 1.62 inches, and even to the yearly average, which is around 6 inches. Intrigued by how erratic the seasons seemed to be — and delighted by the prospect of winning a $400 backyard weather station that could track everything from wind speed to solar radiation — I decided to give the fantasy forecast a try.
I created a username, joining the ranks of other amateur forecasters with imaginative monikers like “mesquite nerd” and “weather geek.” It was easy to log my guess for the month of August. Each city has its own page, with a bar graph depicting the median and mean rain totals, giving a sense of the usual rainfall. I moved a thick yellow line across the graph, contemplating my best estimates for El Paso, Flagstaff, Tucson, Phoenix and Albuquerque. Should I move the line closer to the right, showing how much I hoped for more rain? Or settle for a more conservative estimate? I imagined other weather enthusiasts across the West doing the same, attempting to make sense of a seasonal weather pattern that doesn’t seem to make sense much. I fiddled with my calculations for August and eventually settled on 1.8 inches, the median guess for Tucson. I didn’t believe our monsoon luck would continue past July.
But August surpassed expectations again, with nearly 4 inches of rain. I was off, badly off, with my conservative estimate. It was worth it, though: The Tucson Mountains suddenly looked like a scene from Jurassic Park, with rocky slopes giving way to verdant valleys. What was brown and dry was now lush and green, and weeds flourished in the sidewalk cracks in the middle of August. Mesquite trees begin taking over my patio, and the mosquitos, which multiplied with the rain, eagerly dined out on my arms. But the rain brought problems of its own: While this year’s outsized monsoon storms were welcome, they were often accompanied by dangerous flooding that overwhelmed the desert arroyos and washes. Flash-flood notices lit up our phones all summer long in what an announcer at a local indie-movie theater called “a symphony of storm alerts.”
OVER THE PAST DECADE, the University of Arizona’s Climate Assessment for the Southwest program (CLIMAS) has hosted an entertaining podcast about local weather systems. And in recent years, there’s inevitably an episode where the usual hosts, Michael Crimmins and Zack Guido, researchers and professors at the University of Arizona, have a back-and-forth about their monsoon predictions. It was that dialogue that inspired them, along with fellow researcher and producer Ben McMahan, to create the monsoon game. “(We wanted) to find new ways of talking about the monsoon that engaged the public, because we know how it’s the single season that captivates the attention of people,” said Guido.
For Crimmins, it was also an excuse to indulge his obsession with the monsoon rains. He says his moods are dictated by the season; during last summer’s “nonsoon,” he cycled through all five stages of grief. “It’s kind of like an emotional thing in that I go up and down with the dewpoint temperature,” he told me. He spends his days alternating between checking his fancy home weather station — which is similar to the prize that was being offered — and, when he’s out, scanning his phone to see if any storms are developing. “I even got it to show up on my smartwatch,” he said incredulously. “That’s not normal.”
The game’s main purpose is to educate residents about our regional weather systems. “It’s not so much that we think people have some innate ability to know what the weather is going to be,” Guido explained. “But we do think the act of thinking about weather and climate is a very useful exercise for a whole bunch of reasons.” Monsoon game players are more likely to take their curiosity a step further, researching the region’s historical precipitation patterns and trying to deepen their understanding by comparing their own weather hunches to the scientific data.
The monsoons are something that affect us all, whether we realize it or not, because they influence the regional temperatures — and, for those of us with swamp coolers, they either intensify or reduce our personal experience of humidity and heat. “It’s kind of like soccer or fútbol for Latin Americans,” Guido said. “It’s the thing that everybody can talk about, and that everyone loves to talk about and you can kind of find common ground.”
The Southwest’s monsoon is driven by a complex host of factors. But at its most basic level, it forms when the land warms up at a different rate than the Pacific Ocean does, causing the wind direction to shift and allowing moisture to travel north from Mexico. Most of the monsoon rains are actually concentrated in Mexico. In the Southwest, we’re on the periphery of the weather pattern. But that still covers a lot of territory: The monsoon season extends all the way up to Colorado and Utah and influences weather across the entire West. Various factors, including the air pressure system known as the Four Corners High and the amount of moisture in the air, aligned this year to give us a “good” monsoon. “Wherever that high-pressure system is, is really, really important,” Crimmins said. “If it is above Arizona and New Mexico, then that moisture is pushed back into Mexico.” This year, it was positioned just right.
That’s why, Guido said, it’s harder than people think to connect extreme seasons — like this year’s remarkably good monsoon, say, or last season’s terribly dry one — to climate change. The dramatic differences between the two seasons represent an anomaly; it’s more likely that future changes from year to year will tend to be much subtler. “There’s so much variability that we would need long records, and highly dense records, to be able to find the trends in them. And we just don’t have that,” he said. “We know that we’ve altered the amount of energy within our system, and we know that has an effect on the climate system because the climate system is about moving energy around,” he said. There’s a reason the 2021 report of the Intergovernmental Panel on Climate Change avoids making definitive statements about the future of the Southwest’s monsoon. “It’s a $10 million question,” Guido said.
Throughout the rainy months of summer, for McMahan, the game provoked a kind of internal conflict between his desire to win the competition and the region’s desperate need for precipitation. “I want it to rain a certain amount, but then I kind of want it to stop raining, but I actually don’t want it to stop raining,” he said when we spoke in August. “That cursing kind of talk is not acceptable about the monsoon.”
As of press time, my own guesses have me ranked at 144th place. By mid-September, Tucson’s monsoon season was already the third wettest on record. More than 12 inches of rain has fallen since June. Who could have predicted that?
Jessica Kutz is an assistant editor for High Country News. We welcome reader letters. Email her at jessicak@hcn.org.
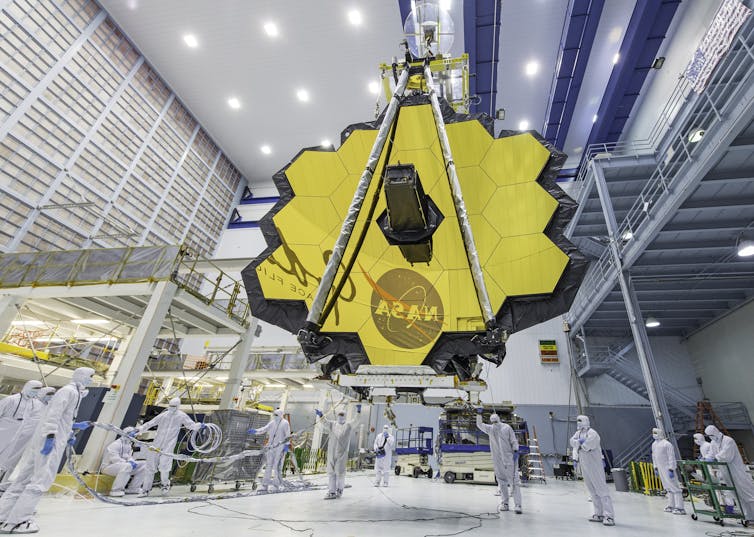
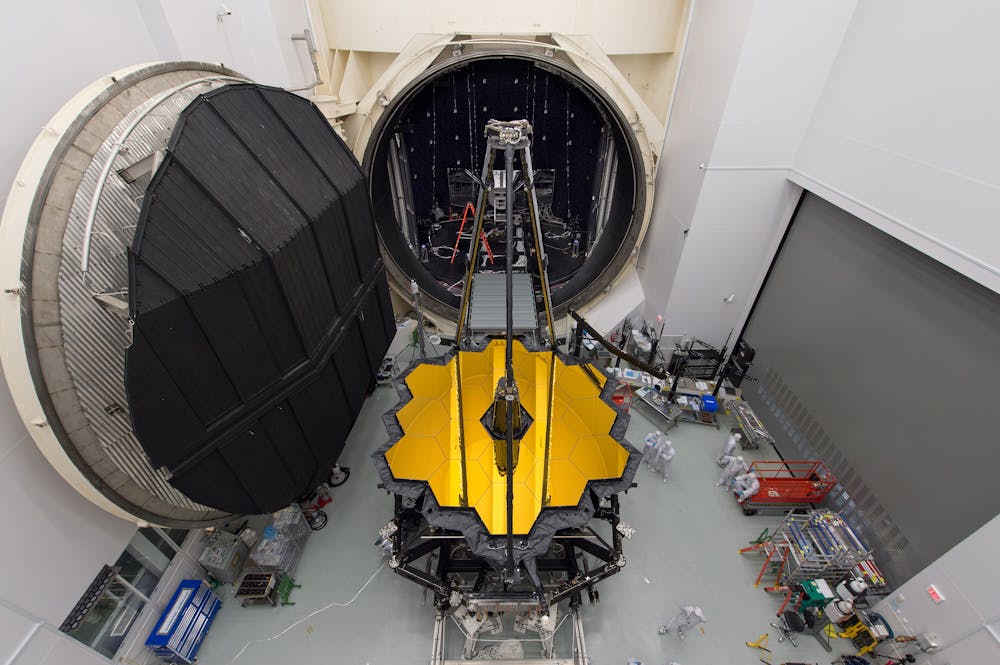
The James Webb Space Telescope is the biggest orbital telescope ever built and is scheduled to be launched into space on Dec. 18, 2021. NASA/Desiree Stover, CC BY
The James Webb Space Telescope is scheduled to head to space on Dec. 18, 2021. With it, astronomers hope to find the first galaxies to form in the universe, will search for Earthlike atmospheres around other planets and accomplish many other scientific goals.
To see deep into the universe, the telescope has a very large mirror and must be kept extremely cold. But getting a fragile piece of equipment like this to space is no simple task. There have been many challenges my colleagues and I have had to overcome to design, test and soon launch and align the most powerful space telescope ever built.
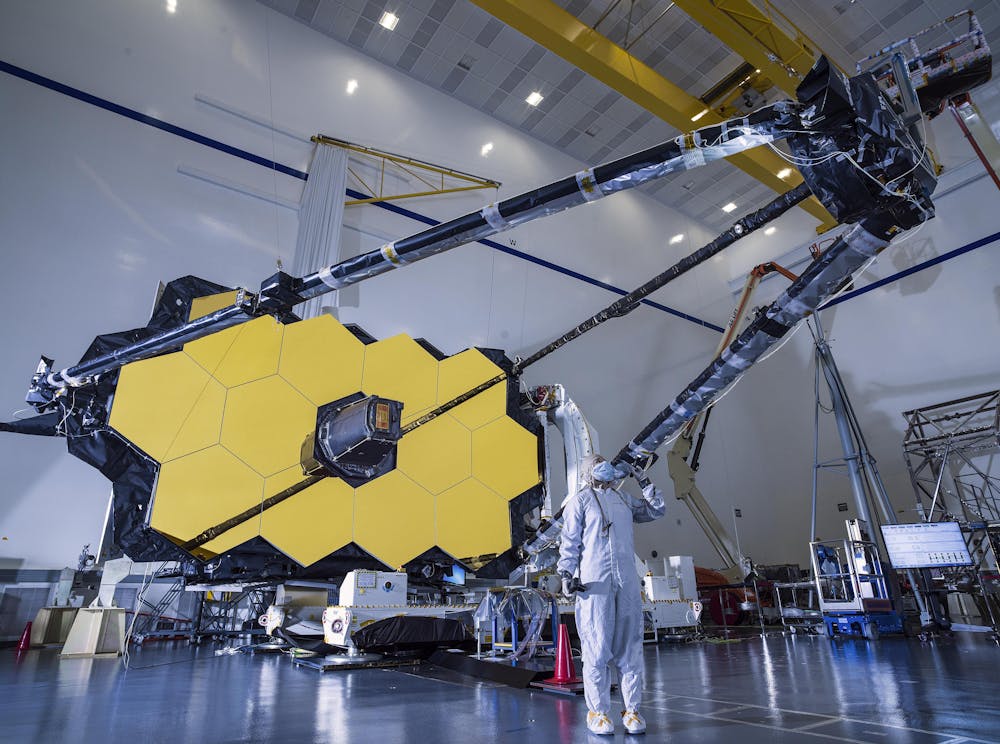
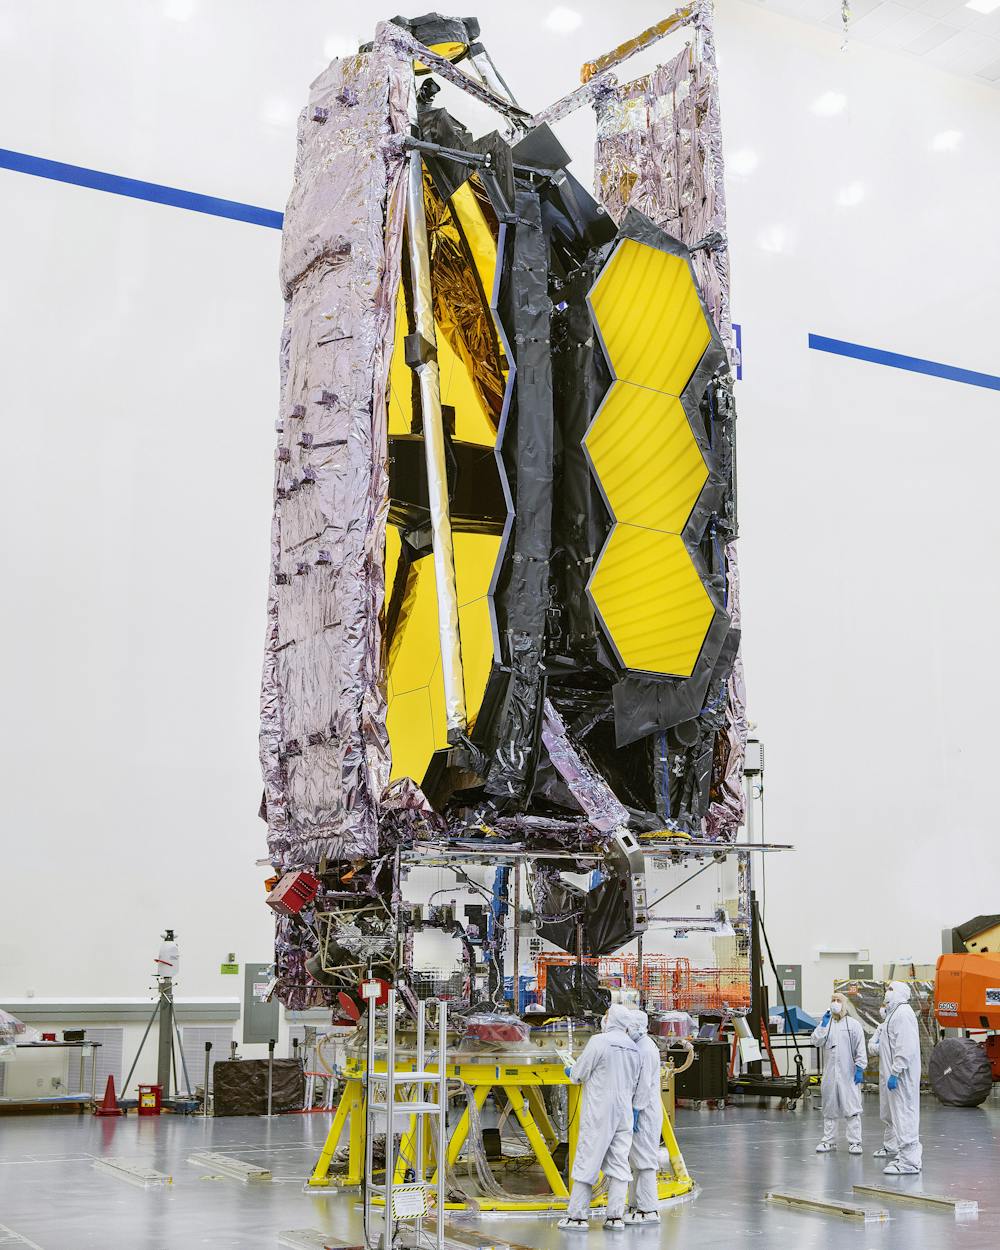
In order to detect the most distant and oldest galaxies, the telescope needs to be huge and kept extremely cold. NASA/Chris Gunn, CC BY
It works kind of like a satellite dish. Light from a star or galaxy will enter the mouth of the telescope and bounce off the primary mirror toward the four sensors: NIRCam, which takes images in the near infrared; the Near Infrared Spectrograph, which can split the light from a selection of sources into their constituent colors and measures the strength of each; the Mid-Infrared Instrument, which takes images and measures wavelengths in the middle infrared; and the Near Infrared Imaging Slitless Spectrograph, which splits and measures the light of anything scientists point the satellite at.
This design will allow scientists to study how stars form in the Milky Way and the atmospheres of planets outside the Solar System. It may even be possible to figure out the composition of these atmospheres.
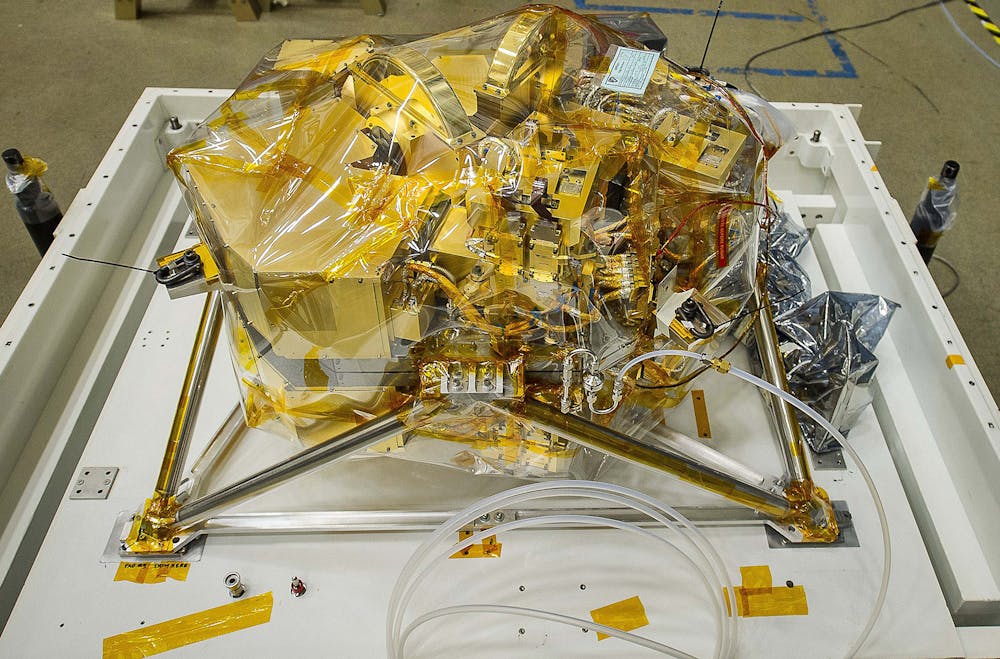
The NIRCam, seen here, will measure infrared light from extremely distant and old galaxies. NASA/Chris Gunn, CC BY
Ever since Edwin Hubble proved that distant galaxies are just like the Milky Way, astronomers have asked: How old are the oldest galaxies? How did they first form? And how have they changed over time? The Webb telescope was originally dubbed the “First Light Machine” because it is designed to answer these very questions.
One of the main goals of the telescope is to study distant galaxies close to the edge of observable universe. It takes billions of years for the light from these galaxies to cross the universe and reach Earth. I estimate that images my colleagues and I will collect with NIRCam could show protogalaxies that formed a mere 300 million years after the Big Bang – when they were just 2% of their current age.
Finding the first aggregations of stars that formed after the Big Bang is a daunting task for a simple reason: These protogalaxies are very far away and so appear to be very faint.
Webb’s mirror is made of 18 separate segments and can collect more than six times as much light as the Hubble Space Telescope mirror. Distant objects also appear to be very small, so the telescope must be able to focus the light as tightly as possible.
The telescope also has to cope with another complication: Since the universe is expanding, the galaxies that scientists will study with the Webb telescope are moving away from Earth, and the Doppler effect comes into play. Just like the pitch of an ambulance’s siren shifts down and becomes deeper when it passes and starts moving away from you, the wavelength of light from distant galaxies shifts down from visible light to infrared light.
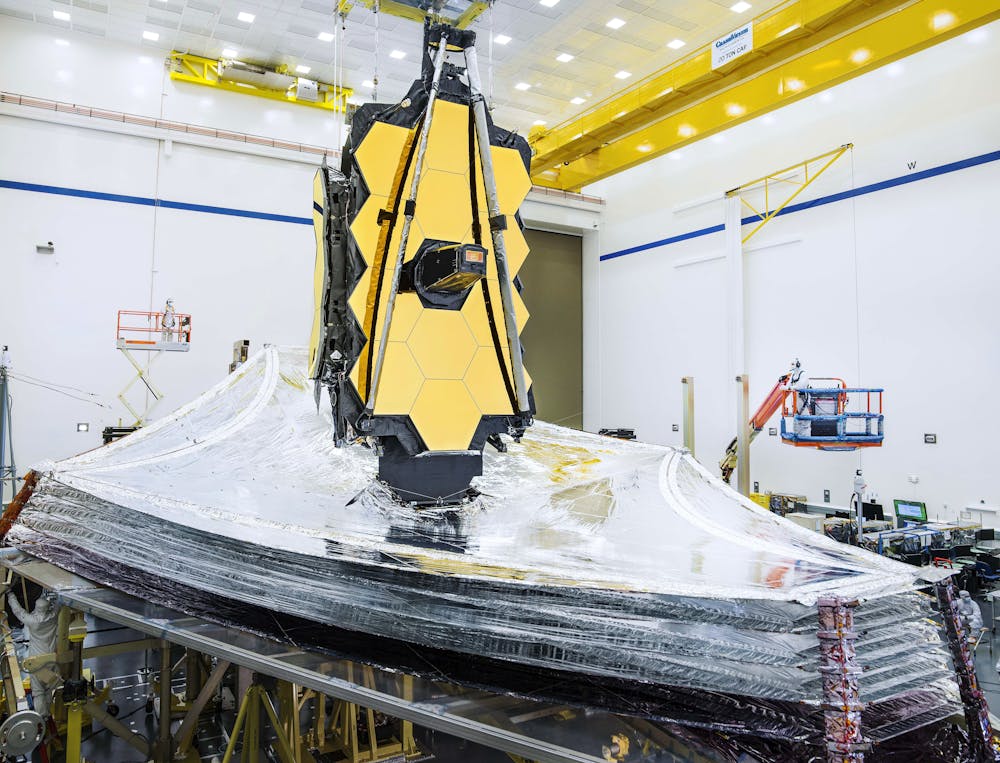
The five layers of silvery material underneath the gold mirror are a sunshield that will reflect light and heat to keep the sensors incredibly cold. NASA/Chris Gunn, CC BY
Webb detects infrared light – it is essentially a giant heat telescope. To “see” faint galaxies in infrared light, the telescope needs to be exceptionally cold or else all it would see would be its own infrared radiation. This is where the heat shield comes in. The shield is made of a thin plastic coated with aluminum. It is five layers thick and measures 46.5 feet (17.2 meters) by 69.5 feet (21.2 meters) and will keep the mirror and sensors at minus 390 degrees Fahrenheit (minus 234 Celsius).
The Webb telescope is an incredible feat of engineering, but how does one get such a thing safely to space and guarantee that it will work?
Engineers and scientists tested the entire telescope in an an extremely cold, low-pressure cryogenic vacuum chamber. NASA/Chris Gunn, CC BY
Test and rehearse
The James Webb Space Telescope will orbit a million miles from Earth – about 4,500 times more distant than the International Space Station and much too far to be serviced by astronauts.
Over the past 12 years, the team has tested the telescope and instruments, shaken them to simulate the rocket launch and tested them again. Everything has been cooled and tested under the extreme operating conditions of orbit. I will never forget when my team was in Houston testing the NIRCam using a chamber designed for the Apollo lunar rover. It was the first time that my camera detected light that had bounced off the telescope’s mirror, and we couldn’t have been happier – even though Hurricane Harvey was fighting us outside.
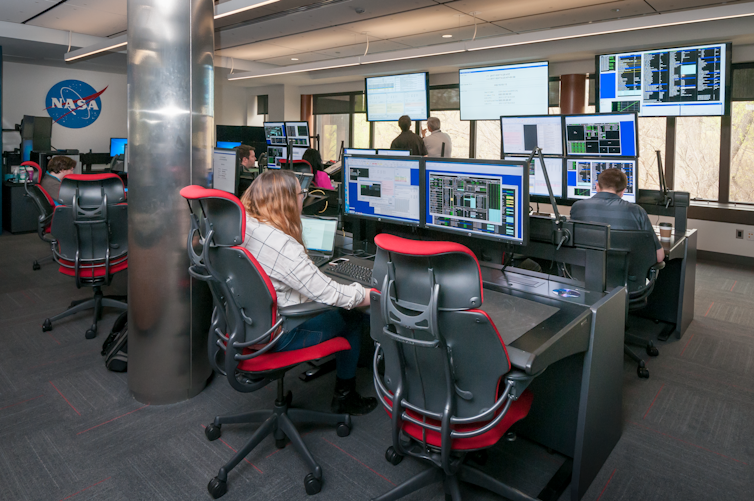
Rehearsals and training at the Space Telescope Science Institute are critical to make sure that the assembly process goes smoothly and any unexpected anomalies can be dealt with. NASA/STScI, CC BY
After testing came the rehearsals. The telescope will be controlled remotely by commands sent over a radio link. But because the telescope will be so far away – it takes six seconds for a signal to go one way – there is no real-time control. So for the past three years, my team and I have been going to the Space Telescope Science Institute in Baltimore and running rehearsal missions on a simulator covering everything from launch to routine science operations. The team even has practiced dealing with potential problems that the test organizers throw at us and cutely call “anomalies.”
To fit inside a rocket, the telescope needs to fold into a compact package. NASA/Chris Gunn, CC BY
Some alignment required
The Webb team will continue to rehearse and practice until the launch date in December, but our work is far from done after Webb is folded and loaded into the rocket.
We need to wait 35 days after launch for the parts to cool before beginning alignment. After the mirror unfolds, NIRCam will snap sequences of high-resolution images of the individual mirror segments. The telescope team will analyze the images and tell motors to adjust the segments in steps measured in billionths of a meter. Once the motors move the mirrors into position, we will confirm that telescope alignment is perfect. This task is so mission critical that there are two identical copies of NIRCam on board – if one fails, the other can take over the alignment job.
This alignment and checkout process should take six months. When finished, Webb will begin collecting data. After 20 years of work, astronomers will at last have a telescope able to peer into the farthest, most distant reaches of the universe.
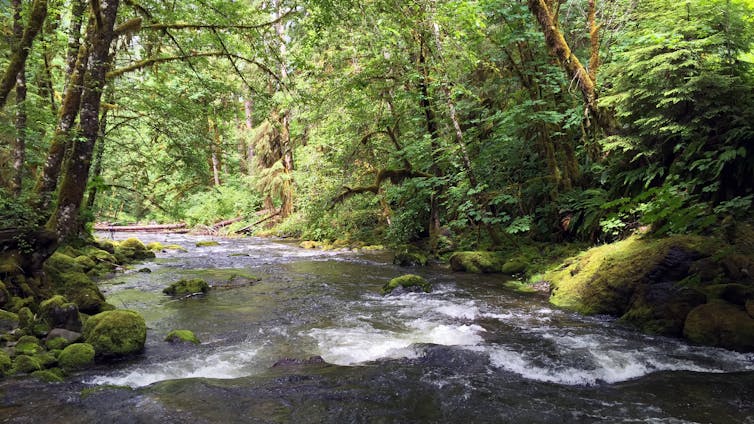
Rivers, lakes and wetlands cover just 1% of the Earth’s surface but are home to nearly 10% of all species, including fish, mammals, birds, insects and crustaceans. But these rich, diverse ecosystems are in free fall. Worldwide, species are declining faster now than at any other time in human history, and fresh waters are losing more species than land or ocean ecosystems.
It’s challenging to study how these stresses are affecting aquatic life. There are many diverse threats, and river networks cover broad geographic regions. Often they run through remote, nearly inaccessible areas. Current techniques for monitoring freshwater species are labor-intensive and costly.
In our work as researchers in ecology, we are testing a new method that can vastly expand biomonitoring: using environmental DNA, or eDNA, in rivers to catalog and count species. Federal and local agencies need this data to restore water quality and save dwindling species from extinction.
This preview of the film “Hidden Rivers” reveals the diverse and little-known life in Southern Appalachian waterways.
Traditional methods are slow and expensive
With traditional biomonitoring methods, scientists count individual species and their abundance at just a few sites. For example, one recent study of mountaintop mining impacts on fish in West Virginia sampled just four sites with a team of four researchers.
Collecting and identifying aquatic organisms requires highly skilled ecologists and taxonomists with expertise in a wide variety of freshwater species. For each sample of fish or invertebrates collected in the field, it takes from hours to weeks to identify all of the species. Only wealthy nations can afford this costly process.
Conserving threatened and endangered species and keeping river ecosystems healthy requires monitoring broad areas over time. Sensitive aquatic insects and fish species are the freshwater equivalent of the proverbial canary in a coal mine: If these species are absent, that’s a strong indicator of water quality problems. The cause may be mining, agriculture, urbanization or other sources, as well as dams that block animals’ downstream movements.
Scientists sample for fish in a Maryland stream by ‘electrofishing’ – stunning fish with a mild electrical pulse so they can be collected, identified and released after the shock wears off.
Free-floating genetic evidence
Innovations in genetic technology have created a powerful, affordable new tool that we are now testing. The process involves extracting eDNA from genetic material floating in the water – skin, scales, feces and single-celled organisms, such as bacteria.
By analyzing this genetic information, we can detect a wide range of species. We started considering using eDNA for our research in 2018, after several studies demonstrated its power to monitor single species of interest or groups of organisms in rivers and oceans.
Collecting eDNA is easy: One 4-ounce water sample can capture remnant DNA from thousands of aquatic species. Another benefit is that it doesn’t require killing wildlife for identification.
In the lab, we analyze the DNA from different taxonomic groups one by one: bacteria, algae, fish and macroinvertebrates – organisms that lack backbones and are large enough to see, such as snails, worms and beetles. Many researchers study just one group, but we assess all of them at the same time.
We then match our DNA sequences with freshwater species that are already catalogued in existing databases. In this way, we can chart the distribution and abundance of these organisms within and across rivers.
This process requires just a cheap filter, a syringe and vials, and anyone can do it. Commercial eDNA companies charge less than $200 to extract and sequence a sample.
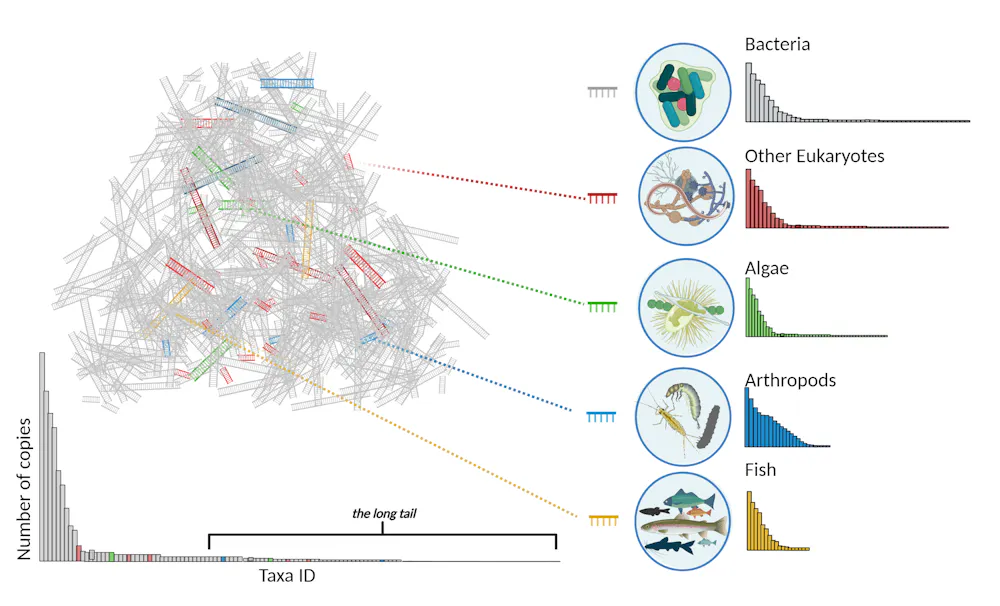
Most eDNA the authors collect from streams is microbial (the gray DNA in the cartoon above). Without special techniques, they would not ‘see’ the less frequent DNA from other taxonomic groups, so their surveys would generate a species abundance curve like the one on the bottom left, in which most groups of conservation concern are too rare to detect or fall into the ‘long tail’ of rare occurrences. By using targeted primers – short stretches of DNA that are unique to specific groups of organisms – they can amplify the eDNA of less abundant groups, like algae, arthropods and fish, as shown on the right. Emily Bernhardt, produced using Biorender, CC BY-ND
Altered rivers
Using this method, we extensively surveyed 93 rivers in West Virginia – looking at the entire tree of life, from the tiniest bacteria to fish – in two days with a four-person team.
The Appalachian rivers that we study teem with life. These are some of the world’s most biologically diverse temperate freshwater ecosystems, home to many fish species, as well as salamanders, crayfish, mussels and aquatic insects. Many are found nowhere else. We tallied more than 10,000 different species in those 93 waterways.
The area where we worked is an intensive coal mining region, which heavily affects waterways. Liquids draining from mines are acidic, but in this region they react with limestone rock, so the net effect is to make local streams alkaline. Mine drainage also increases streams’ salinity and concentrations of sulfate and other contaminants. Our research revealed that mined watersheds held 40% fewer species than areas without mining operations, and the organisms we detected were less abundant than in unaffected rivers.
Assessing river health
We believe this new approach represents a revolution for biomonitoring, expanding our ability to quantify and study freshwater life. It’s also an important new conservation tool, allowing scientists to track changes in populations of endangered or invasive species. Researchers also can use eDNA to monitor biodiversity or discover new species in oceans or soils.
This open-science method makes all DNA data widely available, with nearly all sequences placed in public repositories. Moving forward, we expect that it will aid many types of research, as well as state and local monitoring and conservation programs. Investments in collecting eDNA and identifying organisms and analyzing their genetic signatures will continue to make it a more effective tool.
[Over 100,000 readers rely on The Conversation’s newsletter to understand the world.Sign up today.]
Efforts are underway to better target various individual species, focusing on those that are endangered, invasives that damage ecosystems and sensitive species that serve as indicators of river health. Scientists are freezing eDNA samples at -112 degrees F (-80 C) in expectation that technological advances may yield more information in the future.
Traditional monitoring approaches remain valuable, but eDNA adds an important new tool to the toolkit. Together, these approaches can begin to answer many questions about food webs, the conservation status of species, reproduction rates, species interactions, organisms’ health, disease and more.