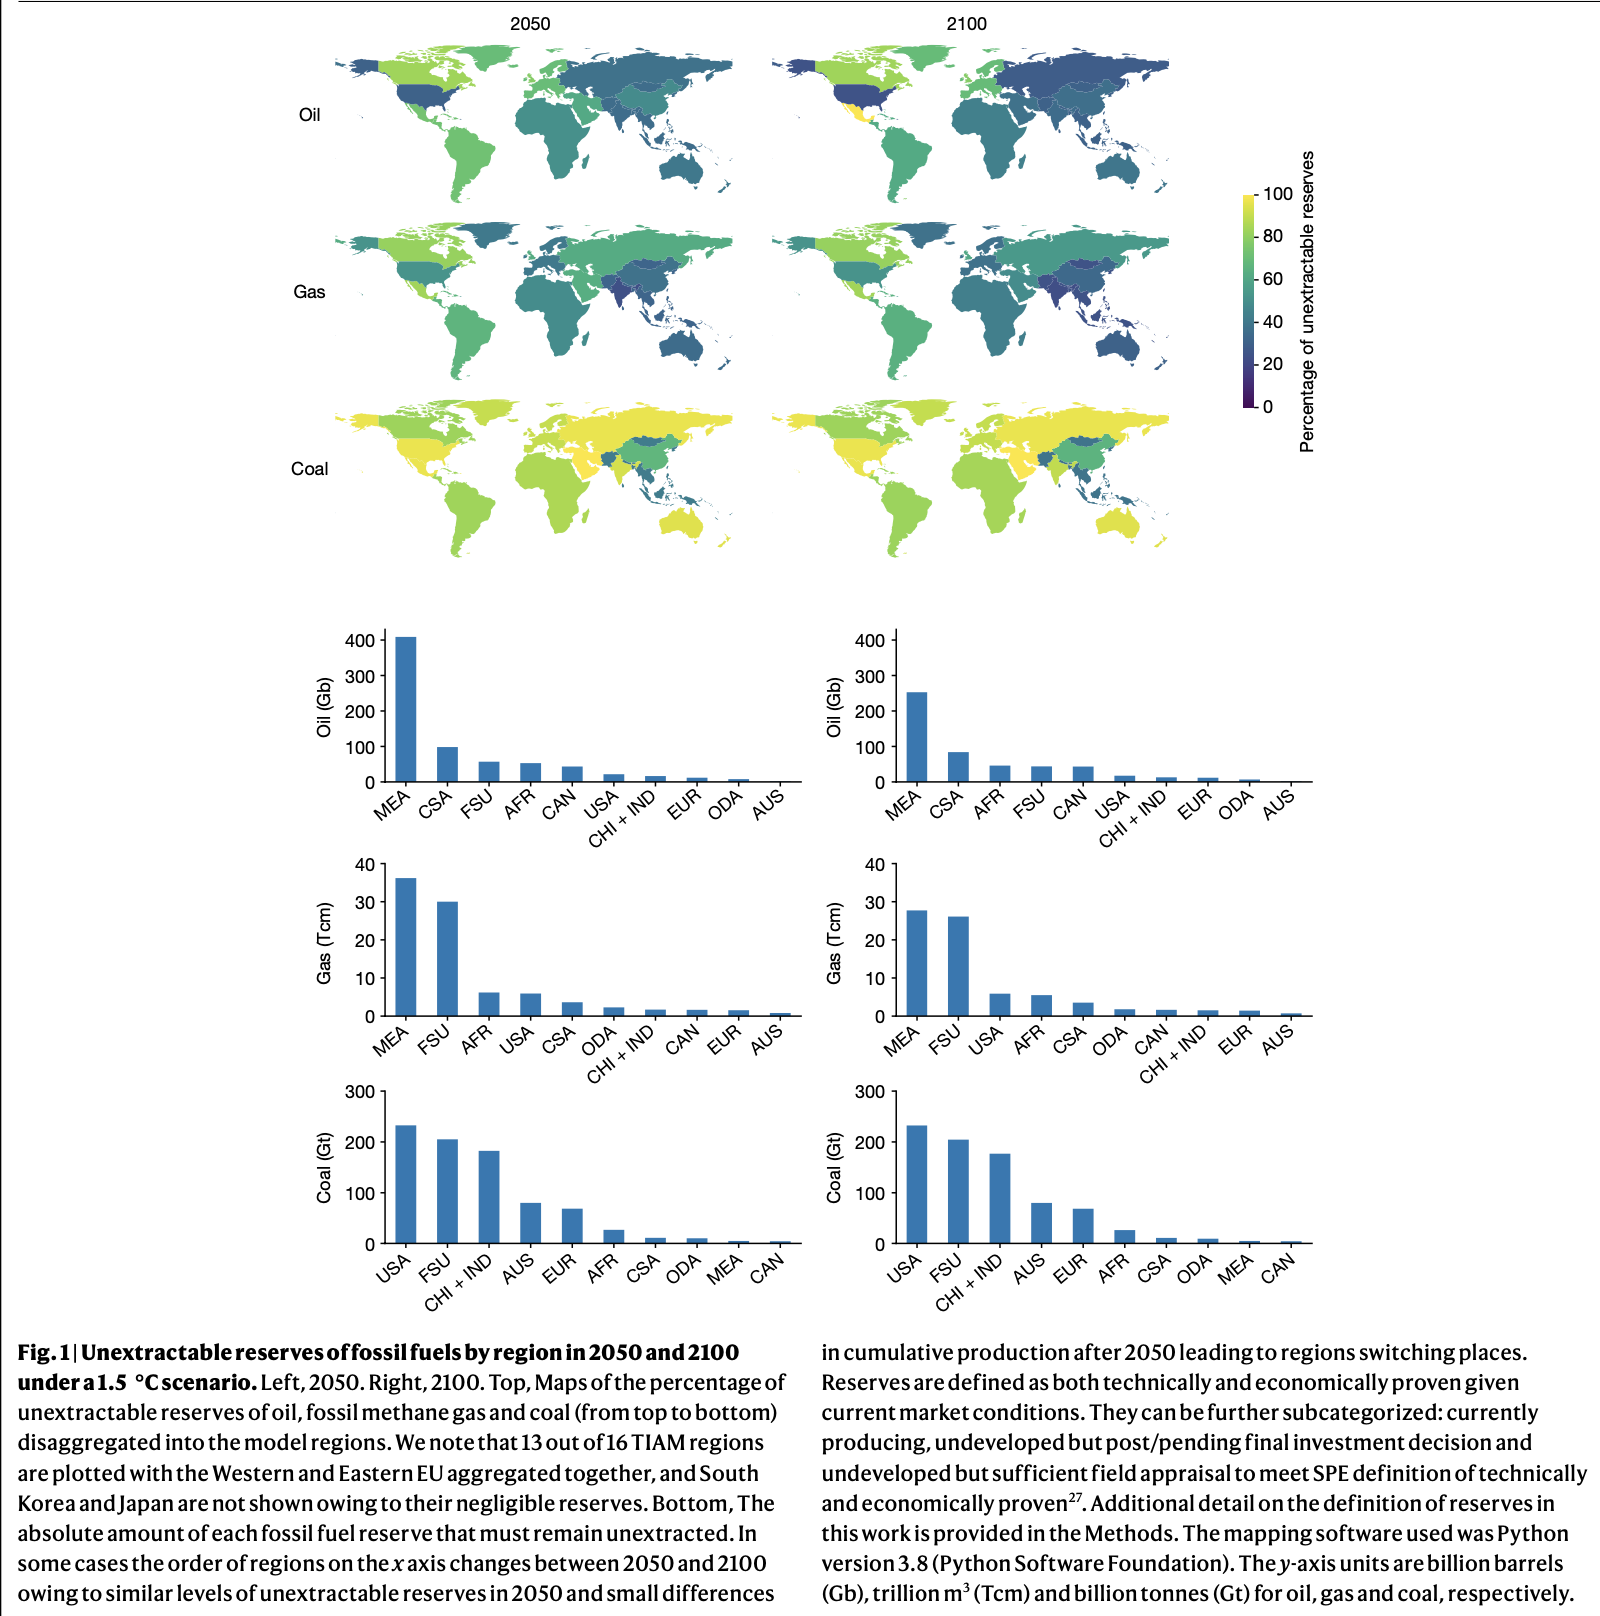
A new study in Nature reports that oil, gas and coal production must begin falling immediately to have even a 50 percent chance of keeping global temperatures from rising more than 1.5 degrees Celsius.
After a summer of weather extremes that highlighted the urgency of limiting global warming in starkly human terms, new research is clarifying what it will take to do so. In order to have just a 50 percent chance of meeting the most ambitious climate target, the study found, the production of all fossil fuels will need to start declining immediately, and a significant majority of the world’s oil, gas and coal reserves will have to remain underground over the next few decades.
While the research, published Wednesday [September 8, 2021] in the journal Nature, is only the latest to argue that meeting the 2015 Paris Agreement goals to limit warming requires a rapid pivot to clean energy, it lays out with clear and specific figures exactly how far from those targets the world remains.
“The inescapable evidence that hopefully we’ve shown and that successive reports have shown is that if you want to meet 1.5 degrees, then global production has to start declining,” said Daniel Welsby, a researcher at University College London, in the United Kingdom, and the study’s lead author. As part of the Paris Agreement, nations agreed to try to limit global warming to 1.5 degrees Celsius (2.7 degrees Fahrenheit) above pre-industrial times.
The study found that nearly 60 percent of global oil and gas reserves and about 90 percent of coal reserves must be left unexploited by 2050, though a portion of those fuels could be produced in the second half of the century. Total oil and gas production must begin declining immediately, the research said, and continue falling at about 3 percent annually through 2050. Coal production must fall at an even steeper rate.
While the authors noted a few signs of change, including that coal production is already on the decline, the current course is far off what’s needed. In March, the International Energy Agency warned that oil production was on track to rebound from a pandemic-driven dip and would surpass 2019 levels within a couple of years. That projection came on the heels of a separate report in December by the United Nations Environment Program, which said energy producing countries are set to expand fossil fuel output for years.
The new paper builds on these studies and other related work to estimate the “unextractable” portion of the fossil fuel stores that are currently considered profitable to exploit—so-called proven reserves. Put another way, the research effectively says that most of the fossil fuels that energy companies currently list as financial assets, or that governments report as strategic ones, would be rendered worthless if the world is to have a shot at limiting warming to 1.5 degrees Celsius.
Click here to go to the Water for Colorado website tool for local funding initiatives:
Solving Colorado’s Water Issues
Colorado needs long-term funding to conserve, maintain, and restore our water supplies, river and stream flows, and economy in the face of numerous challenges, from prolonged drought and rising temperatures driven by climate change and population growth. Maintaining healthy river systems and water availability is essential to sustain Colorado’s way of life, preserve natural resources, grow our crops, and bolster our economy.
Our State Water Plan Lacks Sustainable Funding
The Colorado Water Plan, developed by the Colorado Water Conservation Board in 2015, sets forward a path to secure our water future by protecting Colorado’s rivers, securing clean, safe, reliable drinking water for our communities, and preserving our agricultural heritage.
Colorado’s existing public funding resources are insufficient to address the current and future needs identified in the Water Plan to secure our water future. Establishing new sources of funding – whether local or statewide – will help to keep Colorado’s rivers healthy and flowing to continue to support clean drinking water for all Coloradans and reliable water supplies for farms and ranches across the state.
In the last few years, Coloradans have illustrated their support for water funding by approving three different tax increases where water is the beneficiary. In 2019, the passing of Proposition DD legalized sports betting in Colorado with the majority of the proceeds of the betting taxes funding Colorado’s Water Plan. At the local level, both the Colorado River Water Conservation District and the St. Vrain and Left Hand Water Conservancy District successfully passed public funding initiatives to increase their mill levies in the fall of 2020, with other municipalities like the cities of Denver and Boulder and counties like Summit and Chaffee passing voter-approved funding for water and rivers in the last three years. Coloradans clearly understand the need for additional water funding and they are willing to pay for it.
How (and Why) to Use This Guide
The purpose of this guide is to assist water conservancy districts, nonprofits, local governments, citizen stakeholder initiatives and others in learning more about successfully implementing new local sources of public funding for water in Colorado. This guide is intended to help you understand the general process and important questions to ask when pursuing a public funding measure, such as a bond, property tax, sales tax, or mill levy increase. You will also see video interviews with individuals and organizations that have participated in public funding measures in Colorado, as well as with experts in the field of public funding.
Book Cliffs and Mt. Garfield (on right, approximate altitude 6,600′) in Mesa County, Colorado. By User Skez on en.wikipedia – Originally from en.wikipedia; description page is (was) here03:31, 2 March 2006 Skez 992×708 (137,232 bytes) (Near Grand Junction, CO Taken by Sean Davis http://flickr.com/photos/skez/32161524/), CC BY-SA 2.0, https://commons.wikimedia.org/w/index.php?curid=835434
FromThe Grand Junction Daily Sentinel (Sam Klomhaus):
A group of concerned Grand Valley organizations announced Wednesday they plan to appeal a decision by the Colorado Department of Public Health and Environment to implement total maximum daily levels of selenium and recoverable iron in watersheds north of the Colorado River in the Grand Valley.
Selenium, recoverable iron and E. Coli are all “pollutants of concern” in the watershed, according to a CDPHE report on the total maximum daily levels.
According to the report, elevated selenium levels can cause mortality, deformity and reproductive failure in fish and aquatic birds.
The decision, which would affect 14 “washes” from the Government Highline Canal diversion to below Salt Creek, was announced Aug. 10. The appeal would stop the decision from being forwarded to the Environmental Protection Agency and formally implemented while the appeal process is ongoing.
Mark Harris, general manager of the Grand Valley Water Users Association, said Wednesday he was “saddened and surprised” by the CDPHE’s decision, which he said ignored ongoing efforts to mitigate selenium levels in area water, as well as the amount of selenium that naturally occurs in area soils and gets washed into the watershed whenever it rains…
Harris said that while protecting water quality is important, the amount of selenium reduction the CDPHE is requiring is impossible from a practical and cost standpoint.
To comply with the regulations, Harris explained, the economic and physical landscape of the Grand Valley would have to change. The cost of complying with CDPHE’s proposed regulations would be borne by area governments and passed on to residents, Grand Junction Chamber of Commerce CEO Diane Schwenke said.
Organizations supporting the appeal are Associated Members of Growth and Development, city of Fruita, city of Grand Junction, Mesa County Valley School District 51, Grand Junction Chamber of Commerce, Grand Valley Water Users Association, Housing and Building Association of Colorado, Mack airport, Mesa County, Orchard Mesa Irrigation District, Palisade Irrigation District and Western Colorado Contractors Association.
The selenium in the soil is washed out of the Bookcliffs and into the watershed, Harris said, and mitigation efforts include lining irrigation canals and ditches to keep the selenium from leeching in.
Harris said there has already been a lot of success reducing the selenium levels in the watershed since the 1970s and 80s, success he contends the CDPHE has ignored.
A lateral brings water from the Grand Valley Irrigation Company canal to this parcel of land, which is owned by private equity firm Water Asset Management, a company that has been accused of water speculation. A state work group has released its report on investment water speculation, but failed to come to a consensus and did not make recommendations to lawmakers. CREDIT: BETHANY BLITZ/ASPEN JOURNALISM
Trying to recommend ways to improve on Colorado’s anti-water speculation law is a tough job, primarily because the state’s constitution, statutes and legal precedence already do a good job of it.
It doesn’t take much to set off alarms in Colorado’s water community, and in 2019 there were purchases of irrigated land by entities not normally associated with water use. According to water journalist Allen Best, “large, water-rich ranches in the Grand Valley on the West Slope by investment banks” tripped all kinds of alarms across the state. Of all the nightmares that keep Colorado water interests awake at night, water speculation is among the spookiest.
During the 2020 legislative session, the General Assembly passed Senate Bill 20-048, which directed the director of the Colorado Department of Natural Resources to convene a working group to recommend ways to shore up the state’s protections against water speculation.
Joe Frank, manager of the Lower South Platte Water Conservancy District, was named to the 22-member working group, which submitted its final report, titled “Report of the Work Group to Explore Ways to Strengthen Current Water Anti-Speculation Law,” last month on Aug. 13, just two days short of the deadline.
Critics immediately denounced the report, saying it has little value because it doesn’t actually make any recommendations to the Legislature. In an interview with Best, Frank said there’s still work to be done before any new laws can be written.
Talking last week with the Journal-Advocate, Frank said it’s going to be difficult to figure out ways to strengthen something that’s already quite strong.
“We took it upon ourselves to define two types of water speculation,” Frank said. “There’s traditional speculation, which is already pretty well addressed. And then we defined what we call ‘investment water speculation,’ and that’s harder to get your hands around.”
Under Colorado water law the water in Colorado is a public resource for beneficial use by public agencies, private persons and entities. A water right, which is owned, is created to use a portion of the public’s water resources, and is subject to water availability and under the terms specified by a water court. Those specifications — date of priority, physical location, and the amount that can be used by the water right – appear in what is called a decree.
Cities own water rights and the infrastructure to deliver such rights, so people are purchasing water from the city even though water in Colorado is a public resource. Water rights are real property rights and can be sold and traded as long as it is continued to be put to beneficial use…
According to Frank, about the only way to prevent “investment water speculation” is to define actions that prove intent, and that raises the specter of yet another agrarian nightmare; trampling on a property owner’s right to sell his property.
“Is it the intent to come in and profit from the increased value of water?” Frank asked. “It has to do with point of sale and real property. But can you pass a law that says you can interfere with the market?”
In other words, in order to prove intent, it would be necessary to examine and have some legal control over the sale of land and water rights. In theory, an investor from Manhattan could buy several irrigated farms, allow the water to be used for crops for a period of time while the dollar value of those shares increases, and then sell those shares to, say, a growing Denver suburb and pocket the profit.
State Sen. Don Coram, who wrote SB 20-048, has gone on record saying he doesn’t want the state to get involved in curtailing property rights.
Frank said there may be no easy way to write anti-speculation legislation, but rather it may take a series of smaller actions.
“The over-arching issue that we have to solve is supply and demand,” Frank said. “When there’s more demand than supply, that drives up the price of water. Conservation and efficiency only go so far, and nobody is creating any more water.”
A scenic lake in western Colorado is poised to become the public destination admirers have long envisioned.
That’s after the announcement of Sweetwater Lake entering the U.S. Forest Service portfolio.
A recent press release promised wildlife protection and new recreation access to the 488 acres in a remote pocket between Garfield and Eagle counties, backdropped by Flat Tops Wilderness. Previously, the shores had been privately held and feared to be in the crosshairs of development.
“Save the Lake” was the fundraising campaign waged by Eagle Valley Land Trust. Last year, in partnership with The Conservation Fund, the lake was saved to the tune of $7.1 million.
Now, thanks to millions of more dollars from the Land and Water Conservation Fund, Sweetwater Lake has been transferred to White River National Forest. After decades-long shortages, Congress’s move to fully restore that fund last summer was seen as critical for federal land managers to take control of the lake.
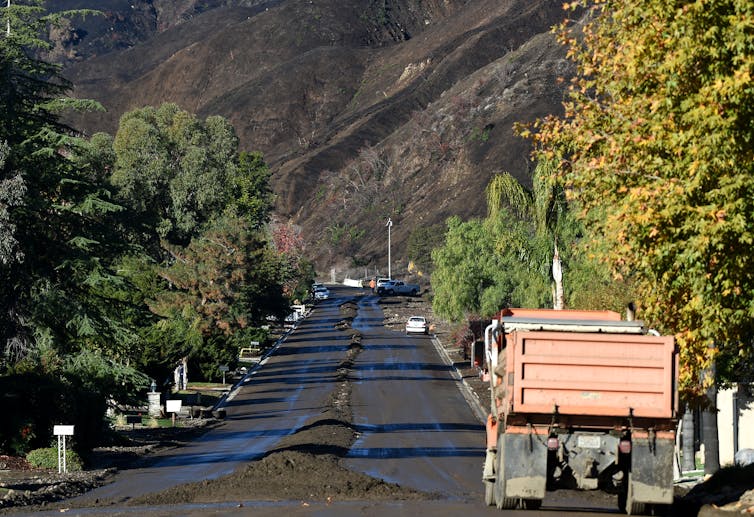
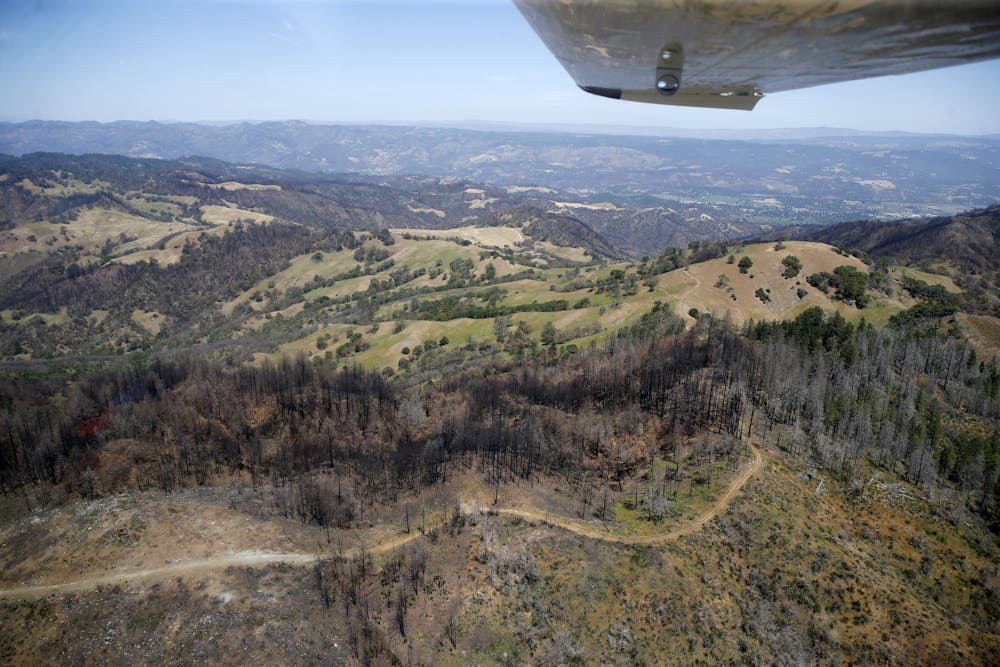
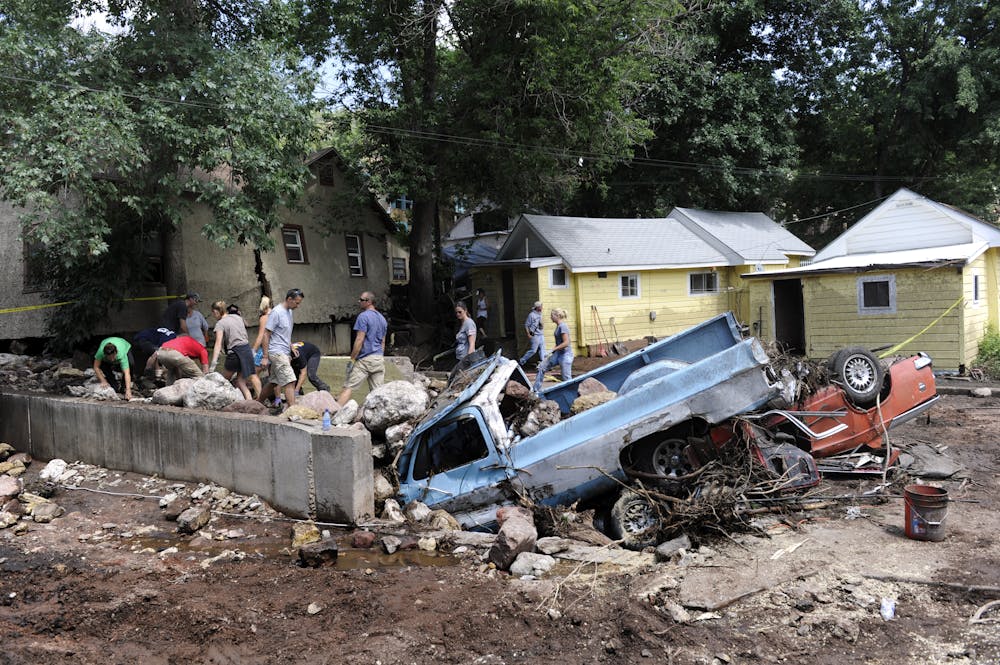
Wildfires burn millions of acres of land every year, leaving changed landscapes that are prone to flooding. Less well known is that these already vulnerable regions can also intensify and in some cases initiate thunderstorms.
Wildfire burn scars are often left with little vegetation and with a darker soil surface that tends to repel rather than absorb water. These changes in vegetation and soil properties leave the land more susceptible to flooding and erosion, so less rainfall is necessary to produce a devastating flood and debris flow than in an undisturbed environment.
Burn scars can also initiate or invigorate thunderstorms, raising the risk both of flooding and of lightning that could spark more fires in surrounding areas, as my research with fellow atmospheric scientist Elizabeth Page has shown.
Factors contributing to thunderstorms
Three things contribute to the potential for burn scars to fuel thunderstorms: lack of vegetation, reduced soil moisture and lower surface albedo – essentially how well it reflects sunlight. When burned soil is darker, it absorbs more energy from the sun.
These factors contribute to higher surface temperatures over the burn scar area relative to unburned areas nearby. The temperature difference can drive air currents, causing convection – the motion of warmer air rising and cooler air sinking. When that rising warm air draws in more humid air from surrounding areas, it can produce cumulonimbus clouds and even thunderstorms that can trigger rain and flooding.
Fire officials explain how burned land becomes more flood prone.
In an analysis of a flash flood that occurred on burn scars in Australia in 2003, scientists found that the soil’s moisture was low and its albedo in the burn area had fallen from 0.2 to 0.08. To put that into perspective, charcoal has an albedo of about 0.04 and fresh snow is nearly the maximum of 1. When the scientists simulated those changes in a computer model, they found that if the land hadn’t been burned, just over a tenth of an inch of rain would have fallen. Instead, those changes led to 1.25 inches and severe flooding.
Studies have found that the intensity of this effect of burn scars on storm potential decreases over time, but the risk remains until the vegetation regrows.
When I used to pilot sailplanes, also known as gliders, I often rode the thermals – upward currents of warm air – in the Santa Catalina Mountains near Tucson and in Colorado’s Front Range. The best locations for catching thermals were on the south and southwest slopes of rugged terrain, where the thermals became chutes of rapidly rising air.
A wildfire in one of these locations would burn more intensely because of the swift air currents, leaving a dark, water-repelling surface with little vegetation behind. With moisture from the Southwest Monsoon that arrives in the region in late summer, these thermal chutes, intensified by burn scars, are prime locations for initiating or intensifying storm-producing cumulonimbus clouds and flooding.
In these arid regions, plant recovery may take three to five years or more, particularly in locations where intense fires burned on south- and west-facing slopes where sunlight is more intense. Many of the record-breaking 2020 wildfires in Colorado and Arizona occurred in mountainous terrain where flash flooding on burn scars has been deadly in the past. These areas will continue to be of particular concern over the next few years.
How long burn scars will continue to fuel storms depends on how arid the region is and how quickly vegetation recovers.
Forecasters, emergency responders and people living in and near wildfire burn scars need to be aware that these areas are at risk both for potential major flooding and debris flows, and for invigorated storms with a potential for heavy precipitation.
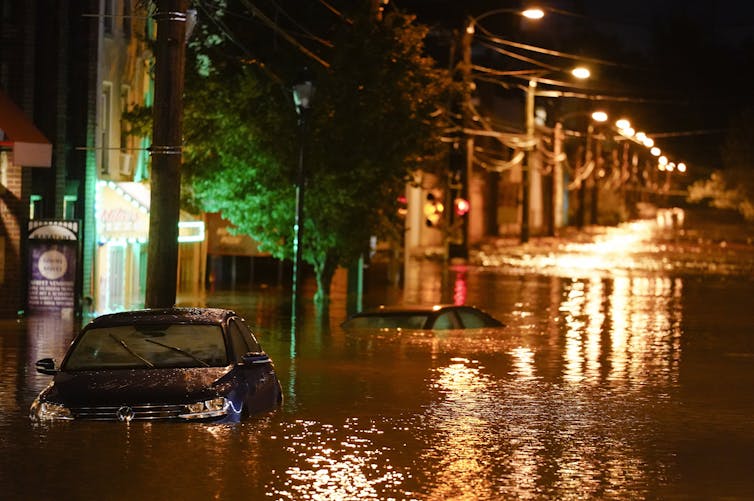
Record downpours from Hurricane Ida overwhelmed cities across the Northeast on Sept. 1, 2021, hitting some with more than 3 inches of rain an hour. Water poured into subway stations in New York City, and streets flooded up to the rooftops of cars in Philadelphia. The storm had already wreaked havoc on the Gulf Coast after hitting Louisiana three days earlier as a Category 4 hurricane.
Ida had weakened well below hurricane strength by the time it reached the Northeast, so how did it still cause so much rain?
Two major factors likely contributed to its extended extreme rainfall.
First, Ida’s tropical moisture interacted with developing warm and cold fronts.
Second, evidence is mounting that, as the climate warms, the amount of precipitation from heavy rainstorms is increasing, especially in the central and eastern U.S.
As hurricanes move northward from the tropics, they often transition from their characteristic circular shape to become “extratropical cyclones” with warm and cold fronts extending outward from the low pressure at the center. Even though they no longer have the intense winds that they did in the tropics, they still bring tropical humidity. That moist air is lifted along the fronts, and long-lasting, very heavy rain can result. That was happening as Ida’s remnants moved toward the Northeast.
Forecasters emphasized the threat of flash flooding well ahead of its arrival, and the National Oceanic and Atmospheric Administration’s Weather Prediction Center issued a rare “high risk” of excessive rainfall outlook for parts of the Northeast a day in advance.
The widespread, intense rainfall overwhelmed rivers and drainage systems in the highly populated corridor from Philadelphia to New York to Boston. That led to major flash flooding and at least 50 deaths in the region, in addition to at least 17 deaths earlier along the Gulf Coast. Newark, New Jersey, recorded 8.41 inches of rain, their most ever in a single day, shattering the old record by over 1.5 inches. Weather stations in New York City saw rain rates over 3 inches per hour. The extreme rainfall arrived with tornadoes in several states, including Maryland and New Jersey.
Warmer climate, heavier rainfall
Extreme rain and flash flooding aren’t new to the Northeast, and they often result from hurricanes or their remnants. The remains of Hurricanes Agnes (1972), Floyd (1999), Irene (2011), Lee (2011) and Sandy (2012), among others, all brought widespread rainfall and flooding through the area.
Yet, heavy downpours are becoming more common in the region as the climate warms.
The reasons are fairly simple: Warmer air can have more water vapor in it. With every 1 degree Celsius (1.8 F) increase in temperature, there can be about 7% more moisture in the air. This is formally known as the Clausius-Clapeyron relation.
Because the amount of rain that a storm produces is closely connected to the amount of water vapor in the air, this means that, all else being equal, heavy downpours are more likely in a warmer climate. It explains why heavy rain occurs year-round in the tropics, whereas it is much more likely in summer than winter in the U.S.
This is also why the intensity of rainfall is expected to increase as the climate warms. When weather patterns that bring together the ingredients for heavy rainfall, like hurricanes, occur in a warmer world, more moisture is available, and more rain falls. Unfortunately, this is not a linear process: A small bit of added moisture can lead to a lot more rain.
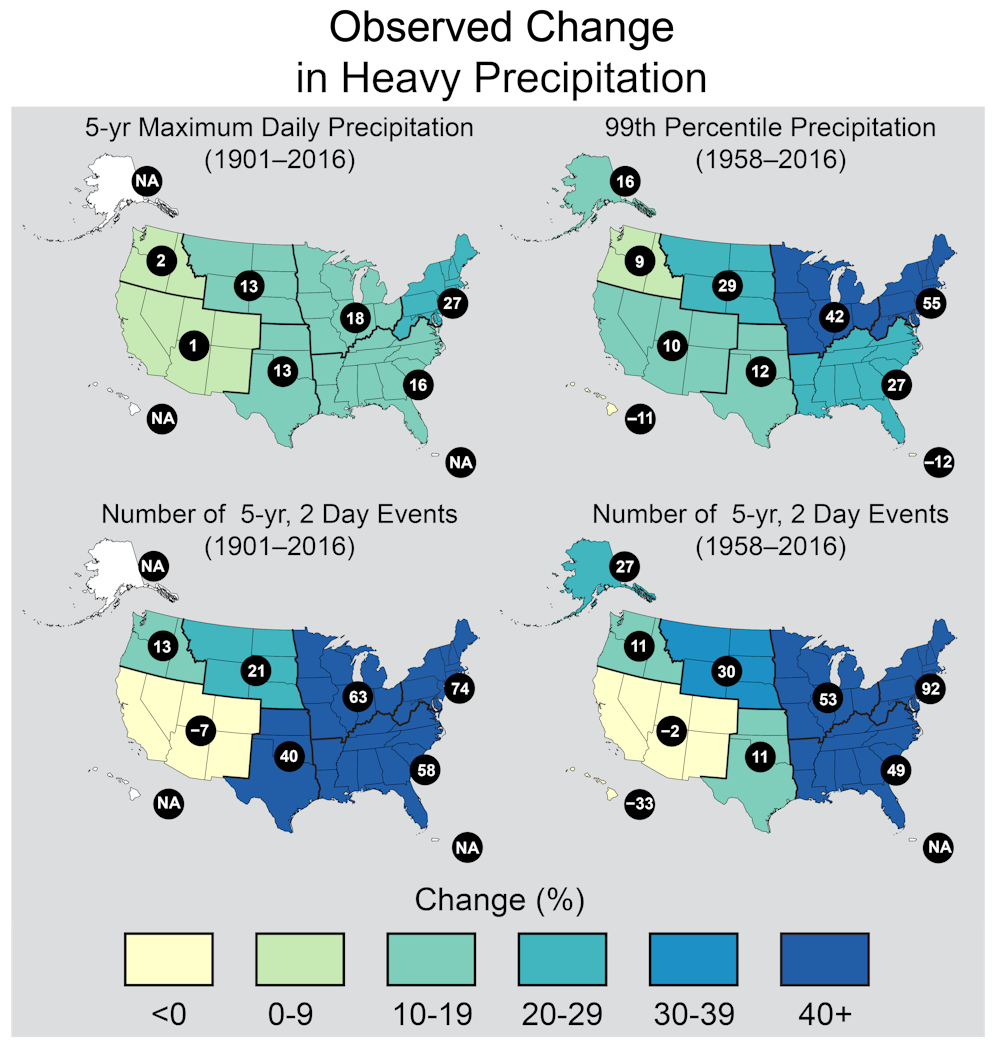
Observed changes in heavy precipitation across the U.S., from the 4th National Climate Assessment. This figure shows four different metrics of heavy precipitation change. For example, the upper right panel shows that in the northeastern U.S., the amount of rain in the heaviest precipitation events increased by 55% from 1958-2016. 4th National Climate Assessment
Hurricanes are limited to certain areas, but extreme rainfall from other types of storms can occur just about anywhere – think of intense cloudbursts during the summer monsoon in the Desert Southwest, or organized thunderstorm systems like the one that caused deadly flooding in Tennessee in August 2021.
Many communities are already highly vulnerable to the type of extreme precipitation that has been observed historically. Floods have always been a hazard, and intense rainfall can test the infrastructure even in places where it happens often. But as the climate changes, these risks will only increase further.
This article was updated Sept. 3 with the Northeast death toll rising.
[Over 100,000 readers rely on The Conversation’s newsletter to understand the world.Sign up today.]
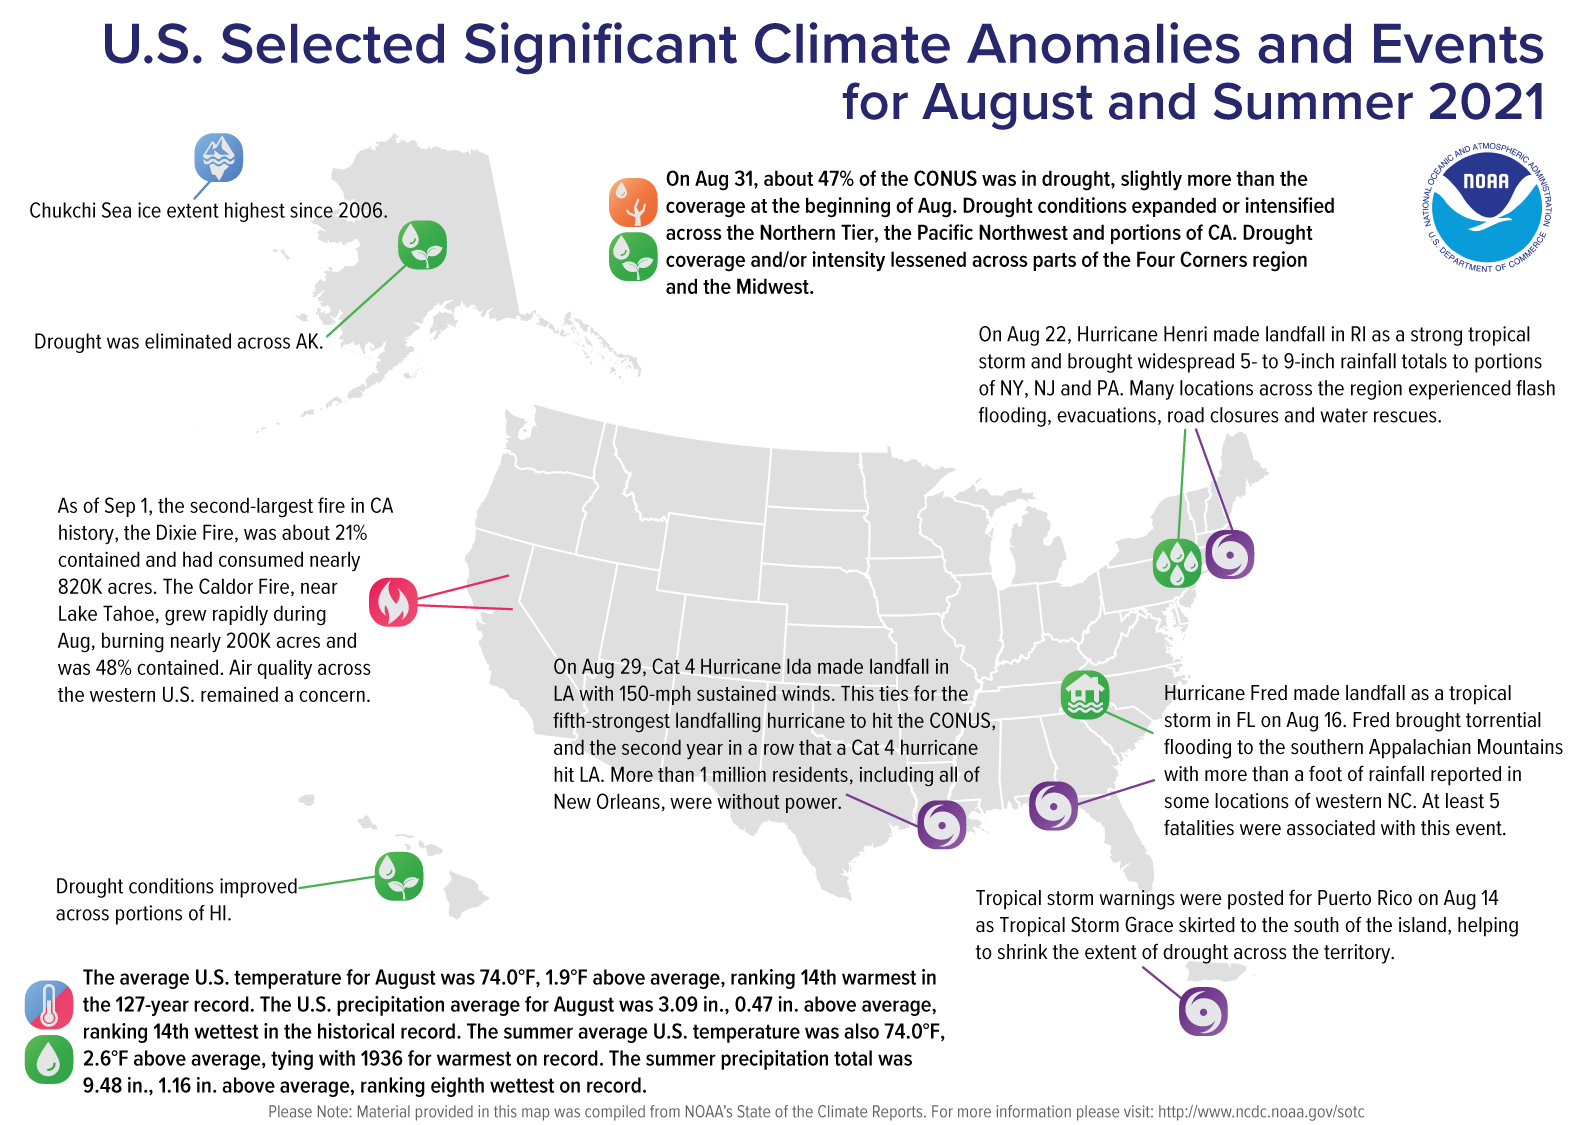
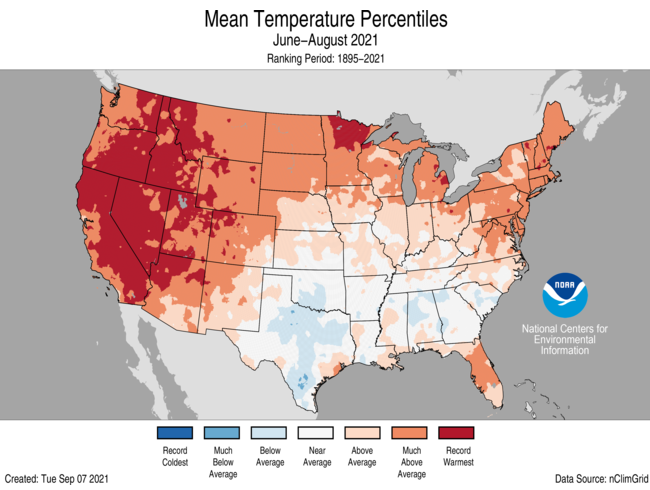
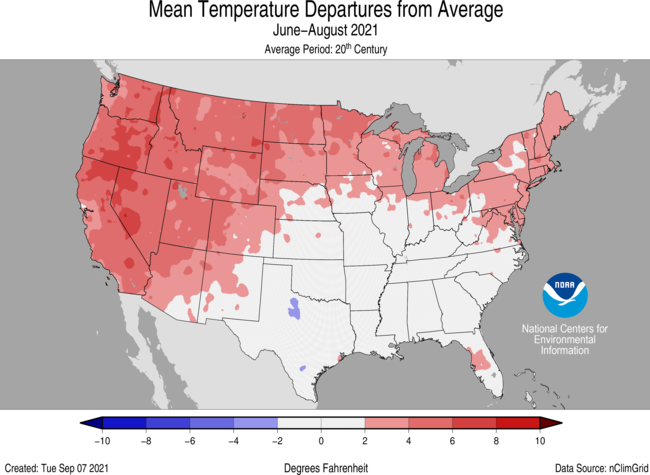
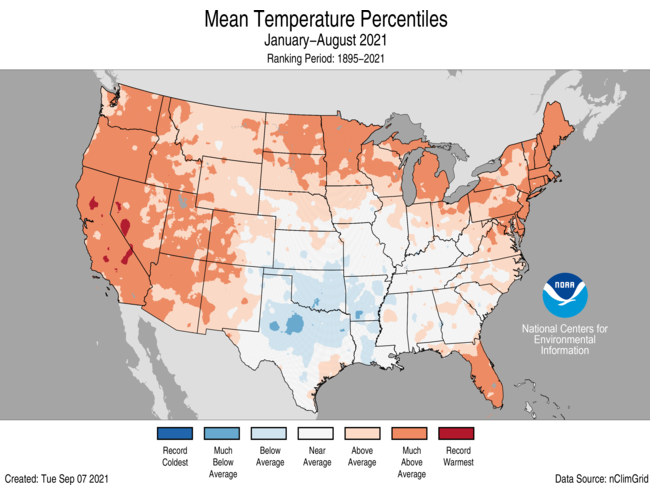
During meteorological summer (June-August), the average temperature for the Lower 48 was 74.0°F, 2.6°F above average, nominally eclipsing the extreme heat of the Dust Bowl in 1936 by nearly 0.01°F and essentially tying 1936 for the warmest summer on record. A record 18.4 percent of the contiguous U.S. experienced record-warm temperatures for this season. For August, the contiguous U.S. average temperature was also 74.0°F, 1.9°F above the 20th-century average and ranked as the 14th-warmest August on record. For the year to date, the contiguous U.S. temperature was 55.6°F, 1.8°F above the 20th-century average, ranking 13th warmest in the January-August record.
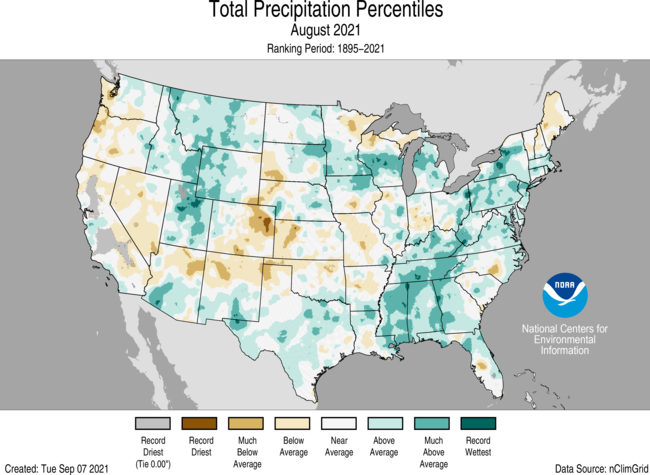
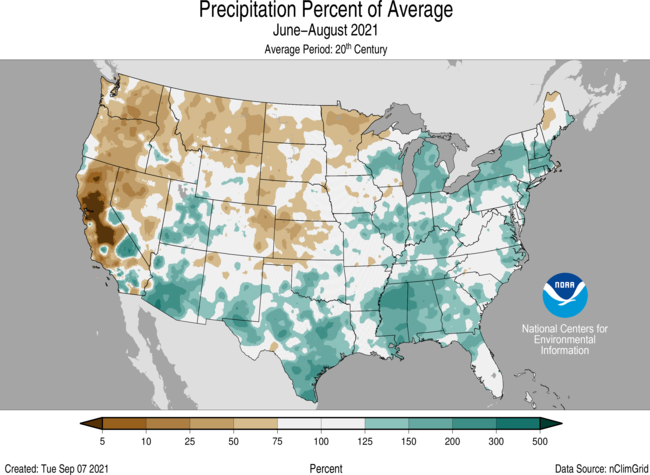
The summer precipitation total across the Lower 48 was 9.48 inches, 1.16 inches above average, ranking eighth wettest in the historical record. The August precipitation total for the contiguous U.S. was 3.09 inches, 0.47 inch above average, ranking 14th wettest in the 127-year period of record. The year-to-date precipitation total across the contiguous U.S. was 21.19 inches, 0.48 inch above the long-term average, ranking in the middle third of the January-August record.
Devastating flash flooding and fatalities resulted from multiple events during August including Tropical Storm Fred in western North Carolina, convective flooding from a complex of storms across middle Tennessee, Hurricane Ida across Louisiana and portions of the Northeast in early September and from Tropical Storm Henri, also across parts of the Northeast. With 35 fatalities accounted for during August*, it was the deadliest month for flooding across the U.S. since Hurricane Harvey in 2017.
Wildfires continued to spread across the western U.S. during August as the Dixie Fire in north-central California became the second-largest fire in the state’s history. The Caldor Fire also in California grew rapidly during August, threatening South Lake Tahoe communities. Air quality remained a concern across the U.S. as ash and fine particulates from the many wildfires obscured the skies.
*The remnants of Hurricane Ida impacted the Northeast in early September, raising the 2021 fatality count outside of the August observation period.
This monthly summary from NOAA National Centers for Environmental Information is part of the suite of climate services NOAA provides to government, business, academia and the public to support informed decision-making.
August
Temperature
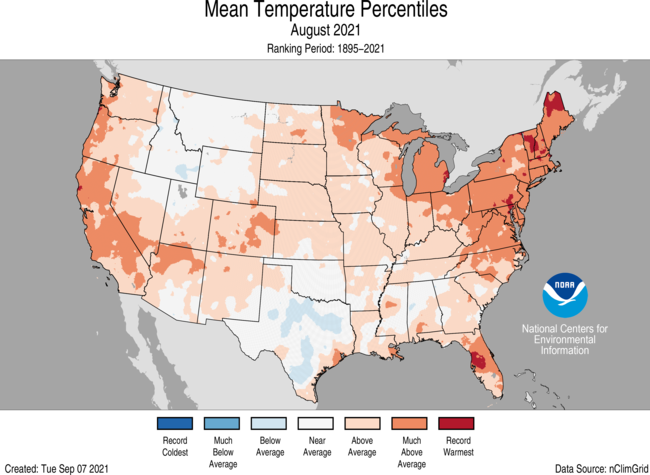
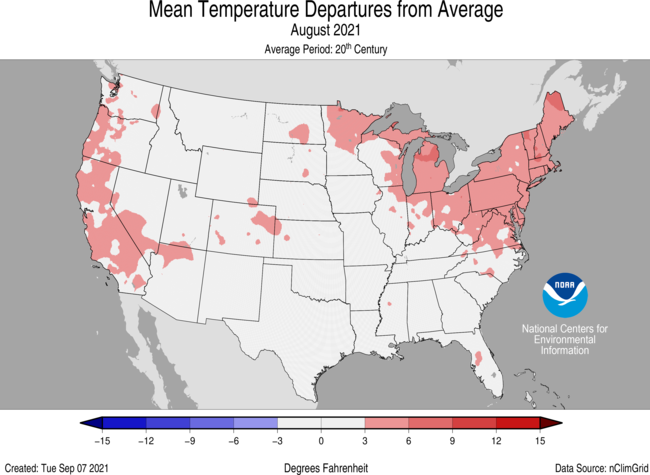
August temperatures were above average across the West Coast, Southwest and from the Plains to the East Coast. Vermont and New Hampshire both had their warmest August on record while Maine and Massachusetts ranked second warmest. Much of the above-average warmth can be attributed to warm overnight temperatures. Temperatures were near to below average across much of the northern Rockies and the southern Plains.
The Alaska average August temperature was 49.4°F, 0.1°F below the long-term mean, ranking in the middle third of the 97-year period of record for the state. Temperatures were above average across portions of the Southeast Interior, Panhandle and Aleutian regions. Temperatures were cooler than average across the North Slope, Northeast Interior, northern West Coast and parts of Bristol Bay. A persistent cold low-pressure system over the northern Chukchi-Beaufort Seas during August contributed to the cooler-than-average temperatures and the largest observed sea ice extent over the Chukchi Sea since 2006.
Precipitation
Precipitation was above average across portions of the central and northern Rockies, the northern Plains, Great Lakes and from the Deep South to southern New England. Mississippi ranked fourth wettest while Tennessee had its fifth-wettest August on record. The Southwest monsoon continued to be active in August, eliminating much of the year-to-date precipitation deficit across the region. Tucson, Arizona, had its wettest August and second-wettest summer on record. Precipitation was below average across portions of the West, southern Rockies, central Plains, Midwest, northern Great Lakes and northern New England.
Statewide precipitation for Alaska was above average for August, but varied by region. Precipitation was below average across the Aleutians, Bristol Bay and Northwest Gulf regions while the interior regions, Northeast Gulf and Panhandle regions experienced above-average precipitation for the month.
According to the August 31 U.S. Drought Monitor report, approximately 46.6 percent of the contiguous U.S. was in drought, slightly more than the coverage at the beginning of August. Drought conditions expanded or intensified across the Northern Tier, the Pacific Northwest and portions of California. Drought coverage and/or intensity lessened across parts of the Four Corners region, the Midwest, Hawaii and Puerto Rico and was eliminated in Alaska.
An additional note on Hurricane Ida precipitation and temperature implications: As is typical with very heavy rainfall events, localized bands of very heavy rain may not be completely captured by the gauge-based observing network, which is the basis for this analysis. This circumstance can lead to an underrepresentation of actual rainfall totals. The issue can be compounded by disruptions to the observers’ ability to report values during or following a severe event and, in this case, several of our reporting stations posted missing data for both temperature and precipitation during this event. Additionally, quality assurance routines may flag large valid precipitation values as erroneous, resulting in underestimated values. NCEI is working to ensure all reports are indeed validated. As a result, a more complete accounting of the temperature statistics and precipitation across Louisiana during August will be available with the September report.
Summer (June-August)
Temperature
Summer temperatures were above average to record warmest from the West Coast to the Great Lakes and into the Northeast as well as across portions of the Mid-Atlantic and Gulf Coast. California, Nevada, Utah, Oregon and Idaho each reported their warmest June-August on record. Sixteen additional states had a top-five warmest summer on record. No state ranked below average for the summer season. Temperatures were below average across portions of the southern Plains and Southeast. Warm overnight temperatures heavily influenced the warm summer temperatures, especially across portions of the Southeast, where daytime temperatures were below average for the season.
The Alaska statewide average temperature for the summer was 51.4°F, 1.0°F above average and ranked in the warmest one-third of the 97-year record. Temperatures were warmer than average across much of the eastern half of the state as well as across the Aleutians and near average for much of the rest of the state.
Precipitation
Precipitation was above average across portions of the Great Basin and Southwest, from the southern Plains to the Great Lakes and across much of the eastern U.S. Mississippi had its wettest summer on record with Alabama, Michigan, New York and Massachusetts ranking among their five wettest summers on record. Precipitation was below average from the Northwest to the western Great Lakes and into the central Plains. Minnesota had its seventh-driest summer on record.
Precipitation in Alaska was above average across much of the northern half of the state as well as across portions of the Northeast Gulf and Panhandle regions. Precipitation was below average in the southwestern portion of the state. Kotzebue had its wettest summer on record, reporting 9.21 inches and besting the previous record, set in 1963, by nearly an inch. The wildfire season was well-below average with only 254,000 acres consumed — less than half of the median value.
Year-to-date (January-August)
Temperature
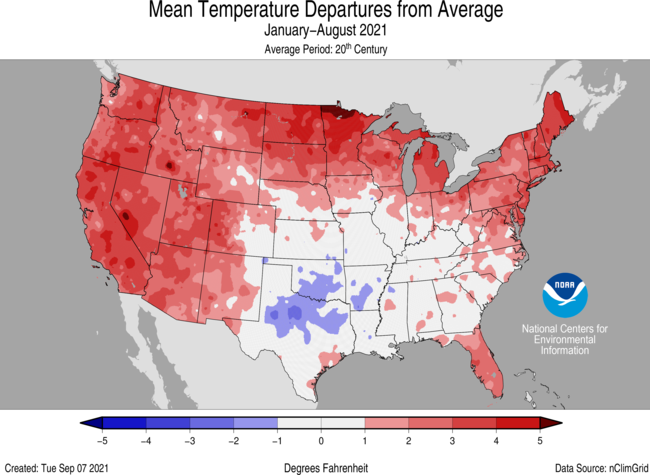
Year-to-date temperatures were above average from the West Coast to the Great Lakes and into the Northeast as well as across parts of the Mid-Atlantic and Southeast. California and Maine each reported their third-warmest January-August on record. Sixteen additional states had a top-ten warmest year-to-date period. Temperatures were below average across much of the southern Plains and lower Mississippi Valley.
Year-to-date temperatures across Alaska were near average with above-average temperatures observed across the southwestern portion of the state. Much of the rest of the state experienced near average temperatures for this period.
Precipitation
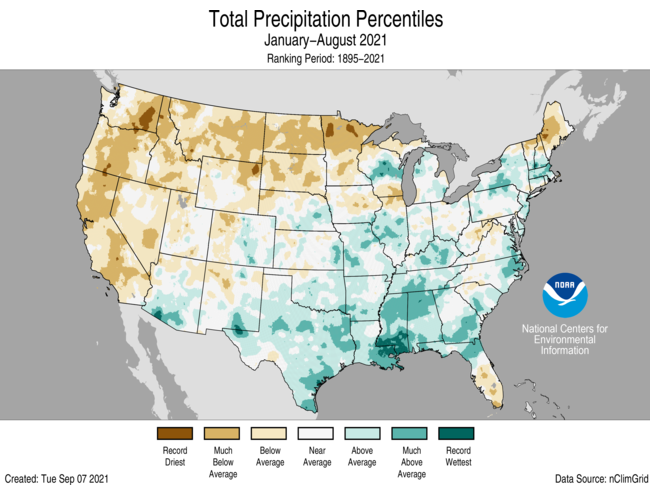
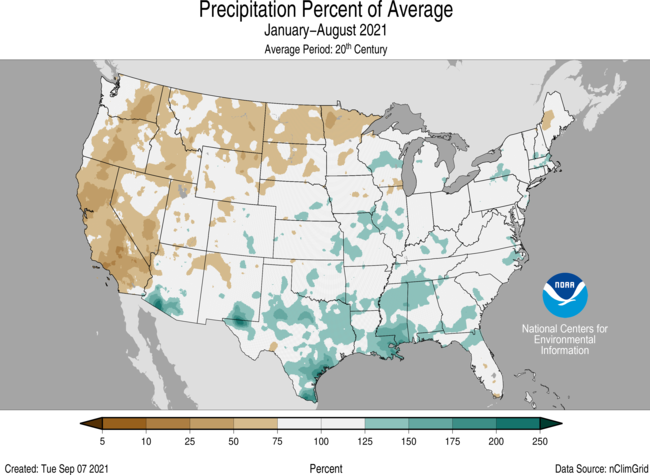
January-August precipitation was above average from the Deep South to the Midwest, across the Southeast and portions of the Northeast. Mississippi had its third-wettest such year-to-date period on record. Precipitation was below average from the West Coast to the western Great Lakes and across portions of northern New England. Montana ranked fifth driest while three additional states ranked among the driest 10 January-August periods on record.
For Alaska, January-August precipitation was above average across the West Coast, North Slope and from the Central Interior to the Panhandle. Precipitation was below average in parts of the Cook Inlet region.
For more detailed climate information, check out our comprehensive August 2021 U.S. Climate report scheduled for release on September 14, 2021.
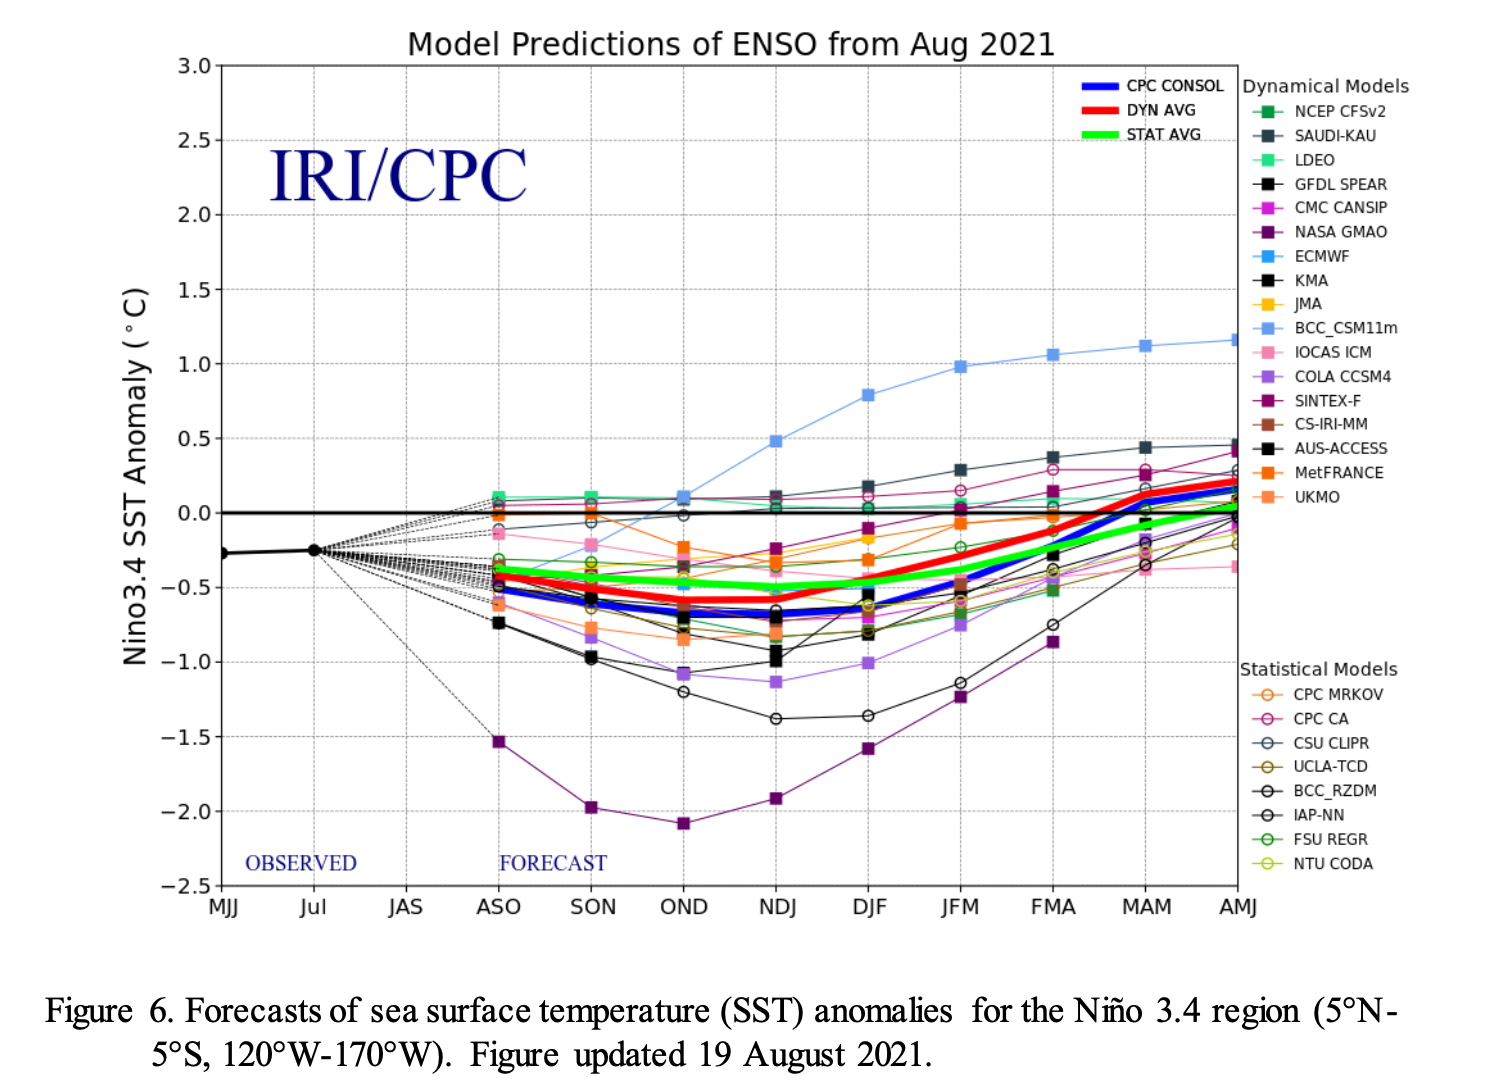
Synopsis: A transition from ENSO neutral to La Niña is favored in the next couple of months, with a 70-80% chance of La Niña during the Northern Hemisphere winter 2021-22.
In the last month, ENSO-neutral continued with near-to-below average sea surface temperatures (SSTs) persisting in the central and eastern equatorial Pacific. In the last week, all of the Niña index values ranged from -0.2oC to -0.3oC. Negative subsurface temperature anomalies (averaged from 180-100oW) remained steady in August, reflecting below-average temperatures that extended from the surface to ~250m depth in the eastern Pacific Ocean. Low-level wind anomalies were easterly over the western Pacific Ocean, while upper-level wind anomalies were westerly over the western and east-centralPacific. Tropical convection was suppressed near and west of the Date Line and enhanced over Indonesia. Given these conditions, the ocean-atmosphere system reflected ENSO-neutral, but is edging toward La Niña.
The IRI/CPC plume average of forecasts for the Niño-3.4 SST region from the last month favored borderline or weak La Niña during the fall and winter 2021-22. The forecaster consensus this month, however, favors the latest predictions from the NCEP CFSv2 and the North American Multi-Model Ensemble, which suggest higher chances for the emergence of La Niña. At this time, forecasters anticipate La Niña to be of weak strength (seasonal average Niño-3.4 index values between -0.5oC to – 0.9oC). In summary, a transition from ENSO-neutral to La Niña is favored in the next couple of months, with a 70-80% chance of La Niña during the Northern Hemisphere winter 2021-22 (click CPC/IRI consensus forecast for the chances in each 3-month period).
The dry bed of the Arkansas River near the Santa Fe Trail crossing at Cimarron, Kansas. The Ogallala aquifer groundwater levels in much of western Kansas started dropping in the 1950s as pumping increased, according to the Kansas Geological Survey. File Photo / Max McCoy
For decades, the Texas Panhandle was green with cotton, corn and wheat. Wells drew a thousand gallons (3,785 liters) a minute from the seemingly bottomless Ogallala aquifer, allowing farmers to thrive despite frequent dry spells and summer heat.
But groundwater that sustained generations is drying up, creating another problem across the Southern plains: Without enough rain or groundwater for crops, soil can blow away — as it did during the Dust Bowl of the 1930s.
“We wasted the hell out of the water,” says Muleshoe, Texas, farmer Tim Black, recalling how farmers irrigated when he was a kid. Water flooded furrows or sprayed in high arcs before farmers adopted more efficient center-pivot systems.
His grandfather could reach water with a post-hole digger. Black is lucky to draw 50 gallons (189 liters) a minute from wells up to 400 feet (122 meters) deep.
Now farmers are facing tough choices, especially in parts of Texas, New Mexico and Oklahoma.
Some are growing less-thirsty crops or improving irrigation. Others, like Black, are replacing some cash crops with cattle and pastureland.
And more are planting native grasses that go dormant during drought, while deep roots hold soil and green with the slightest rain…
Black, a former corn farmer, plants native grasses on corners of his fields, as pasture for cattle and between rows of wheat and annual grass.
The transition to cattle, he hopes, will allow his oldest son to stay on the land Black’s grandparents began plowing 100 years ago. His younger son is a data analyst near Dallas…
More than half the currently irrigated land in portions of western Texas, eastern New Mexico and the Oklahoma Panhandle could be lost by the end of the century, according to a study last year. And the central part of the aquifer could lose up to 40% of irrigated area by 2100.
Those losses might be slowed as farmers adapt to lower water levels, researchers say. But the projections underscore the need for planning and incentives in vulnerable areas.
The U.S. Department of Agriculture is prioritizing grasslands conservation in a “Dust Bowl Zone” in parts of Colorado, Kansas, New Mexico, Oklahoma and Texas.
But reestablishing native vegetation in the sandy soil over the Ogallala has proven difficult where irrigation ceased on former Kansas farmland. The same is true on land outside the Ogallala previously irrigated with river water, including in Colorado’s Arkansas River Valley.
Extended periods of drought that plagued the Southwest over the past 20 years likely will continue, says meteorologist Brad Rippey with the USDA.
So farmers may need to use some remaining groundwater to reestablish native grasses, says study co-author Meagan Schipanski, an associate professor of soil and crop sciences at Colorado State University.
Historic photo of the High Plains in Haskell County, Kansas, showing a treeless semi-arid grassland and a buffalo wallow or circular depression in the level surface. (Photo by W.D. Johnson, 1897)
In response to the severe drought conditions in the West and Great Plains, the U.S. Department of Agriculture (USDA) announced today its plans to help cover the cost of transporting feed for livestock that rely on grazing. USDA is updating the Emergency Assistance for Livestock, Honey Bees and Farm-raised Fish Program (ELAP) to immediately cover feed transportation costs for drought impacted ranchers. USDA’s Farm Service Agency (FSA) will provide more details and tools to help ranchers get ready to apply at their local USDA Service Center later this month.
“USDA is currently determining how our disaster assistance programs can best help alleviate the significant economic, physical and emotional strain agriculture producers are experiencing due to drought conditions,” said Agriculture Secretary Tom Vilsack. “The duration and intensity of current drought conditions are merciless, and the impacts of this summer’s drought will be felt by producers for months to come. Today’s announcement is to provide relief as ranchers make fall and winter herd management decisions.”
ELAP provides financial assistance to eligible producers of livestock, honeybees, and farm-raised fish for losses due to disease, certain adverse weather events or loss conditions as determined by the Secretary of Agriculture.
ELAP already covers the cost of hauling water during drought, and this change will expand the program beginning in 2021 to cover feed transportation costs where grazing and hay resources have been depleted. This includes places where:
Drought intensity is D2 for eight consecutive weeks as indicated by the U.S. Drought Monitor;
Drought intensity is D3 or greater; or
USDA has determined a shortage of local or regional feed availability.
Cost share assistance will also be made available to cover eligible cost of treating hay or feed to prevent the spread of invasive pests like fire ants.
Under the revised policy for feed transportation cost assistance, eligible ranchers will be reimbursed 60% of feed transportation costs above what would have been incurred in a normal year. Producers qualifying as underserved (socially disadvantaged, limited resource, beginning or military veteran) will be reimbursed for 90% of the feed transportation cost above what would have been incurred in a normal year.
A national cost formula, as established by USDA, will be used to determine reimbursement costs which will not include the first 25 miles and distances exceeding 1,000 transportation miles. The calculation will also exclude the normal cost to transport hay or feed if the producer normally purchases some feed. For 2021, the initial cost formula of $6.60 per mile will be used (before the percentage is applied), but may be adjusted on a state or regional basis.
To be eligible for ELAP assistance, livestock must be intended for grazing and producers must have incurred feed transportation costs on or after Jan. 1, 2021. Although producers will self-certify losses and expenses to FSA, producers are encouraged to maintain good records and retain receipts and related documentation in the event these documents are requested for review by the local FSA County Committee. The deadline to file an application for payment for the 2021 program year is Jan. 31, 2022.
Additional USDA Drought Assistance
USDA has authorized other flexibilities to help producers impacted by drought. USDA’s Risk Management Agency (RMA) extended deadlines for premium and administrative fee payments and deferred and waived the resulting interest accrual to help farmers and ranchers through widespread drought conditions in many parts of the nation. Additionally, RMA authorized emergency procedures to help streamline and accelerate the adjustment of losses and issuance of indemnity payments to crop insurance policyholders in impacted areas and updated policy to allow producers with crop insurance to hay, graze or chop cover crops at any time and still receive 100% of the prevented planting payment. This policy change supports use of cover crops, which improves soil health can help producers build resilience to drought.
Meanwhile, USDA’s Natural Resources Conservation Service (NRCS) provides technical and financial assistance to improve irrigation efficiency and water storage in soil, helping producers build resilience to drought. In response to drought this year, NRCS targeted $41.8 million in Arizona, California, Colorado and Oregon through Conservation Incentive Contracts, a new option available through the Environmental Quality Incentives Program, focused on drought practices.
USDA offers a comprehensive portfolio of disaster assistance programs. On farmers.gov, the Disaster Assistance Discovery Tool, Disaster Assistance-at-a-Glance fact sheet (PDF, 4.7 MB), and Farm Loan Discovery Tool can help producers and landowners determine all program or loan options available for disaster recovery assistance.
The rise of coronavirus variants has highlighted the huge influence evolutionary biology has on daily life. But how mutations, random chance and natural selection produce variants is a complicated process, and there has been a lot of confusion about how and why new variants emerge.
Until recently, the most famous example of rapid evolution was the story of the peppered moth. In the mid-1800s, factories in Manchester, England, began covering the moth’s habitat in soot, and the moth’s normal white coloring made them visible to predators. But some moths had a mutation that made them darker. Since they were better camouflaged in their new world, they could evade predators and reproduce more than their white counterparts.
We are an evolutionary biologist and an infectious disease epidemiologist at the University of Pittsburgh who work together to track and control the evolution of pathogens. Over the past year and half, we’ve been closely following how the coronavirus has acquired different mutations around the world.
Coronaviruses use RNA to store information, and small changes in that genetic code can lead to new strains of the virus. Vchal/ iStock via Getty Images Plus
How a virus mutates
For any organism, including a virus, copying its genetic code is the essence of reproduction – but this process is often imperfect. Coronaviruses use RNA for their genetic information, and copying RNA is more error-prone than using DNA. Researchers have shown that when the coronavirus replicates, around 3% of new virus copies have a new, random error, otherwise known as a mutation.
Each infection produces millions of viruses within a person’s body, leading to many mutated coronaviruses. However, the number of mutated viruses is dwarfed by the much larger number of viruses that are the same as the strain that started the infection.
Nearly all of the mutations that occur are harmless glitches that don’t change how the virus works – and others in fact harm the virus. Some small fraction of changes may make the virus more infectious, but these mutants must also be lucky. To give rise to a new variant, it must successfully jump to a new person and replicate many copies.
The bottleneck of transmission is what limits the ability of a new variant to infect another person. Vaughn Cooper via Biorender, CC BY-ND
The small odds of a mutant being transmitted is called the “population bottleneck.” The fact that it is only a small number of the viruses that start the next infection is the critical, random factor that limits the probability that new variants will arise. The birth of every new variant is a chance event involving a copying error and an unlikely transmission event. Out of the millions of coronavirus copies in an infected person, the odds are remote that a fitter mutant is among the few that spread to another person and become amplified into a new variant.
Mutations have changed the structure of the spike protein, seen in red, and made the coronavirus better able to infect cells using the ACE2 receptor, seen in blue. Juan Gaertner/Science Photo Library via Getty Images
How do new variants emerge?
Unfortunately, uncontrolled spread of a virus can overcome even the tightest bottlenecks. While most mutations have no effect on the virus, some can and have increased how contagious the coronavirus is. If a fast-spreading strain is able to cause a large number of COVID-19 cases somewhere, it will start to out-compete less contagious strains and generate a new variant – just like the delta variant did.
Many researchers are studying which mutations lead to more transmissible versions of the coronavirus. It turns out that variants have tended to have many of the same mutations that increase the amount of virus an infected person produces. With more than a million new infections occurring every day and billions of people still unvaccinated, susceptible hosts are rarely in short supply. So, natural selection will favor mutations that can exploit all these unvaccinated people and make the coronavirus more transmissible.
Under these circumstances, the best way to constrain the evolution of the coronavirus is to reduce the number of infections.
Vaccines stop new variants
The delta variant has spread around the globe, and the next variants are already on the rise. If the goal is to limit infections, vaccines are the answer.
Even though vaccinated people can still get infected with the delta variant, they tend to experience shorter, milder infections than unvaccinated individuals. This greatly reduces the chances of any mutated virus – either one that makes the virus more transmissible or one that could allow it to get past immunity from vaccines – from jumping from one person to another.
Eventually, when nearly everyone has some immunity to the coronavirus from vaccination, viruses that break through this immunity could gain a competitive advantage over other strains. It is theoretically possible that in this situation, natural selection will lead to variants that can infect and cause serious disease in vaccinated people.
However, these mutants must still escape the population bottleneck. It is unlikely that vaccine-induced immunity will be the major player in variant emergence as long as there are lots of new infections occurring. It’s simply a numbers game, and for now, the modest benefit the virus would get from vaccine evasion is dwarfed by the vast opportunities to infect unvaccinated people.
The world has already witnessed the relationship between the number of infections and the rise of mutants. The coronavirus remained essentially unchanged for months until the pandemic got out of control. With relatively few infections, the genetic code had limited opportunities to mutate. But as infection clusters exploded, the virus rolled the dice millions of times and some mutations produced fitter mutants.
The best way to stop new variants is to stop their spread, and the answer to that is vaccination.