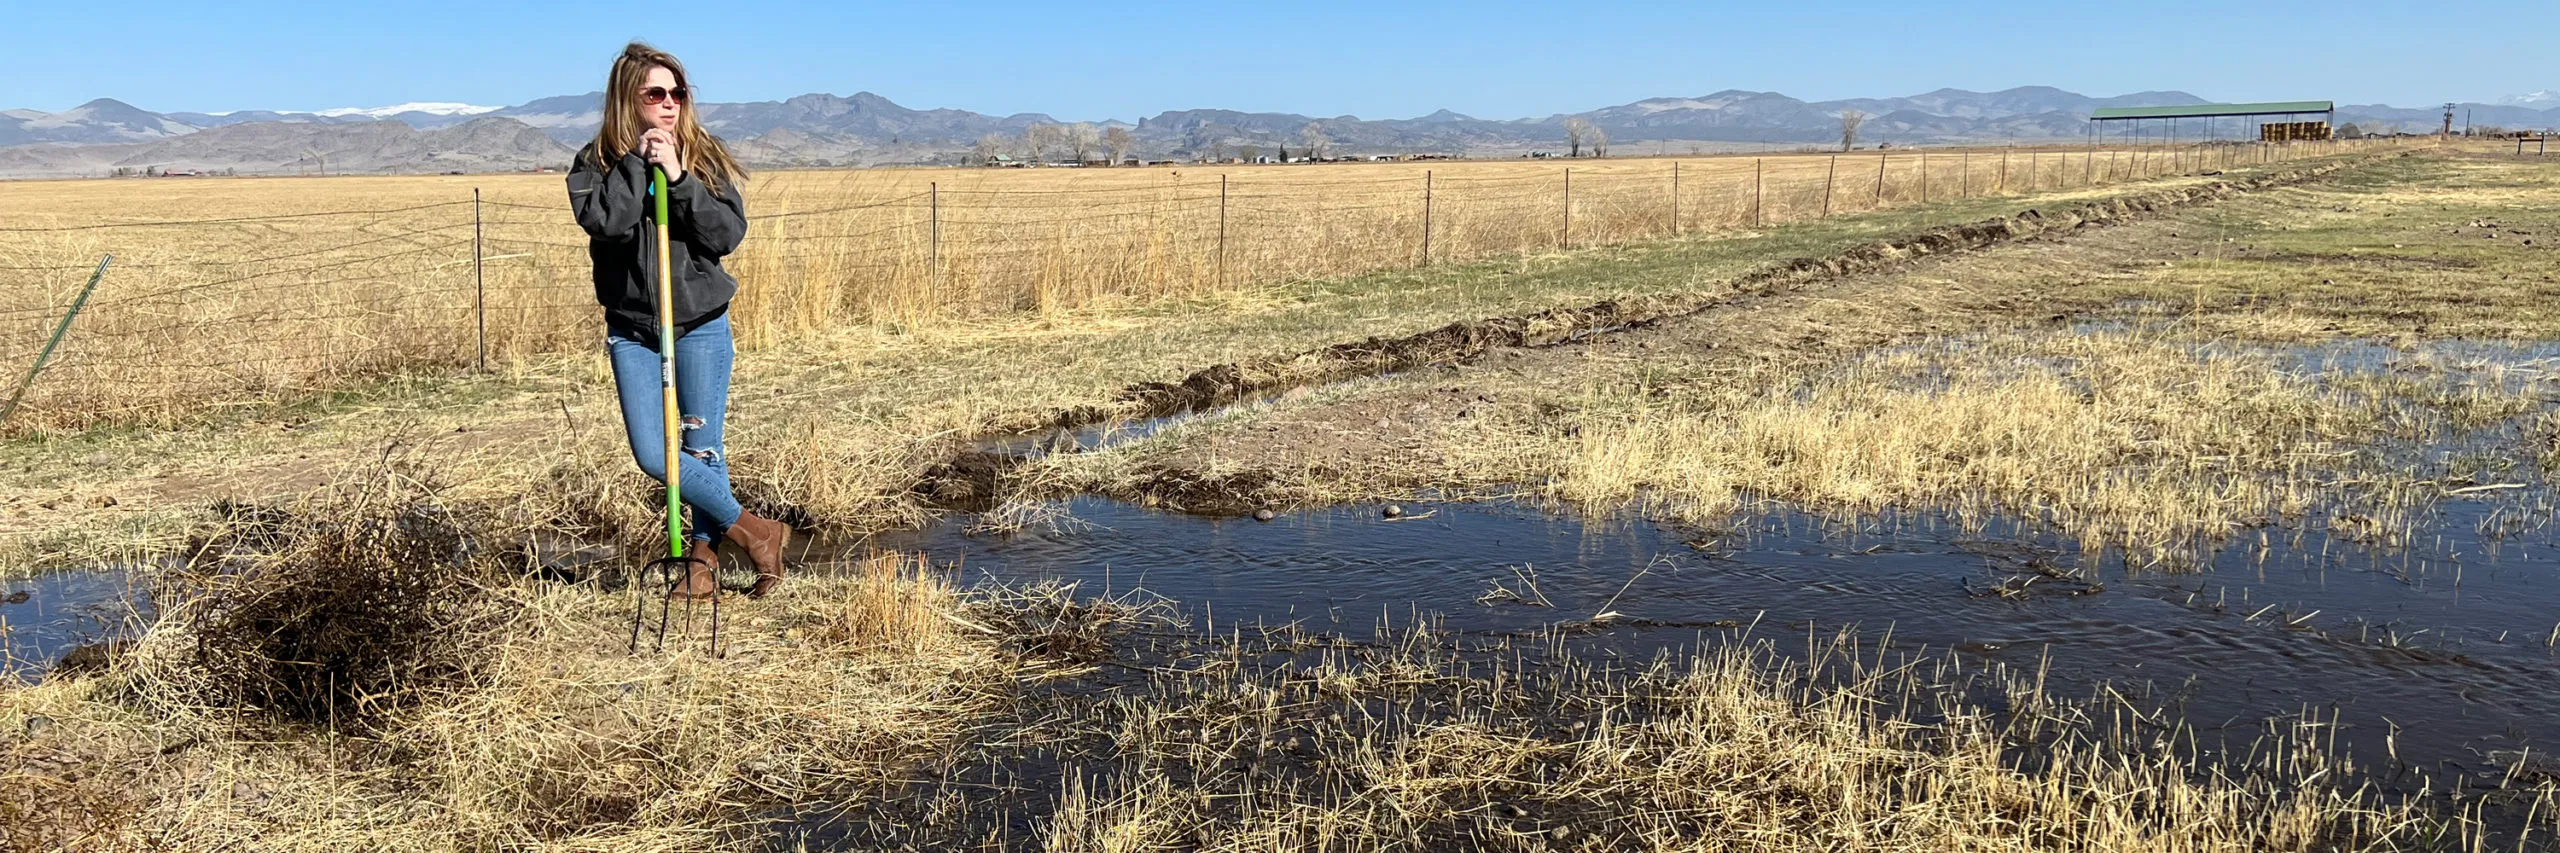
Subdistrict 1 Program Manager Marisa Fricke clears paths for water to flow onto land the subdistrict owns. The property is one of the subdistrict’s investments in recharging the aquifer. Photo credit: The Alamosa Citizen
MOTHER Nature will determine how much groundwater pumping occurs in ag-rich Subdistrict 1 of the Rio Grande Water Conservation District under a new plan of water management making its way to the state for approval.
The subdistrict and its parent Rio Grande Water Conservation District have been under pressure to bring the unconfined aquifer of the Upper Rio Grande Basin to a sustainable level or face curtailment of wells. The San Luis Valley has two aquifers – one unconfined and one confined.
In the draft of its new plan, which is the fourth amendment to the subdistrict’s Plan of Water Management, Subdistrict 1 members spell out the situation with the unconfined aquifer:
“Although the Subdistrict successfully remedied injurious depletions to senior surface water rights caused by groundwater withdrawals from Subdistrict Wells, it has not been successful in achieving and maintaining a Sustainable Unconfined Aquifer. This Plan is intended to address the now-apparent deficiencies of the previous Amended Plans of Water Management and adopts new means needed to achieve a Sustainable Unconfined Aquifer.
“The Subdistrict realizes that if more restrictive steps are not taken to achieve a Sustainable Unconfined Aquifer, the State Engineer will, at some point, be unable to approve a future Annual Replacement Plan, resulting in the curtailment of Subdistrict Wells. State Engineer denial of an Annual Replacement Plan could result in the curtailment of all Subdistrict Wells, causing severe negative impact on the agricultural economy of the Subdistrict and the San Luis Valley as a whole.”
The board of managers for Subdistrict 1 gave final approval to the plan on Tuesday. It now goes to the Rio Grande Water Conservation District Board for consideration. If approved there, it would be submitted to the Colorado Department of Water Resources and State Engineer Kevin Rein for review and approval.
“A lot of hard work has gone into this from everyone involved,” said Subdistrict 1 Board President Brian Brownell. “It’s been a struggle. Overall this is the best plan we could come up with.”
The amended plan relies on covering any groundwater withdrawals with natural surface water or the purchase of surface water credits.
The subdistrict is asking the state for 20 years to make the plan successful in recovering the aquifer, with a goal to restore 40,000 to 50,000 acre-feet a year over that 20-year period to bring the unconfined aquifer to a sustainable level.
TO get there the plan calls for a 1-to-1 augmentation, meaning for every acre-foot of water used, an acre-foot has to be returned to the unconfined aquifer through recharging ponds.
“Our pumping will be adjusted to whatever climate brings us,” said ex-officio board member Mike Kruse.
If the Valley experiences wet periods, groundwater pumping in Subdistrict 1 can match it. If the Valley continues with the persistent drought it has experienced over the past 20 years, groundwater pumping in the subdistrict will reflect the dryness.
“This plan takes into account the climate. That’s the beauty of it,” Kruse said
The predicament of the depleted unconfined aquifer is the result of the state granting too many well permits for groundwater pumping decades ago, now coupled with decades of drought going back to 2002.
“The state has to bear some responsibility,” said Subdistrict 1 board member James Cooley. “It isn’t all our fault.”
Subdistrict 1 Program Manager Marisa Fricke said the subdistrict had been making progress toward meeting the state’s goals with the unconfined aquifer up until 2018, when a particularly dry year hit the Valley. A wet 2019 brought some relief to the aquifer, but the subdistrict lost the progress it made after back-to-back dry years in 2020 and 2021, and now so far 2022.
The change in climate, said Brownell, has been the biggest factor in working to restore the unconfined aquifer. “It’s nothing anybody could have foreseen and that is why we’re addressing it.”
“This concept we have is probably the only way we can address climate,” said Subdistrict 1 Board Member Jake Burris. “With this plan we’re living within our means.”
Based on modeling conducted by Willem Schreuder, president of Principia Mathematica in Denver, there is a high level of confidence among farm operators that the new plan will succeed in meeting the state’s requirement of a sustainable unconfined aquifer. The earliest the amended plan would take effect is for the 2023 irrigation season.
Some farm operators in Subdistrict 1 are filing their own augmentation plans with the state Division 3 Water Court in lieu of joining a new amended plan by the conservation district.
Renewable Water Resources, in its discussions with Douglas County, has tried to use the unconfined aquifer condition in Subdistrict 1 to further its case by approaching farmers with buyouts for their water rights. The RWR water exportation proposal is not in Subdistrict 1, but that hasn’t stopped RWR from trying to leverage the situation to their advantage, telling Douglas County that farmers in the Valley are facing imminent widespread water well curtailments, which isn’t the case.
Douglas County Commissioner Abe Laydon made it a point in his recent visit to the San Luis Valley to bring up well shut downs as a reason why Douglas County could help the Valley by investing in Renewable Water Resources and buying out farmers and establishing a Valley-wide community fund.
A state Senate bill offered by Sen. Cleave Simpson, who also works as general manager of the Rio Grande Water Conservation District, would help address the strategy of retiring groundwater pumping wells in all the Valley’s subdistricts. If adopted – the proposed legislation has cleared major committee hurdles – the Compact Compliance Fund would make available at least $30 million to the Rio Grande Basin to help with groundwater sustainability measurements and would offer the Rio Grande Water Conservation District another pot of money to execute its strategies.
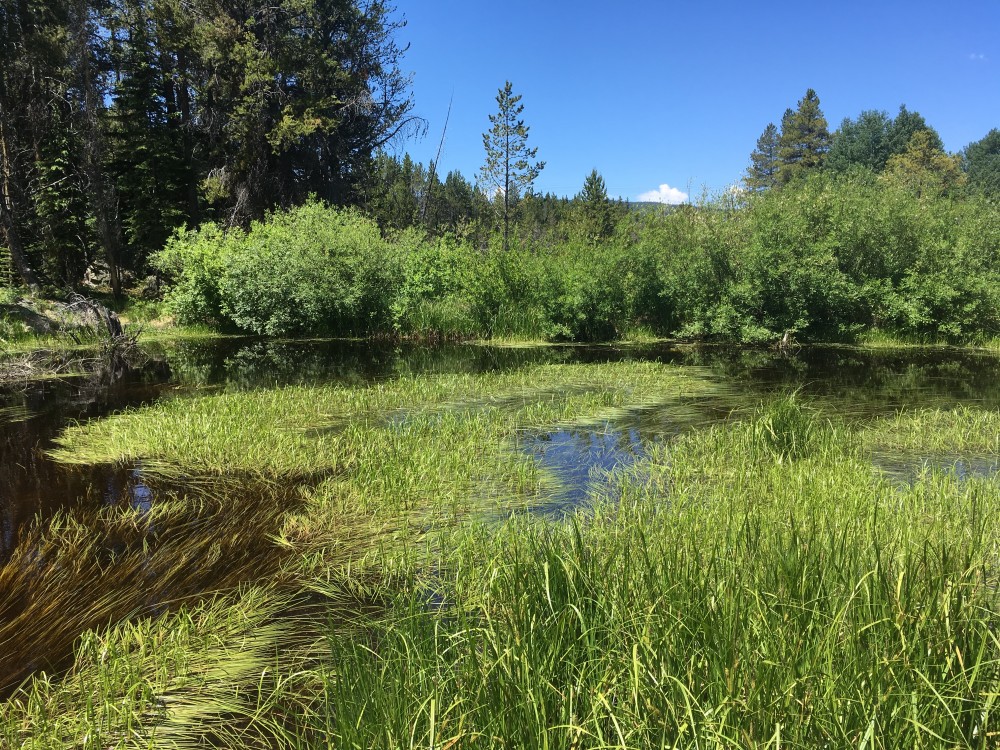
This beaver pond formed upstream of a partially breached beaver dam in the headwaters of Colorado’s Fryingpan River. The photo illustrates how even abandoned dams can support wetland habitat and capture sediment in mountain watersheds. Photo Credit: Sarah Marshall
Click the link to access the paper on the WIREs website (Chris E. Jordan, Emily Fairfax). Here’s the abstract:
Rivers and streams, when fully connected to their floodplains, are naturally resilient systems that are increasingly part of the conversation on nature-based climate solutions. Reconnecting waterways to their floodplains improves water quality and quantity, supports biodiversity and sensitive species conservation, increases flood, drought and fire resiliency, and bolsters carbon sequestration. But, while the importance of river restoration is clear, beaver-based restoration—for example, strategic coexistence, relocation, and mimicry—remains an underutilized strategy despite ample data demonstrating its efficacy. Climate-driven disturbances are actively pushing streams into increasingly degraded states, and the window of opportunity for restoration will notstay open forever. Therefore, now is the perfect time to apply the science of beaver-based low-tech process-based stream restoration to support building climate resilience across the landscape. Not every stream will be a good candidate for beaver-based restoration, but we have the tools to know which ones are. Let us use them.
Click the link to read the article on the NOAA website (Michael Tippett and Tim Delsole):
This is a guest blog by Michael Tippett (professor at Columbia University) and Tim DelSole (professor at George Mason University), adapted from material in their new text book Statistical Methods for Climate Scientists.
Predictability is a word that often comes up in discussions here on the ENSO Blog (another is variability). Let’s see if we can understand what climate scientists mean by predictability without having to read an entire book on statistics! As you might guess, climate scientists use the word predictability a little differently than the rest of the world. For instance, you might say that I am predictable because I take the same path each day on my morning walk, with small variations. On the other hand, for a climate scientist concerned with predictability, the question is whether it’s possible to forecast how my walk tomorrow will differ from its usual path (footnote #1).
Predicting that I’ll take my usual path is a climatological forecast in the sense that it is based only on the long-term average (climate) of past events. For a climate scientist, predictability is all about how forecasts differ from the climatological forecast. In fact, if the climatological forecast of an event is the only forecast available, the climate scientist will say that the event is unpredictable. So, my morning walk could be predictable to you but unpredictable to a climate scientist.
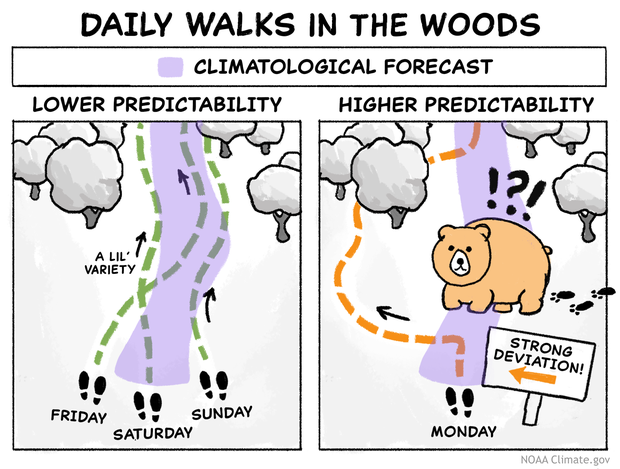
(left) If the only forecast we can make for a hiker’s path through the woods on a given day is that it will be similar to the long-term average, we call that outcome unpredictable. (right) If we can forecast occasions when a hiker’s path will deviate from the climatological path, we say the future path has some level of predictability. NOAA Climate.gov cartoon.
Note that, according to the climate scientist, forecasts of the sun rising tomorrow, nighttime being dark, winter being colder than summer, etc., get no credit in terms of predictability because they are climatological forecasts.
Flip a coin
Let’s consider an example of predictability we can agree on. I would say the outcome of a coin toss is unpredictable, assuming a fair coin, and no funny business on the part of the person tossing the coin. Why do I say it is unpredictable? Is it because the outcome is random and cannot be predicted? No, I can make a forecast of 50% chance of heads, and that is a perfectly fine (footnote #2a) and reliable forecast (footnote #2b). Is it because that forecast uses probabilities? Also no—weather and climate forecasts often use probabilities.
The reason I say the coin toss is unpredictable is because the 50/50 forecast is a climatological forecast. It does not tell us anything about this coin toss that is different from any other coin toss. In fact, a tell-tale sign for unpredictability is if our 50/50 forecast doesn’t change from one coin toss to another.
How can the coin toss help us to understand anything about the unpredictability of weather? Imagine I’m planning a 4th of July picnic, and I want to know whether or not it will rain here in Nyack, NY. Is that something that I can predict now in April? I’d say no. It’s unpredictable—the chaotic nature of the atmosphere means making a precise weather forecast two months ahead of time is essentially impossible. However, I do know that rain has been observed on 33% of past July 4ths during the period 1991–2020, so I can make a climatological forecast of a 33% chance of rain for my picnic. Since it’s a climatological forecast, it does not tell us anything new about 4th of July weather this year, and it doesn’t change from one year to another—the hallmark of unpredictability (footnote #3).
Does this mean that a climatological forecast is not useful? No, even for picnic planning a 33% chance tells me that I need to have an indoor backup plan, since rain is not uncommon. Moreover, the climatological forecast (or, more generally, the range of possible outcomes) is invaluable for long-term planning. Which crops as well as where and when to plant them, how much to charge for home insurance in hurricane-prone Florida, how high should the levees be in New Orleans, when should Walmart stock snow-pants—all these questions are answered by climatological forecasts.
Flip a coin—but this time, watch carefully
But wait, the coin toss has more to tell us about predictability. While its outcome under normal circumstances is unpredictable, the outcome is certainly more predictable if I use a high-speed camera to accurately capture the coin’s initial position and speed and then use the laws of physics to compute its trajectory. Good observations and science can increase predictability! The same is true about weather. If we know the state of the atmosphere today, we can use the laws of physics to predict its state in the future.
Under normal circumstances (left), a coin toss is unpredictable by climate standards—based on the long-term average, any single toss has a 50 percent chance of heads and a 50 percent chance of tails. Carefully measuring the coin’s initial position and speed and then using the laws of physics to predict its trajectory can increase the predictability. NOAA Climate.gov cartoon.
But if that’s the case, why is weather hard to predict? First, the world is a big place and measuring the initial state of the atmosphere (winds, temperatures, pressure, etc.) everywhere on the planet is hard, if not impossible, and the measurements that we do have contain errors. Second, limits in computing power and physical understanding mean that forecasts are based on approximations of the exact laws of physics. Third, there’s chaos and the butterfly effect (not just a movie) where errors in our initial estimate of the atmospheric state today have a big impact on our forecasts of next week’s weather.
What does this mean for my 4th of July weather forecast? Will the physics-based computer model forecasts be completely out to lunch? Will they tell me to expect snow while grilling? No—predictability limitations mean that I expect the forecast made now for the 4th of July will contain the same information as in a climatological forecast (i.e., that 33% chance of rain). The computer model will start with detailed information about today’s atmospheric state, and as forecasts go further into the future, they will contain fewer and fewer details that are specific to this year, until eventually the 4th of July forecast is little better than (and hopefully no worse) than a climatological forecast.
Model behavior
You can see this behavior in forecasts from the Global Ensemble Forecast System (GEFS), a weather model used by NOAA. Shown are two forecasts of temperature for a location in Texas. The forecasts were made on April 1 of 1999 and 2019. Looking at forecasts of the same period in two different years shows what features in the forecast are the same (climatological) and what features are different (evidence of predictability). For the first week or so, forecasts from the two years are well-separated, indicating predictability. By the second week, they’re nearly indistinguishable (no predictability). The periodic ups and downs every 24 hours are the diurnal cycle (e.g., afternoons tend to be warmer than evenings), and the forecasts get no credit for that in terms of predictability. (footnote #4)
Forecasts of near-surface temperature by the Global Ensemble Forecast System (GEFS) at a particular location in Texas every six hours for April 1, 1999 (pink) and April 1, 2019 (blue). For each year, the models used 11 slightly different initial conditions to represent the uncertainty of the initial state and the subsequent range of forecast outcomes. The periodic oscillations every 24 hours reflect the day-night cycle (e.g., afternoons tend to be warmer than evenings). For reference, days 2 and 13 are indicated by thin vertical lines. Forecasts from the two years become harder to distinguish as time goes on, indicating a decrease in predictability. NOAA Climate.gov figure, adapted from original by Michael Tippett and Tim DelSole.
Notice that I’m using a computer model to say something about the predictability of nature, which is like using mice to say something about humans, which can be useful, but is not exactly the same. In any case, scientists do use physics-based computer models and ensemble forecasts to measure predictability and to study predictability in different locations, times of the year, ENSO phases, over different time ranges (daily, monthly, seasonal, etc.), and future climates.
This (old) version of GEFS did not include a realistic ocean and therefore did not have ENSO. As readers of the ENSO blog are aware, the phase of ENSO can provide information about seasonal averages of temperature and precipitation (which is different from information about the weather on a particular day). For instance, looking at past La Niña winters shows how winter temperatures tend to differ from the climatology forecast. This fact plus the ability to predict the phase of ENSO in advance means that ENSO is a source of predictability. That is reflected in the CPC winter 2021–22 precipitation outlook which is similar to a typical La Niña pattern. (Note that when climate outlooks are framed in terms of above normal and below normal, the comparison with respect to the climatological forecast is built in.)
So, what can morning walks and coin tosses tell us about the climate perspective on predictability? Although handy for long range planning, climatological forecasts which are based on long-term averages or odds don’t change from year to another and don’t count toward predictability. A good combination of measurements (observations), the laws of physics, and computers can improve predictability of both coin tosses and weather forecasts. We can see the loss of predictability in physics-based computer model forecasts as specific initial conditions (a source of predictability in weather forecast) gradually fade into a climatological forecast. In climate forecasts, ENSO is a source of predictability, hilarity, and employment.
Lead Editor: Emily Becker, Cooperative Institute for Marine and Atmospheric Studies (CIMAS)
Footnotes
(1) The definition here of predictability is the one due to Edward N. Lorenz, where predictability is lost when a forecast is indistinguishable from a climatological one. This definition is also consistent with the statistical concept of independence and with information theory measures such as mutual information.
(2a) Although 50/50 is fine in practice, leave it to mathematicians to make it more complicated.
Diaconis, P., Holmes, S., & Montgomery, R. (2007). Dynamical Bias in the Coin Toss. SIAM review, 49(2), 211-235.
(2b) It is hard to say if a single probability forecast is correct or not. However, we can determine if a set of forecasts are well-calibrated or reliable. A set of forecasts are said to be reliable if the event predicted happens on average as often as predicted (the “on average” is why it is hard to say if a single probabilistic forecast was good or not). My forecasts are well calibrated if, for instance, it rains 70% of the time when I predict 70% chance of rain. Reliable forecasts mean what they say. https://projects.fivethirtyeight.com/checking-our-work/
(3) A climatological forecast is the same every year unless the climate is changing, in which case it might include those changes. If we know the climate is warming, do we get credit for predicting that trend? While information about trends is invaluable, it can be argued that in terms of predictability, the climate change signal should be included in the climatological forecast. So, credit in terms of utility, but not in terms of predictability. T. DelSole and M. K. Tippett, Predictability in a Changing Climate. Clim. Dyn., 51, 531-545, 2018. doi:10.1007/s00382-017-3939-8.
(4) Each year, 1999 and 2019, has 11 forecasts (an ensemble of forecasts) that start from 11 slightly different initial conditions to mimic uncertainty in the initial observations and to give a sense of the range of possible outcomes. Near the start on April 1, the forecast ensembles from each year are grouped tightly together. By April 14, the ensembles from each are more spread out, and by the end, forecasts from 1999 and 2019 are nearly indistinguishable, as we’d expect if the forecasts are heading toward a climatological forecast. Since everything else is the same, it’s reasonable to point to the initial conditions as being the source of predictability in the GEFS forecasts. See Hamill et al., 2013, for further details of the forecast system: Hamill, Thomas M., Gary T. Bates, Jeffrey S. Whitaker, Donald R. Murray, Michael Fiorino, Thomas J. Galarneau, Yuejian Zhu, and William Lapenta. “NOAA’s second-generation global medium-range ensemble reforecast dataset.” Bulletin of the American Meteorological Society 94, no. 10 (2013): 1553-1565.
Bonita Mine acid mine drainage. Photo via the Animas River Stakeholders Group.
Click the link to read the article on The Denver Post website (Conrad Swanson). Here’s an excerpt:
The Sunnyside Gold Corporation and its corporate owner will pay about $45 million under yet another settlement connected to the 2015 Gold King Mine spill, which dumped a yellow plume of heavy metals into the Animas River, federal officials announced Friday [April 29, 2022]. The federal government will kick in another $45 million as well. Under the finalized settlement, the company and its Canadian owner, Kinross Gold Corporation, will pay the United States $40.1 million and another $4 million to the Colorado Department of Public Health and Environment for cleanup efforts, Environmental Protection Agency spokesman Rich Mylott said in a release.
Cleanup is needed in the broader Bonita Peak Mining District Superfund site, in southwest Colorado’s San Juan County. That site includes dozens of abandoned mines, which are polluting the area’s waterways but it’s also the location of the 3-million-gallon spill at the Gold King Mine, which EPA officials triggered…
Already, cleanup efforts have cost more than $70 million, The Denver Post previously reported. Sunnyside also agreed to a $1.6 million settlement in December and agreed last year to pay $10 million to the Navajo Nation and $11 million to New Mexico, downstream of the mines and spill site.