Click the link to read the article on the EPA website:
This indicator measures trends in the amount and timing of snowpack in the western United States.
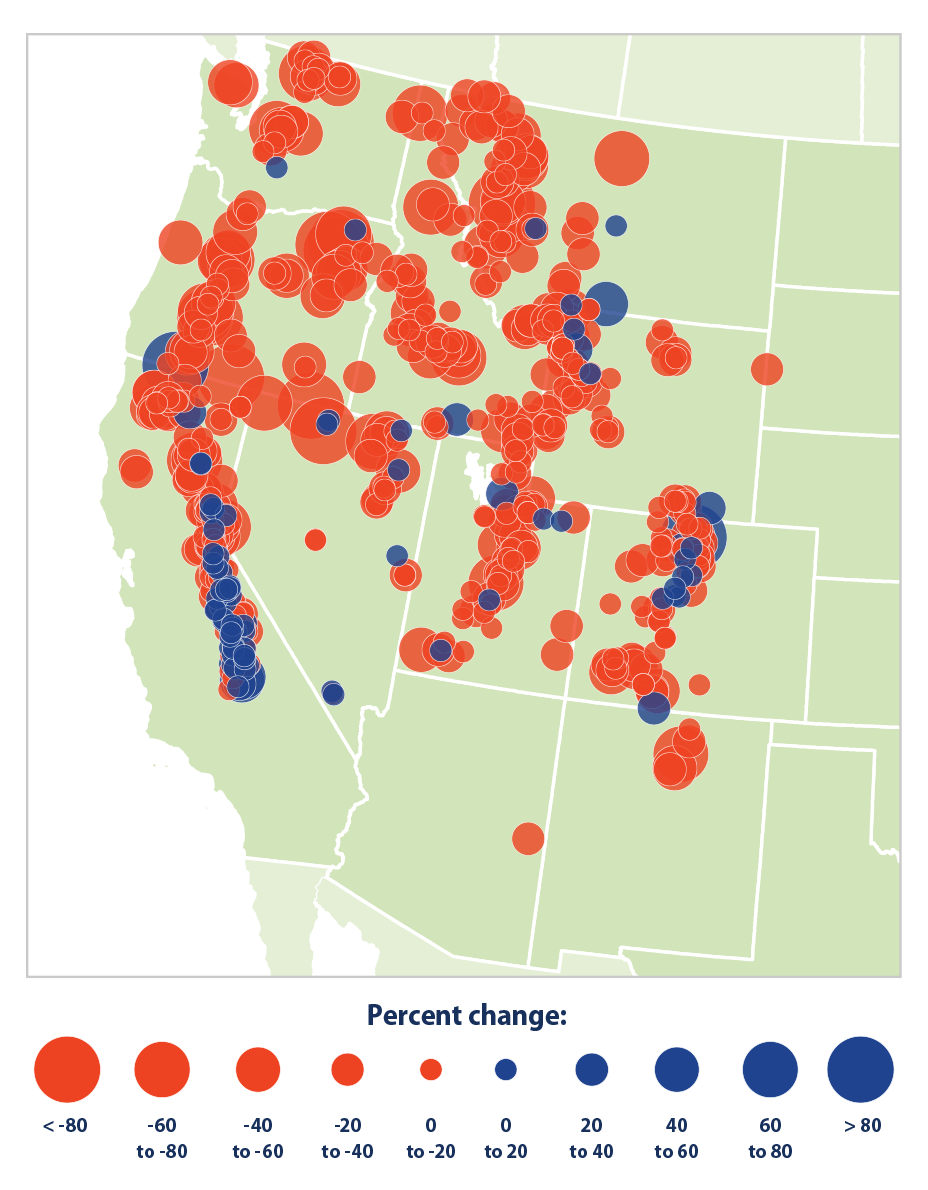
Figure 1. Trends in April Snowpack in the Western United States, 1955–2020
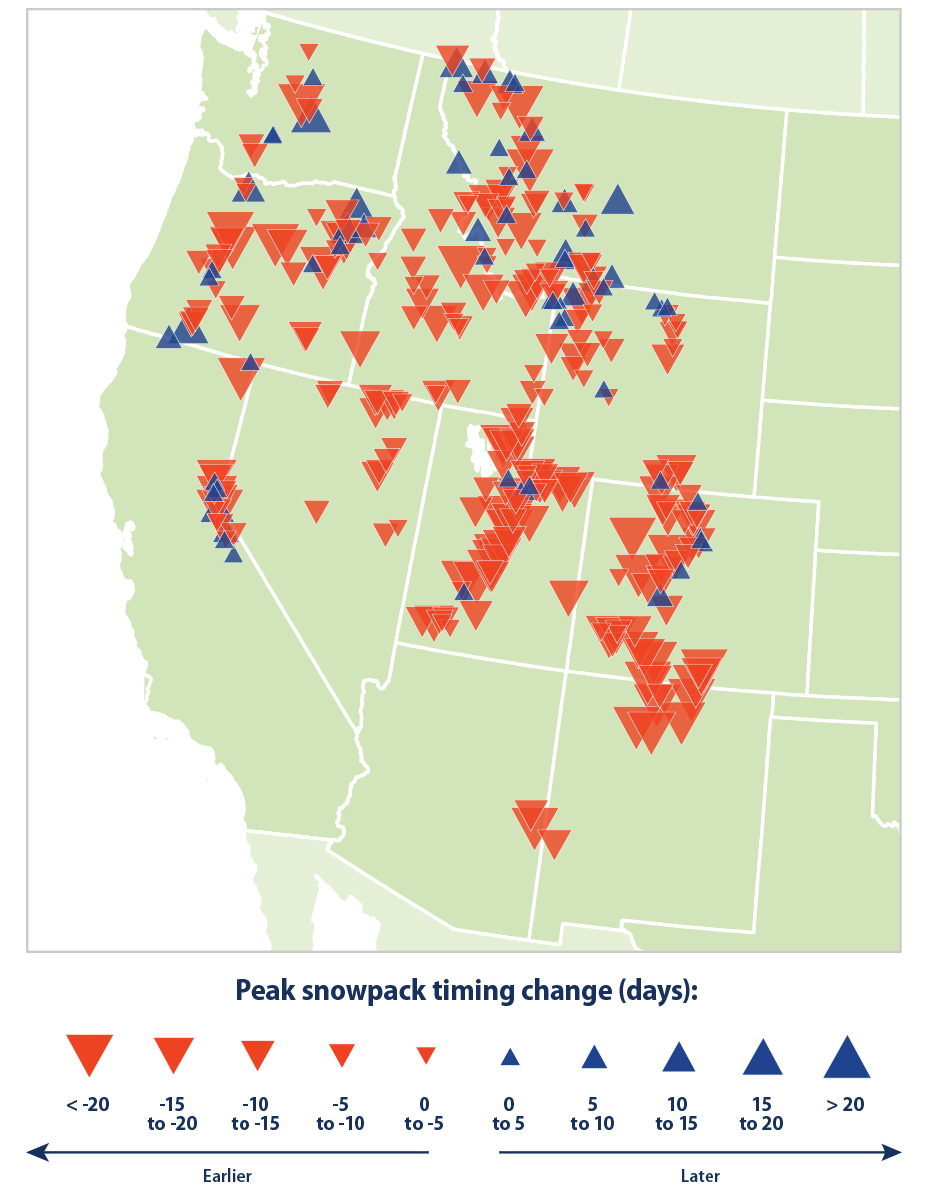
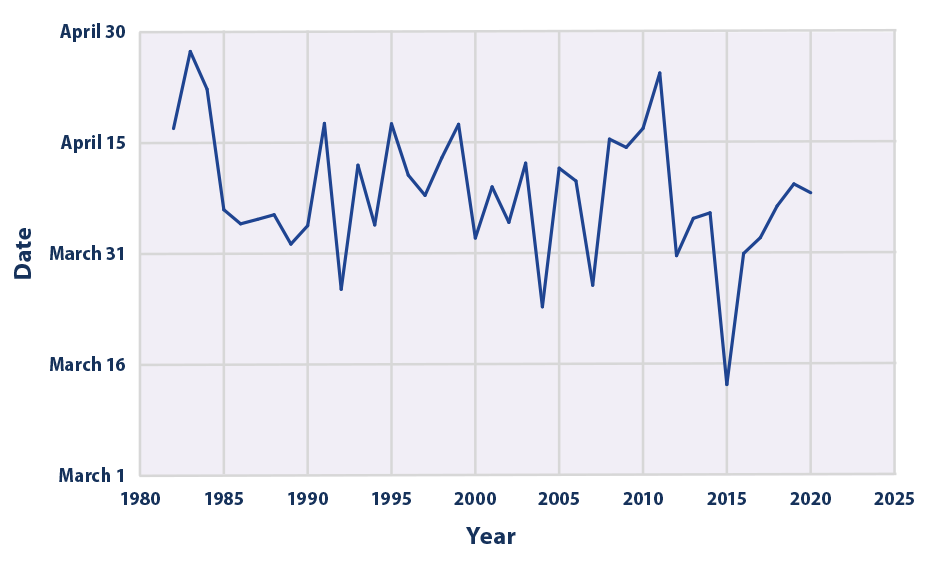
This map shows trends in April snowpack in the western United States, measured in terms of snow water equivalent. Blue circles represent increased snowpack; red circles represent a decrease. Data source: USDA Natural Resources Conservation Service, 20205 Web update: April 2021Figure 2. Change in Peak Snowpack Timing in the Western United States, 1982–2020Figure 3. Average Date of Peak Snowpack in the Western United States, 1982–2020
Key Points
From 1955 to 2020, April snowpack declined at 86 percent of the sites measured (see Figure 1). The average change across all sites amounts to about a 19 percent decline.
Large and consistent decreases in April snowpack have been observed throughout the western United States (see Figure 1). Decreases have been especially prominent in Washington, Oregon, northern California, and the northern Rockies.
While some stations have experienced increases in April snowpack, all 12 states included in this indicator experienced a decrease in snowpack on average from 1955 to 2020 (see Figure 1). In the Northwest (Idaho, Oregon, Washington), all but four stations saw decreases in snowpack over the period of record.
About 81 percent of sites have experienced a shift toward earlier peak snowpack (see Figure 2). This earlier trend is especially pronounced in southwestern states like Colorado, New Mexico, and Utah. Across all stations, peak snowpack has shifted earlier by an average of nearly eight days since 1982 (see Figure 3), based on the long-term average rate of change.
Background
Temperature and precipitation are key factors affecting snowpack, which is the amount or thickness of snow that accumulates on the ground. In a warming climate, more precipitation will be expected to fall as rain rather than snow in most areas—reducing the extent and depth of snowpack. Long-term observations across the contiguous 48 states show that nearly 80 percent of weather stations examined have experienced a decrease in the proportion of precipitation falling as snow (see the Snowfall indicator). In addition, with warmer winters and springs (see the Seasonal Temperature indicator), the seasonality of snowpack is also changing. Higher temperatures cause snow to melt earlier, which in turn affects the timing and availability of water.
Mountain snowpack plays a key role in the water cycle in western North America, storing water in the winter when the snow falls and releasing it as runoff in spring and summer when the snow melts. Millions of people in the West depend on the melting of mountain snowpack for hydropower, irrigation, and drinking water. In most western river basins, snowpack is a larger component of water storage than human-constructed reservoirs.1 Continued reductions in snowpack and shifts in snowmelt are expected in the future, which will reduce hydropower production in the Southwest and the Northwest.
Changes in mountain snowpack can affect agriculture, winter recreation, and tourism in some areas, as well as plants and wildlife. For example, certain types of trees rely on snow for insulation from freezing temperatures, as do some animal species. In addition, fish spawning could be disrupted if changes in snowpack or snowmelt alter the timing and abundance of streamflows. (For a look at long-term trends in the timing of spring snowmelt runoff in United States, see the Streamflow indicator.) Additionally, warming and earlier snowmelt accelerate the start of the wildfire season and promote more wildfire activity in the western United States and Alaska (see the Wildfires indicator). Altogether, snowpack’s sensitivity to climate and its many related effects make this a valuable indicator to track.
About the Indicator
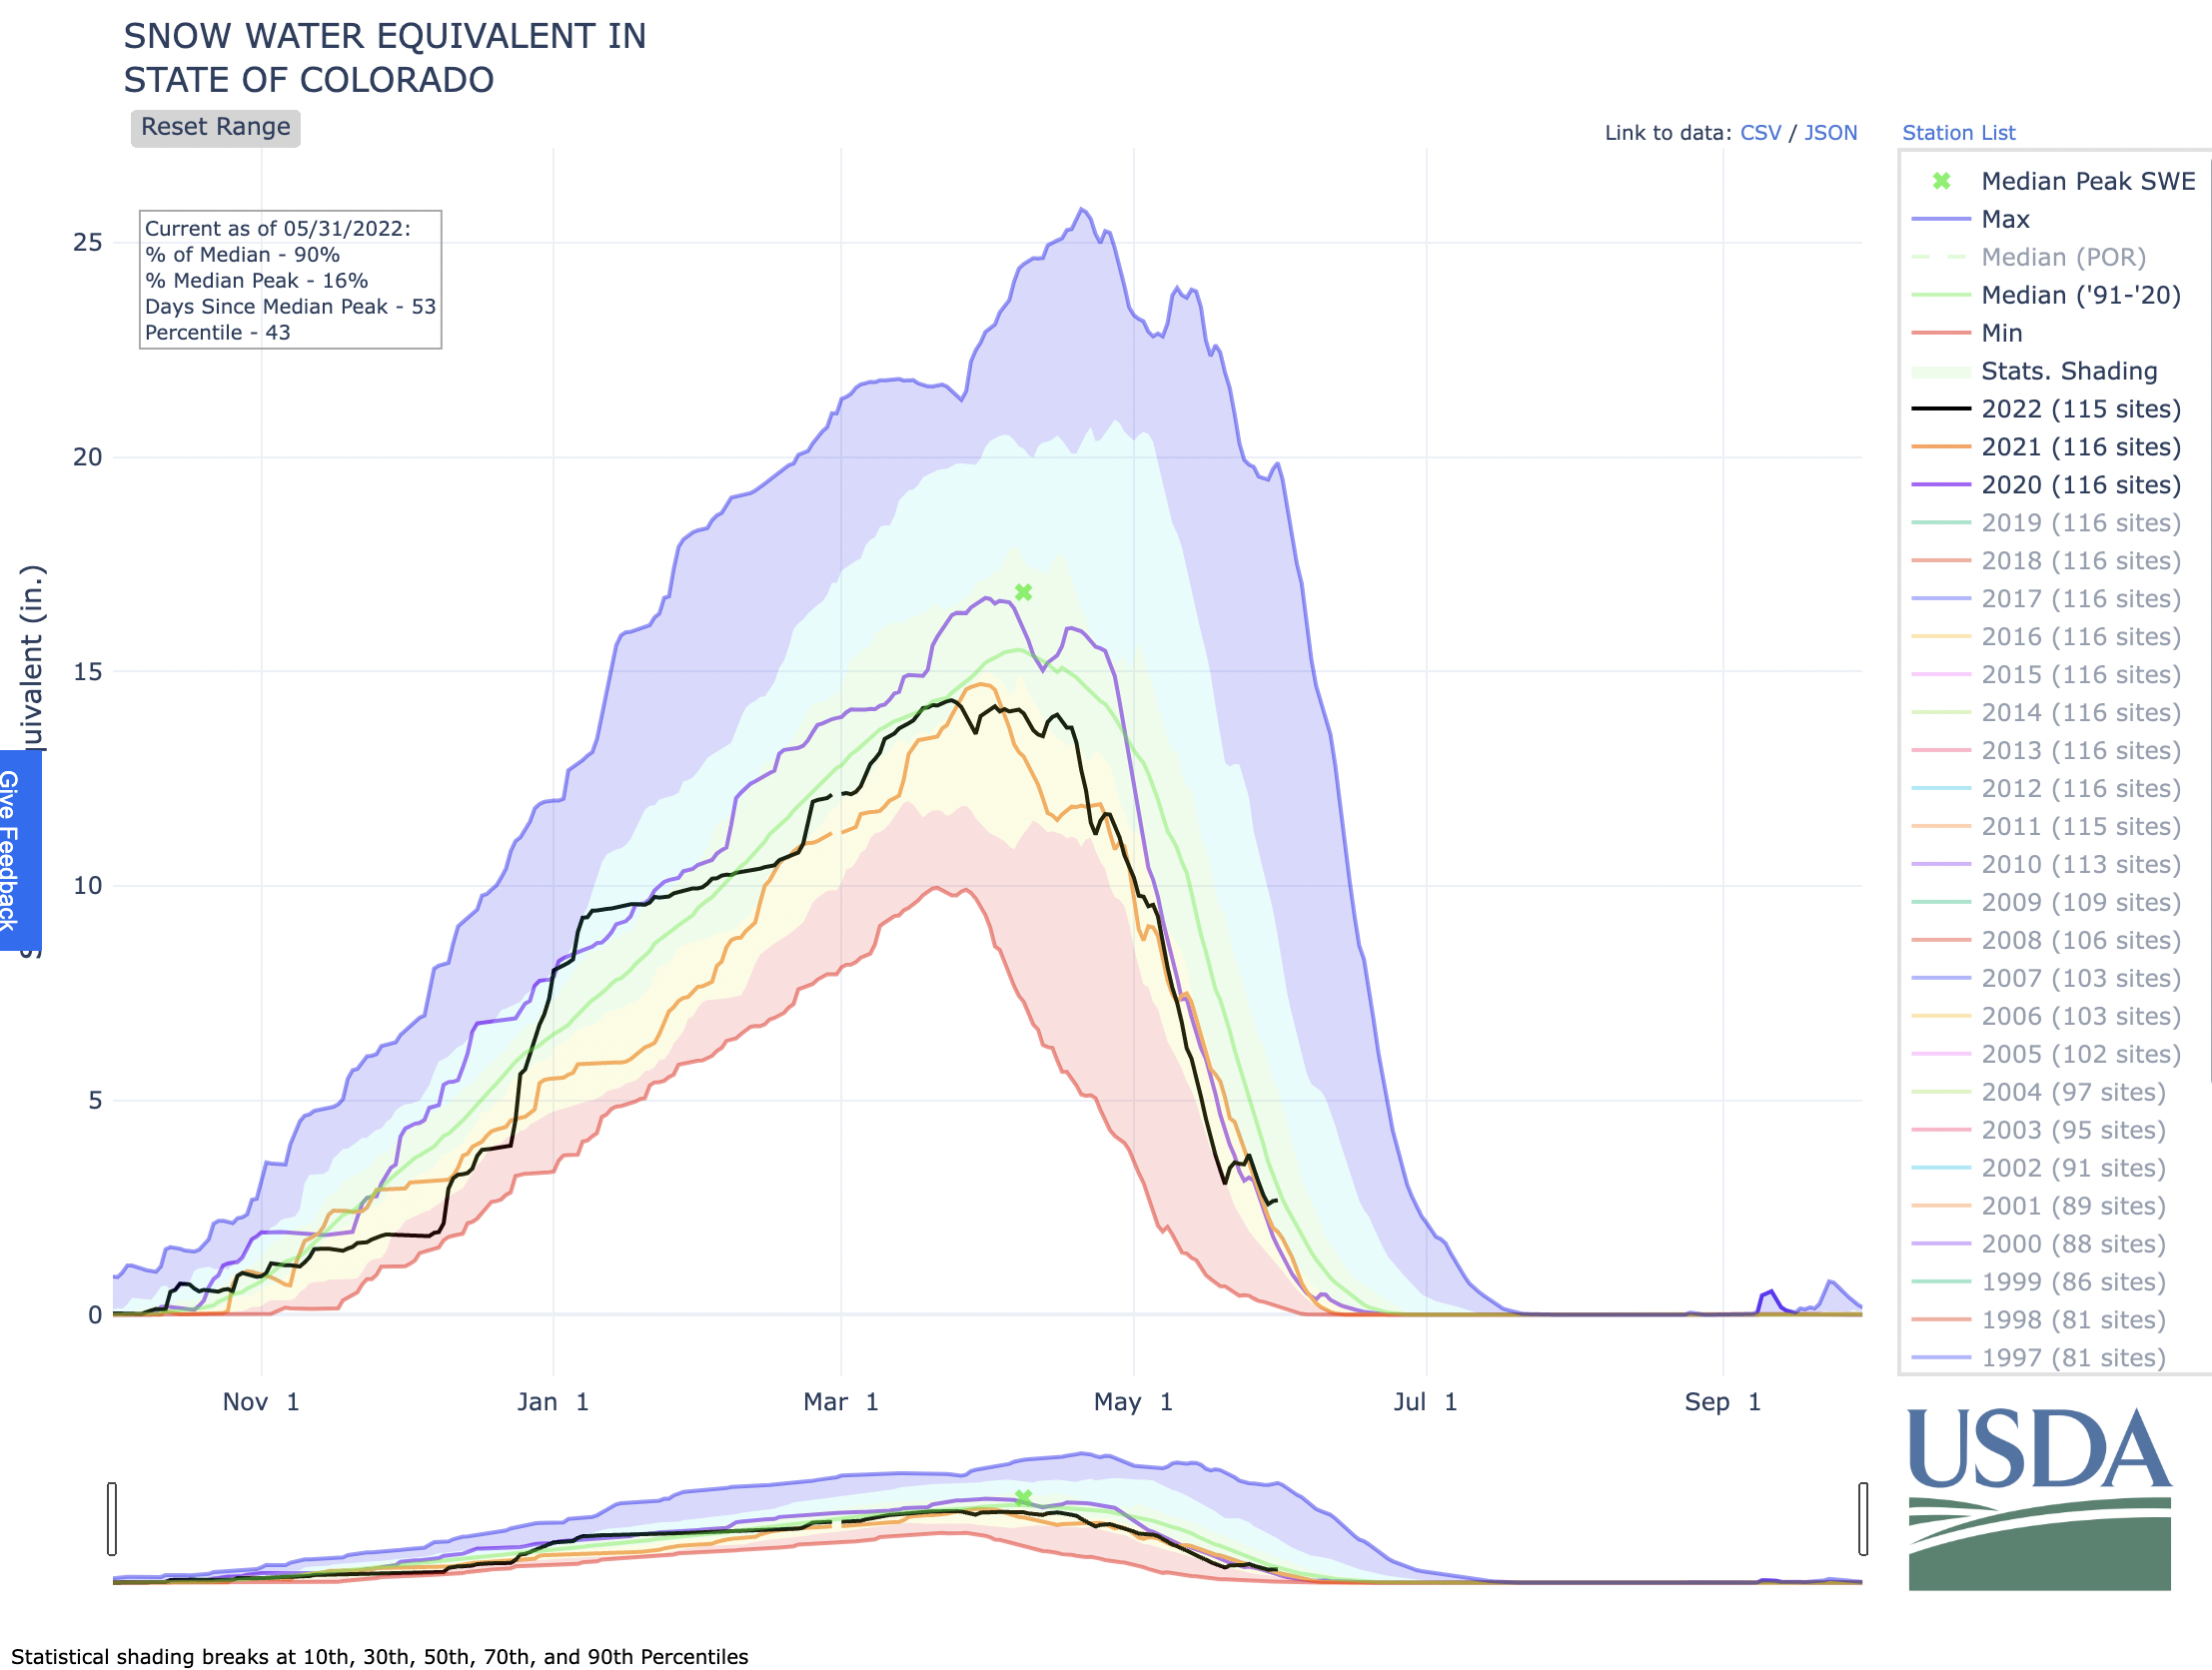
This indicator uses a measurement called snow water equivalent to determine trends in snowpack. Snow water equivalent is the amount of water contained within the snowpack at a particular location. It can be thought of as the depth of water that would result if the entire snowpack were to melt. Figure 1 shows long-term rates of change for April 1, the most frequent observation date, because it could reflect changes in precipitation, and it is extensively used for spring streamflow and water supply forecasting. Figures 2 and 3 focus on the day of each year when snowpack is at its deepest (that is, peak snowpack) to determine if it is occurring earlier or later.
The U.S. Department of Agriculture and other collaborators have measured snowpack since the early 1900s. In the early years of data collection, researchers measured snow water equivalent manually, but since 1980, measurements at some locations have been collected with automated instruments as part of the snow telemetry (SNOTEL) network. The long-term analysis in Figure 1 is based on data from nearly 700 permanent measurement sites in the western United States. The peak snowpack analysis shown in Figures 2 and 3 requires daily measurements, so it uses a smaller set of 328 SNOTEL sites that have data since 1982, which is when a large number of SNOTEL devices were deployed and came online.
-NEW- In light of the prolonged drought, low runoff conditions, and depleted storage at Lake Powell, the Department of the Interior implemented an action under Sections 6 and 7.D of the 2007 Interim Guidelines specifically reducing the Glen Canyon Dam annual releases to 7.00 maf in water year 2022. This action was undertaken in conjunction with 2022 Drought Response Operations Plan actions, which includes an additional 500 kaf release from Flaming Gorge. Together these actions are anticipated to add approximately one million additional acre-feet of storage to Lake Powell by April 2023.
The reduction of releases from Lake Powell from 7.48 maf to 7.00 maf in water year 2022 will result in a reduced release volume of 0.48 maf that normally would have been released from Glen Canyon Dam to Lake Mead as part of the 7.48 maf annual release volume, consistent with routine operations under the 2007 Interim Guidelines. The reduction of releases from Glen Canyon Dam in water year 2022 (resulting in increased storage in Lake Powell) will not affect future operating determinations and will be accounted for “as if” this volume of water had been delivered to Lake Mead.
Overview
Five-Year Probabilistic Projections of future conditions in the Colorado River system currently extend through 2026. They are typically updated every January, April, and August, while probabilistic results for the 2-year period are updated every month. The 5-Year Probabilistic Projections are generated using the Colorado River Mid-term Modeling System (CRMMS) in Ensemble Mode. CRMMS Ensemble Mode is driven by an ensemble of monthly unregulated streamflow forecasts developed by the National Weather Service Colorado Basin River Forecasting Center (CBRFC) using the Ensemble Streamflow Prediction (ESP) method. Results from CRMMS run with ESP are referred to as CRMMS-ESP.
The most recent 5-year projections of future Colorado River system conditions were produced using the following assumptions:
Initial Conditions: CRMMS is initialized with previous end-of-month reservoir elevations.
Hydrology: Upper Basin inflows are 30 unregulated inflow forecasts traces produced by the CBRFC using the ESP method, which relies on observed temperature and precipitation from 1991-2020. Lower Basin inflows are the historical intervening flows from 1991-2020 that align with the ESP traces.
Water Demand: Upper Basin demands are estimated and incorporated in the unregulated inflow forecasts provided by the CBRFC; Lower Basin demands are developed in coordination with the Lower Basin States and Mexico.
Policy: 2007 Interim Guidelines, Lower Basin Drought Contingency Plan, and Minute 323 are modeled reflecting Colorado River policies.
Drought Response Actions: CRMMS projections contain actions undertaken with the 2022 Drought Response Operations Plan and 2022 Glen Canyon Dam operational adjustment.
The 2022 Drought Response Operations Plan includes an additional release of 500 kaf from Flaming Gorge from May 2022 through April 2023.
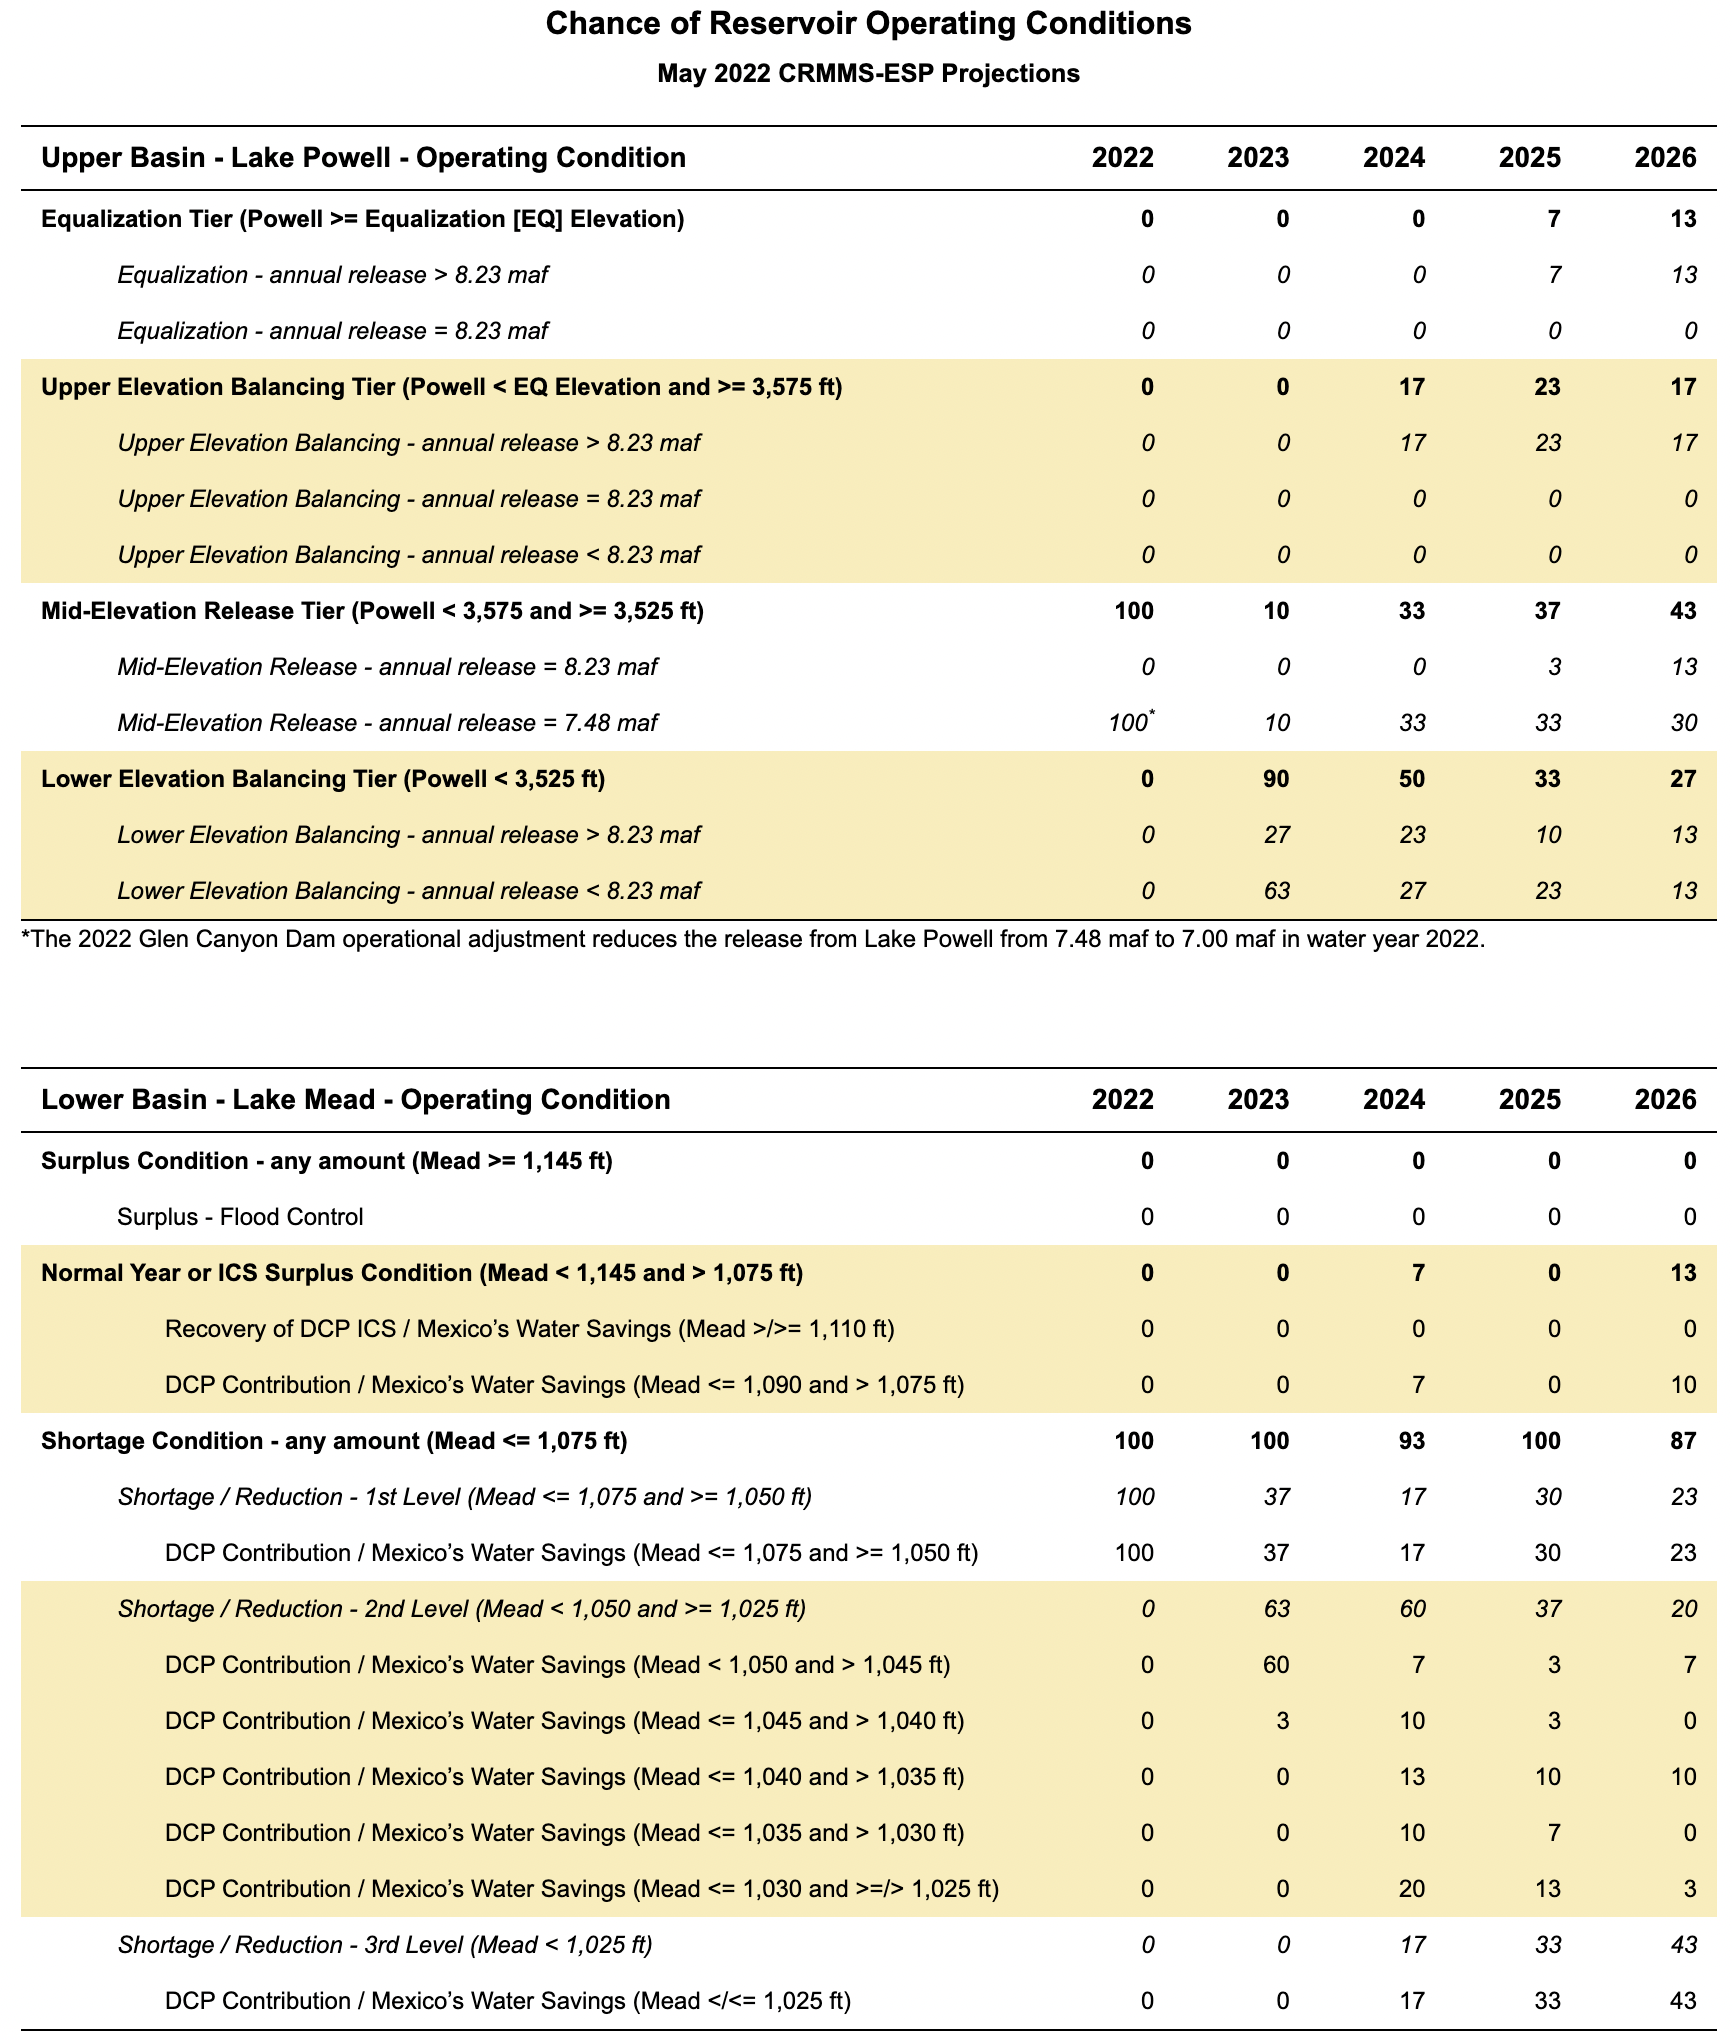
The 2022 Glen Canyon Dam operational adjustment reduces the releases from Lake Powell from 7.48 maf to 7.00 maf in water year 2022. This will result in a reduced release volume of 0.48 maf that normally would have been released from Glen Canyon Dam to Lake Mead as part of the 7.48 maf annual release volume, consistent with routine operations under the 2007 Interim Guidelines. The reduction of releases from Glen Canyon Dam in water year 2022 (resulting in increased storage in Lake Powell) will not affect future operating determinations and will be accounted for “as if” this volume of water had been delivered to Lake Mead. Recognizing that operational decisions for 2023 and beyond have not been made, for all hydrologic scenarios that project Glen Canyon Dam to operate in a balancing condition in a future water year, releases are simulated in a manner that attempts to preserve the benefits to Glen Canyon Dam facilities and operations.
Additional details are available in CRMMS Ensemble Mode page. All modeling assumptions and projections are subject to varying degrees of uncertainty. Please refer to this discussion of uncertainty for more information.
Projections
5-Year Probabilistic Projections presented in the tables below are reported as the percentage of projected Lake Powell and Lake Mead operations that fall below critically low elevations or are within each operational tier in the next five years.
Click the graphic to enlarge.Click the graphic to enlarge.