Click the link to read the release on the NOAA website:
Greenhouse gas pollution caused by human activities trapped 49% more heat in the atmosphere in 2021 than they did in 1990, according to NOAA scientists.
NOAA’s Annual Greenhouse Gas Index, known as the AGGI, tracks increases in the warming influence of human emissions of heat-trapping gases, including carbon dioxide, methane, nitrous oxide, chlorofluorocarbons, and 16 other chemicals. The AGGI converts the complex scientific computations of how much extra heat these gases capture into a single number that can easily be compared to previous years and tracks the rate of change.
This graph depicts the relative contributions of the major greenhouse gas pollutants to global warming, in watts per square meter along the left axis. The NOAA Annual Greenhouse Gas Index (AGGI) is shown on the right axis. Credit: NOAA Global Monitoring Laboratory
The AGGI is indexed to 1990, the baseline year for the Kyoto Protocol and the year the first IPCC Scientific Assessment of Climate Change was published.
“The AGGI tells us the rate at which we are driving global warming,” said Ariel Stein, the acting director of NOAA’s Global Monitoring Laboratory (GML). “Our measurements show the primary gases responsible for climate change continue rising rapidly, even as the damage caused by climate change becomes more and more clear. The scientific conclusion that humans are responsible for their increase is irrefutable.”
In 2021, the AGGI reached a value of 1.49, which means that human-emitted greenhouse gases trapped 49% more heat in the atmosphere than in 1990. Because it is based primarily on highly accurate measurements of greenhouse gases in air samples collected around the globe, the result contains little uncertainty.
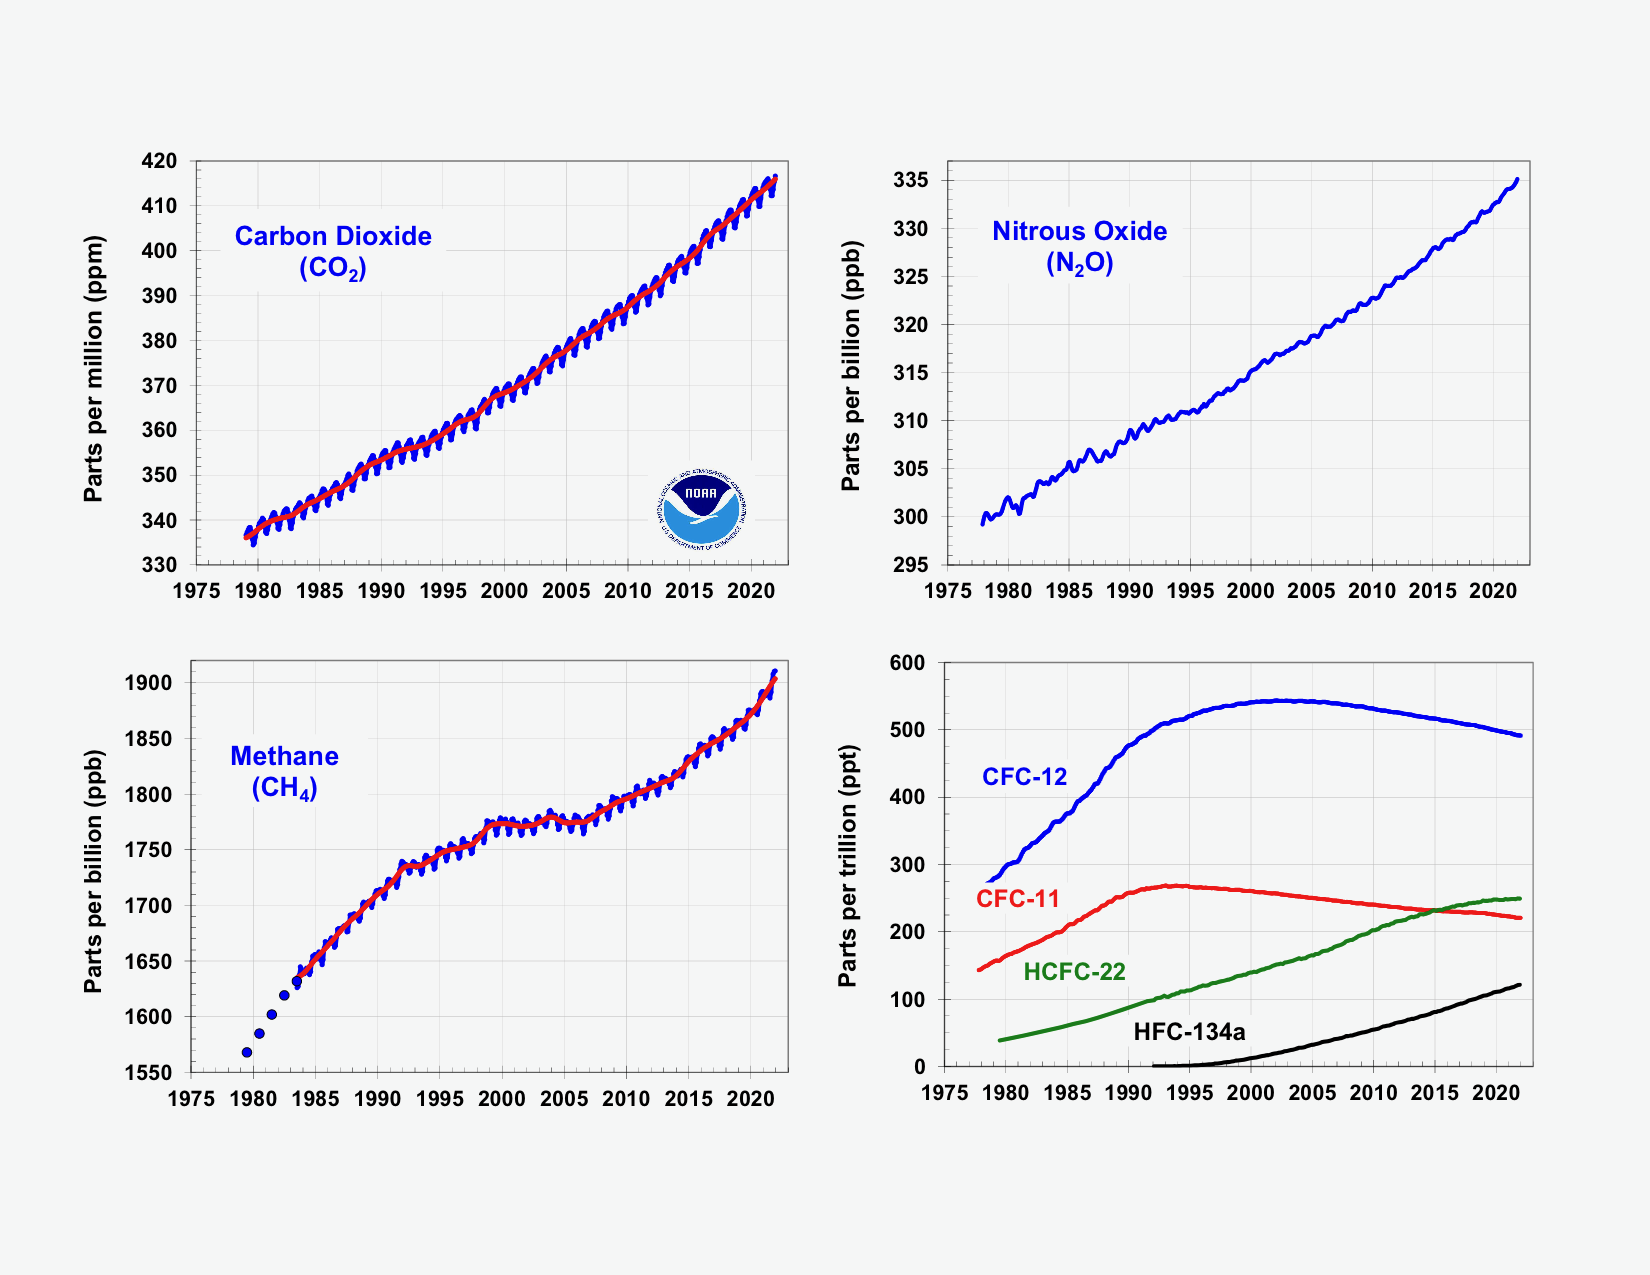
Global average abundances of the major, well-mixed, long-lived greenhouse gases – carbon dioxide, methane, nitrous oxide, CFC-12 and CFC-11 – from the NOAA global air sampling network since the beginning of 1979 are depicted here. These five gases account for about 96% of the direct radiative forcing by long-lived greenhouse gases since 1750. The remaining 4% is contributed by 15 other halogenated gases including HCFC-22 and HFC-134a, for which NOAA observations are also shown here. Credit: NOAA Global Monitoring Laboratory
The biggest culprit
Carbon dioxide, or CO2, is by far the most abundant human-emitted greenhouse gas. Roughly 36 billion metric tons of CO2 are emitted each year by transportation, electrical generation, cement manufacturing, deforestation, agriculture, and many other practices. A substantial fraction of CO2 emitted today will persist in the atmosphere for more than 1,000 years. Not surprisingly, it is also the largest contributor to the AGGI in terms of both amount and rate of increase.
NOAA measurements showed the global average concentration of CO2 in 2021 was 414.7 parts per million (ppm). The annual increase was 2.6 ppm during this year, about the average annual increase for the previous decade, and much higher than the increase measured during 2000-2009. CO2 levels have risen by 61 ppm since 1990, accounting for 80% of the increased heat tracked by the AGGI since that year.
“CO2 is the main player because it stays in the atmosphere and oceans for thousands of years and it is by far the largest contributor to global warming,” said GML Senior Scientist Pieter Tans. “Eliminating CO2 pollution has to be front and center in any efforts to deal with climate change.”
This graphic shows the increasing warming influence over time of CO2 and non-CO2 greenhouse gases, in CO2 equivalents, on the left axis. The corresponding increase in the AGGI is shown on the right axis. Credit: NOAA Global Monitoring Laboratory.
Methane: Is warming feeding warming?
One of the most important scientific questions for climate scientists is what’s been driving the sharp, sustained increase of the second-most important greenhouse gas – methane – since 2006.
Levels of atmospheric methane, or CH4, averaged 1,895.7 parts per billion during 2021. The 16.9 ppb increase recorded for 2021 was the fastest observed since the early 1980s, when a more rigorous measurement regime was initiated. Methane levels are currently around 162% greater than pre-industrial levels. From NOAA’s observations, scientists estimate the amount of methane emitted in 2021 was 15% greater than the 1984-2006 period.
Methane is the second-most important greenhouse gas in warming the globe. The warming influence of CH4 since pre-industrial times is about a quarter of that from CO2. Causes for the dramatic post-2007 increase are not fully understood, but NOAA scientists have concluded that changes in isotopic composition of atmospheric methane over time point to microbial sources, likely from wetlands, agriculture and landfills, as the dominant driver. Fossil fuel emissions, they suggest, have made a smaller contribution.
“We should absolutely target man-made methane emissions – especially those from fossil fuel – because it is technologically feasible to control them,” said Xin Lan, a CIRES scientist working in the Global Monitoring Lab. “If wetlands are giving off more methane because of warming and changes in global precipitation caused by rising CO2 levels , that’s something we can’t control directly. And that would be very concerning.”
No laughing matter
The third-most important greenhouse gas is one you may have encountered as an anesthesia in the dentist’s chair. Nitrous oxide, or N2O, is another long-lived climate forcing pollutant primarily emitted by people. It is rising every year. But it’s different in that it’s being driven by expanding populations, not energy demands. N2O pollution is primarily a result of fertilizer use to support agriculture and food production, especially for an expanding global population .
“We can find alternative energy sources to replace fossil fuels,” said Stephen Montzka, the GML scientist who leads the AGGI report each year, “but cutting emissions associated with producing food is a very difficult task.”
These three greenhouse gases, plus two banned ozone-depleting chemicals, account for about 96% of the excess heat trapped in the atmosphere due to human activity since 1750. The remaining 4% is from 16 other greenhouse gases also tracked by the AGGI. In aggregate, they trapped an amount of heat equivalent to 508 ppm of CO2 in 2021.
One number to track human impact on climate
NOAA scientists released the first AGGI in 2006 as a way to help policymakers, educators, and the public understand the cumulative impact of greenhouse gases on climate over time.
Scientists benchmarked the AGGI to the year 1750, the onset of the Industrial Revolution, assigning it a value of zero. An AGGI value of 1.0 was assigned to 1990.
The AGGI is based on thousands of air samples collected from sites around the world each year from NOAA’s Global Greenhouse Gas Reference Network. Concentrations of these greenhouse gases and other chemicals are determined through the analysis of those samples at NOAA’s Global Monitoring Laboratory in Boulder, Colorado. Scientists then calculate the amount of extra heat being trapped in the Earth system by these gases and how much that has changed over time to understand the contribution from human activity.
For more information, contact Theo Stein, NOAA Communications, at theo.stein@noaa.gov.
Click the link to read the article on the NIDIS website. Here’s an excerpt:
Key Points
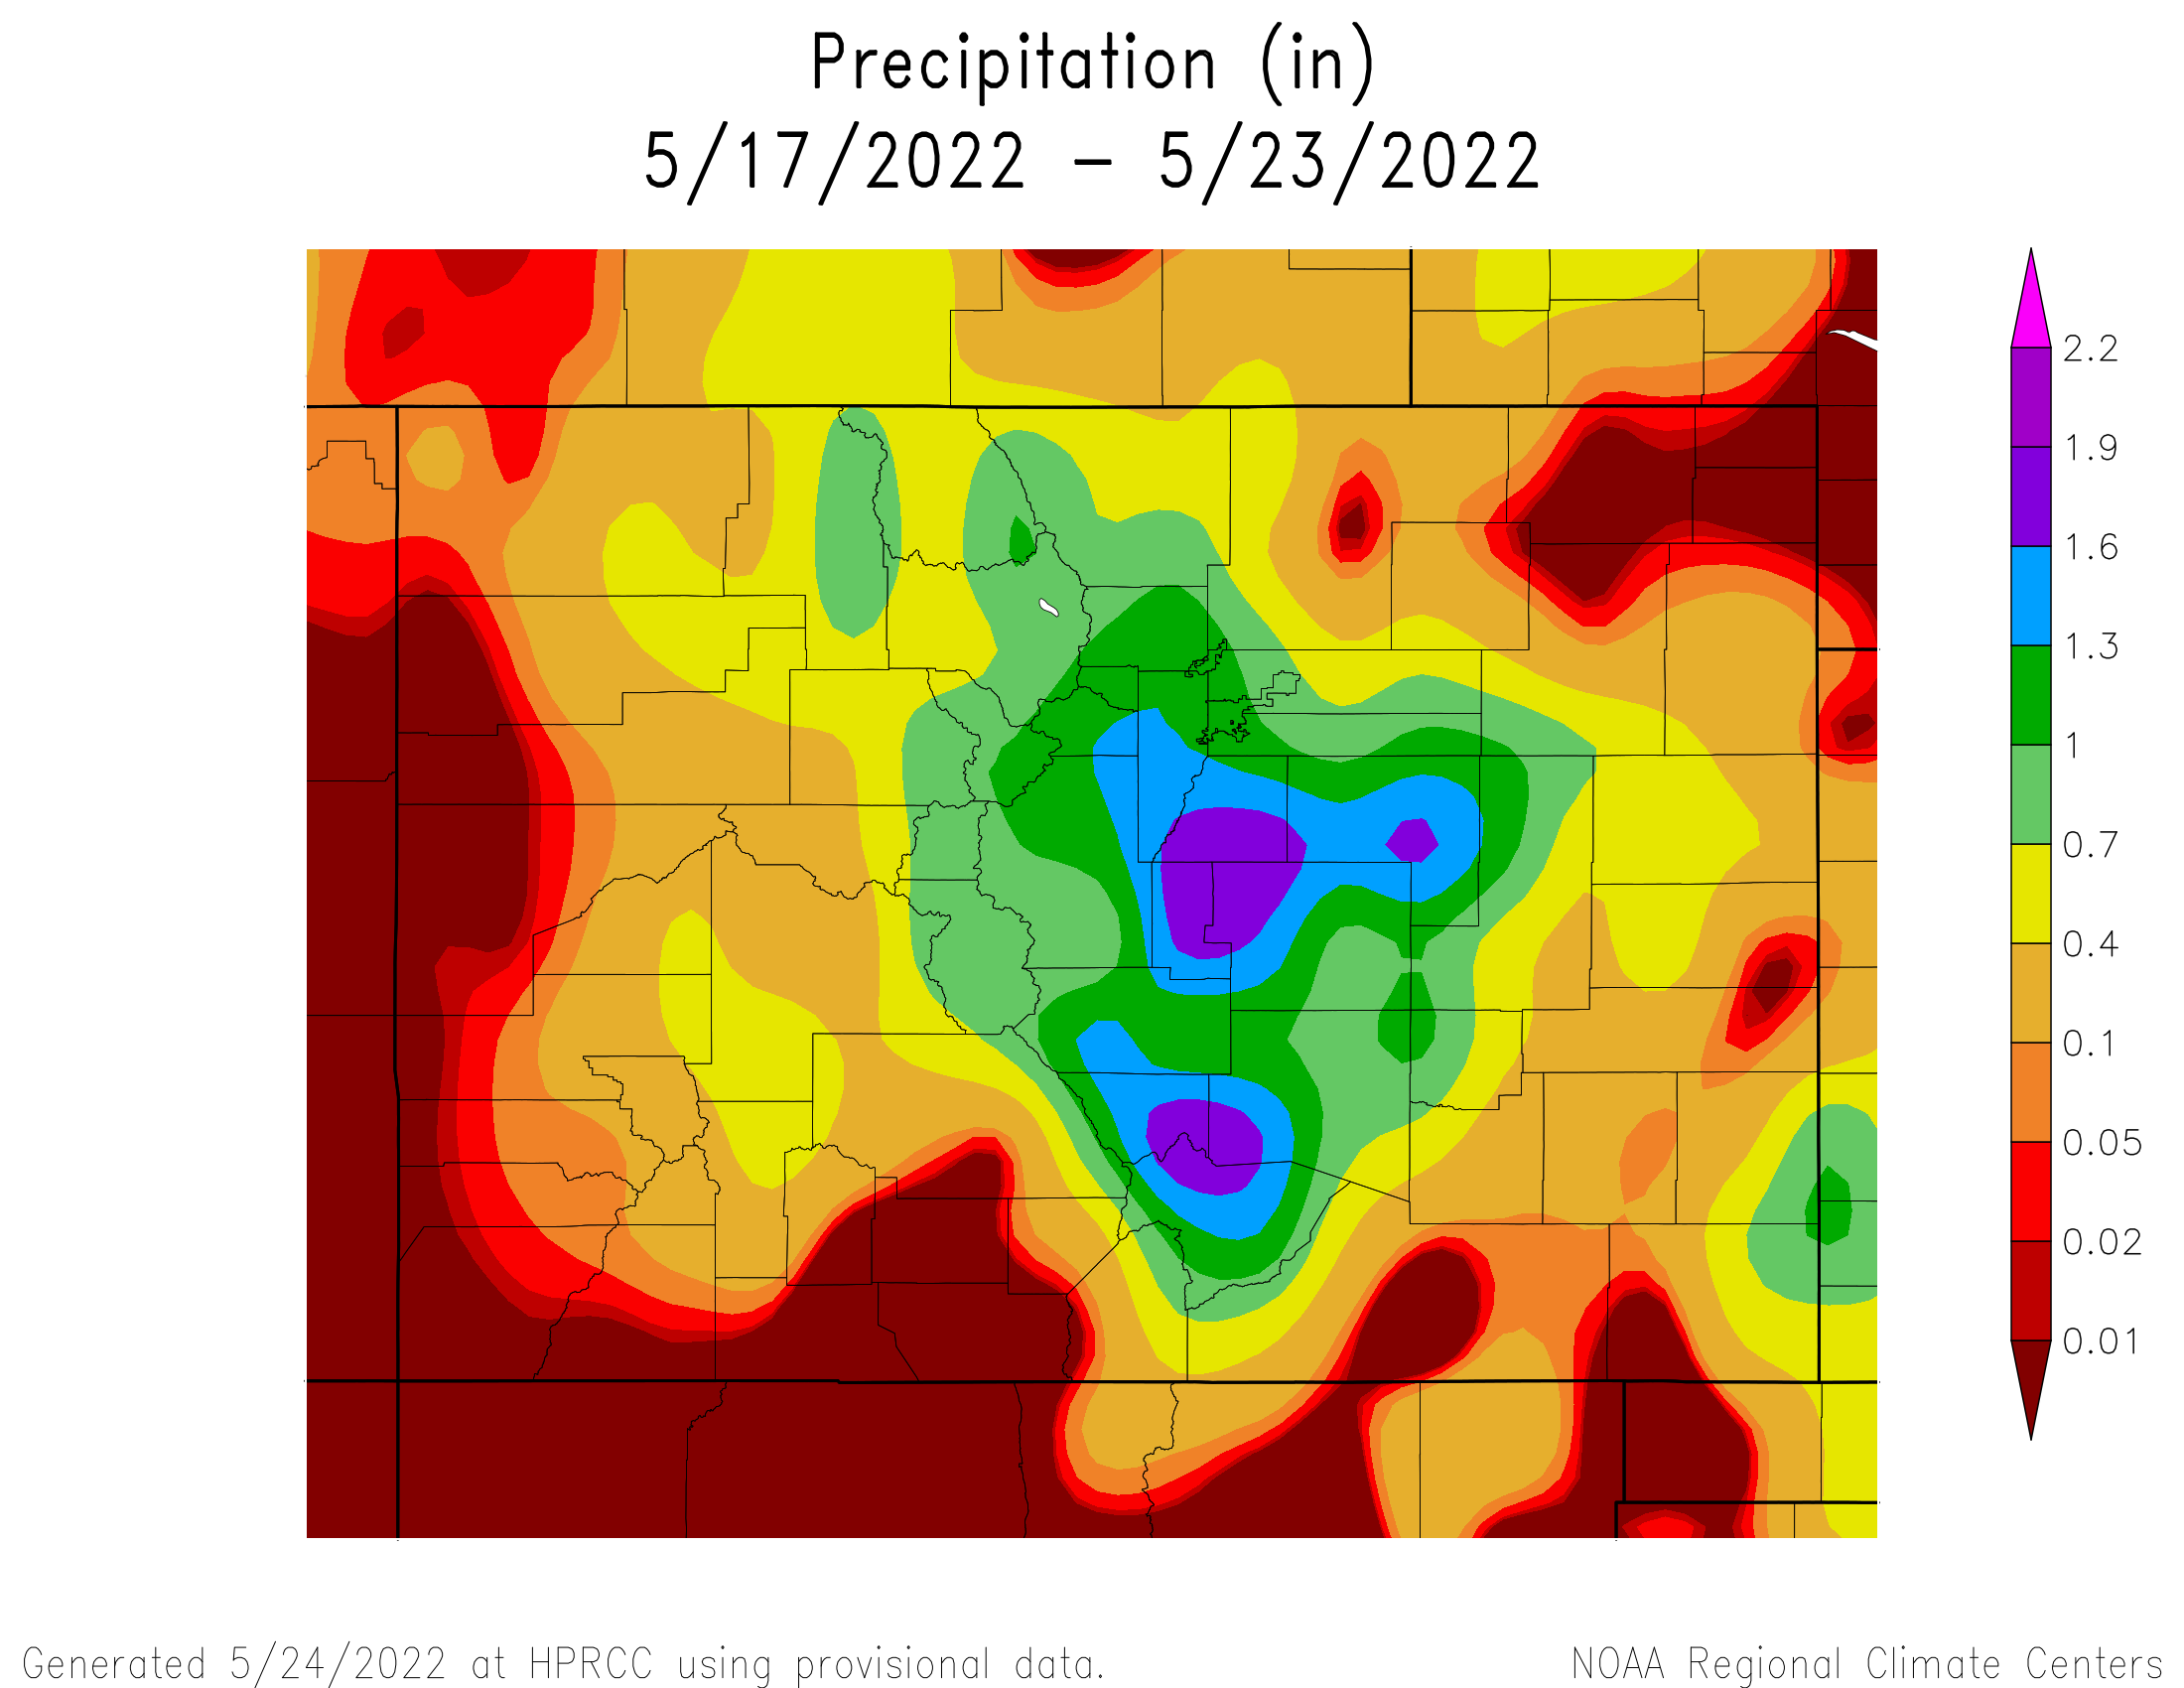
Extreme and exceptional drought conditions to continue in the Intermountain West for the third summer in a row.
Upper Colorado River SWE is currently at 54% of median for this time of year with about a month left in the melt season.
Exceptional drought expanded in New Mexico, where the fire season is in full swing. With over 311,000 acres burned, the Hermits Peak/Calf Canyon Fire Complex is now the largest in modern records for the state of New Mexico.
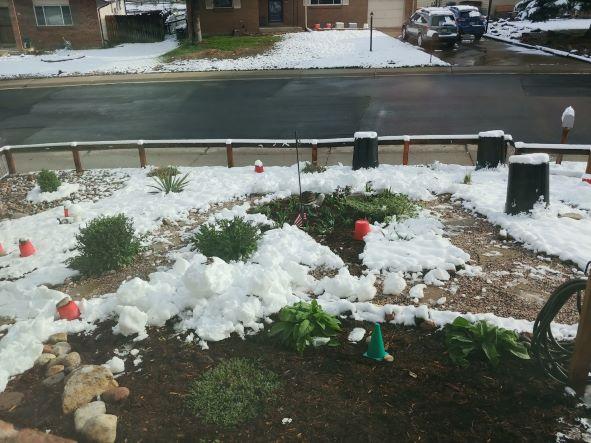
The piles of snow left by last weekend’s storm have melted away, but lawns and landscapes are benefiting from the free water the storm brought to the metro area.
That means lawns won’t need extra water, in the form of sprinklers and irrigation systems, for days, even a week as more rain is in the forecast.
Denver Water saw customer demand drop by about half over the weekend as its customers did a great job responding to Mother Nature’s free water by turning off their sprinklers.
Let all that water soak in! And challenge yourself: Don’t water your lawn until it needs it. (Take the screwdriver test.) Photo credit: Denver Water.
In fact, you’re doing your lawn a favor by turning off the sprinklers and keeping them off for several days after the weekend storm — or any upcoming rain. Babied lawns that get too much water too often can have trouble with Colorado’s hotter summer months.
(And watering too much too often will drive up your monthly water bill to boot!)
“Your lawn can last longer than you think,” said Austin Krcmarik, a water efficiency expert at Denver Water. “Challenge yourself, see how long you can keep your sprinklers off.”
An easy way to test for soil moisture is to probe your lawn with a screwdriver. If it goes into the soil easily, that indicates sufficient moisture. Watch the video below to see how quick and easy this test is to perform.
While the storm dumped up to 2 feet of snow in Colorado’s mountains, it wasn’t a drought buster. (And other parts of the state didn’t see much from the storm.) Denver Water’s planners do not expect the utility’s reservoirs to completely fill this season.
“We hope to fill our reservoirs after every runoff season to help supply us through the hot summer months and into next year,” said Krcmark. “We already know that isn’t going to happen this season, but you can help keep water in our reservoirs by keeping those sprinklers off after storms.”
A general rule of thumb is that you can skip a watering day when we receive ¼ inch within 24 hours.
Weather watchers estimate the storm delivered 1 to 1.5 inches of water to the metro area. And, with the potential for more rain in Denver’s forecast, you may not need to water at all this week.
For now, Denver Water’s regular summer watering rules remain in effect, but additional restrictions could be needed if conditions warrant this summer.
Arapahoe Basin Ski Area, which is in Denver Water’s watershed where the utility collects water, reported receiving 19 inches of snow from the weekend storm. Lots of snow, though unfortunately it wasn’t a drought buster. Photo credit: Arapahoe Basin Ski Area.
Click the link to read the article on the GreenBiz website (Will Sarni & Jared Sheehan & Ben Dukes). Here’s an excerpt:
The need for a new approach to identify, fund and implement innovative water technologies and business models is critical. The impacts of climate change on water resources is well documented in places such as the American West, where the Colorado River Basin was named the most threatened in the U.S. Striking in the declaration by American Rivers was the statement that “rising temperatures and drought driven by climate change, combined with outdated river management and overallocation of limited water supplies [emphasis added], threaten the entire region.”
How can stakeholders, in particular the private sector, contribute to scaling innovative water technologies and catalyze other stakeholders to accelerate changes in public policy to adapt to 21st-century water realities? We propose the increased adoption of shadow pricing (the price of water plus consideration of risks, costs for energy and associated carbon emissions, etc.) and business value at risk strategies (additional considerations such as brand value, license to operate and grow, etc.) to overcome the challenges and barriers of using internal return on investment criteria to consider these strategies…
Our recommendations for corporations with ambitious water strategies are as follows:
Inventory and evaluate the current challenges and barriers to adopting innovative water technologies and business models to mitigate business value at risk and achieve your goals and objectives. Consider concerns such as does the company lack internal incentives to take technology risks? Or does it require too short a timeframe for investment paybacks?
Develop a framework and commitment for integrating a shadow price and for embracing a business value at risk strategy that can be used to incentivize the adoption of innovative solutions to water scarcity, poor quality and equitable access to water. You can quantify business value at risk using tools such as the WWF Water Risk Filter WAVE Tool or use a more subjective approach in which watershed-specific investments are accommodated outside of established return on investment criteria.
Build a program to identify and directly invest in innovative water technologies to increase the pipeline of innovations for considerations. Programs such as the 100+ Accelerator, PepsiCo Labs and watershed-focused venture funds such as the Future of Water: Colorado River Basin Fund (disclosure, Will Sarni is founder and CEO of the fund) increase corporate exposure to innovative solutions and opportunities for investment to support entrepreneurs.
There is an opportunity to overcome the status quo approaches to water management and stewardship. However, time is of the essence to address the impacts of climate change on critical watersheds, globally.