The health of our waters is the principal measure of how we live on the land — Luna Leopold
Research Article: Indigenous fire management and cross-scale fire-climate relationships in the Southwest United States from 1500 to 1900 CE — Science Advances #ActOnClimate #CRWUA2022
Click the link to access the article on the Science Advances website (CHRISTOPHER I. ROOS, Et. al). Here’s the abstract:
Prior research suggests that Indigenous fire management buffers climate influences on wildfires, but it is unclear whether these benefits accrue across geographic scales. We use a network of 4824 fire-scarred trees in Southwest United States dry forests to analyze up to 400 years of fire-climate relationships at local, landscape, and regional scales for traditional territories of three different Indigenous cultures. Comparison of fire-year and prior climate conditions for periods of intensive cultural use and less-intensive use indicates that Indigenous fire management weakened fire-climate relationships at local and landscape scales. This effect did not scale up across the entire region because land use was spatially and temporally heterogeneous at that scale. Restoring or emulating Indigenous fire practices could buffer climate impacts at local scales but would need to be repeatedly implemented at broad scales for broader regional benefits.
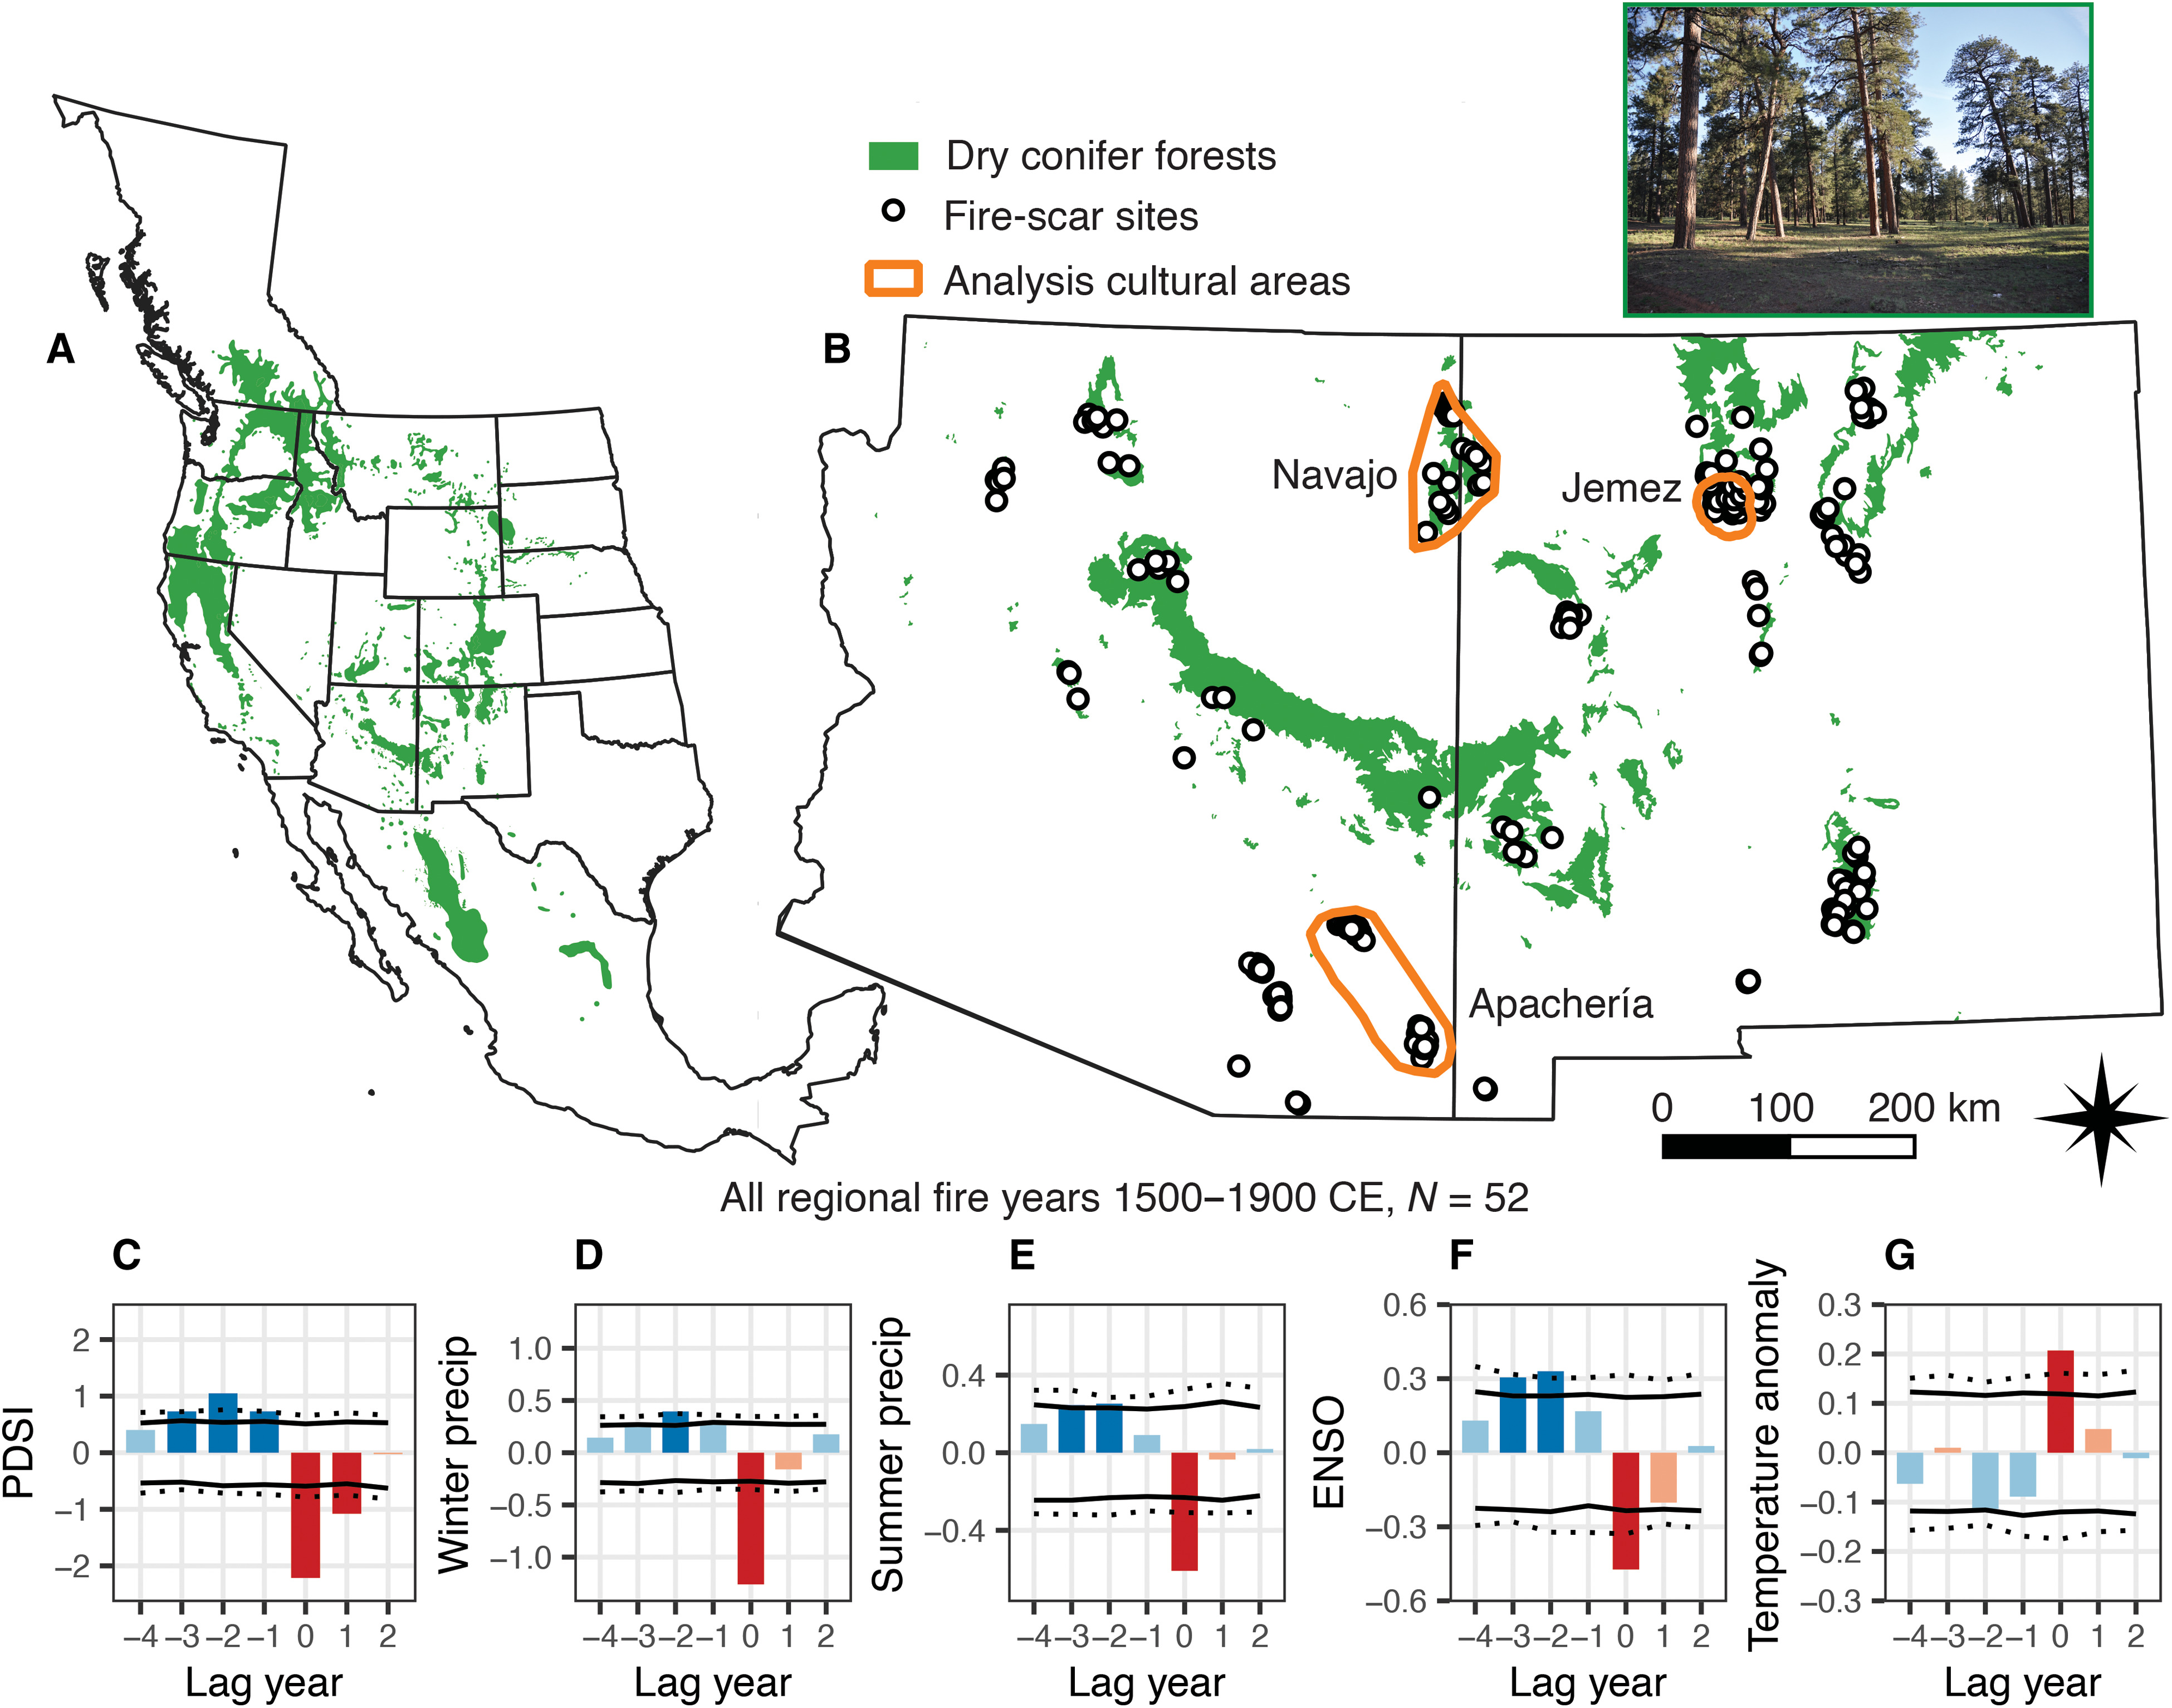
Fig. 1. Maps of the distribution of dry pine forests across western North America and the Southwest United States with regional fire-climate analyses.
The distribution of dry pine and mixed conifer forests across western North America and the Southwest are indicated in (A) and (B). The location of tree-ring sites (dots; i.e., the local scale sites) and cultural areas (orange outlines; i.e., cultural landscapes) are indicated in (B). Superposed epoch analysis plots at the regional-scale for Palmer Drought Severity Index (PDSI) (C) (77), winter precipitation (D) (78), summer precipitation (E) (78), El Niño Southern Oscillation (ENSO) (F) (79), and temperature (G) (80) indicate the “canonical pattern” of prior wet and fire-year dry (and warm) conditions using the combined regional dataset for the entire record (1500-1900 CE). Solid line indicates significance at the p < 0.05 level, dotted line at the p < 0.01 level. Red/orange bars indicate dry/warm years. Blue bars indicate wet/cool years. Dark red/blue indicate years significant at the p < 0.05 level. Orange and light blue bars are not statistically significant. Photo of ponderosa pine (Pinus ponderosa) forest in the Chuska Mountains by C. Guiterman.