At a May 25 special meeting, the Pagosa Area Water and Sanitation District (PAWSD) Board of Directors approved contracts with PCL Construction and Veolia Water Technologies and Solutions for construction of and equipment for the Snowball Water Treatment Plant project. According to the contract with PCL, the guaranteed maximum price (GMP) for the project is $40,565,680…The meeting opened with District Engineer/Manager Justin Ramsey explaining that the con- tract with PCL is for the construction work on the plant…He added that PCL’s contract costs also include the costs associated with the Veolia and Pall contracts…
[Director Ramsey] also clarified the reasons why PAWSD is undertaking the project, explaining that the main reason is the regulatory requirements of the Colorado Department of Public Health and Environment (CDPHE).
Click the link to read the article on The Deseret News website (Amy Joi O’Donoghue). Here’s an excerpt:
“I’ve been here for 11 years now and I have not seen anything like this in that amount of time. This has been one of the biggest snow years we have had. We’ve had localized issues and runoff issues.” — Dave Whittekiend
[…]
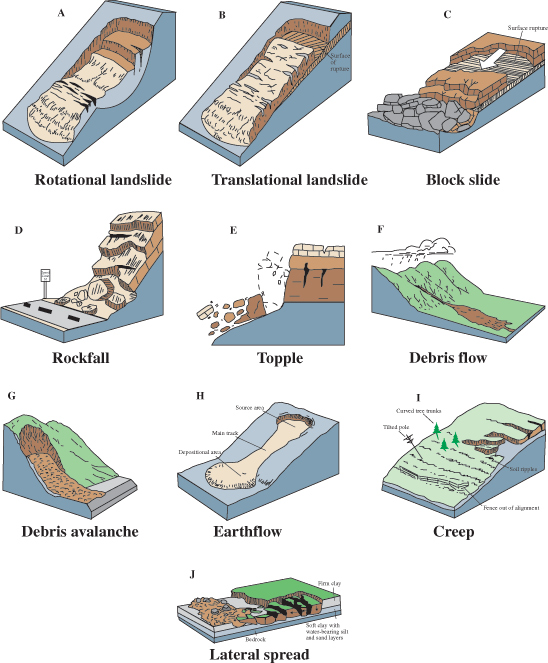
Tanners Flat Campground in Little Cottonwood Canyon took a particularly hard hit. A bathroom was wiped out. There are downed trees everywhere…Greg McDonald, senior geologist with the Utah Geological Survey, said a debris flow closed the road in Little Cottonwood Canyon six weeks ago. It caused substantial damage, only to be followed by another one a couple of weeks later. The sloughing off of a mountainside is because of overly saturated soils that simply give way to the movement of the ground…
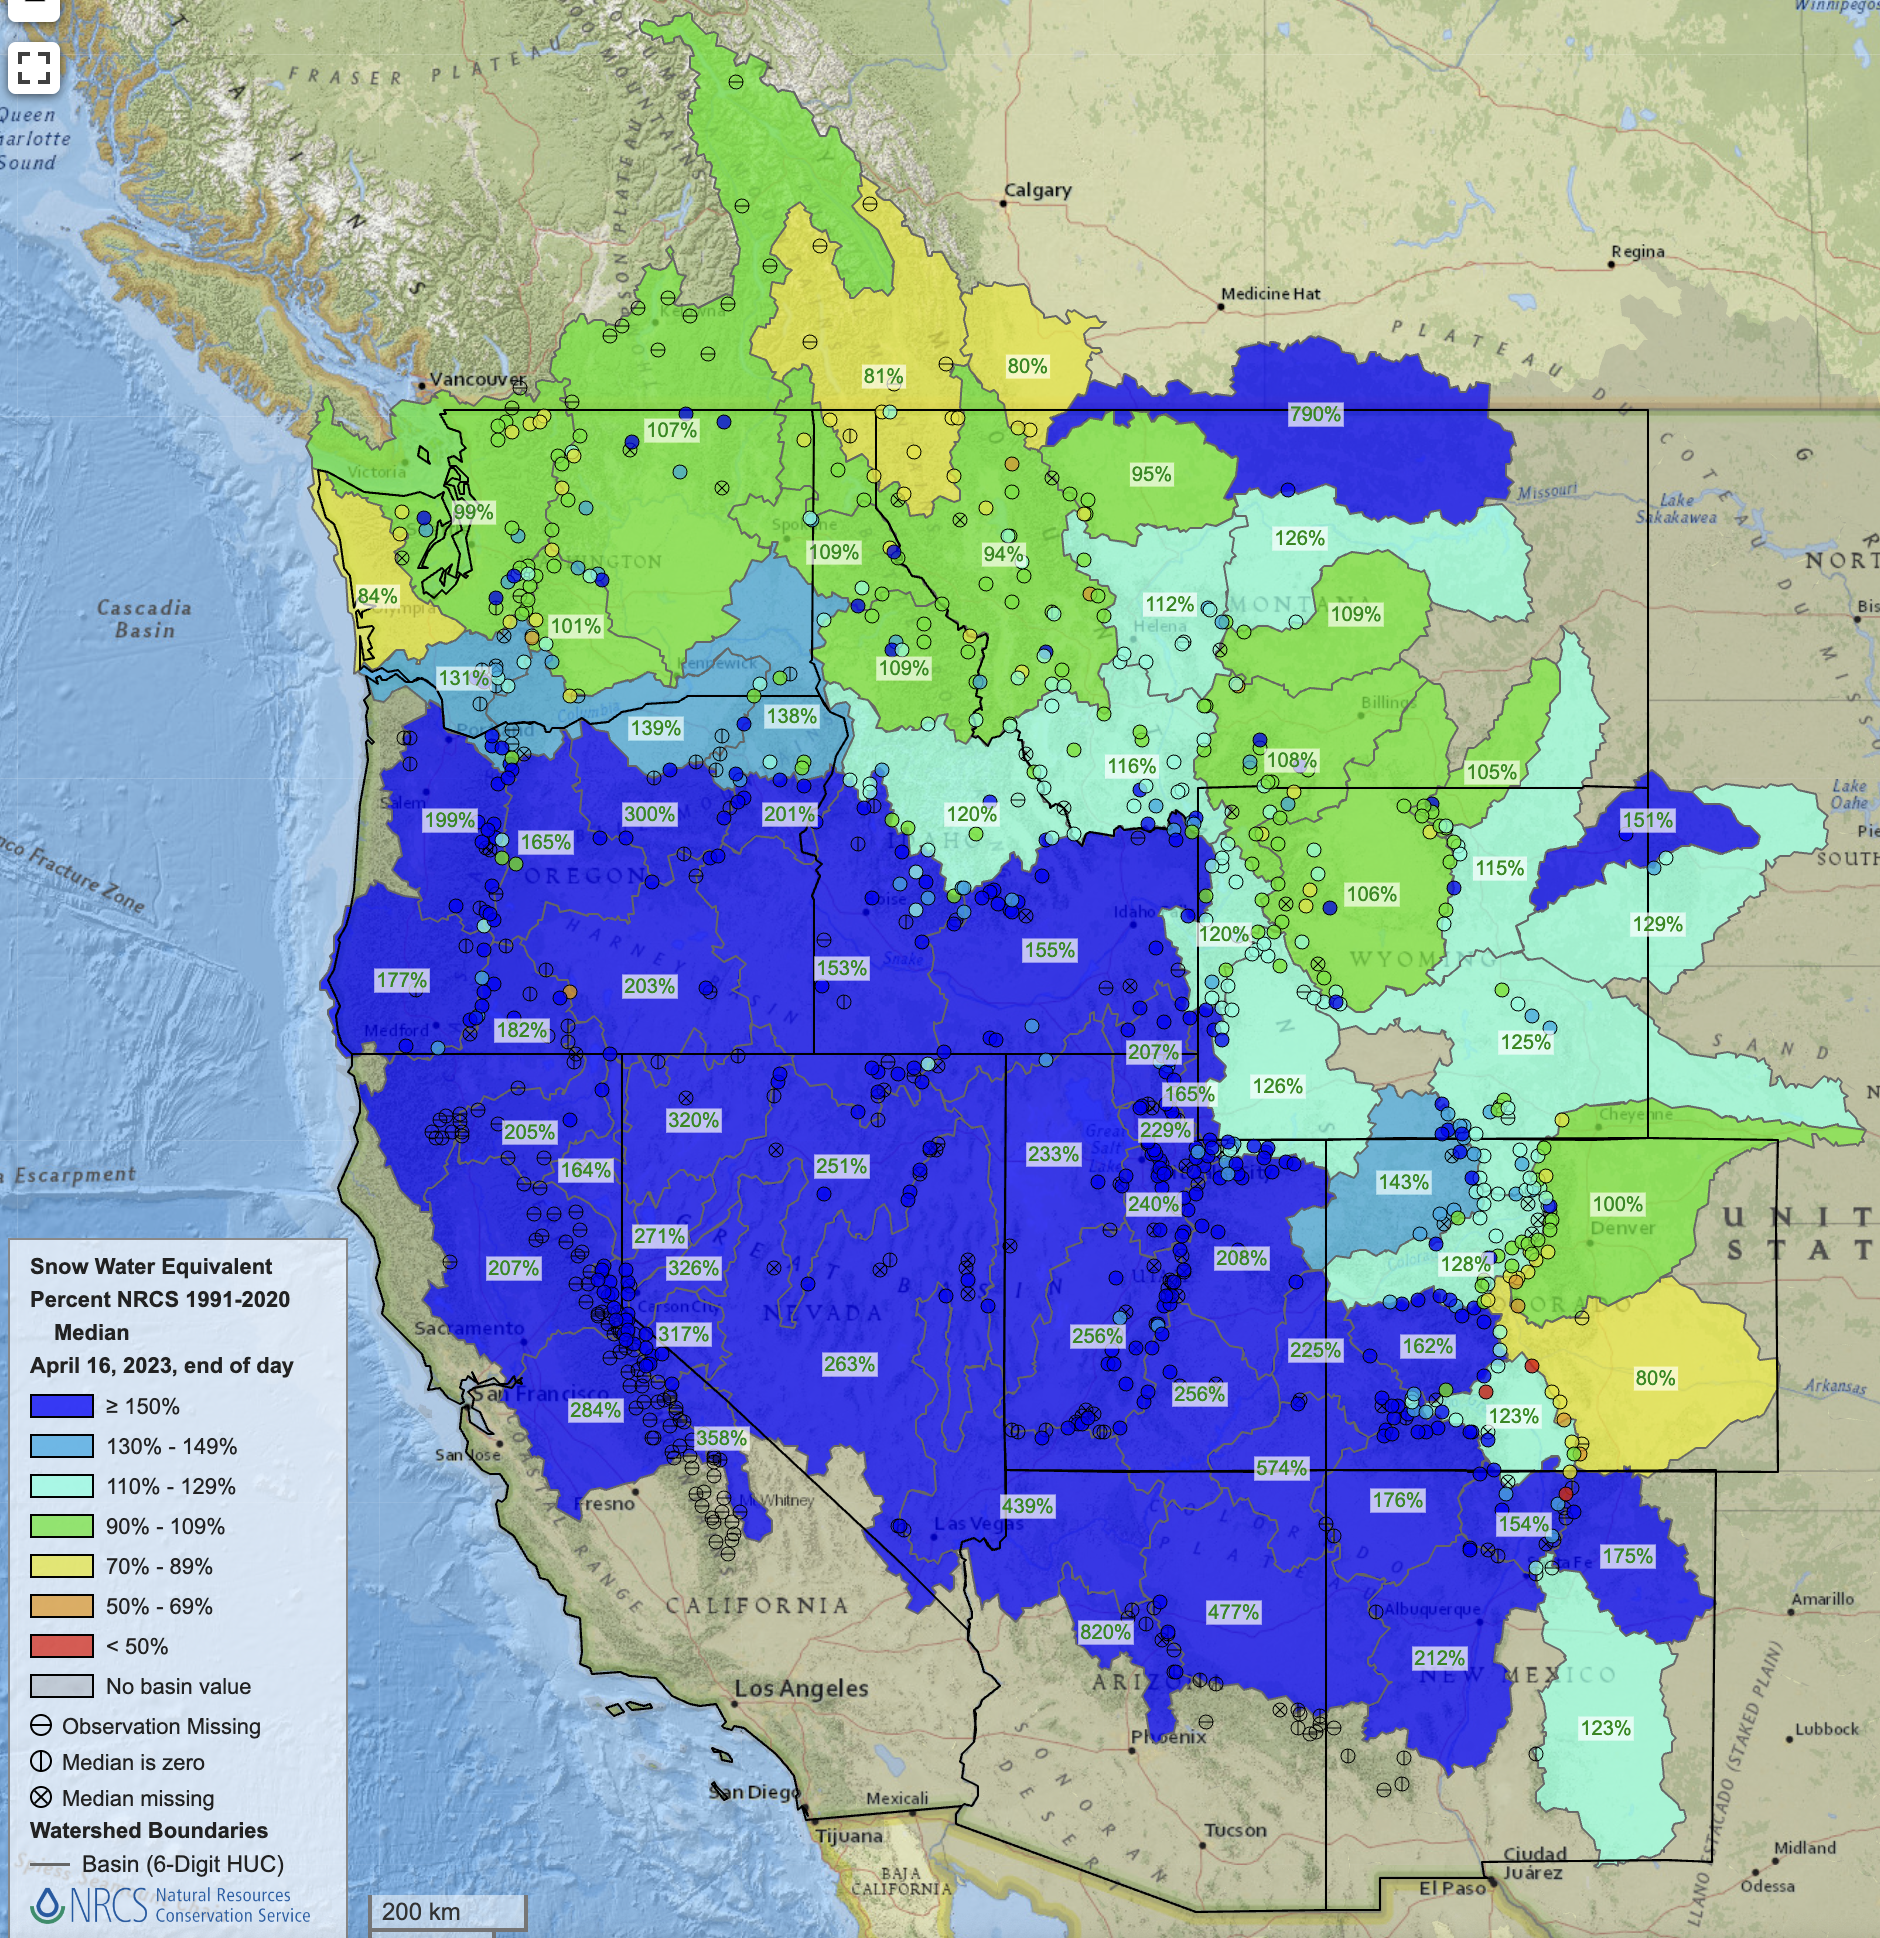
West snowpack basin-filled map April 16, 2023 via the NRCS.
The winter has spoken. Record snowpack. Elevated Great Salt Lake levels. Landslides and over-the-top records for stream flows. Raging rivers and streams and yet more to come. Anyone in the business of hydrology, meteorology, geology, water supply and public safety knows it is a fickle game, from year to year.
The Arikaree River in 2000 in early summer, when water is near its maximum extent. Photo: Kurt Fausch
From email from Governor Polis’ office:
YUMA – Today [June 3, 2023], Governor Polis is signing legislation into law.
“Water is the lifeblood of our state, which is why I was proud to be in Yuma County today to sign legislation right here in the Republican River Basin that builds upon our data-driven approach to preserving and protecting our precious water resources,” said Gov. Polis. “Making sure that Coloradans can access high-quality, affordable health care has been our top priority since day one, and I look forward to signing legislation today at Byers Health Care Clinic to save people money on health care and cut red tape.”
This morning in Yuma, Gov. Polis signed the bipartisan HB23-1220 Study Republican River Groundwater Economic Impact sponsored by Representatives Richard Holtorf and Karen McCormick, Senators Byron Pelton and Rod Pelton, to take a data-driven approach to understanding the economics of groundwater conservation in the Republican River Basin, while helping to ensure that Colorado continues meeting the obligations spelled out in our interstate compacts.
At the Byers Health Care Clinic in Byers, Gov. Polis will sign the bipartisan SB23-298 Allow Public Hospital Collaboration Agreements – Representatives Karen McCormick and Rod Bockenfeld, Senators Bob Gardner and Dylan Roberts to encourage collaborative agreements between rural hospitals while maintaining adequate oversight to ensure rural Coloradans can maintain needed hospital services in their local areas. Rural hospitals provide lifesaving access to care for Coloradans and are often hubs for local economies and crucial job-providers, and ensuring they can work together helps to cut red tape and save Coloradans money on health care.
As western mountain snowpacks diminish and wildfires race across parched landscapes, appreciation has grown for the moist mountain meadows and wetlands that hold water up high, feeding streams throughout the summer and providing fire-resistant refuges for wildlife. Before beavers and their dams were largely eliminated by the fur trade, these natural water storage features and refuges were common across western states’ mountain landscapes.
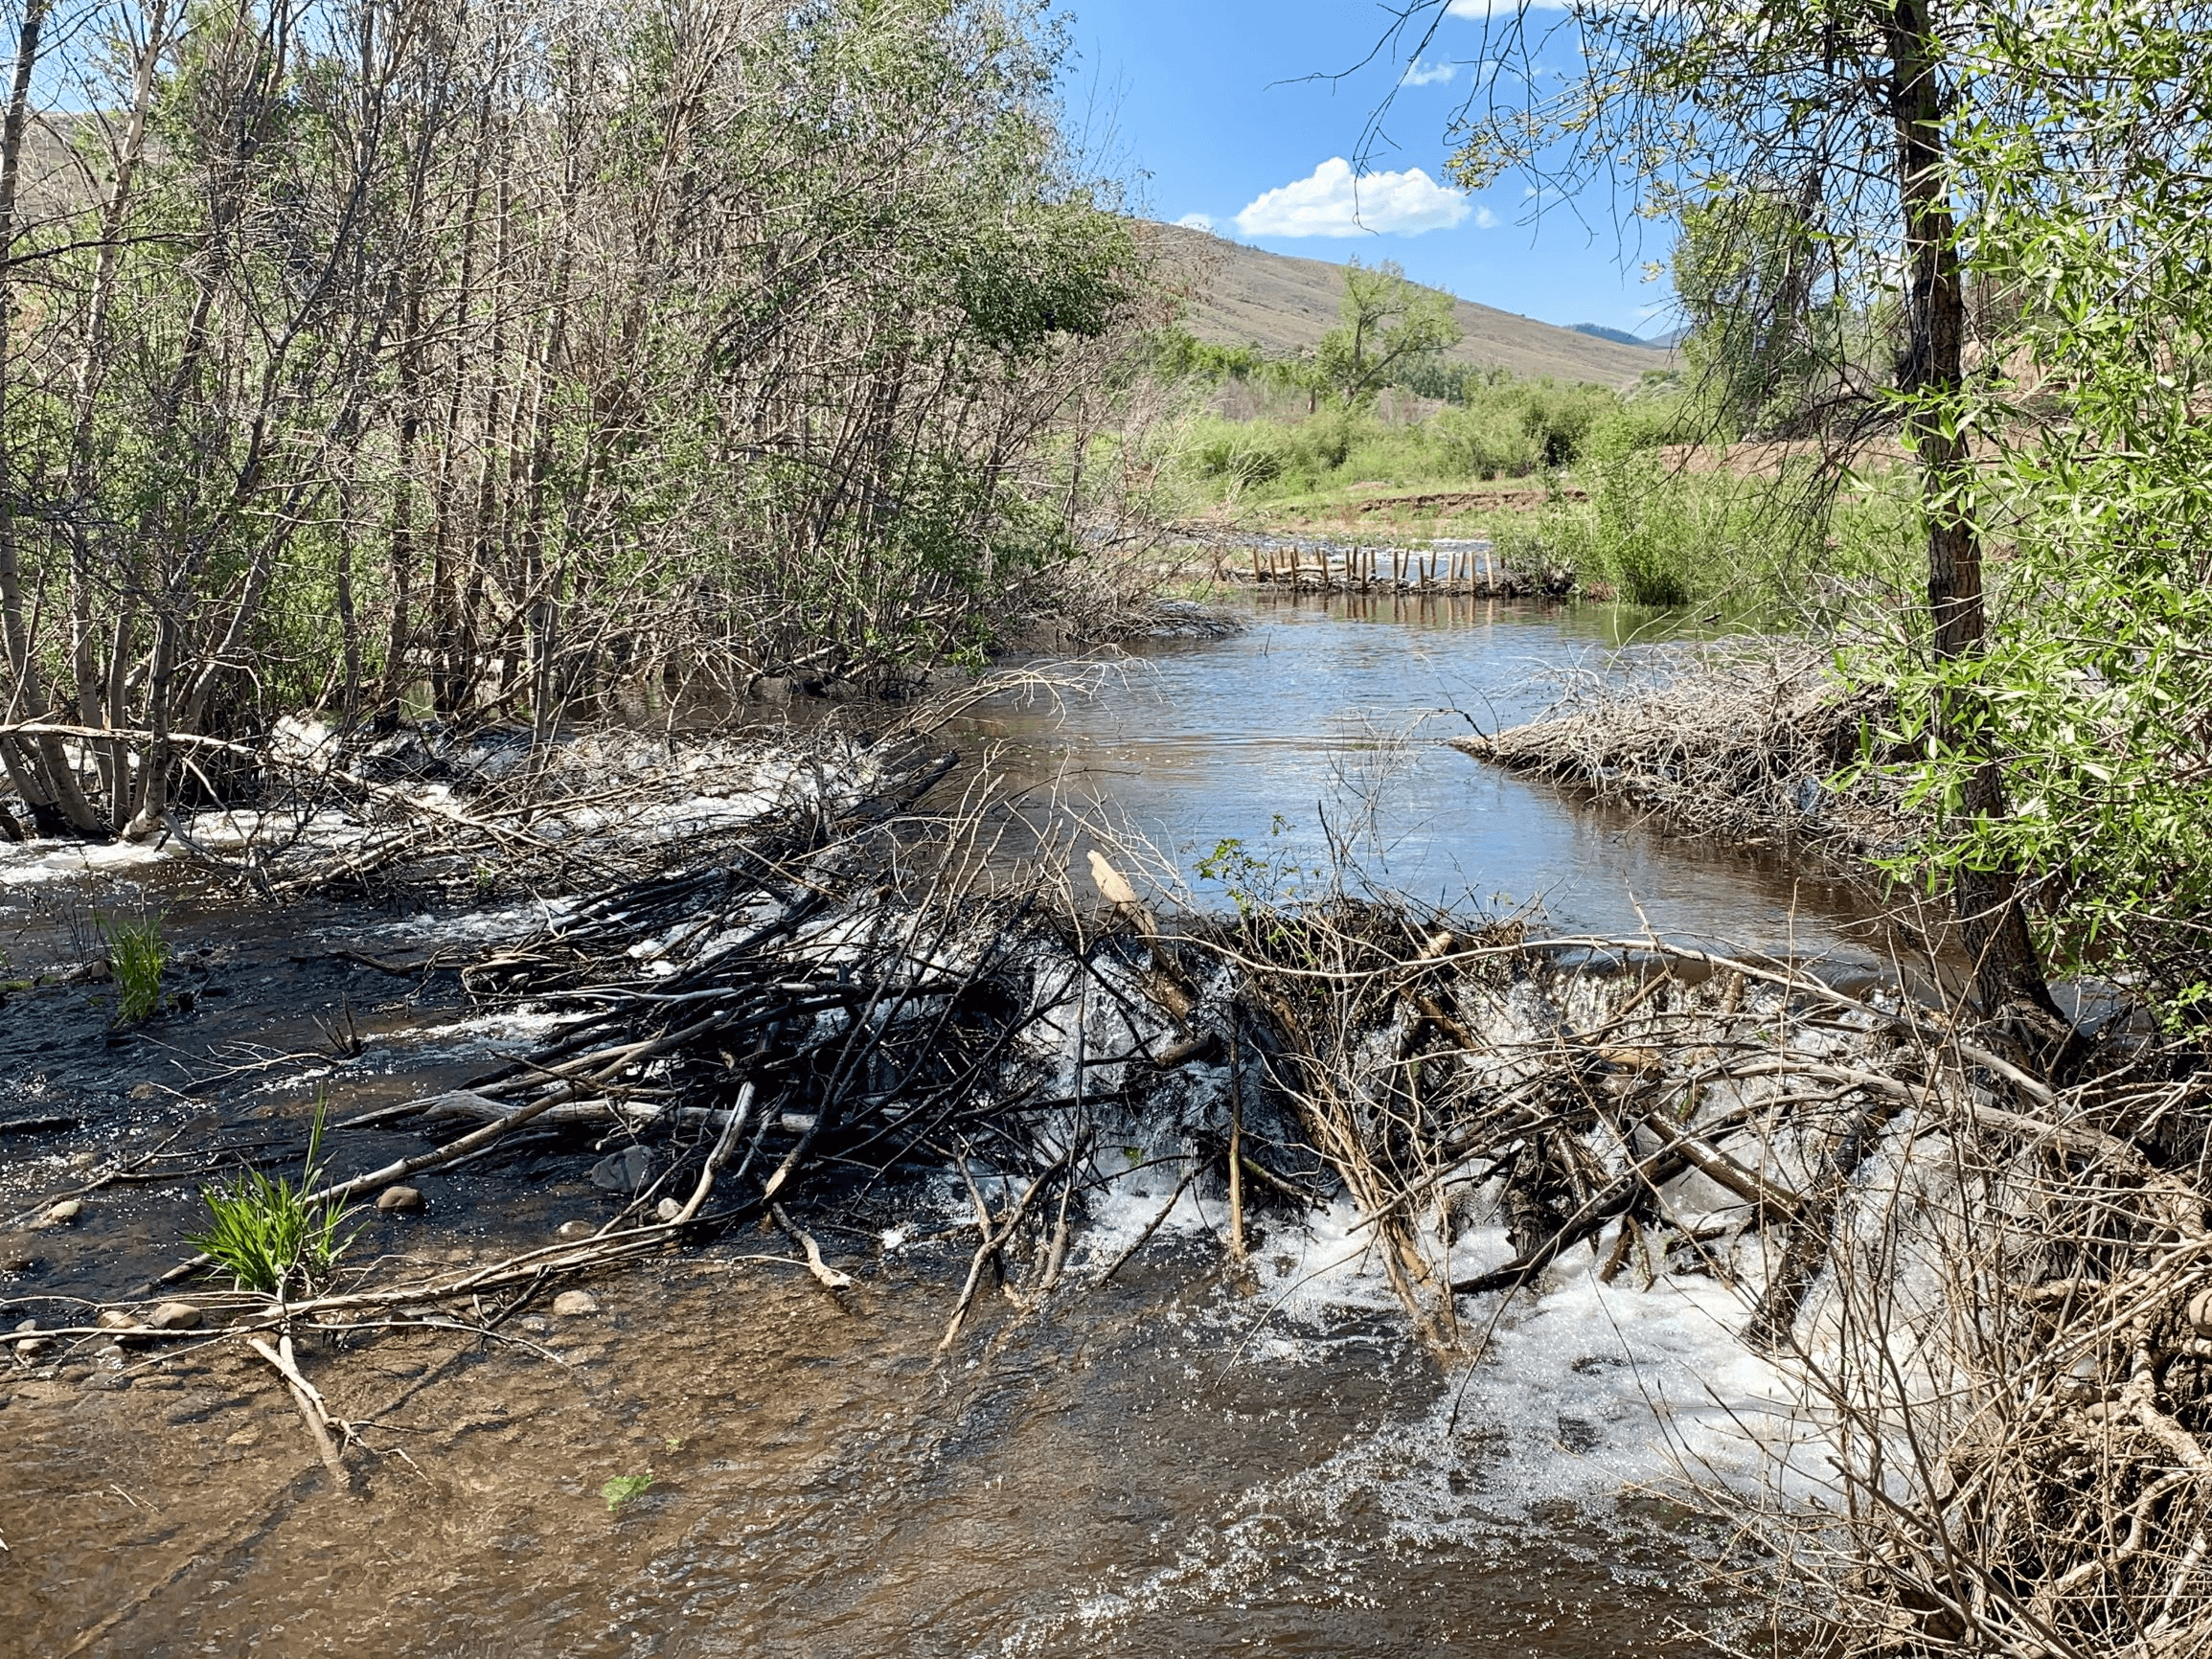
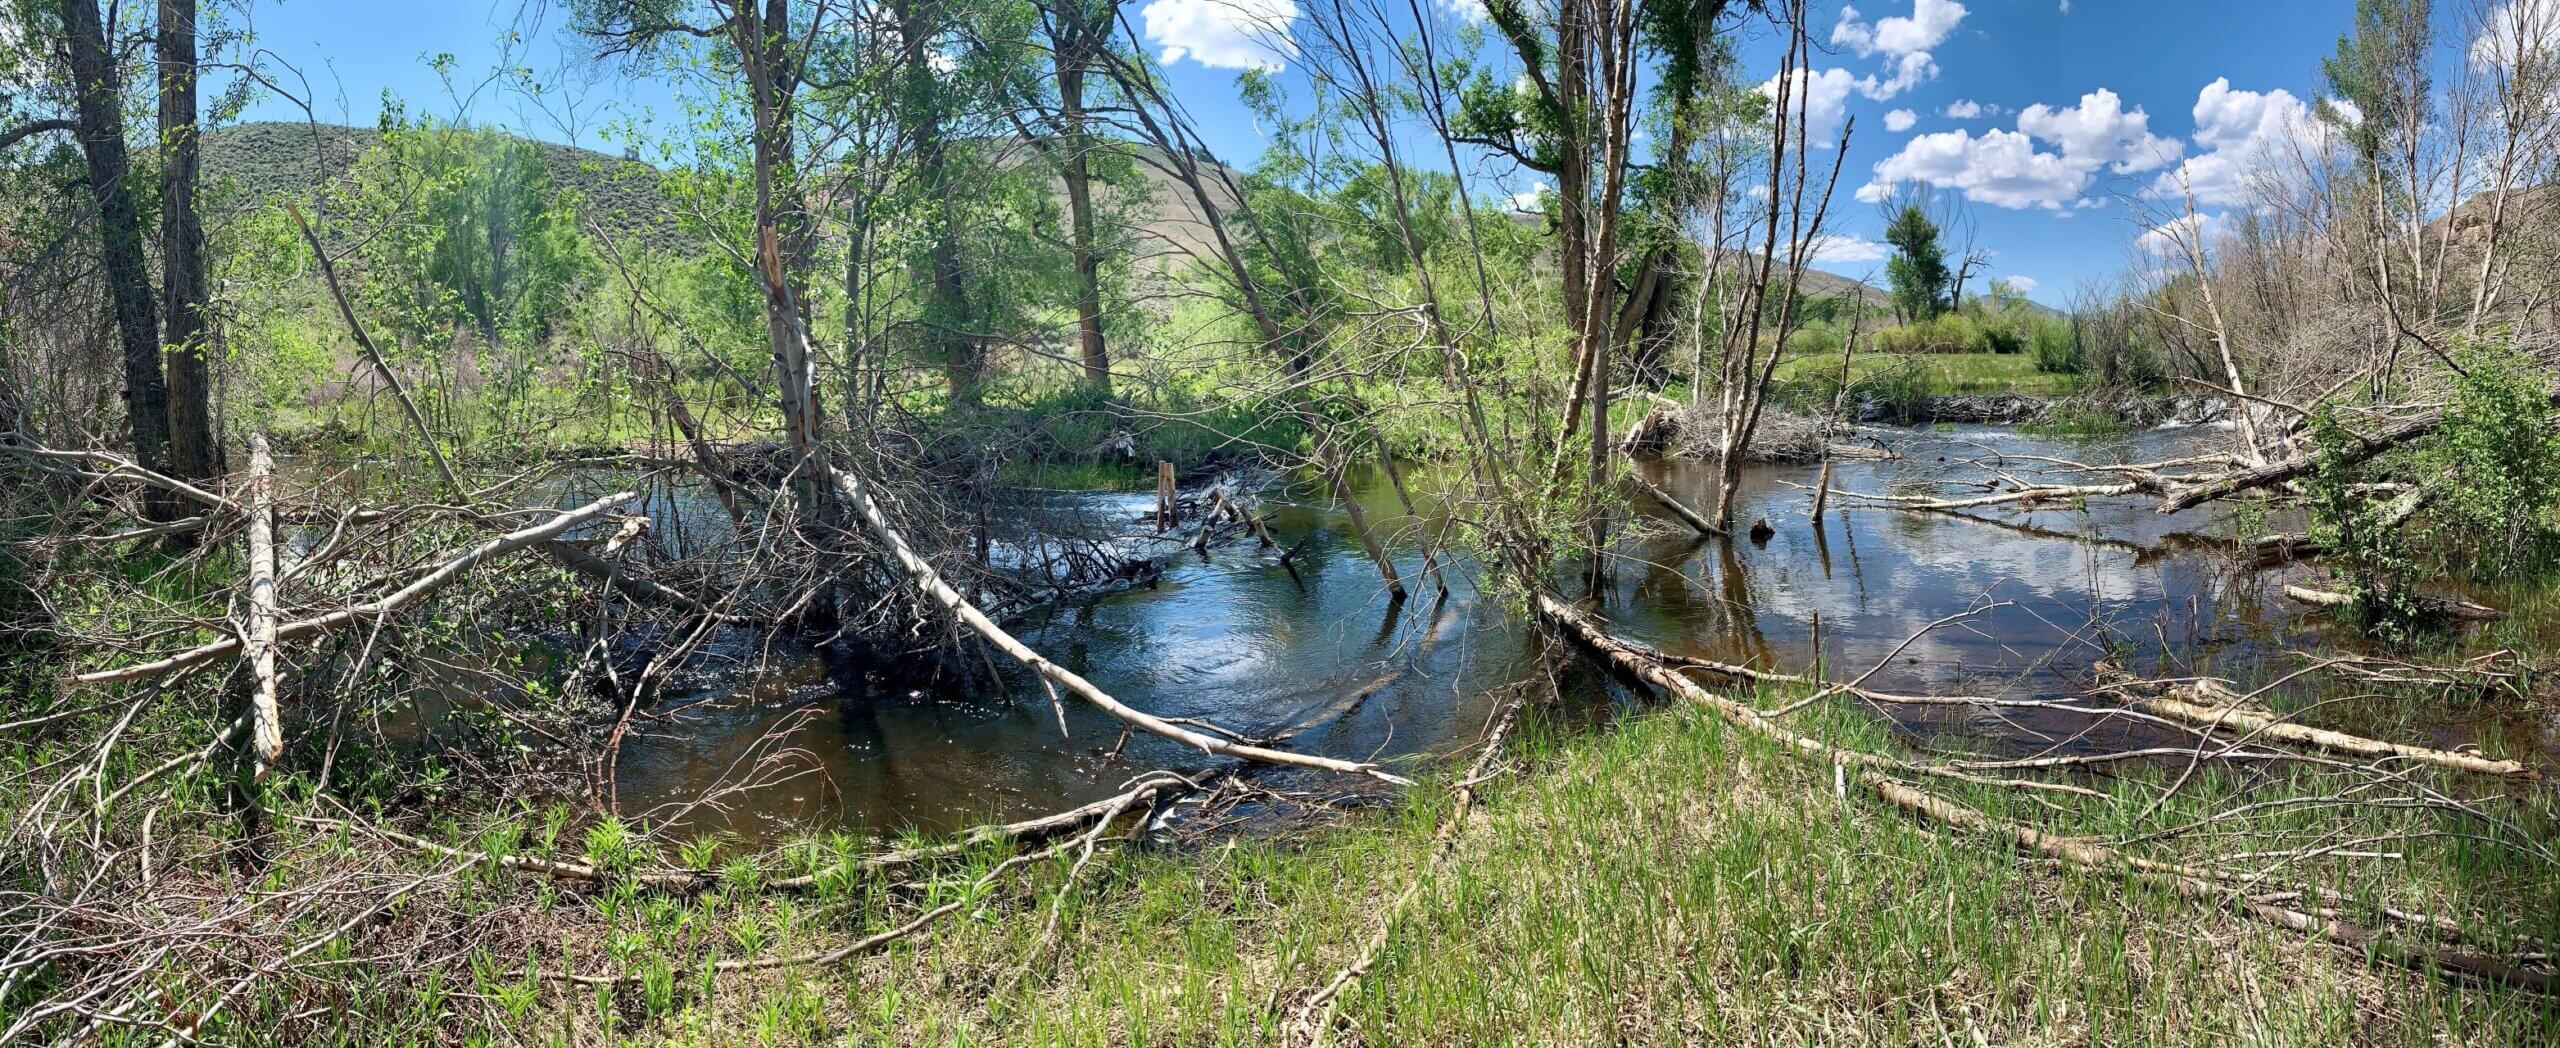
Beavers added to a LTPBR structure installed on Beaver Creek, Gunnison County, CO
The removal of beavers and other land disturbances have led many creeks to cut deeper into their valleys and detach from their floodplains, dropping the water table and drying out the landscape. A growing field of stream restoration, known as low-tech process-based restoration (LTPBR), seeks to reverse these changes through methods that mimic beaver activity in hopes of enticing them to return.
Projects across the west have demonstrated the benefits of LTPBR on the landscape. Projects have improved water quality, provided important habitat, trapped sediment, increased riparian vegetation and forage, and bolstered resilience against drought, fire, and floods. These benefits are achieved by installing low-tech, hand-built structures, creating “speedbumbs” that enable water from snowmelt and storms to spread across the riparian area, slowing peak flows and recharging groundwater. The rewetted soil “sponge” supports healthy riparian vegetation and reduces wildfire risks.
LTPBR project on Beaver Creek, Gunnison County, CO
As LTPBR projects have proliferated across western states, both excitement about their benefits and questions about potential impacts have grown. A new report from American Rivers reviews the published science and case study information on LTPBR to better understand the full range of benefits these projects can provide, and provides scientific evidence to address potential concerns. The report finds ample evidence for LTPBR benefiting habitat and buffering the impacts of droughts, floods, and wildfires, but concludes that more research is needed to better understand the full suite of ecosystem service benefits. It also provides insights on how to address human and social factors related to LTPBR projects, such as mitigating beaver dam impacts to infrastructure.
Click the link to access the paper on the SSRN website (Eric Kuhn and John Fleck). Here’s the abstract:
Abstract
Water management of the Lower Colorado River has long sidestepped the questions of how to account for and assess the impact of reservoir evaporation and system losses. To date, the preferred strategy has been to ignore those losses. The hydrologic gap left by this approach, which leaves an imbalance between the water flowing into Lake Mead and the amount released for downstream users, has been covered by simply releasing water stored in Lake Mead from the wet decade of the 1990s ensuring that no user bears the brunt of a legal interpretation that might reduce their supply. This disconnect between the river’s allocation framework and hydrologic reality is the result of longstanding governance failures by the U.S. and the Lower Basin states – Arizona, California, and Nevada – including failure of the U.S. to factor in reservoir and system losses in the 1944 Treaty with Mexico and failure of the states to negotiate a Lower Basin compact to apportion their share of the river.
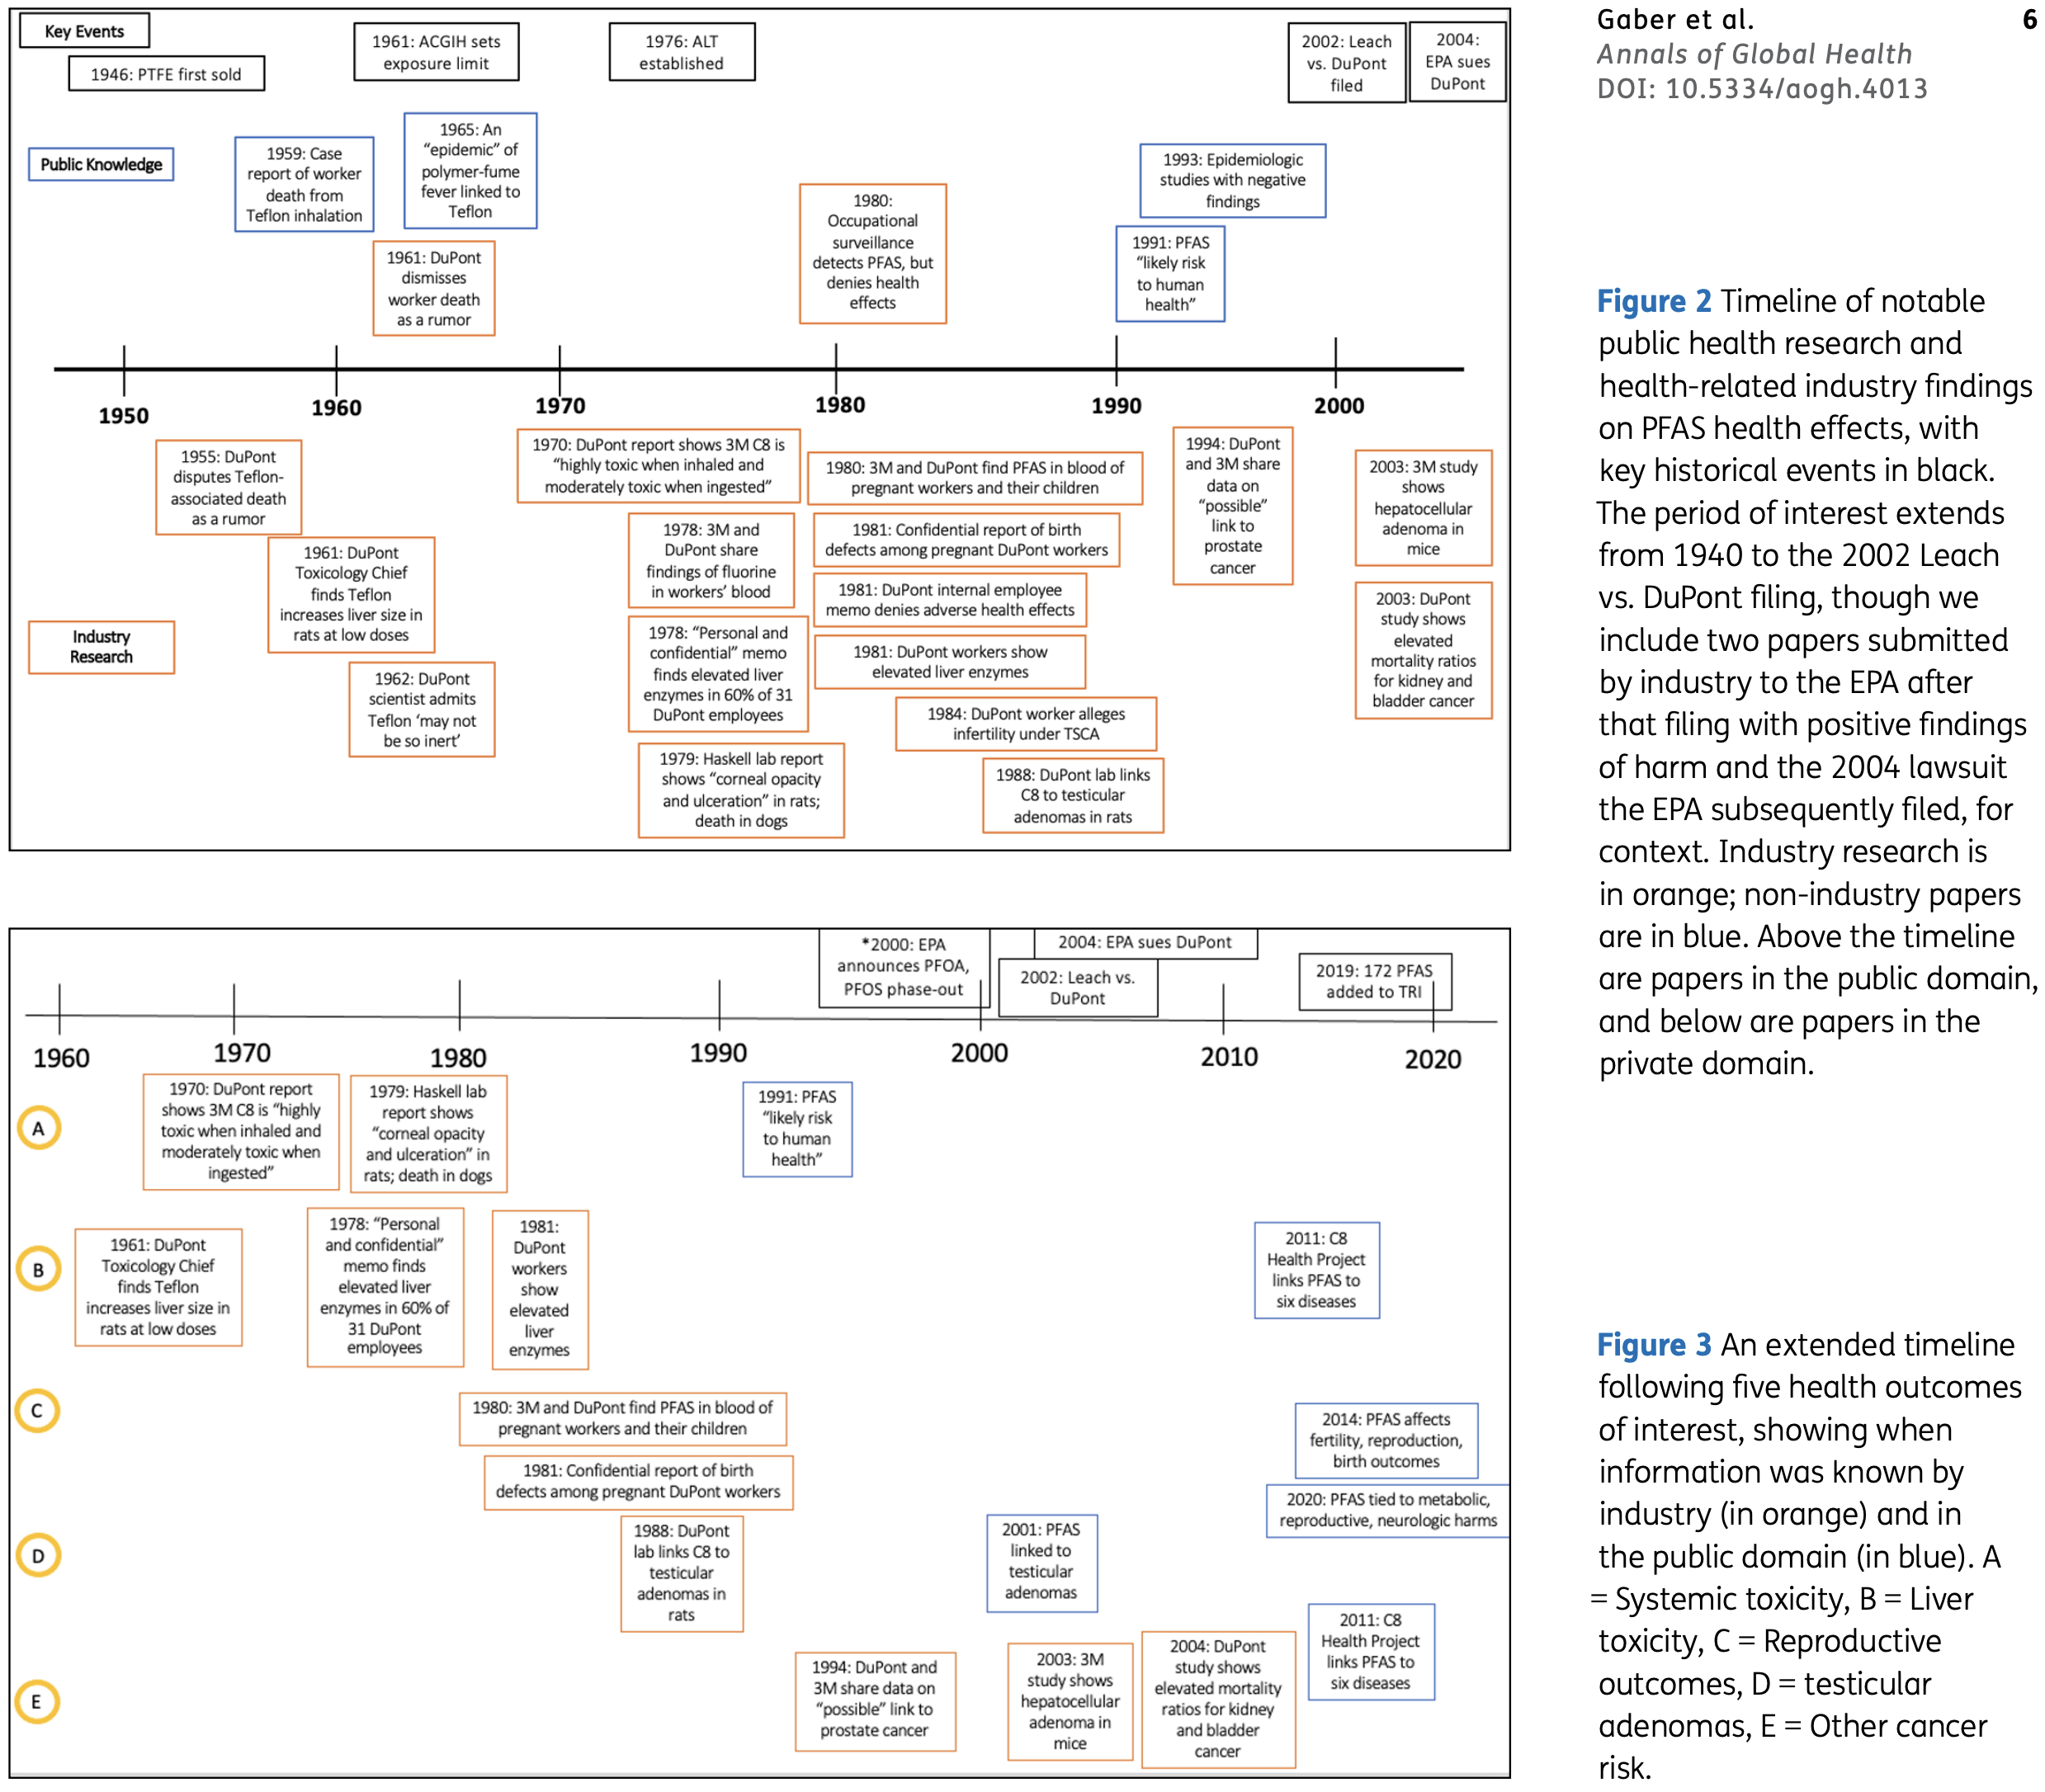
Click the link to read the paper on the Annals of Global Health website (Nadia Gaber, Lisa Bero, and Tracey J. Woodruff). Here’s the abstract:
Background: Per-and polyfluoroalkyl substances (PFAS) are a class of widely-used chemicals that persist in the environment and bioaccumulate in humans and animals, becoming an increasing cause for global concern. While PFAS have been commercially produced since the 1940s, their toxicity was not publicly established until the late 1990s. The objective of this paper is to evaluate industry documents on PFAS and compare them to the public health literature in order to understand this consequential delay.
Methods: We reviewed a collection of previously secret industry documents archived at the UCSF Chemical Industry Documents Library, examining whether and how strategies of corporate manipulation of science were used by manufacturers of PFAS. Using well established methods of document analysis, we developed deductive codes to assess industry influence on the conduct and publication of research. We also conducted a literature review using standard search strategies to establish when scientific information on the health effects of PFAS became public.
Results: Our review of industry documents shows that companies knew PFAS was “highly toxic when inhaled and moderately toxic when ingested” by 1970, forty years before the public health community. Further, the industry used several strategies that have been shown common to tobacco, pharmaceutical and other industries to influence science and regulation – most notably, suppressing unfavorable research and distorting public discourse. We did not find evidence in this archive of funding favorable research or targeted dissemination of those results.
Conclusions: The lack of transparency in industry-driven research on industrial chemicals has significant legal, political and public health consequences. Industry strategies to suppress scientific research findings or early warnings about the hazards of industrial chemicals can be analyzed and exposed, in order to guide prevention.
KEY MESSAGES IMPLICATIONS FOR POLICY MAKERS
This paper analyses how the chemical industry, using industry documents, delayed disclosing the harms of PFAS, costing billions of dollars in health and environmental damages globally.
Many countries are pursuing legal and legislative action to curb PFAS production that may be aided by the timeline of evidence presented here.
The production of chemical toxicity research should be in the best interest of protecting the public’s health, including designing the research question, funding studies, and publishing favorable and unfavorable findings.
Legal settlements against chemical manufacturers should include documents disclosure in order to ensure transparency and accountability for industries and their products.
Public health and environmental policy makers should move towards precautionary principles of chemical regulation.
IMPLICATIONS FOR THE PUBLIC
This paper examines previously secret documents held by DuPont and 3M, the largest manufacturers of PFAS, also called “forever chemicals.” We show how the chemical industry used the tactics of the tobacco industry to delay public awareness of the toxicity of PFAS and, in turn, delayed regulations governing their use. PFAS are now ubiquitous in the population and environment. Consumer awareness can advance calls for safer products by demanding publicly available studies of harm. Public pressure can also influence legislators to pass more health-protective environmental and chemical regulations.
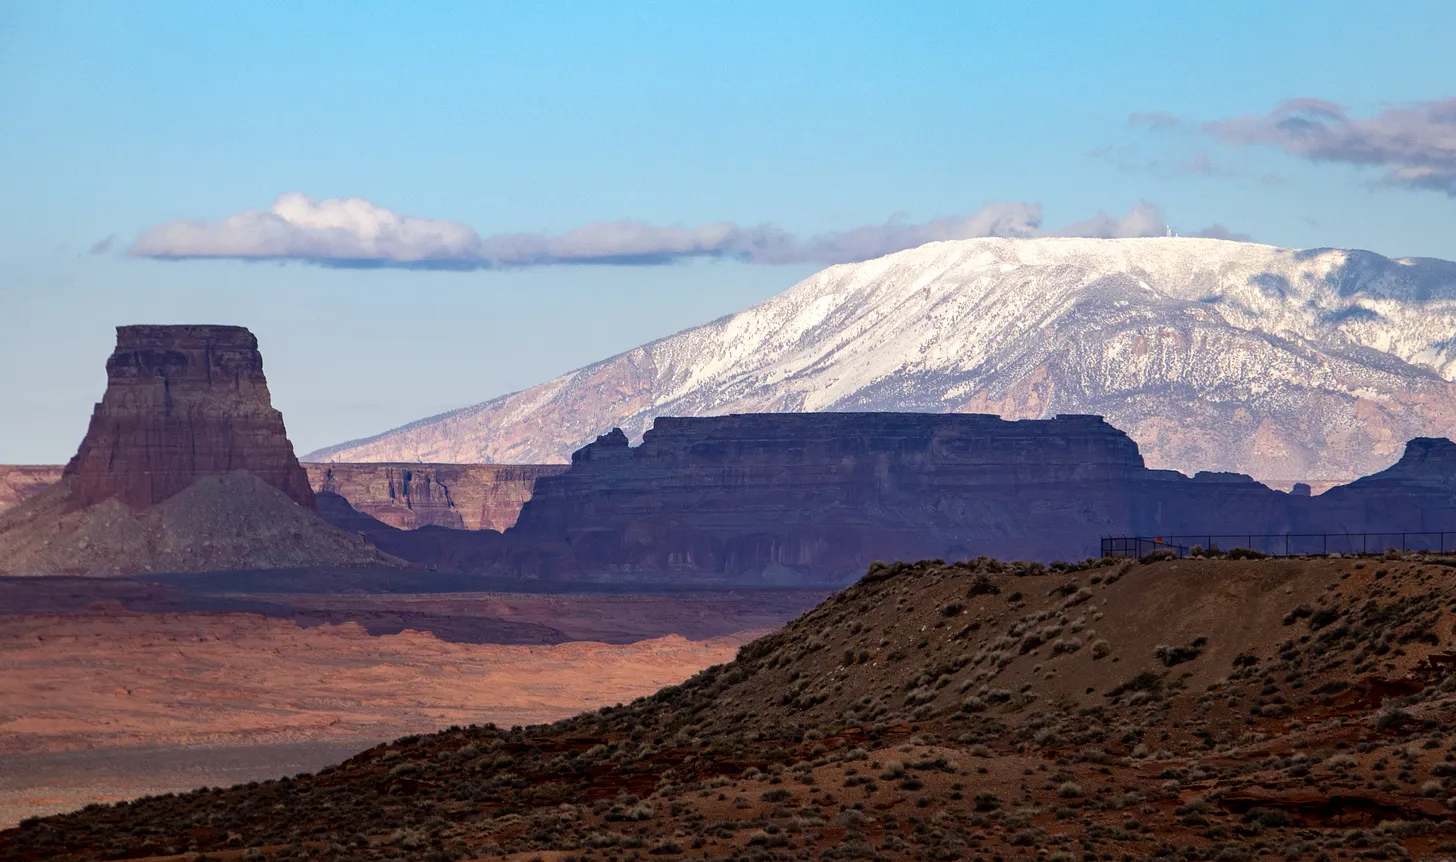
Navajo Mountain March 2023. Jonathan P. Thompson photo.
Click the link to read the article on the AZCentral.com website (Joan Meiners). Here’s an excerpt:
“About 30, 40 years ago, we used to have plenty of rain,” [Percy] Deal said. “And there was a natural spring where water came out on its own. I remember when I was a little boy herding sheep, there was at least two or three places where the water came out. Those springs are dry now. People used to plant corn, squash, potatoes, beans and things like that. Now the ground is so dry that plants don’t grow anymore.”
News of water shortages, exacerbated by climate change, population growth, mining and other development, is everywhere these days in the American Southwest. But on the Navajo Reservation, a sovereign tribal nation that sits on about 16 million acres in northeast Arizona, southern Utah and western New Mexico, nearly 10,000 homes have never had running water.
How that can and should be resolved is one aspect of a case brought before the U.S. Supreme Court on March 20, with the justices’ decision due any day now…
In Arizona v. Navajo Nation (which has been consolidated with the case termed “Department of the Interior v. Navajo Nation”), tribal attorneys argue that, by not providing their nation with sufficient water, the United States has breached a trust obligation related to treaties settled in 1849 and 1868.
At issue is the idea of what it means to “provide” water. All parties agree that the Navajo Nation has reserved water rights, termed Winters rights, that are supposed to “fulfill the purposes of the reservation,” including home and agricultural use. As the oldest users of water in this region, their rights also predate, and therefore outrank, those currently hotly contested between the seven Colorado River Basin states — Arizona, California, Utah, New Mexico, Colorado, Nevada and Wyoming.
Aerial image of entrenched meanders of the San Juan River within Goosenecks State Park. Located in San Juan County, southeastern Utah (U.S.). Credits Constructed from county topographic map DRG mosaic for San Juan County from USDA/NRCS – National Cartography & Geospatial Center using Global Mapper 12.0 and Adobe Illustrator. Latitude 33° 31′ 49.52″ N., Longitude 111° 37′ 48.02″ W. USDA/FSA, Public domain, via Wikimedia Commons
From email from Reclamation Western Colorado Area Office:
The Bureau of Reclamation has reduced the release from 4,600 cfs to 4,300 cfs this morning at 8:30 AM to allow local emergency management entities to assess and respond to conditions on the ground downstream of Navajo Dam. Reclamation will continue working closely with emergency management during this managed release and a notice will be sent out prior to the next release change.
Areas in the immediate vicinity of the river channel may be unstable and dangerous. River crossing may change and be impassable as flows increase. Please use extra caution near the river channel and protect or remove any valuable property in these areas.
Please stay tuned as a notice with an updated schedule will be sent out daily during the release. Notices will also be posted to our website along with the latest release schedule. http://www.usbr.gov/uc/wcao/water/rsvrs/notice/nav_rel.html
For more information, please see the following resources below:
Bureau of Reclamation:
• Susan Behery, Hydrologic Engineer, Reclamation WCAO (sbehery@usbr.gov or 970-385-6560).
A short post, to catch up on Colorado River current events. As you probably know, if you haven’t been living in a media-free cave, the three Colorado River states below the canyon region have proposed another alternative plan for saving the River’s reservoir system.
Their proposal, for answering the Interior Department’s call for cuts of at least two million acre-feet (maf) of water annually, is to cut three maf total over the next three years – and they want 1.2 billion dollars from the federal government to execute their plan.
Their plan is basically to pay farmers to voluntarily fallow some of their land. They say they will do half of the cuts – 1.5 maf – in 2024, the remainder over the following two years. Beyond that, there are no firm details at this writing as to how much of the cuts will come from each state, how much they will be paying farmers, et cetera.
Basically, what it looks like on the surface of it, is that the Lower Basin states have countered the Bureau’s four existing scenarios – two from the Bureau of Reclamation, one from California, and one from the other six River states – with an offer to do half of the minimumcuts the Bureau said we need, and they want a billion dollars to do it. What a deal.
If their plan to pay farmers to leave the water in the system sounds familiar, that may be because the four Upper Basin States tried a similar plan this year, the System Conservation Pilot Program, with a fund of $125 million from the ill-named Inflation Reduction Act. Upper Basin farmers did not rush to take up the offer. Only 88 submitted applications to participate, of which around 20 percent were rejected; the remainder will, if things work out as projected, save 39,000 acre-feet at a cost of $16 million. That is a very small piece of two million acre-feet.
The High Line Canal is an irrigation ditch built in the 1880s. Denver Water still uses the canal to deliver irrigation water to customers when conditions allow. Photo credit: Denver Water.
It has been said that farming – especially irrigated farming – is a calling, not an occupation. I have heard farmers and ranchers talk about ‘a working contract with the land,’ and in the Upper Basin at least there seems to be something almost offensive to many farmers about the idea of being paid to not farm some of their land. Ranchers in the Upper Gunnison say it takes up to five years to bring a hayfield back to full productivity after a year of no water (or very little). We’ll see, I guess, if Lower River farmers have the same basic feelings….
A further reason for the low turnout for the Upper Basin’s System Conservation Program might be that Upper Basin farmers believe – correctly enough – that the two million acre-foot ‘structural deficit’ is not their problem and they should not be expected to exercise themselves to help deal with it. A logical enough response when working with a Compact that, as one of the Compact commissioners said, is ‘almost making two rivers out of one in the Colorado River.’ The ‘Glen Canyon Wall’ near Lee Ferry eliminated that ‘almost.’ There has been no indication from the Lower River states that they would be merciful to the Upper River states, should the drought (not ‘caused’ by the Upper States) drive the available flow past Lee Ferry below the Compact allotment; so why should the Upper River states feel empathy for the Lower Basin states?
It was reported in the national media, by the way, that the Upper Basin states have ‘accepted’ the Lower Basin’s proposal. They have not, yet. The four Upper states merely said it was okay for the plan to be evaluated along with the other four proposals in the Bureau’s ‘Supplemental Environmental Impact Study.’
West snowpack basin-filled map April 16, 2023 via the NRCS.
All that noted – the Lower Basin proposal will probably be accepted for a variety of reasons. One reason is that the runoff from a good snowpack is probably going to give temporary relief on the reservoir levels; we should end the water year with both Powell and Mead Reservoirs higher than they were at the beginning of the year (water year is October to October), and that provides a little breathing room. (Keep in mind, though, that the Bureau first issued its major warning and challenge in 2022, saying that big reductions had to happen beginning in 2023. Now, nothing big will happen until 2024. Pray for snow next winter too.)
Another reason the proposal will probably be accepted is because if any of the other four proposals were to be chosen by the Bureau, one or more of the Lower Basin states would sue the government. There might be an element of desperation to both the gambit of promising to try to deliver only half of the requested cuts, and to the threat to sue if asked to deliver the whole 2 maf/year. The Bureau wants the Lower River region that serves a tenth of the national population and produces most of our winter fresh green stuff to cut their water use by almost one third – and do it next year. That’s a big request, maybe an unreasonable request.
Never mind that, had the Bureau and the seven Basin states been living in the real world, they would have taken care of the ‘structural deficit’ decades ago, with a gradual drop in Lower River use, reflecting the growth of use in the Upper River states that was eating into the so-called ‘surplus’ that the Lower Basin had grown to depend on take care of its system losses, and also its half of the allotment to Mexico.
And a final reason why their proposal will probably be accepted? 2024 is a presidential election year, with the current administration on the line, and both Arizona and Nevada are important swing states. ‘Nuff said.
It will come down to whether, next year, the three Lower River states can find enough farmers and cities willing to voluntarily give up a million and a half acre-feet of water next year. Tucson and the Gila River Indians have already made commitments. Meanwhile – pray for snow next winter.
What effect will fallowing thousands of acres of fields have? Will it lead to another Dust Bowl?
Is the electricity from the dams used to deliver water (e.g. to power the pumps for the Central Arizona Project)?
And what purpose do the two reservoirs (Powell and Mead) serve in the system and how does that factor into the bargaining between the states?
I’ll just explore the first two today, since that’s all I have room for.
My short answer for question #1 is: I don’t know. One of the problems with the deal is that very few details have been made public, so it’s difficult to understand what ramifications it might have.
But we do know that the Lower Basin states plan to come up with 3 million acre-feet of water over three years — or about 1 million acre-feet per year — by paying water users to slash consumption. Federal funds will be used to reimburse folks for 2.3 million acre-feet of those cuts, while state, local, or other funds will be used for the remaining 700,000 acre-feet. It’s fair to guess that a bulk of these savings will be realized by paying farmers not to irrigate their crops, since agriculture is by far the biggest user of Colorado River water, and that makes more logistical sense than paying folks not to water their lawn. So that’s a good place to start.
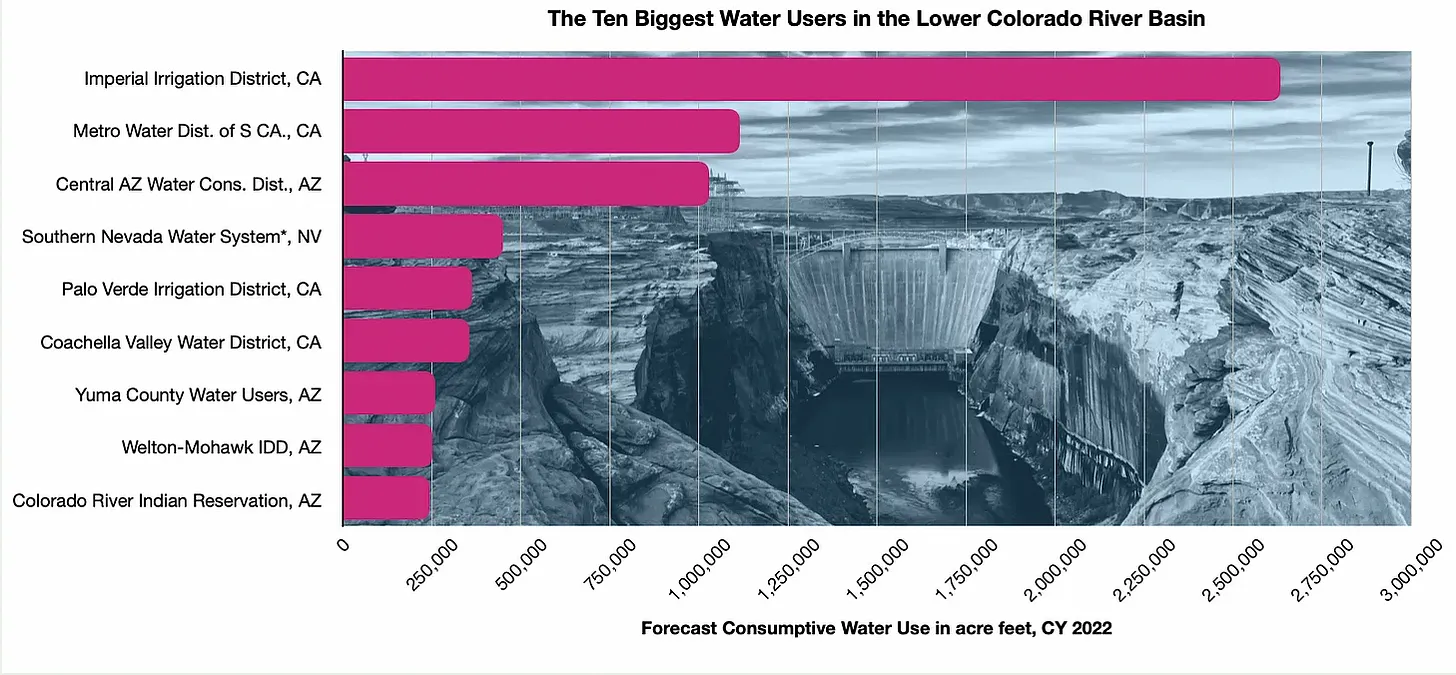
I’ve also read reports saying the Imperial Irrigation District, the largest single water user in the Basin, plans to give up 250,000 acre-feet per year (which will be included in the above amounts).
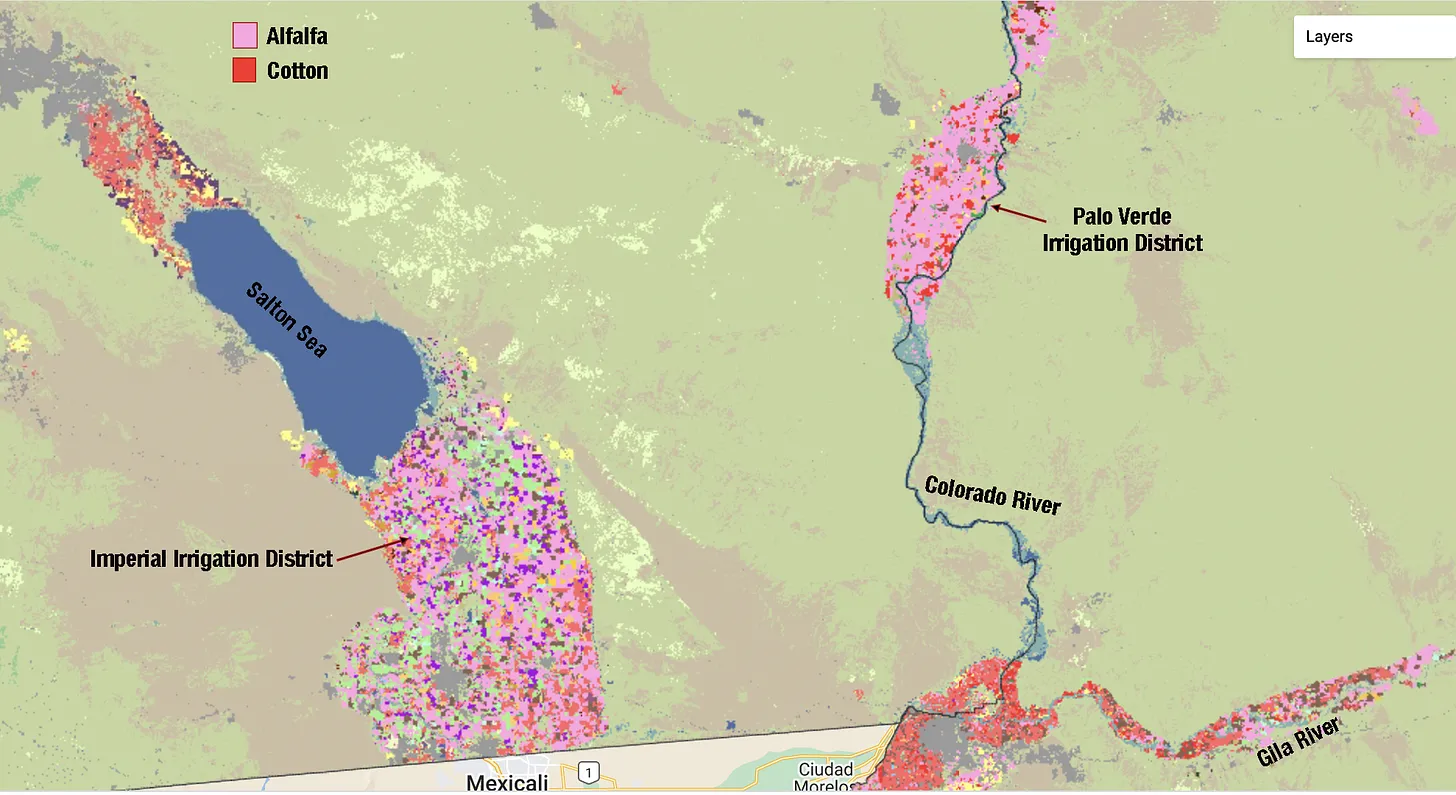
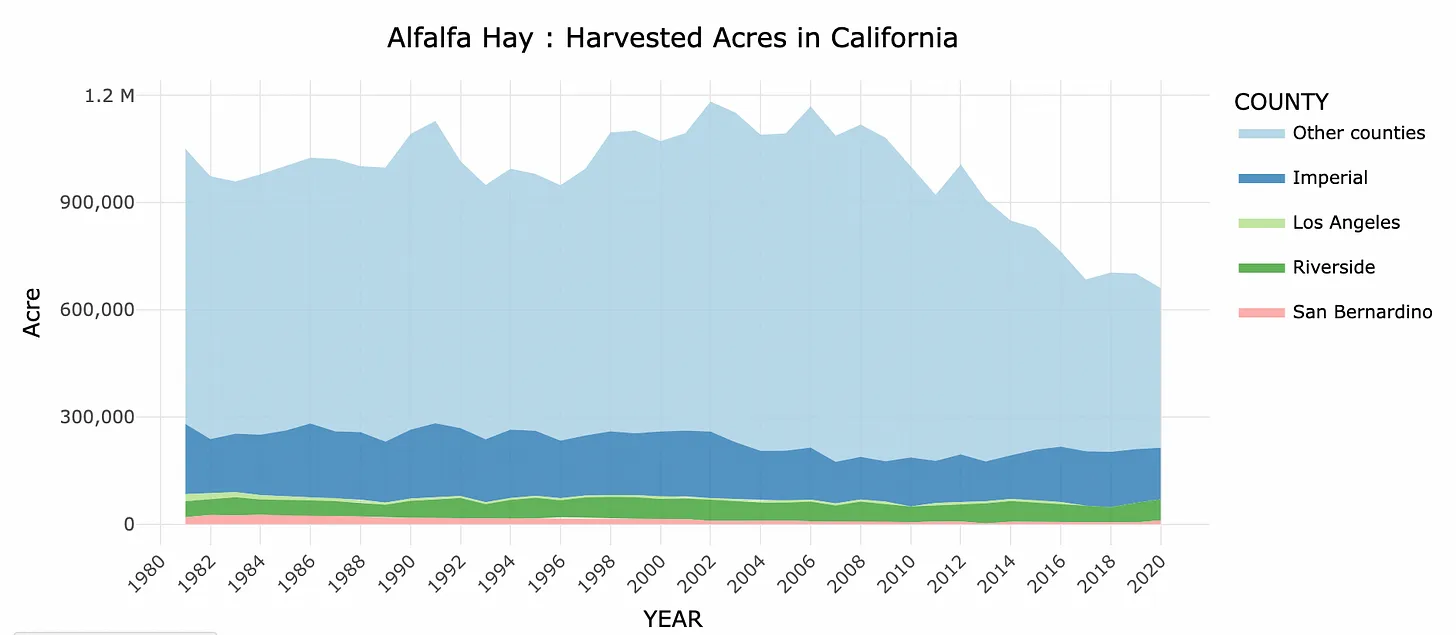
One of the most abundant crops in the Colorado River Basin is hay, primarily alfalfa. It is also one of the thirstiest crops. Growing one acre of alfalfa guzzles around four acre-feet of water per year, depending on location, climate and length of growing season. In Colorado’s high-elevation, cool San Luis Valley, alfalfa consumes about two acre-feet per year; in California’s sea-level Imperial Valley — one of the hottest places in the nation — the crop can require more than six acre-feet of water per year.
Since the fallowing is likely to occur in hot, dry southern Arizona and California, we’ll go with the six-acre-feet-annually figure. That would mean that in order to reach the target water cuts, irrigation would have to be stopped on a total of 167,000 acres of alfalfa fields, or roughly three-fourths the size of the Salton Sea. Targeting less thirsty crops would require fallowing a larger amount of acreage. About 42,000 acres of that would be in the Imperial Irrigation District, assuming the fields they fallowed were alfalfa. For some more context: An MIT study found you’d need 90,000 acres of solar panels to replace the Diablo Canyon nuclear power plant’s generation.
So, yeah, it’s a lot of acreage, and ceasing irrigation on that land could very well turn it into desiccated weed patches. Maybe it won’t be Dust Bowl kinda stuff for now, but it could get ugly, especially in a dry summer. In the San Joaquin Valley in California, for example, a groundwater management program (no relation to the Colorado River crisis) is forcing farmers to fallow fields, which is leading to serious dust and air quality problems.
The Imperial Valley is next to the Salton Sea, where the air — and residents’ lungs — is already thick with dust. Fallowing all of the Valley’s alfalfa fields surely would further exacerbate the problem. At this point it’s not clear where fields will be fallowed, only that some will be in California and some in Arizona (Nevada uses almost all of its Colorado River water for municipal uses in Las Vegas and surrounding communities).
Media outlets have reported that the states plan to pay those farmers $1.2 billion from the federal Inflation Reduction Act. That would put a $521 price tag on each acre-foot of water not going onto a field. Using the 6 acre-foot per acre of alfalfa figure, that would mean an Imperial Valley farmer could get more than $3,000 per acre to not grow anything.
That’s not a bad deal. According to the UC Davis cropland data layer site, Imperial Valley farmers harvested 144,000 acres of alfalfa hay in 2020. They produced 1.14 million tons of alfalfa hay, valued at $200.44 million — or an average of $1,391 per acre. In other words, the farmers could bring in twice the revenue for not farming than for farming their acreage.
But it would also reduce the supply of alfalfa, causing prices to increase, which would likely ripple through the beef and dairy industries, where most of that alfalfa goes. That, in turn, could eventually make its way down to the ice cream and cheese aisles at your local grocery store.
2. The second point Ann made was that moving water from the Colorado River to fields and cities takes a lot of energy, including the power generated by the dams on the Colorado River. So when irrigators reduce their Colorado River water use it’s leaving more water in the river, which can generate more energy when run through the dams’ turbines, which can move more water to the fields … Woah, I am getting dizzy here.
It’s a classic example of the water-energy nexus or, in this case, the water-energy-water nexus, one of my favorite topics.
Glen Canyon, Hoover, and several other dams on the Colorado River system are hydroelectric, meaning as water runs through them, it can be routed through turbines, generating power. As reservoir levels drop, so does the power generation capacity of the dam. And if the reservoir levels fall below the openings to the penstocks — or tubes leading to the turbines — then power production ceases altogether.
This freaks folks out in these climate changed times for good reason: The warmer it is, the more power we need to run air conditioners, and the more water irrigators need to put on their crops, meaning more power is needed to move that water. But the warmer it is, the lower the reservoirs and the less power we have. Ack!
The Central Arizona Project is one of the biggest water-moving projects on the Colorado River. Its pumps pull water from the Colorado River at Lake Havasu and move it 336 miles across the Arizona desert (in an uncovered canal, allowing massive amounts of water to evaporate), with a total elevation gain of more than 2,900 feet. That takes a buttload of energy. In fact, it takes so much power that the coal-fired Navajo Generating Station was built in large part to run the CAP pumps.
2 million megawatthours: Annual power consumption of the Central Arizona Project pumps.
2 million megawatthours: Annual power consumption of the five pumping stations on the Colorado River Aqueduct, which delivers water to Los Angeles and surrounding areas.
2.5 million megawatthours: Annual power output of Glen Canyon Dam in 2022
3.9 million megawatthours: Annual power output of Glen Canyon Dam in 2008
1.5 million megawatthours: Annual power output of Hoover Dam in 2022
259 million megawatthours: California’s annual power consumption.
The Navajo Generating Station was retired in December 2019, forcing the CAP to find power from elsewhere. Now the project gets 70% to 80% of its power from market forward and short-term purchases; 12% to 15% from the Salt River Project electric utility; 6% from Hoover dam; and 4% from a solar installation. About half the power for the Colorado River Aqueduct pumps comes from Hoover and Parker dams, with the rest coming from a mix of market purchases and hydroelectric generation within the Aqueduct system.
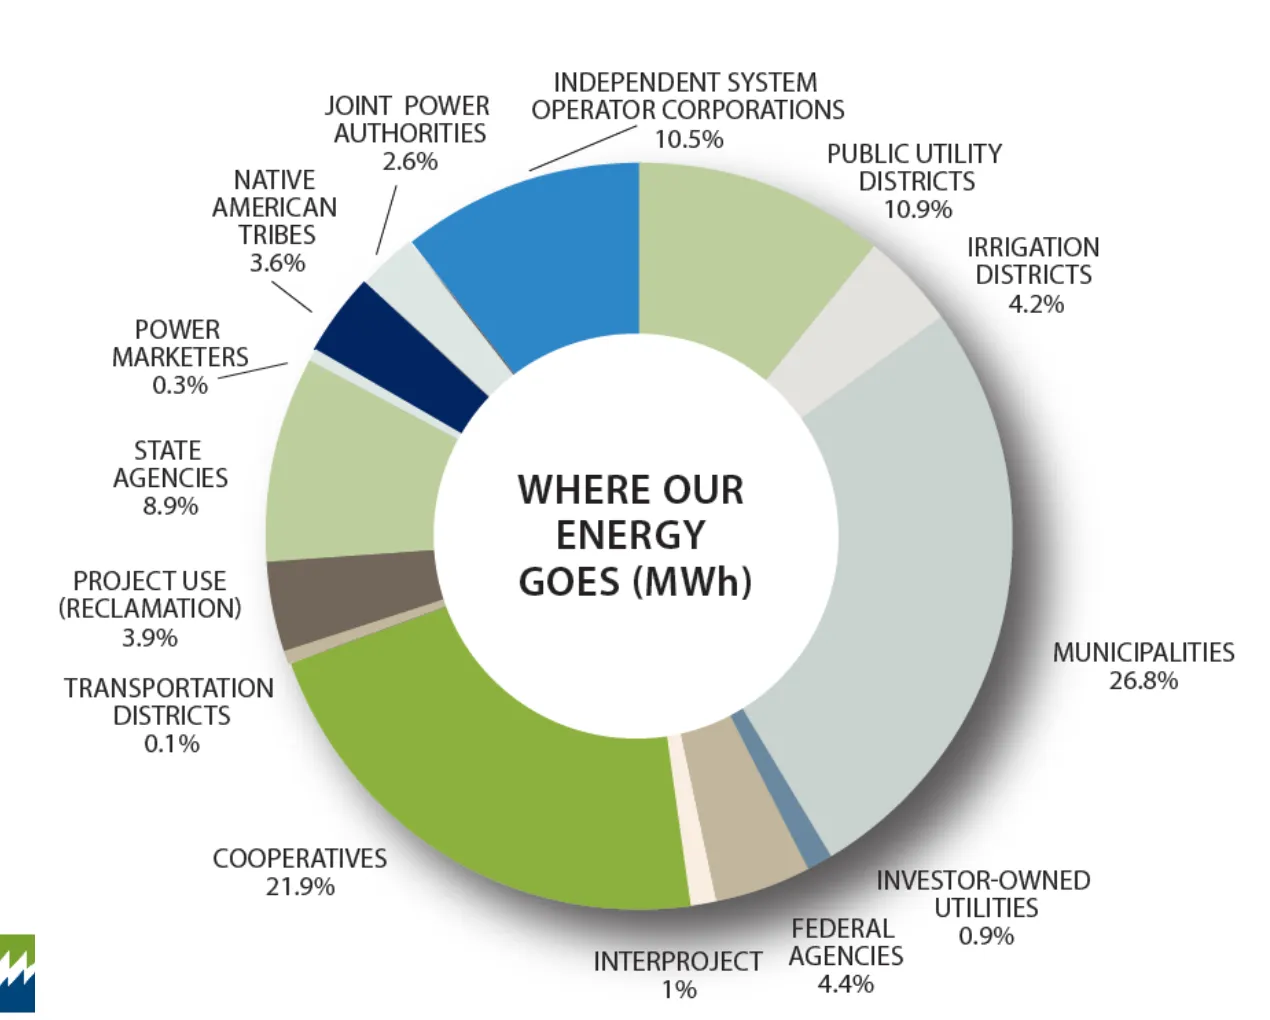
And then there’s the question of how much of the dams’ electricity goes toward moving water around. The Western Area Power Administration markets the electricity from Glen Canyon Dam and 56 other hydropower dams. Here’s a breakdown of who purchases that power:
While only 4% goes to irrigation districts, you can assume that portions of many of the other categories go to moving water or treating it. So if the hydropower capacity of the dams were to shrink or vanish altogether, all of these customers — including the water folks — would have to find new sources of electricity.
“This Supreme Court ruling weakens our federal standards for clean water, threatening our ability to protect ecosystems and landscapes needed for birds and communities across the country,” said Julie Hill-Gabriel, Audubon’s Vice President for Water Conservation.
“Federal experts will no longer be able to require certain development permits in America’s decimated wetlands. This decision undermines Clean Water Act protections for many types of waterways that birds and people need, all while birds are telling us that more action is needed to protect their future.”
In today’s [May 25, 2023] ruling, the United States Supreme Court curtailed the ability of the Environmental Protection Agency (EPA) and the United States Army Corps of Engineers to regulate “waters of the United States”. While the Clean Water Act includes regulatory definitions for most large bodies of water and rivers, smaller waterways which may be seasonal or disconnected are not as clearly defined. Today’s ruling limits the ability of the agencies to permit activities on many of these smaller waterways and means that unregulated development can occur in many of these areas.
With the loss of 3 billion birds in the past 50 years—in part due to dwindling wetlands and significant development of natural spaces—and Audubon science showing that two-thirds of North American bird species are at risk of extinction from climate change, action is needed to protect the water bodies and habitat that birds need to survive. Waters throughout the United States like seasonal streams and isolated wetlands serve as essential habitat for birds and other wildlife. These water bodies provide crucial sources of drinking water, food, and nutrition for birds. Birds also uses lakes, streams, and wetlands for breeding and nesting, as well as for rest stops during long migratory journeys.
Wetlands and seasonal streams provide more than just critical bird habitat—they also provide us with nature’s filters to clean our drinking water and protect us from storms, floods, and other climatic stressors. Too many low-income communities, Tribal communities, and communities of color do not have consistent access to safe, affordable drinking water and strong protections under the Clean Water Act are needed to support these communities.
“More than fifty years ago, Congress came together in a bipartisan manner to pass the Clean Water Act,” said Hill-Gabriel. “We all need clean water to survive and thrive and this ruling means that there are now fewer tools in the toolbox for our federal agencies to protect vital habitats and waterways for birds and people.”
Audubon will continue working with state and local decision-makers to strengthen protections for waterways that birds need.
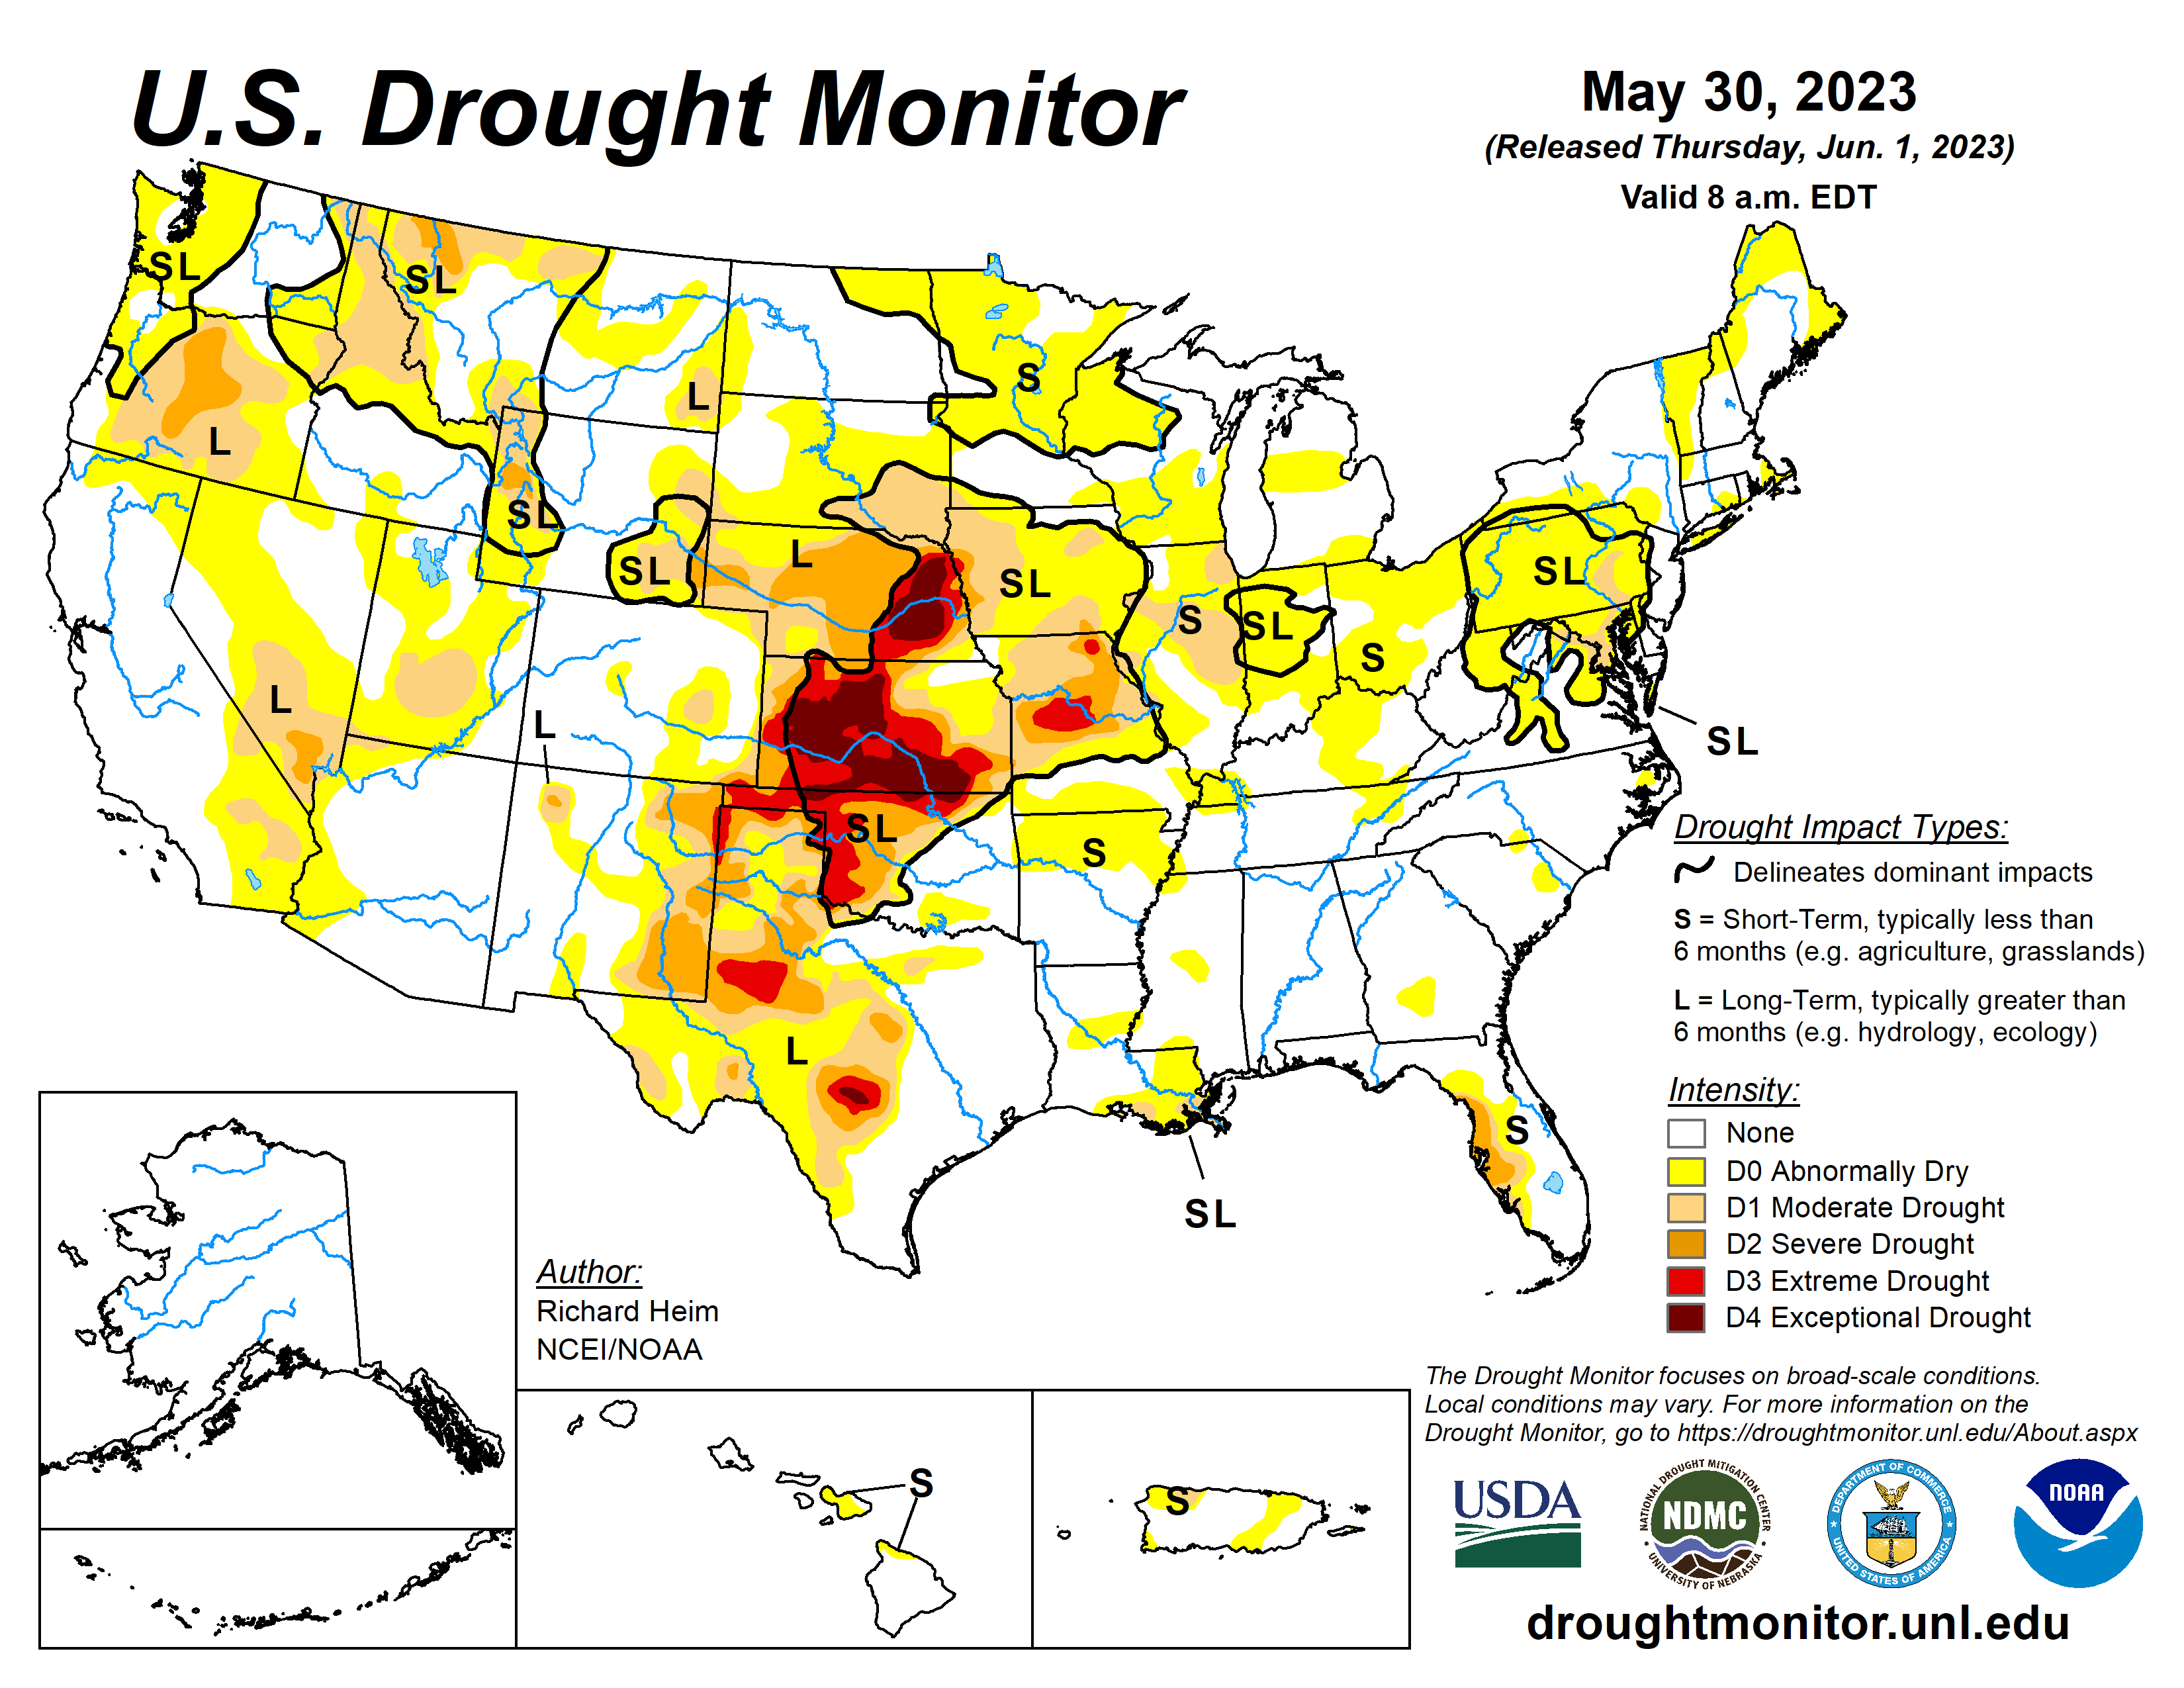
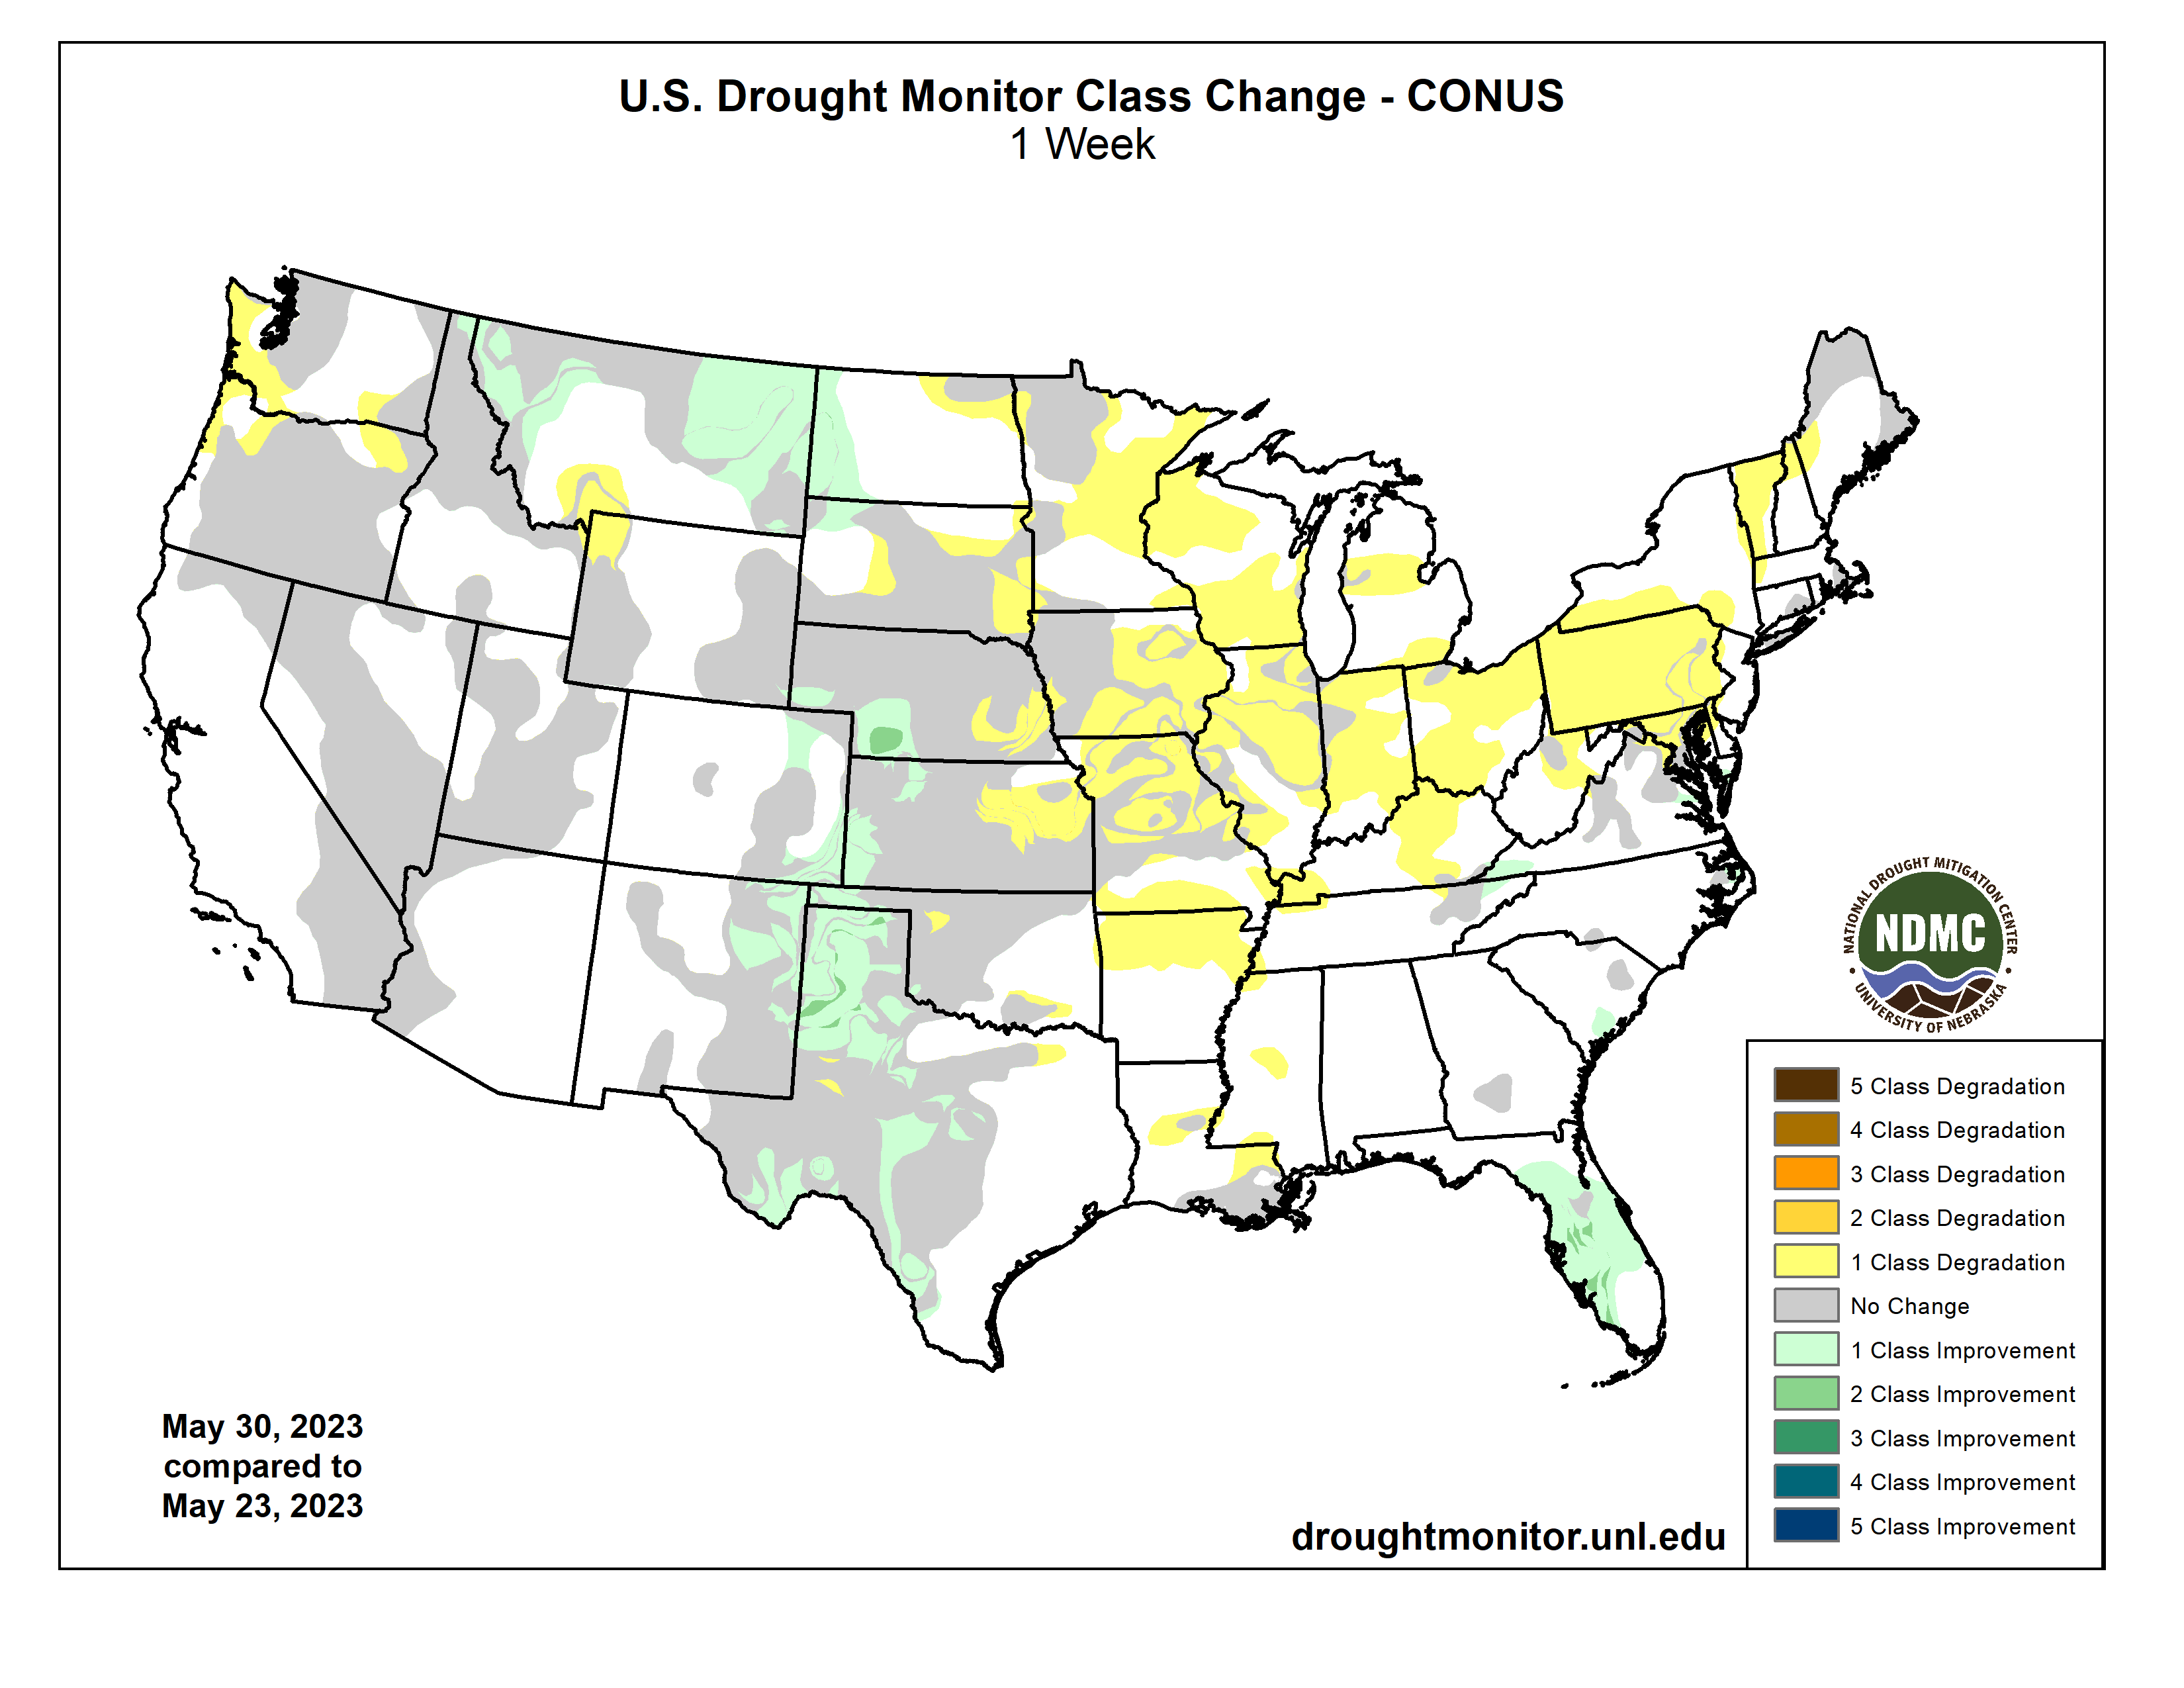
The upper-level circulation over the contiguous U.S. (CONUS) during this U.S. Drought Monitor (USDM) week (May 24-30) was dominated by three features: a trough over the West, a ridge that extended from the southern Plains to the Great Lakes, and a cutoff low over the Southeast. This pattern resulted in targeted areas of precipitation, some of it heavy, while large parts of the CONUS received little to no precipitation. Pacific weather systems moved across the West, but their fronts stalled out when they ran into the ridge over the Plains. The northwesterly flow associated with the trough inhibited precipitation across parts of the West, so the week was wetter than normal only from the Great Basin to northern Rockies. A southerly flow over the Plains was created between the western trough and eastern ridge. This flow funneled Gulf of Mexico moisture across the Plains. The moisture fed thunderstorms and weather complexes that developed along the stalled-out fronts and dry lines, resulting in above-normal precipitation across western portions of the Great Plains from Texas to Montana. Several inches of rain fell with some of these thunderstorms, resulting in localized flooding. The ridge inhibited precipitation, so a large part of the country from the Mississippi River to the Northeast received little to no precipitation. The exception to this was the Southeast, where the cutoff low pulled in Gulf and Atlantic moisture to spread above-normal precipitation across much of Florida and the Carolinas to Appalachians. Weekly temperatures averaged cooler than normal from the southern Plains to East Coast, but they were warmer than normal across the northern Plains and northern parts of the West. Abnormal dryness or drought spread across a large part of the Midwest and Northeast, and in parts of the Pacific Northwest, Puerto Rico, and Hawaii. Drought or abnormal dryness contracted across the Florida peninsula, across large areas in the western Great Plains, and in northwest Puerto Rico…
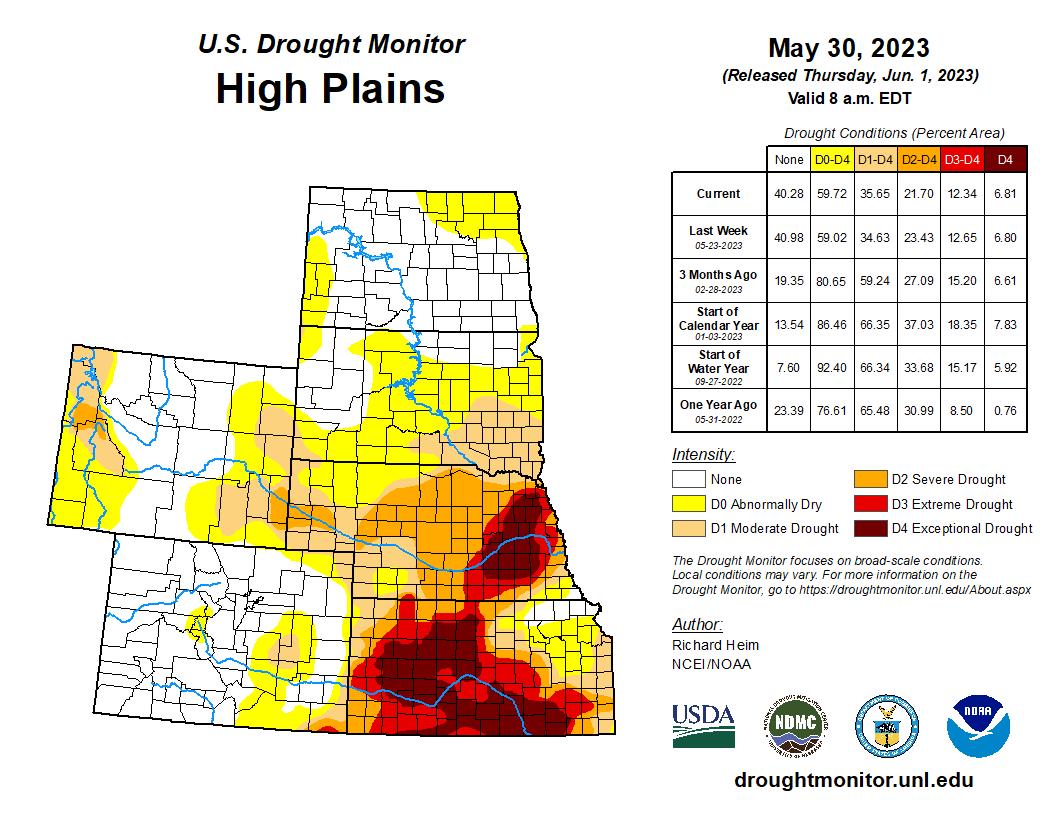
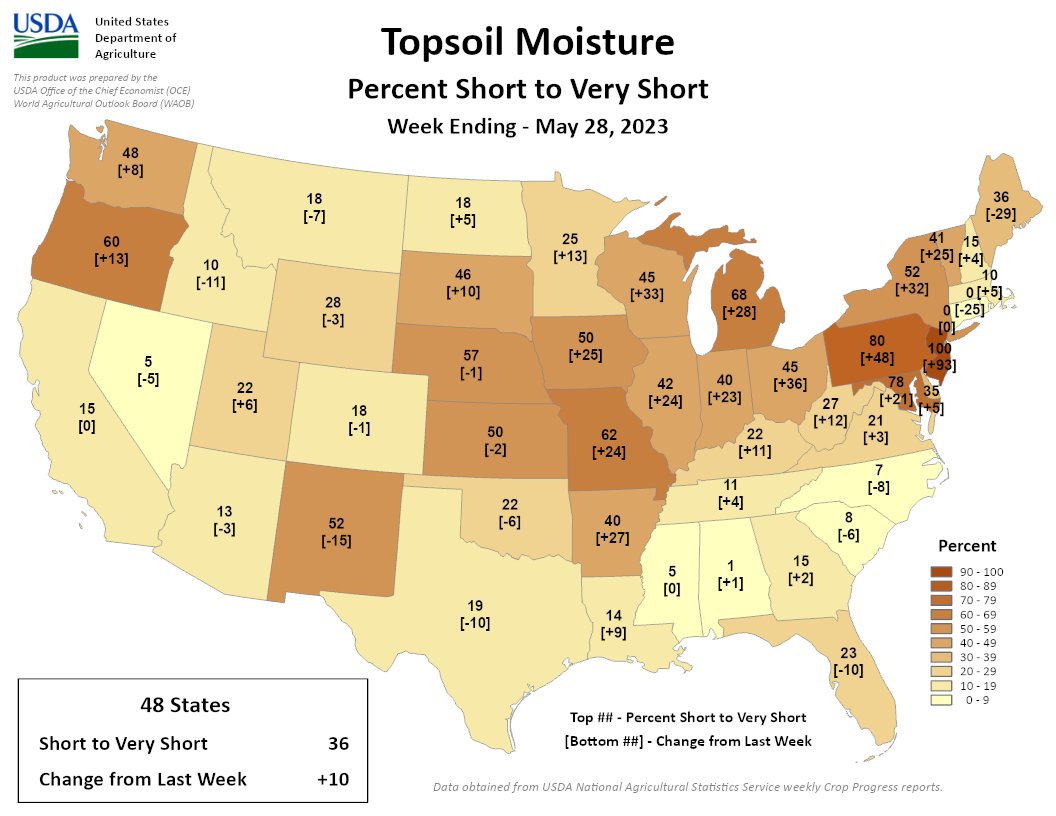
Locally heavy rain fell over western parts of the High Plains region while eastern parts had a dry week. Several stations in southwest Nebraska received over 5 inches of rain during this USDM week, with 10 inches reported near McCook. The rain replenished soil moisture, but caused extensive flooding. The rain caused a 2-category improvement in drought conditions in southwest Nebraska. Two inches or more of rain fell in localized parts of northeast Colorado, western Kansas, northeast Wyoming, and the western Dakotas, prompting pullback of abnormal dryness or moderate to exceptional drought. But continued dry conditions in the eastern portions of the region resulted in expansion of abnormal dryness or moderate drought in the Dakotas, abnormal dryness to extreme drought in eastern Kansas, and severe to exceptional drought in eastern Nebraska. Based on May 28 USDA data, 69% of the winter wheat crop in Kansas and 51% in Nebraska was in poor to very poor condition, and more than 40% of the topsoil moisture was short or very short in Nebraska (57%), Kansas (50%), and South Dakota (46%). More than two-thirds of the subsoil moisture was short or very short in Nebraska (75%) and Kansas (68%)…
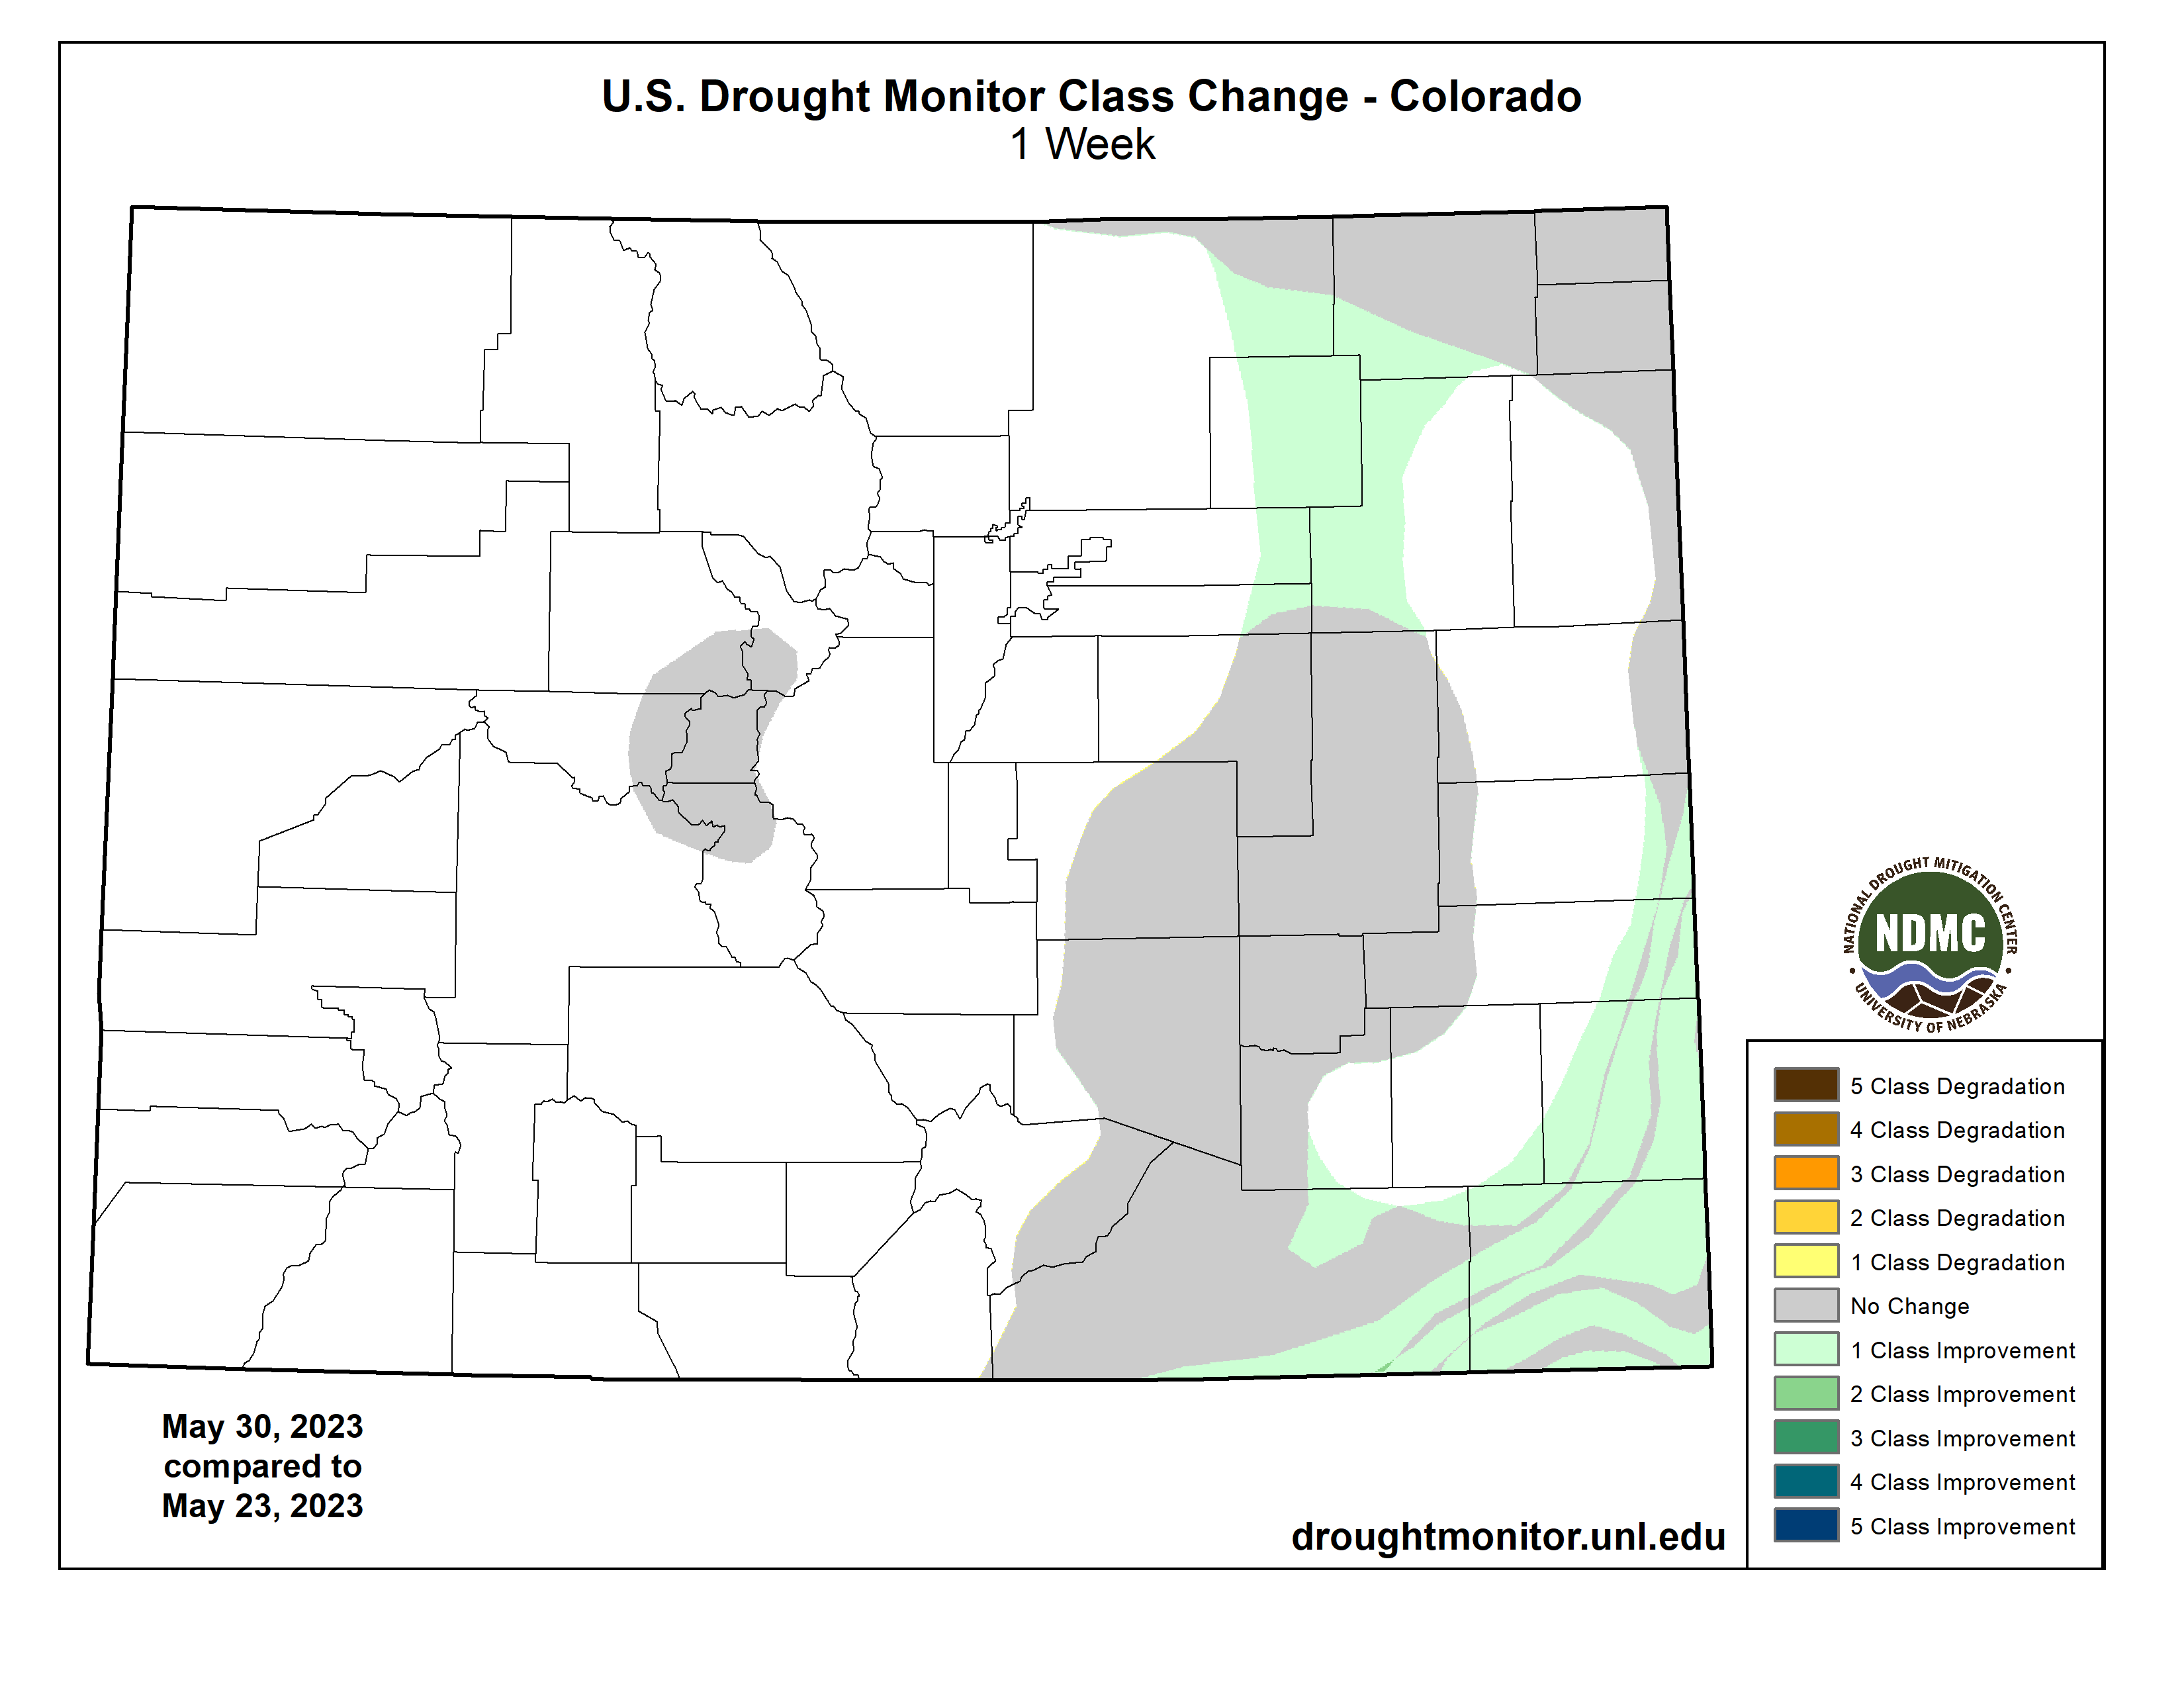
Colorado Drought Monitor one week change map ending May 30, 2023.
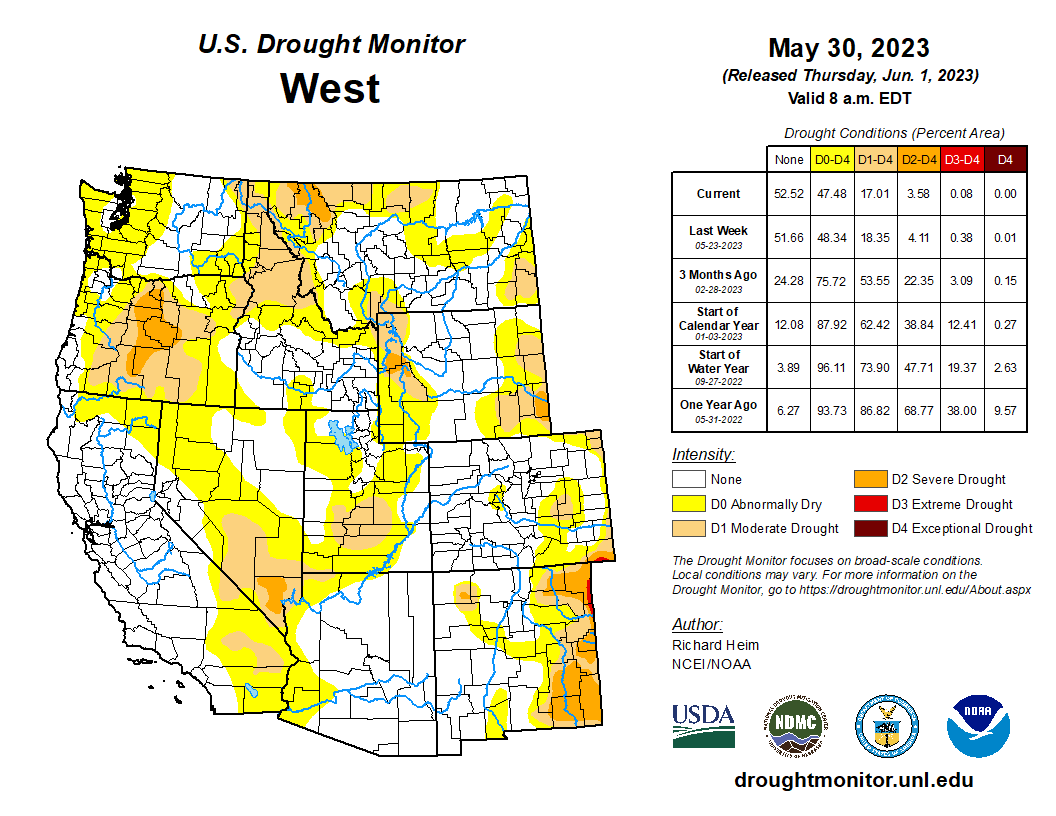
Half an inch of rain fell over parts of northern California and from Nevada to the northern Rockies, with much of Montana receiving 2 or more inches. Eastern parts of New Mexico were soaked by 2 to locally over 4 inches of rain, with over 7 inches recorded near Texico. But the rest of the southern third of the West region, and most of Oregon and Washington, received little to no precipitation. D1-D3 were pulled back in eastern New Mexico, and D0-D2 were trimmed in Montana. But D0 expanded in parts of Oregon and Washington where the last 30 days have been unusually warm and dry, soils were drying, and streamflow was decreasing, and D0-D1 expanded in Yellowstone National Park and adjacent southwest Montana. May 28 USDA data revealed 60% of the topsoil moisture in Oregon, 52% in New Mexico, and 48% in Washington was short or very short…
Western parts of the South region were wet, while eastern parts were mostly dry. Extreme eastern Tennessee received some rain from the Southeast’s cutoff low, but dry conditions dominated across Arkansas, Louisiana, Mississippi, and Tennessee. D0 expanded in parts of these states. Heavy rain inundated parts of western Texas and Oklahoma, causing contraction of abnormal dryness and moderate (D1) to exceptional (D4) drought. Over 5 inches of rain was recorded at several stations in the Texas panhandle. Soils were wet, streamflow was high, and 6-month precipitation deficits were erased across much of the Texas panhandle. D3 (extreme drought) expanded in Oklahoma just east of where it rained. May 28 USDA data revealed 40% of the winter wheat crop in Texas was in poor to very poor condition…
Looking Ahead
For June 1-6, an upper-level ridge will dominate the middle part of North America, bringing above-normal temperatures to the north central states and Pacific Northwest. Upper-level troughs and closed lows will cover much of the West and New England, bringing cooler-than-normal temperatures to New England and southern parts of the West to the southern Plains. Like the last 7 days, a southerly flow of Gulf of Mexico moisture will feed showers and storms that develop from the Rockies to the Mississippi River during the next 7 days. An inch or more of rain is forecast from the southern Plains to northern Rockies, with locally 4 inches or more from the Texas panhandle to southern Kansas, and locally 2 inches or more in parts of Colorado to Montana. A fourth of an inch or more can be expected from California’s Sierra Nevada to the Great Basin, across the northern Plains to Mississippi Valley, in the Tennessee Valley, across the Gulf of Mexico coast, and along the Appalachians to Northeast. New England may see over an inch of rain, while much of the Florida peninsula will be inundated with another 2+ inches of rain. Little to no precipitation is predicted for the eastern Great Lakes to Ohio Valley, the interior Southeast, and southern and western portions of the West.
For June 6-14, a warmer-than-normal pattern is likely for the Pacific Northwest to western Great Lakes, the northern half of Alaska, and the Alaska panhandle, with cooler-than-normal temperatures across southern portions of the West, the southern Plains, and from the Appalachians to New England. Odds favor wetter-than-normal conditions across the West, southern Plains, western portions of the central to northern Plains, and the southwest half of Alaska, with drier-than-normal conditions across the Great Lakes, Upper Mississippi Valley, Ohio Valley, and northeast Alaska.
US Drought Monitor one week change map ending May 30, 2023.
Colorado River “Beginnings”. Photo: Brent Gardner-Smith/Aspen Journalism
Click the link to read the article on the Sky-Hi News website (Kyle McCabe). Here’s an excerpt:
The river district’s Public Relations Director Marielle Cowdin spoke about the district’s work. She highlighted the Colorado River’s crisis, saying that the increased precipitation over the last year will not save the river…Cowdin talked about the water consumption differences between the upper and lower basin states, highlighting that upper basin states make cuts more effectively because they do not have massive reservoirs like Lake Mead or Lake Powell to rely on in drier years.
“Between 2020 and 2021, the four upper basin states cut our water consumption by 1 million acre-feet — just on our own because the water wasn’t there,” Cowdin said. “Instead of about 4.5 million acre-feet of water use, in that year timeframe, we only used 3.5 (million).”
The lower basin states’ 2020-21 consumption went up 600,000 acre-feet from their average use, Cowdin said. The annual water usage split between the states has been about 60%, or around 8.8 million acre-feet, used by the lower basin versus 30%, or around 4.4 million acre-feet, used by the upper basin, with the remaining water going to Mexico…
The next speaker, Rebecca Mitchell, the Colorado Water Conservation Board director and Colorado’s commissioner to the Upper Colorado River Commission, was the special guest at the event. She spoke about the Bureau of Reclamation’s Draft Supplemental Environmental Impact Statement (SEIS) and news that broke about it the day of the meeting. Mitchell explained that the bureau’s SEIS came after the lower basin states did not respond to the bureau’s June 2022 announcement that states needed to cut 2-4 million acre-feet. That announcement, she said, was not a surprise to those working on the Colorado River…Differences between the upper and lower basin states came up several times in Mitchell’s talk. She mentioned that the six-state plan, which included all states besides California, acknowledged that the upper states have shortages annually because, unlike the lower states, they do not have huge reservoirs from which to draw…On May 22, the day of the meeting, the bureau announced a pause on the SEIS. Mitchell explained that the lower basin states had presented a plan which included temporary cuts that would amount to 3 million acre-feet from 2024-26 but provided few details on how cuts would be enforced.
“Instead of coming up with 2-4 million on an annual basis, they were like, ‘Hey, there’s all this money … we can kick the can a little bit more, and we can use this money and make some temporary changes,” Mitchell said of the lower basin states.
A small yard in Sterling Ranch, a Douglas County community that is the first in the state to undertake a rainwater harvesting project. June 27, 2022. Credit: Jerd Smith, Fresh Water News
Click the link to read the article on The Denver Post website (Judith Kohler). Here’s an excerpt:
Across the Denver area, local governments, water utilities, homebuilders and developers are employing a number of strategies to meet the demands for housing, respond to growth and strive to ensure the long-term supply of the resource essential to a future in this semi-arid region: water. Agriculture consumes the lion’s share of Colorado’s water, about 90%, while municipal uses account for 7% of the total.
“When you start off with that number, I think it’s really easy for people to say, ‘Why does municipal water use even matter? Why are we even worried or focused on this?’ That’s a question I answer a lot,” said Lindsay Rogers, a water policy analyst with Western Resource Advocates.
Harold Smethills, Sterling Ranch co-founder and chairman, doesn’t want to see large portions of Colorado’s agricultural land dried up. Smethills, who has a ranch, leases land on the development south of Chatfield State Park to a cattle operation…No water-thirsty Kentucky bluegrass is allowed at Sterling Ranch, which has about 5,000 residents. The company worked with the Denver Botanic Gardens to identify roughly 155 different plants that use less water, many with the added bonus of attracting bees and other pollinators. The water meters in the homes tracks indoor and outdoor use and have revealed leaks when staff at the Dominion Water and Sanitation District noticed water use shoot up. Residents are also able to keep an eye on their water bills.
The new study develops the idea of “planetary boundaries“, first set out in an influential 2009 paper. The paper had defined a set of interlinked thresholds that it said would ensure a “safe operating space for humanity”. Its authors had warned that crossing these thresholds “could have disastrous consequences”.
The concept has been widely used in academia and policy spaces, but has also attracted criticism from scientists who say it oversimplifies a complex system, or could spread political will too thinly.
The new study – published in Nature and written by many of the same authors – gives the concept an important update by introducing a “justice” framework.
This includes “rejecting human exceptionalism” by focusing on all species and ecosystems, emphasising intergenerational justice and examining local-scale impacts.
The authors find that adding “justice considerations” often makes the planetary boundaries stricter, warning that seven of the eight “safe and just” global Earth-system limits have already been breached.
“There is no safe planet without justice,” a study author says. She explains that the new thresholds “define the environmental conditions needed not only for the planet to remain stable, but to enable societies, economies and ecosystems across the globe to thrive”.
However, a researcher not involved in the study warns against allowing a “self-selected group of scientists” to define the planetary “safe space”.
He tells Carbon Brief that this approach is “divisive and not the way to address the global challenges of the Anthropocene”.
‘Planetary boundaries’
Human activity puts pressure on the Earth in a range of ways, from surface warming to biodiversity loss. In 2009, a team of scientists set out to quantify how much humans can use the Earth’s resources without putting themselves and the planet in danger.
The team – led by Prof Johan Rockström, now the joint director of the Potsdam Institute for Climate Impact Research – published a landmark paper in 2009. The paper identifies nine interlinked global systems and sets a “planetary boundary” for each. Staying within all of those limits ensures a “safe operating space for humanity”, the study claims.
Prof Simon Lewis, a global change scientist at University College London and the University of Leeds, wrote a commentary piece at the time calling the idea “conceptually brilliant and politically seductive”, but warning that “boundaries could spread political will thinly”, adding that the will to act “is already weak”.
In response to the original paper, Prof Ruth DeFries, the co-founding dean of the Columbia Climate School, led a study on “planetary opportunities” – emphasising the ability of societies to adapt to changing conditions. DeFries, who was not involved in the 2009 study or the new paper, tells Carbon Brief:
“We wrote the ‘planetary opportunities’ paper to counter the idea that there is a hard and fast global-scale limit to the use of resources, without regard for the ability of societies to adapt to change or overcome negative externalities of technologies.”
An “updated and extended analysis” of the planetary-boundaries framework was published in 2015. The authors identified climate change and biosphere integrity as “core” boundaries, stating that either has the potential on its own to “drive the Earth system into a new state”, if breached.
In 2017, Dr Jose Montoya – a senior scientist at France’s Centre National de la Recherche Scientifique – published a critique of the planetary boundaries concept, arguing that “the notion of a ‘safe operating space for biodiversity’ is vague and encourages harmful policies”.
Rockström and his team called the piece “a vitriolic and highly opinionated critique of the planetary boundaries framework based on a fundamental misrepresentation of the framework”.
‘Safe and just’
In 2019, Rockström co-founded the Earth Commission – an international team of natural and social scientists – to advance the planetary boundaries framework.
Since then, the team focused on improving “justice and equity”, as well as establishing “quantitative scientific targets from the local to the global scale” and “the ability to translate the science into operational implementation on the ground”, Rockström told a press briefing on the new study.
Now, more than a decade after planetary boundaries were first proposed, the updated Earth-system boundaries framework explores how to keep the planet stable while minimising “significant harm” to humans and other species, using a “justice framework”.
The authors select five of the nine original planetary systems – climate, biosphere, water, nutrients and air pollution – and identify eight key, quantifiable indicators that can monitor these systems.
These indicators – including warming level, area of natural ecosystems and surface-water flow – were “carefully chosen” to be “implementable for stakeholders in cities, businesses, countries across the world”, Rockström told a press briefing.
For each indicator, the authors assess the conditions needed to avoid “significant harm” at both global and local scales, taking into account the following justice considerations:
Interspecies justice: prioritising other species and ecosystems in addition to humanity.
Intragenerational justice: accounting for factors including race, class and gender, which “underpin inequality, vulnerability and the capacity to respond” to changes in planetary systems.
The paper defines significant harm as “severe existential or irreversible negative impacts on countries, communities and individuals”.
(The challenging and subjective nature of summarising complex, geographically variable risks into single, global thresholds is at the heart of much of the criticism of the planetary boundaries concept.)
“There is obviously no one way to quantify justice,” says Dr Steve Lade, a researcher at the Stockholm Resilience Centre who is an author on the new study. He tells Carbon Brief that this paper looks at exposure to “significant harm”, but notes that other studies by members of the team have delved into other aspects of justice, such as access to resources.
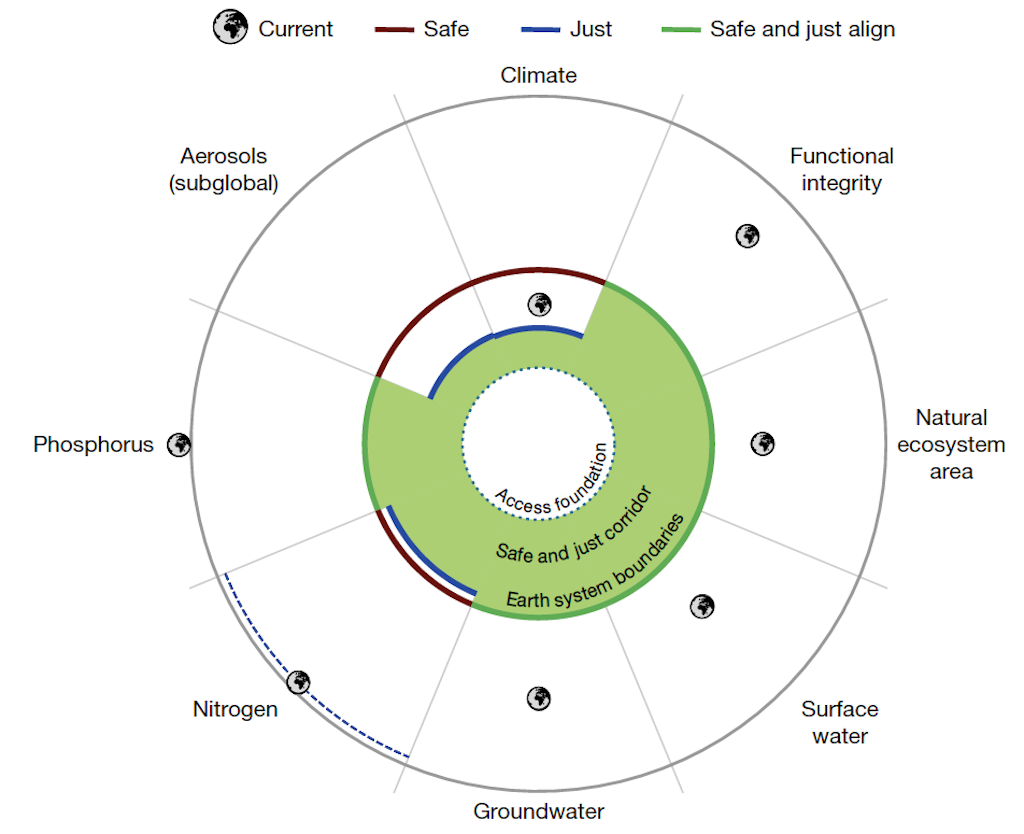
The graphic below shows the eight global Earth-system boundaries proposed in the study. The red and blue lines show the “safe” and “just” boundaries, respectively. The green shading shows where the safe and just boundaries align. The icons of the Earth show the state of the planet today. Where this image sits outside of the red, blue and green circles, the global Earth-system boundary has already been breached, according to the researchers.
The eight Earth-system boundaries proposed in the study: climate; functional integrity of the biosphere; natural-ecosystem area; surface-water flows; groundwater levels; nutrient cycles for nitrogen; phosphorus; and atmospheric aerosol levels. Red lines show the “safe” boundaries, while the blue lines show the “just” boundaries. The green shading shows where the safe and just boundaries align. The icon of the Earth shows the state of the planet today. Source: Rockström et al. (2023)
The authors find that adding “justice considerations” makes many of their boundaries more strict. As a result, seven of the eight “safe and just” global Earth-system boundaries have already been breached.
(Looking at “safe” boundaries alone, six of eight have already been breached, but the Earth’s climate currently remains within the “safe” threshold, according to the paper.)
Prof Joyeeta Gupta, a professor of environment and development at the University of Amsterdam and co-founder of the Earth Commission, is an author on the new study. She told a press briefing that “there is no safe planet without justice”.
She said the new thresholds “define the environmental conditions needed not only for the planet to remain stable, but to enable societies, economies and ecosystems across the globe to thrive”.
Boundaries breached
Climate change is the first Earth-system boundary discussed in depth in the paper. It is the only one with a “relatively well-established and implemented methodology”, the authors write.
The authors find that a global warming level of 1C above pre-industrial levels exposes tens of millions of people to temperature “extremes” – defined as wet bulb temperatures of greater than 35C for at least one day per year.
They warn that, at 1.5C, more than 200 million people – disproportionately those already vulnerable, poor and marginalised – could be exposed to “unprecedented” average annual temperatures.
The paper proposes a “safe” surface warming boundary of 1.5C and a “safe and just” boundary of 1C. The planet has already warmed by 1.2C, on average, meaning that the “safe and just” boundary has already been breached.
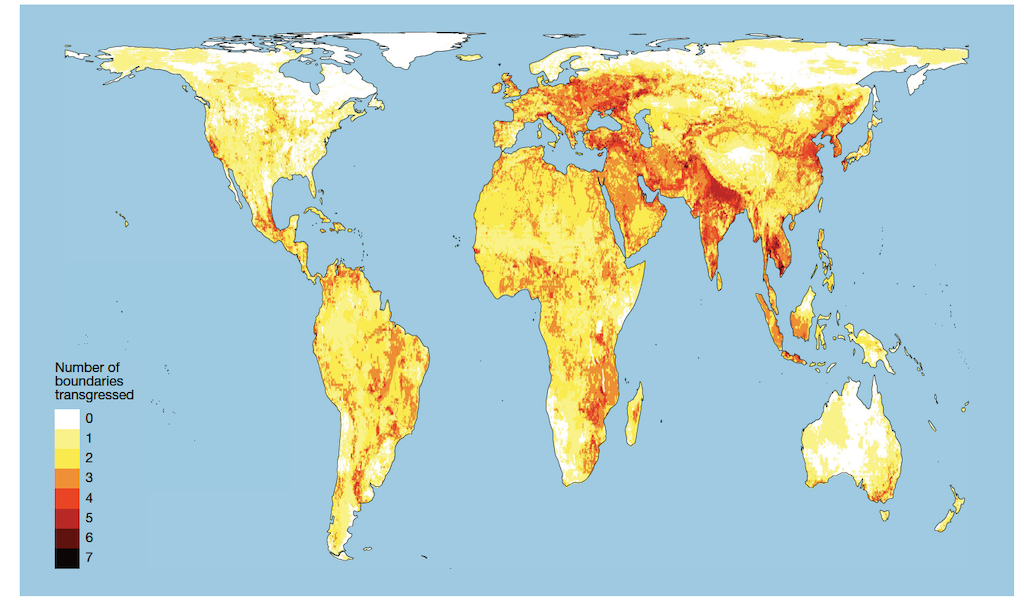
This study is the first to assess Earth-system boundaries at a local scale, rather than analysing the planet as a whole. This allows the authors to determine which boundaries have been crossed in specific regions and to identify “hotspots” for breached boundaries.
The map below shows the number of Earth-system boundaries that have already been breached in different regions, where darker colours indicate more boundaries breached.
The number of Earth-system boundaries already breached in different regions, with lighter colours indicating fewer boundaries passed and darker colours indicating more thresholds exceeded. Source: Rockström et al. (2023)
The authors find that two or more “safe and just” earth system boundaries have been breached across 52% of the world’s land surface, affecting 86% of the global population.
Reception
Carbon Brief spoke to a range of scientists about the new study.
Dr Åsa Persson, research director at the Stockholm Environment Institute, is an author on the 2009 paper, but was not involved in the new study. She tells Carbon Brief that the new study is a “significant scientific contribution”. She adds:
“I commend the authors for not oversimplifying justice, but considering its many dimensions in a nuanced, yet workable way.”
However, she says that in her view, “some questions on interdependencies between boundaries remain unanswered”.
DeFries tells Carbon Brief that the focus on localised impacts makes the new study more “nuanced” than the 2009 paper. She adds that the planetary-boundary concept is “intuitively appealing”, but warns that the complexity of the Earth system “makes the task of defining a limit extremely difficult”.
Dr Jose Montoya is very critical of the new framework, saying the scientific basis is “weak”. He maintains that “there are no safe operating spaces”, telling Carbon Brief:
“Even small disturbances can have very large effects on ecosystems at different scales.”
Biermann welcomes that the paper now seeks to address questions of global justice. However, he tells Carbon Brief that he feels the “definitions of justice and societal values” presented by the authors “in essence, belong in the political space”.
Prof Erle Ellis from the University of Maryland co-authored the planetary opportunity paper with DeFries. He tells Carbon Brief that he appreciates the inclusion of social justice in this “expanded and more nuanced framework”. However, he says there are “issues relating to the way this work was produced”.
He continues:
“The planetary boundaries framework originated with a self-selected group of scientists deciding what the ‘environmental safe space for humanity’ was – without any input from ‘humanity’.
“Now, after naming itself the ‘Earth Commission’, this small group will now also decide the planetary ‘safe space’ in terms of social justice?
“This kind of unilateral ‘scientific’/expert setting of limits – environmental or social – is divisive and not the way to address the global challenges of the Anthropocene, which can only succeed through increasing cooperation, trust and negotiations across all concerned.”
Study author Gupta tells Carbon Brief about the importance of “procedural justice” in interpreting these results. She says:
“Procedural justice requires these numbers to be talked about and debated, and if people come up with better numbers, or better suggestions, then we’re open to their critique.
“This is just a proposal about safe and just boundaries. And it remains to be debated in the political sphere before it’s adopted…We are not dictating anything to anybody.”