#Drought news April 11, 2024: Although it was a mostly dry week for the Southwest, a reassessment of SPIs at various time scales led to targeted improvements for parts of #NewMexico

Click on a thumbnail graphic to view a gallery of drought data from the US Drought Monitor website.

Click the link to go to the US Drought Monitor website. Here’s an excerpt:

This Week’s Drought Summary

Following the El Nino winter and an active early spring pattern, drought coverage is at its lowest since the spring 2020. A strengthening low pressure system and trailing cold front progressed east from the Mississippi Valley to the East Coast at the beginning of April. This storm brought heavy snow (6 to 18 inches, locally more than 2 feet) to the Upper Peninsula of Michigan, Wisconsin, and northern New England. The recent precipitation (rain and snow) during the past few weeks continued to ease drought conditions across the Upper Midwest. From April 5 to 7, a strong storm system tracked east from the Rockies to the Great Plains. Heavy snowfall (6 to 12 inches, locally more) occurred across parts of Idaho, Montana, and Wyoming. Total precipitation amounts of 1 to 2 inches, liquid equivalent, resulted in drought improvement from the north-central Rockies to western South Dakota. Drought continued to develop or intensify across parts of the southern Great Plains and lower Ohio Valley along with Hawaii. Please note that heavy rainfall across the South, occurring after April 9th at 8am EDT, will be considered in next week’s U.S. Drought Monitor…
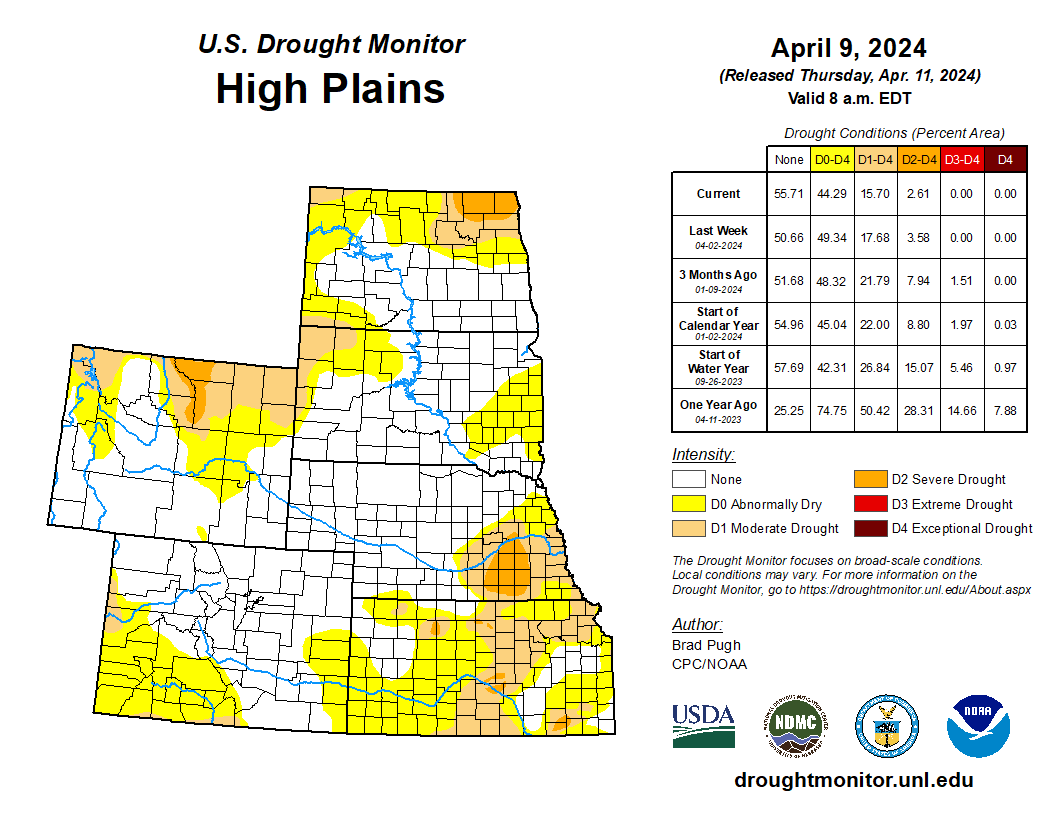
High Plains

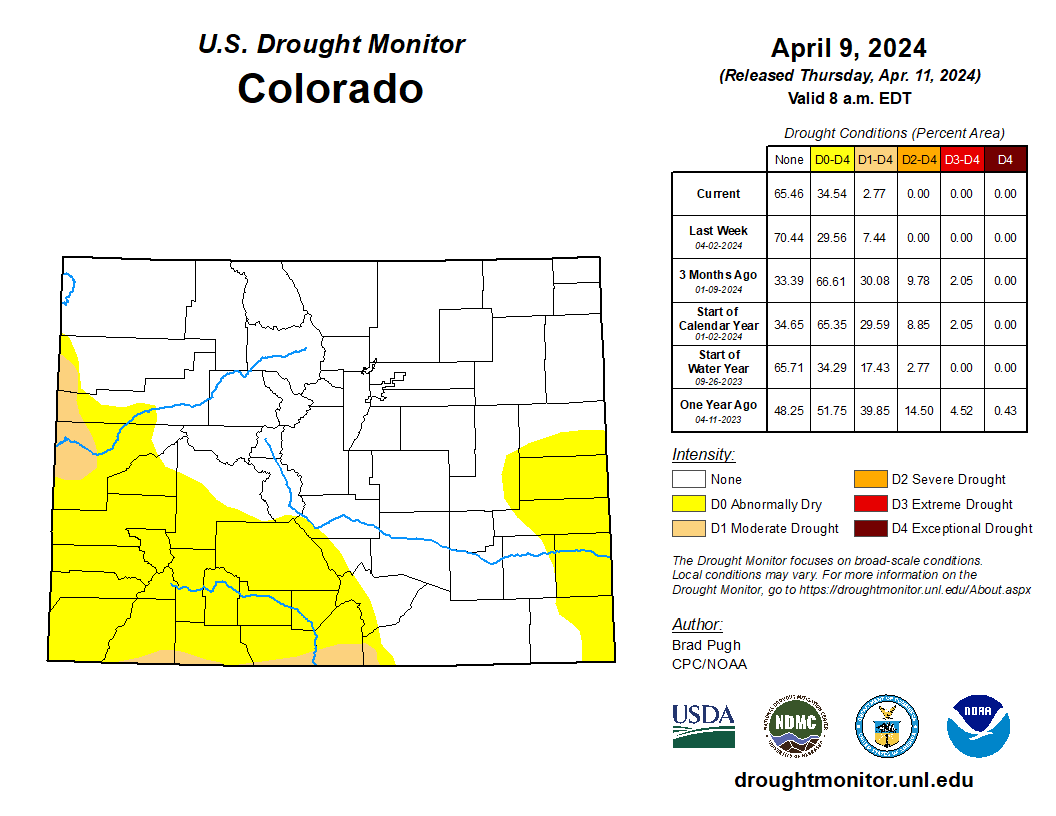
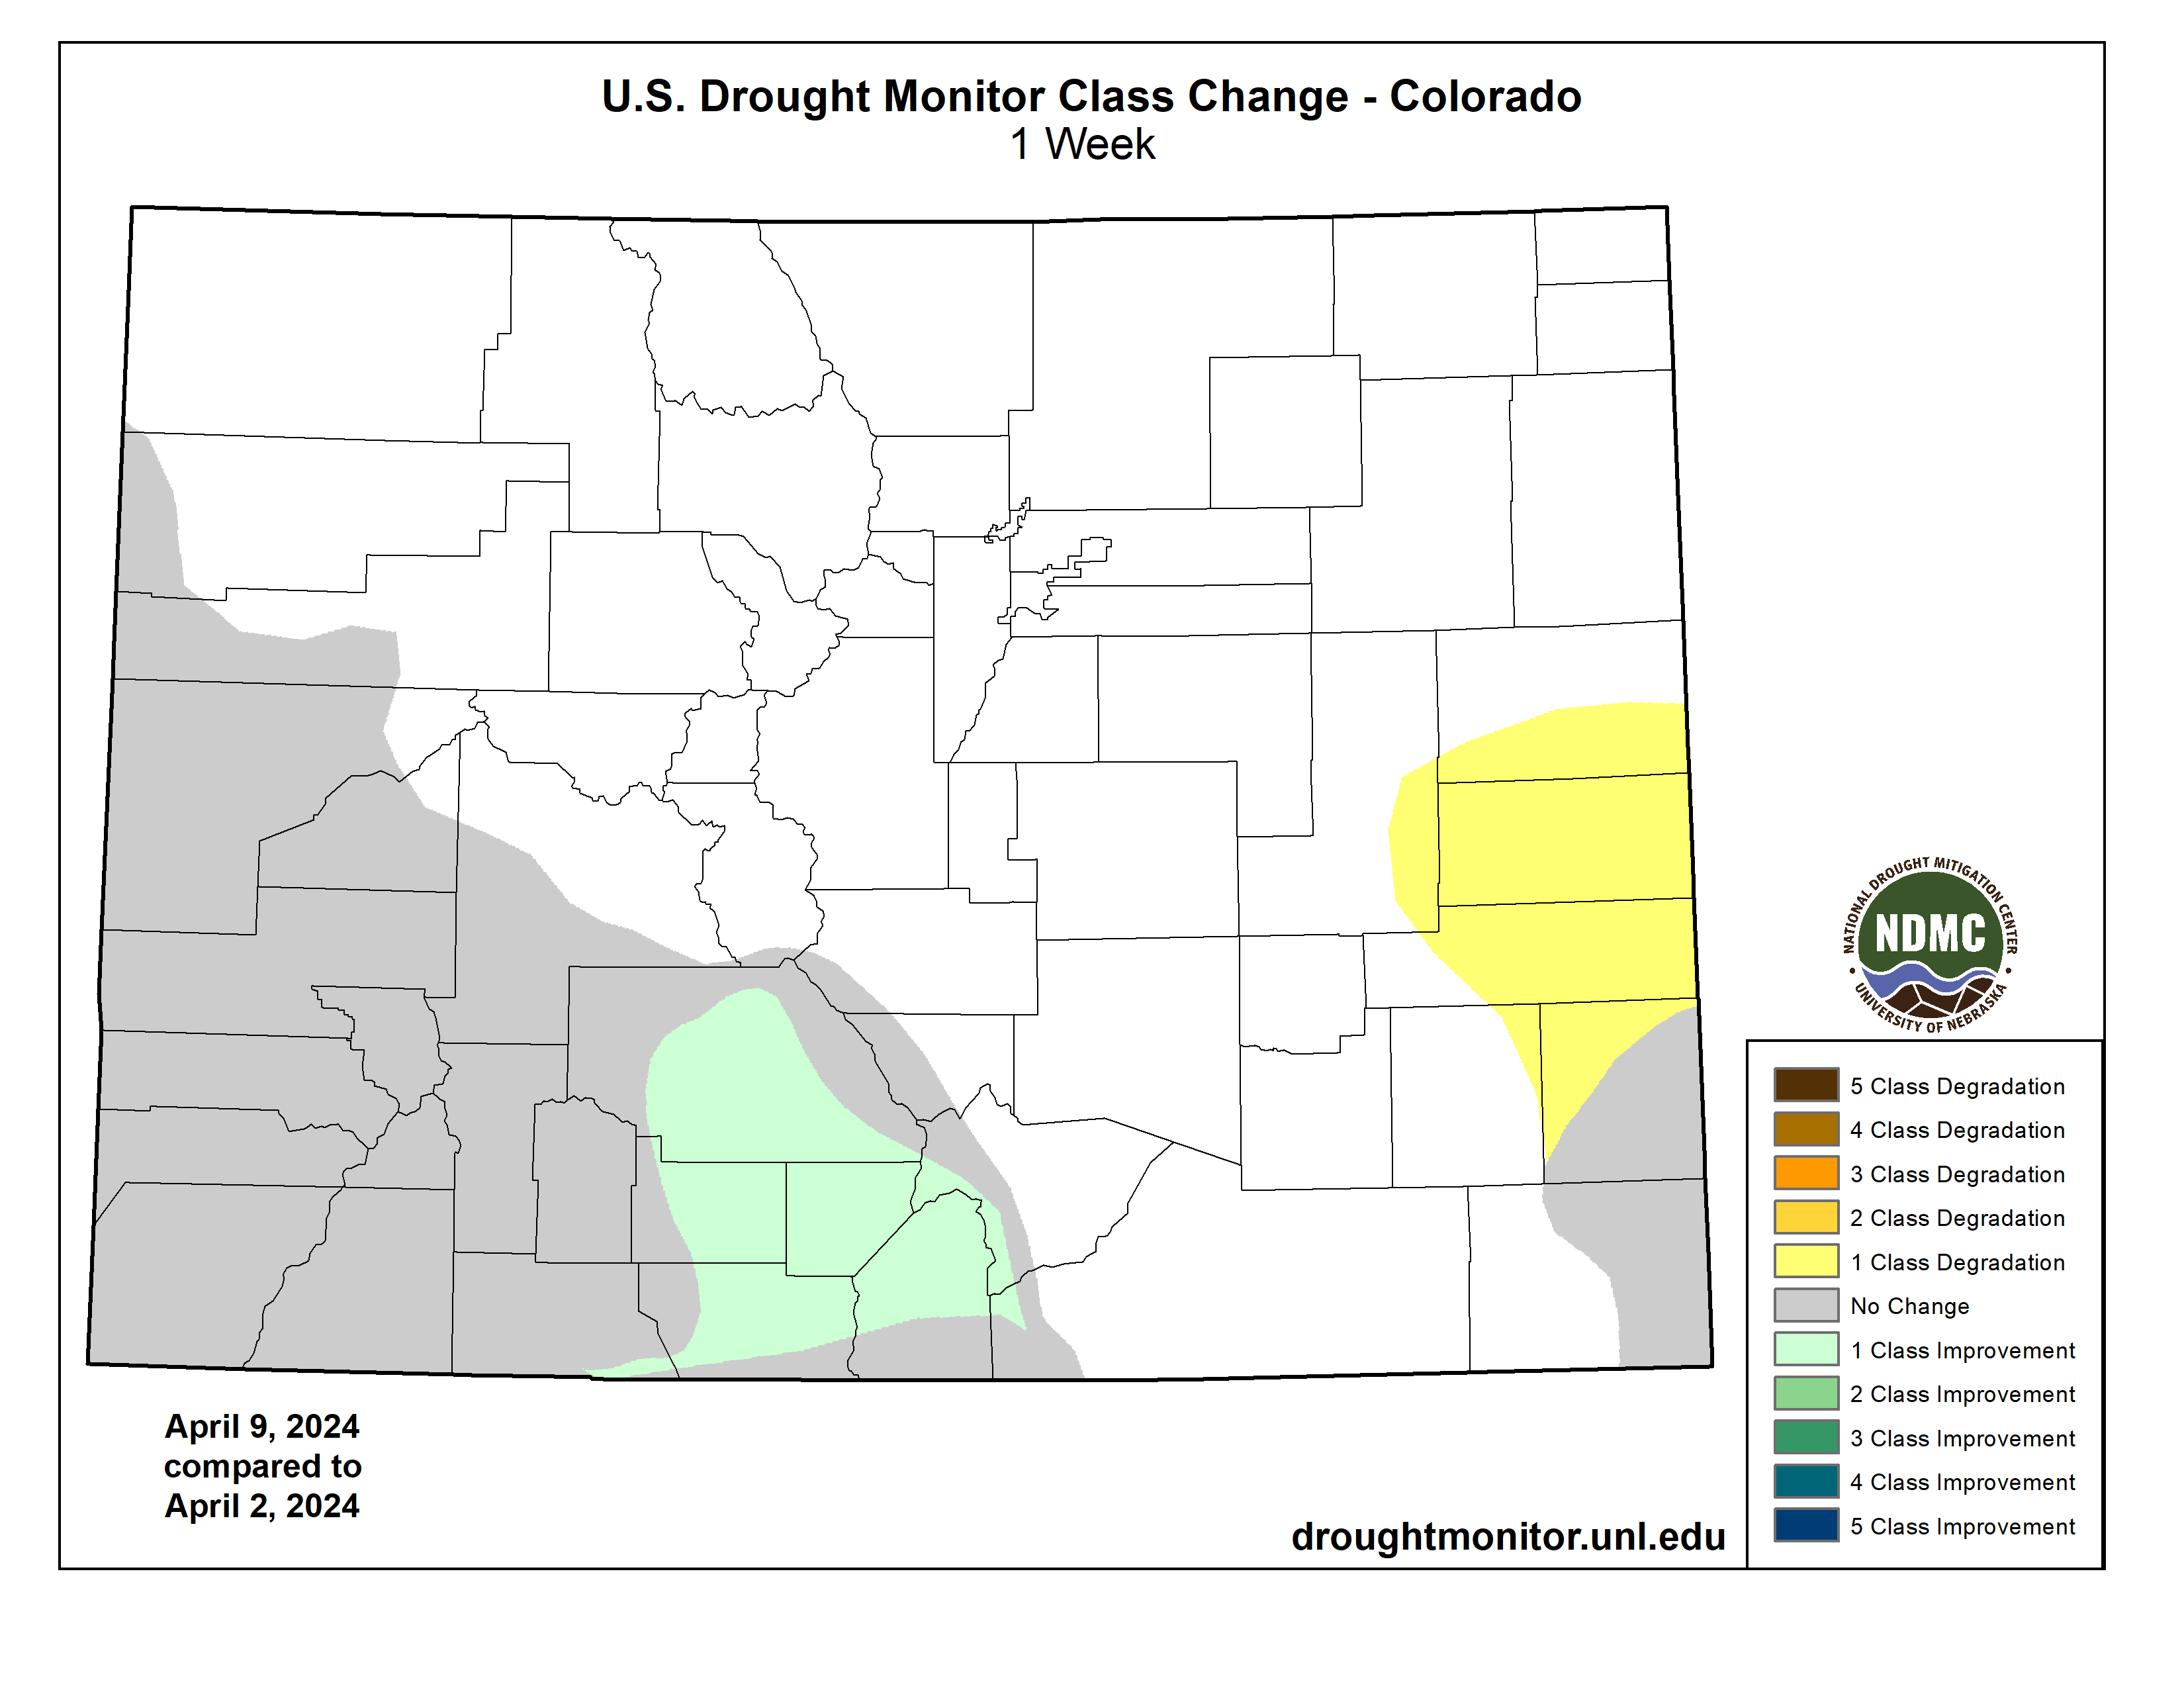
Widespread rain and snow (1 to 2 inches of precipitation, liquid equivalent) on April 7 led to a 1-category improvement across parts of northeastern Wyoming and western South Dakota. Despite the recent heavy precipitation, 6-month SPI along with 28-day average streamflow support a continuation of moderate drought (D1) across the High Plains. Following another week of precipitation along with considerations of soil moisture and SPI values of neutral to positive, abnormal dryness (D0) coverage was reduced throughout the Dakotas. A strengthening low pressure system on April 6 and 7 brought high winds to the Great Plains which dried out topsoil especially across Kansas and southeastern Colorado. A reassessment of SPIs at various time scales and given snow water equivalent is slightly above average, D1 coverage was reduced for southern Colorado…
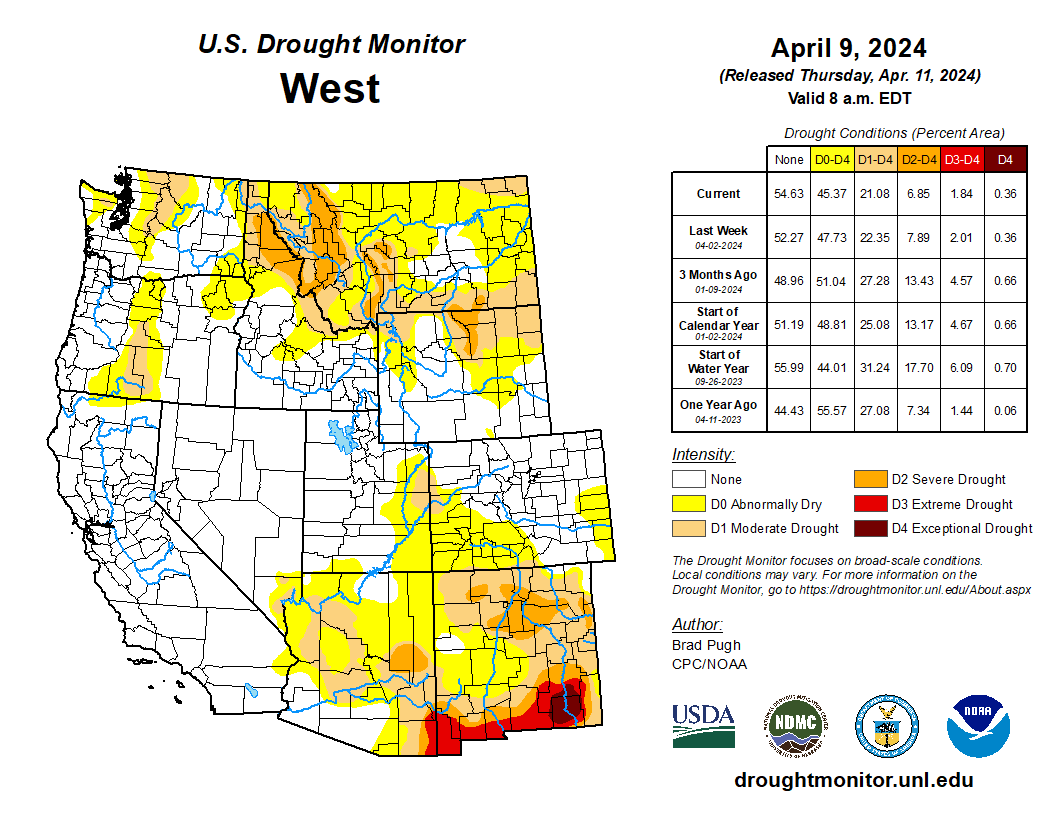
Colorado Drought Monitor one week change map ending April 9, 2024.

West

As a low pressure system shifted inland, widespread precipitation (rain and high-elevation snow) overspread the West from April 3 to 6. Heavy precipitation (more than 1.5 inches, liquid equivalent) along with snow water equivalent (SWE) amounts near average supported a 1-category improvement to western Idaho and northeastern Oregon. Parts of western Montana also had a 1-category improvement due to a wet week and considerations such as SWE and SPIs at various time scales. The current depiction of moderate to severe drought across Idaho and western Montana lines up well with the 6 to 9-month SPI. On April 5 and 6, a major storm developed across the northern Rockies and high Plains with precipitation amounts exceeding 1.5 inches (liquid equivalent) across southern Montana. Based on this heavy precipitation and lack of support from SPIs at various time scales, a 1-category improvement was made to this region. Neutral to positive SPIs at multiple time scales and SWE near to slightly above normal supported the removal of D0 (abnormal dryness) from western Nevada and adjacent areas of California. Farther to the north, low snowpack resulted in a second week of D0 and D1 expansion across north-central and northeastern Washington. Although it was a mostly dry week for the Southwest, a reassessment of SPIs at various time scales led to targeted improvements for parts of New Mexico.

South

Major drought relief, associated with El Nino, occurred this past winter across the lower Mississippi Valley. Precipitation from April 2-8 led to a small decrease in abnormal dryness (D0) and moderate drought (D1) to parts of this region. Heavy precipitation that occurred after 7am CT Tuesday, April 9th, will be factored into next week’s depiction. A strengthening low pressure system on April 6 and 7 brought high winds and elevated wildfire danger to the southern Great Plains which dried out topsoil, especially across northwestern Oklahoma. 30 to 90-day SPEI along with the lack of vegetation green up supported an expansion of D0 and D1 across parts of Oklahoma. Northern Arkansas and northwestern Tennessee also had an increase in D0 and D1 coverage as short-term precipitation deficits became larger dating back to 60 days.

Looking Ahead

During the next five days (April 11-15, 2024), a low pressure system and trailing cold front will move offshore of the East Coast on April 11th. Locally heavy rainfall (more than 1 inch) is forecast to accompany this cold front. From April 12 to the 14th, much drier weather is forecast throughout the eastern and central U.S. By April 14th, another low pressure system is expected to track inland to the West with additional rain and high-elevation snow. Later on April 15th, another round of wet weather is anticipated for the northern Great Plains and Midwest.

The Climate Prediction Center’s 6-10 day outlook (valid April 16-20, 2024) favors above-normal temperatures across the eastern and southern contiguous U.S. (CONUS) with below-normal temperatures most likely across the northern Great Plains, northern to central Rockies, and Pacific Northwest. Increased above-normal precipitation probabilities are forecast for most of the eastern and central CONUS excluding Florida where below-normal precipitation is slightly favored. Below-normal precipitation is also more likely along the West Coast.

US Drought Monitor one week change map ending April 9, 2024.

Southeastern #Colorado Water Conservancy District Board: #Aurora water purchase violates 2003 Agreement #ArkansasRiver

Straight line diagram of the Lower Arkansas Valley ditches via Headwaters Magazine

Here’s the release from Southeastern Water (Chris Woodka):

April 9, 2024

The impending purchase of an Otero County farming operation by the city of Aurora violates the 2003 Intergovernmental agreement between the Southeastern Colorado Water Conservancy District and Aurora, according to a resolution passed unanimously Tuesday, April 9, 2024 by the District’s Board of Directors.

The action came after Marshall Brown, General Manager of Aurora Water explained details of the purchase and Aurora’s interpretation of the IGA to the Southeastern Board. Aurora intends to spend $80.4 million to buy 5,200 acres of land and the water used to irrigate 4,806 acres. Most of the water used to irrigate the land is through Catlin Ditch shares, along with other water rights in the Arkansas Valley.

Aurora would use the water three years out of every 10 and lease water back to a farming company, C&A Companies, in seven years out of every 10. Brown stressed that Aurora wants to keep farming alive in the Arkansas Valley.

Southeastern claims the sale violates an IGA signed in 2003 that cleared the way for Aurora to use Fryingpan-Arkansas Project facilities to move water out of the Arkansas River basin into the South Platte River basin under a 40-year contract with the Bureau of Reclamation. The IGA also is the foundation for a series of other agreements over the next eight years with other major water providers in the Arkansas basin, including Colorado Springs Utilities, Pueblo Water, the Lower Arkansas Valley Water Conservancy District, Fountain, the Upper Arkansas Water Conservancy District and Fountain.

The major points made in the resolution include:

  • The central purpose of the 2003 IGA is to prevent Aurora from purchasing any additional agricultural water rights and permanently transferring those rights out of the basin for permanent use.
  • The provision in the agreement to transfer water when Aurora’s storage is below 60 percent refers to storage that was available in 2003, rather than additional storage Aurora may have gained since then or is contemplating building.
  • The purchase of additional Arkansas River basin water rights to transfer out of the basin for municipal use in Aurora violates the 2003 IGA, and the Board urges Aurora to refrain from or cease all violations.
  • The 2003 IGA is a foundational and beneficial document for the Arkansas River basin and in order to maintain regional cooperation and relationships with water rights owners and entities within the basin, both the District and Aurora must remain in compliance with the IGA.

The 2003 IGA was written following Aurora’s second purchase of Rocky Ford Ditch shares and required payments of $25.5 million to the Southeastern District over 40 years as compensation for the loss of agricultural land. It also allows Aurora to lease water in dry years, and only when Aurora’s reservoirs are less than 60 percent full – so-called “Category 2” water.

During a question-and-answer session, Southeastern Board members sparred with Brown over several topics, including whether Aurora would be willing to put conservation easements on its farmland to assure that irrigation would occur in perpetuity, how Aurora would account for the 60 percent storage requirement, if agricultural conservation and rotating fallowing would be used and why Aurora believes the current IGA has limited its ability to move water.

For the most part, those questions were left unresolved, and Brown indicated Aurora is open to more negotiations. Southeastern Board President Bill Long reminded Brown of the importance of the 2003 IGA: “We have taxpayers who have been part of the District since 1958. … It was this basin who developed the project for the people of this basin. We have people asking, ‘Why are we diverting water out of our basin to build houses in Northern Colorado?’ So, we have issues in this basin we have to work through. The Project absolutely is not being utilized for what its original purpose is for. … This Board will comply with the IGA and defend the IGA on behalf of our constituents, and our view of the agreement may be a bit different than yours.”

#NewMexico’s #RioGrande reservoirs: Running on Empty — John Fleck (InkStain.net)

Reservoir storage on New Mexico’s Rio Grande and Rio Chama on April 1, 2024. Credit: John Fleck

Click the link to read the article on the Inkstain website (John Fleck):

April 1, 2024

Inspired by Jack Schmidt’s monthly “how much water is in Colorado River storage” posts (see here for last month’s), I’ve been playing with a similar tool to help me think about the status of our reservoirs on the Rio Grande system here in New Mexico.

The graph above helps me with two important intuitions about how the system is functioning.

At the decadal scale, the water management shift in the early 2000s from a time of plenty to a time of not plenty is dramatic.

At the interannual scale, the decline in water kept in storage upstream of the middle valley (the red line above) goes from bad to worse beginning in the late teens.

Data choices

NORTH AND SOUTH

Based on a useful conversation with Jack about this, it makes sense here to split things up into two bins – the northern reservoirs (which hold the water available for our use here in New Mexico’s Middle RIo Grande Valley) and the southern reservoirs (which hold storage for the Elephant Butte Irrigation District, El Paso and surrounds, and Mexico).

TIME SERIES

Because of a quirk in the data I have access to, and because I am too lazy to do the work to overcome the quirk, it makes sense to start the time series at 1980. But that also makes conceptual sense in terms of how I think about the system – our “modern era” of water management includes these two broad multi-decadal periods – the wet stuff 1980-2000, and the dry stuff ever since.

TIME STEP

I find it most helpful to plot this at an annual time step. How does storage right now compare to last year at this time? So the graph above is the storage as of April 1 (actually March 31). I’ve plotted it both ways (daily as well), but the interannual ups and downs make it harder for me to see what’s going on.

2024 v. 2023

After last year’s unusually wet year:

  • Northern reservoirs are up ~27,000 acre feet on April 1
  • Southern reservoirs are up ~95,000 acre feet.

The Loss of El Vado

Summer maximum versus end of year storage in El Vado Reservoir. Credit: John Fleck

The loss of El Vado Reservoir, currently under repair, is striking. But what’s also striking is how significantly we were draining it in recent years, before the current repairs started in 2022.

The Middle Rio Grande Conservancy District built El Vado in the 1930s (with an under-appreciated amount of federal subsidy) to extend the irrigation season, capturing spring runoff for use in the dry months of late summer and fall. (“Canals move water in space, dams move water in time.”)

I’m still playing with how best to illustrate this. The graph above shows how full El Vado gets each year as it swells with spring runoff (blue dot) and how far we’ve drained it by the end of the year (red dot).

Catchy Song Lyric version

An Invitation to Play the #ClimateChange Game — Writers on the Range

Dead Horse State Park, Moab, Utah, Andres Haro, Unsplash

Click the link to read the article on the Writers on the Range website (Pepper Trail):

April 10, 2024

Let’s play a game, the climate-change game that every living thing on Earth has no choice but to play, starting … now.

The game is called Adapt/Move/Die, and the rules are simple. The object of the game is not to die. And the winners, well, the winners get to keep playing the game. 

You may say wait, what about Solve? Isn’t solving the climate crisis an option? Yes, of course, and a worthy goal.

But even if humanity somehow musters the now-lacking resolve to rapidly phase out fossil fuels, greenhouse gases already in the atmosphere are higher than at any time in hundreds of thousands of years. The effects on climate will continue to unfold for centuries.

Adapt/Move/Die used to have another name:  Evolution. But Evolution was played without a time clock over centuries or millennia. Adapt/Move/Die is customized for our fast-paced world. Every round is a lightning round, and there are no time-outs. 

Let’s get started!  Who’s on Team Adapt? You already know some of them well because they are all around us — pigeons and rats, cockroaches and coyotes, dandelions and thistles. No matter how the climate changes, these adapters will find a way, and a place, to survive.

Under the old evolution rules, most species belonged to Team Adapt. But the pace of the new game has changed everything. 

Just take a look at your local forest. Its trees were once adapted, attuned to the temperature, soil, patterns of rain and snow and natural pests. 

But now, every forest is full of dying trees. A report from the Forest Service estimated that over 36 million, yes, million, trees died in 2022 just in California.

For many plants facing rapid climate change, their only choices are Team Move, or Team Die. It is an unanswered and existential question whether the plants that support the biosphere can move fast enough.

And what of people? As befits our huge numbers and our great cleverness, it is likely that no species on Earth will show such complicated game play. 

Team Adapt will mostly be drawn from the global North, where climate extremes may (repeat, may) be somewhat buffered, and where great economic resources can be brought to bear in the name of adaptation.

Here, we hope, coastal cities can be protected behind seawalls and levees. Infrastructure can be strengthened or moved or repaired. Some emergency assistance will be available for victims of “natural” disasters. 

Tragically, none of these fixes will be available, or be enough, for huge numbers of people. The United Nations estimates that extreme weather caused 2 million deaths in the past 50 years, but that pales in comparison to what’s coming. 

The World Health Organization predicts that climate change will cause an estimated 250,000 additional deaths per year between 2030 and 2050 from disease, starvation and heat stress.

If true, Team Die will claim 5 million members over that 20-year span. Many of those deaths will come from the poorest countries, where people lack even the resources to join the last team: Team Move.

“Move” will, in fact, be the most disruptive play in the game. The UN High Commissioner for Refugees estimates that between 2008 and 2016, an average of 21.5 million people per year were displaced by climate-related events like floods, storms and wildfires.

But again, that is just a mild preview of what could be coming. The same report concludes that 1.2 billion people, or over 10% of the world’s population, could be displaced globally by 2050.

When playing “Move” involves crossing national borders, it often has another name: illegal immigration. From the United States to Europe to Australia, illegal immigration is already considered to be a crisis, and has been a key factor in the rise of right-wing political parties. Given the harsh response to the existing level of illegal immigration, it is frightening to imagine what the future flood of climate refugees could face.

Pepper Trail

There is only one way to win the game of Adapt/Move/Die. That is to recognize that we all share this critically damaged planet. To succeed, adaptation will require cooperation. To survive, those who must move will require help and compassion. 

We can play the game together and win the right to keep playing­that is, to live. Or we can enlist in Team Die by choosing isolation and conflict.

Anyone want to roll the dice? 

Pepper Trail is a contributor to Writers on the Range, writersonthernage.org, an independent nonprofit dedicated to spurring lively conversation about the West. He is a conservation biologist who has written widely on evolution and climate change. He lives in Ashland, Oregon.

A classic comeback for Old Man Winter — The #Aspen Daily News

Click the link to read the article on The Aspen Daily News website (Scott Condon). Here’s an excerpt:

April 10, 2024

The snowpack for the Aspen-area mountains was about 46% below the 30-year median after a dry November and was about 35% below in December, according to Sam Collentine, a Basalt-based chief operating officer and meteorologist for OpenSnow.com. Conditions improved slightly in January when the snowpack ended up 3% above the 30-year median for the month, despite a dry stretch for a good share of the month. Conditions finally flipped in February, when the snowpack was 20% above median, and especially in March, which ended at plus 74%…The season started with a lot of promise with two big snowstorms in October that established an impressive base. But, as is typical for Colorado, conditions dried out in November and into December…

Snowmass collected 94.6 inches of snow in March, or 172% of normal. Aspen Mountain recorded just shy of 86 inches or 175% of normal, according to Aspen Weather…OpenSnow’s Collentine took a look for snowfall at the Aspen-Snowmass ski areas for Oct. 1 into early April and found Aspen Highlands nosed out Snowmass with 312 inches to 310 inches. Highlands finished the season at 105% of the 30-year median while Snowmass was at 101%. Aspen Mountain recorded 257 inches or 107% of median while Buttermilk was at 161 inches and 106%…

As a whole, the Roaring Fork basin’s snowpack was at 115% of median on Tuesday. Collentine noted that conditions around Aspen were similar to those in the Upper Colorado River Basin and the state as a whole. The Upper Colorado Basin, which the Roaring Fork is part of, is at 106% of the 30-year median and the statewide snowpack is at 108%.

#ColoradoRiver district seeks Summit County’s help in clinching $99 million Western Slope water rights deal — The Summit Daily #COriver #aridification

Shoshone Hydroelectric plant. Photo credit: The Colorado River District

Click the link to read the article on the Summit Daily website (Robert Tann). Here’s an excerpt:

April 9, 2024

During a Tuesday, April 9, Summit Board of County Commissioners meeting, river district General Manager Andy Mueller told officials that his organization’s efforts to acquire water rights along a segment of the Colorado River “is vital to the health of all of our rivers in the Western Slope.”

Western Slope communities aren’t the only beneficiaries of the current system, with the [Shoshone Hydroelectric] plant’s water rights strengthening flows in Grand, Summit and Eagle counties, providing security to areas that depend on the Colorado River for a host of economic and environmental reasons. If the current water rights were not in place, the main beneficiaries would be Denver Water and other trans-mountain diverters which would experience increased yield through their respective collection systems, according to the river district…

In order to keep the same volume of downstream flow under new ownership, the river district will need to secure a water right for an instream flow, which can only be operated by the Colorado Water Conservation Board. The river district is currently in talks with the board to create a contract to do just that. But the crux of the river district’s deal is the water right’s $99-million price tag. 

Sedimentation and Dam Removal: Bringing a River Back to Life — American Rivers

Kennebec River Post Dam Removal | Jessie Thomas-Blate

Click the link to read the article on the American Rivers website (Serena McClain):

August 23, 2023

Sediment forms when rocks and soil weather and erode. We think of rivers as something that moves water, but just as important is its ability to move and shape the earth.

One of the primary concerns when planning for dam removal is the impact of sediment transport on water quality, river health, and the communities that depend on healthy rivers. Sediment forms when rocks and soil weather and erode. We think of rivers as something that moves water, but just as important is its ability to move and shape the earth. Sediment comes in all shapes and sizes—everything from silts and clays to coarse sand and gravel. Each of these kinds of sediment mean different things for rivers and aquatic life. Coarser material like gravel and sand often makes up the bed of the river and help create and maintain complex habitat upon which many aquatic communities depend. The presence of dams can starve downstream reaches of sediment, which can lead to increased bank erosion. 

Dams create reservoirs and reservoirs accumulate sediment over time—more than 100 years in the case of the four dams being removed from the Klamath River. The degree of sedimentation downstream following a dam removal depends on multiple factors, such as sediment volume, sediment management plans (i.e., phased removal of a dam and passive release of material, dredging), the river’s geomorphology, and the composition of the sediment itself (e.g., fine grain, mud, or coarse). Studies of previous dam removals have shown the resilience of rivers following dam removals. Rivers have the capacity to recover from the influx of sediment after dam removal within a period of days to a few years and tend to thrive afterward. After an initial phase of disturbance following a large removal, the geomorphology of the river stabilizes as the river begins to heal.

We can get a sense sense of how one day the Klamath River will thrive again by looking to other successful removals. The removal of Edwards Dam on the Kennebec River in 1999 is a story of restoration and revitalization. Its removal reconnected migratory corridors that had been cut off for 162 years, improving habitat for Sturgeon, alewife, eagles, and osprey. Millions of alewife now return to the Kennebec.

Edwards Dam on Kennebec River Pre-Removal | Photo by American Rivers

Another high-profile dam removal where passive release of sediment was utilized is the Condit Dam on the White Salmon River in Washington State. The 125-foot-tall Condit Dam impounded 2.4M cubic yards of sediment, 59% of which was comprised of silt, clay, and very fine sand. More than 60% of the reservoir sediment eroded within 15 weeks of breaching the dam Salmon and steelhead have rapidly recolonized the White Salmon River mainstem and tributaries thanks, in part, to natural river dynamics that allow these systems to recover quickly. In fact, according to the U.S. Fish and Wildlife Service, redds were found throughout the former lake area less than a year after the dam was initially breached. 

The 2018 Bloede Dam removal on the Patapsco River in Maryland serves as another useful case study. The 34-foot-tall dam impounded approximately 186,600 m3 of stored sediment, 50% of which eroded within the first six months following removal. River herring were documented (via eDNA) upstream of the former dam site within the first year following removal, and American eel populations skyrocketed from 36 in 2018 to more than 36,500 in 2022. Like the Klamath River dam removals, each of these removals entailed a period of recovery and depended on cross-sector collaboration and advocacy. 

Bloede Dam before removal on the Patapsco River | Jessie Thomas-Blate
Bloede Dam after removal on the Patapsco River | Jessie Thomas-Blate

While the impacts of dam removals vary significantly, the evidence of the last 20 years points to the effectiveness of dam removal and the long-term benefits for communities, fish, and wildlife. With more than 91,000 dams inventoried by the U.S. Army Corps of Engineers and several hundred thousand more low-head dams, aquatic ecosystems in steep decline (freshwater ecosystems are dealing with extinction at twice the rate of terrestrial ecosystems), and the impacts of climate change altering weather and precipitation patterns threatening the stability and durability of water infrastructure, dam removal has become an increasingly urgent priority in terms of ecological health, community safety, and climate resilience. Simply put, the fastest way to heal a river is to remove a dam.