April 2024 #ENSO update: gone fishing — NOAA

Click the link to read the article on the NOAA website (Emily Becker):

April 11, 2024

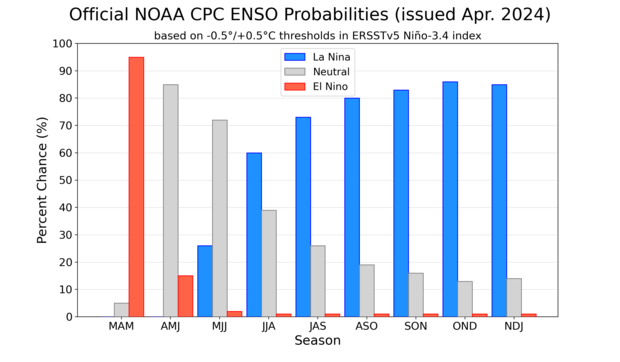
The El Niño of 2023–24 is weakening. Forecasters estimate an 85% chance that El Niño will end and the tropical Pacific will transition to neutral conditions by the April–June period. There’s a 60% chance that La Niña will develop by June–August. Overall, the forecast this month is very similar to last month, and we continue to expect La Niña for the Northern Hemisphere fall and early winter (around 85% chance).

La Niña and El Niño are opposite phases of the El Niño-Southern Oscillation climate pattern. “ENSO” for short. Just like El Niño, La Niña changes the ocean and atmospheric circulation in the tropics. Those changes start in the Pacific Ocean and then ripple around the world in predictable ways. So, the arrival of La Niña gives us an early picture of potential upcoming climate conditions.

Why are our probabilities relatively high, even though we’re still solidly in the grip of the “spring predictability barrier,” a time of year when forecasts are often trickier? What could La Niña mean for summer and fall climate? And what might we expect for the global average surface temperature, after a record-setting year? So many questions! The hooks are baited, let’s cast our lines.

Tropical fishes

First things first: current ENSO conditions. The sea surface temperature anomaly in the Niño-3.4 region of the tropical Pacific is our primary metric for ENSO (anomaly = departure from the long-term average, long-term in this case is 1991–2020). Since El Niño’s peak in November–December 2023 at about 2.0 °C (3.6 °F), this anomaly has been dropping steadily, but, at 1.2 °C, it is still well above the El Niño threshold of 0.5 °C (0.9 °F).

2-year history of sea surface temperatures in the Niño-3.4 region of the tropical Pacific for all strong El Niño events since 1950 (gray lines) and the current event (purple line). Graph by Emily Becker based on monthly Niño-3.4 index data from CPC using ERSSTv5.

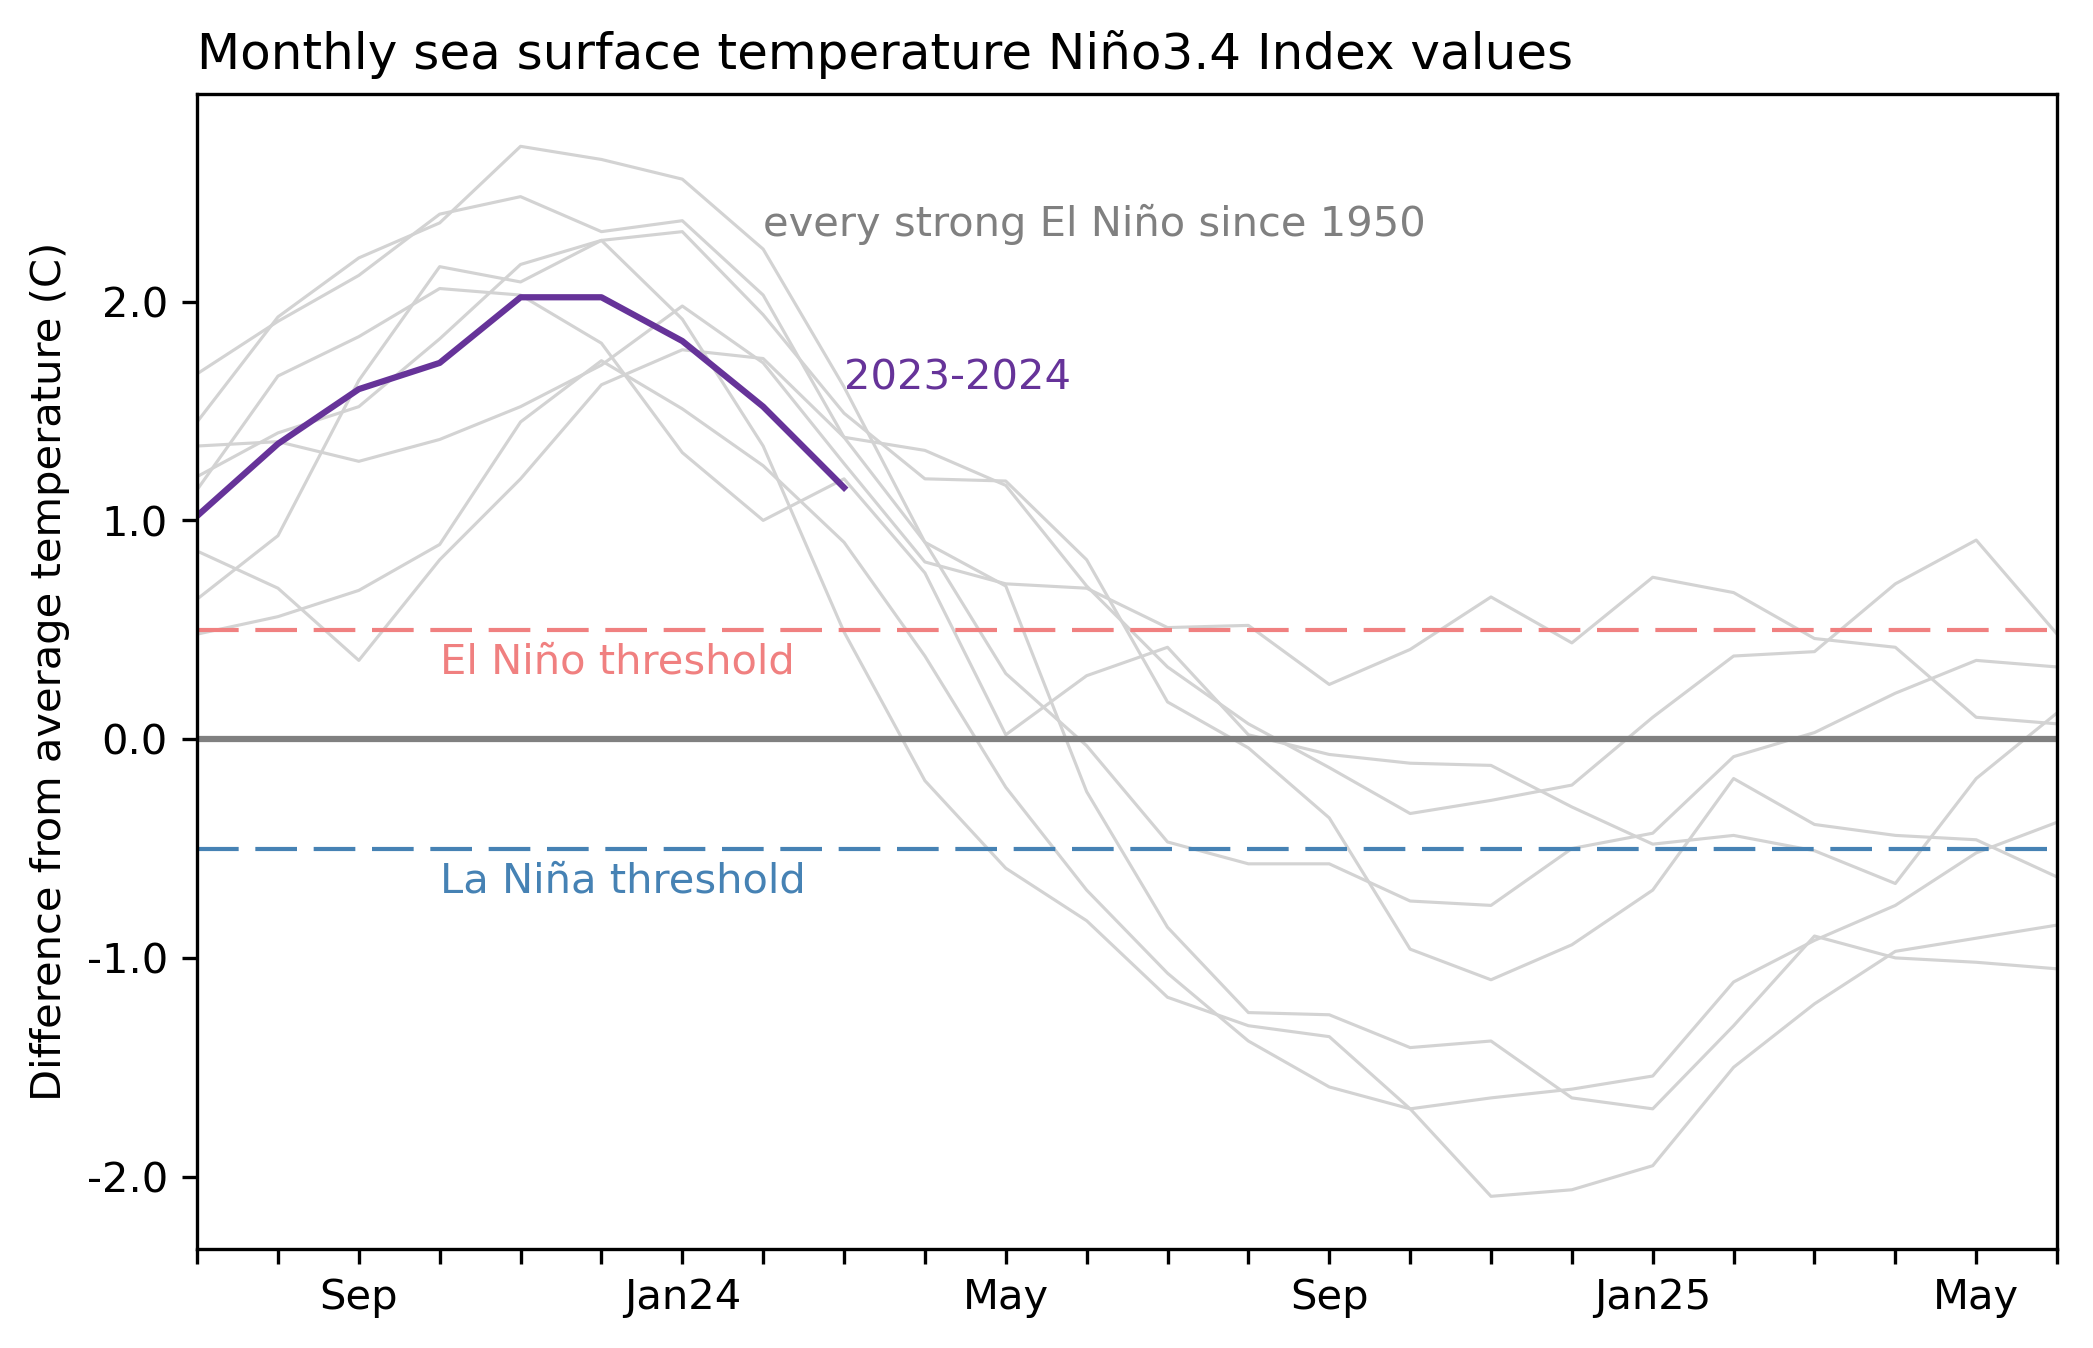
Looking at the atmosphere over the tropical Pacific, however, we find that the expected El Niño pattern—weaker-than-average trade winds, more rain and clouds in the central tropical Pacific, drier conditions over Indonesia, reflecting a weaker Walker Circulation—has largely disappeared. This is not unexpected; as ENSO events decay, sometimes the atmosphere and the ocean are on somewhat different schedules. (This is also the case when they begin.) What it tells us is that the ocean-atmosphere coupling, an essential component of ENSO, has likely ended. That provides confidence that the warm sea surface temperature anomaly will continue to diminish, likely crossing into neutral (between 0.5 and -0.5 °C) by April–June.

Animation of maps of sea surface temperatures in the Pacific Ocean compared to the long-term average over five-day periods from February through early April 2024. El Niño’s warm surface is weakening and some regions of cooler-than-average sea surface temperature are appearing. NOAA Climate.gov, based on Coral Reef Watch maps available from NOAA View.

Creatures of the deep

More evidence that El Niño is likely to give way to neutral soon, with La Niña right on its tail, can be found under the surface of the tropical Pacific. We keep a close eye on the temperature of the water in the upper 300 meters (~1000 feet) of the equatorial Pacific because this water provides a source to the surface. Since January, two upwelling Kelvin waves—blobs of cooler water that travel from the west to the east under the surface—have been moving through.

Water temperatures in the top 300 meters (1,000 feet) of the tropical Pacific Ocean compared to the 1991–2020 average in February–April 2024. NOAA Climate.gov animation, based on data from NOAA’s Climate Prediction Center.

The more recent upwelling Kelvin wave will continue to shift eastward and rise up, providing a source of cooler-than-average water to the surface.

Sailfish

As I mentioned above, La Niña causes changes in global atmospheric circulation, making certain temperature and rainfall patterns more likely. We’ll dig into this a bit more after El Niño ends, but one potential La Niña impact has been getting some notice recently: La Niña tends to encourage a more active Atlantic hurricane season. It does this by reducing vertical wind shear—the change in wind from near the surface to high up in the atmosphere—over the Atlantic Ocean, making it easier for hurricanes to grow. Considering that the tropical Atlantic Ocean is already very warm, you can bet that NOAA’s hurricane outlook team is paying close attention to the likelihood of La Niña. NOAA’s early seasonal hurricane outlook will come out next month, and we’ll have a post about hurricanes on the ENSO Blog in June.

NOAA Climate Prediction Center forecast for each of the three possible ENSO categories for the next 8 overlapping 3-month seasons. Blue bars show the chances of La Niña, gray bars the chances for neutral, and red bars the chances for El Niño. Graph by Michelle L’Heureux.

Shark tank

Speaking of the bathwater Atlantic, let’s revisit the topic of the global average surface temperature. This metric isn’t particularly relevant to anyone’s day-to-day operation—when’s the last time you woke up in the morning and thought “I’ll just check the global mean surface temperature forecast for today!”—but it’s a critical monitoring tool for climate change.

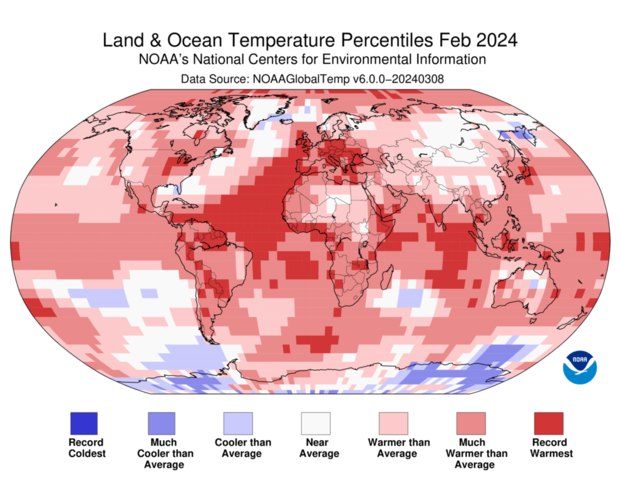
El Niño’s warmer-than-average tropical Pacific tends to contribute to higher global average surface temperature, while La Niña’s cooler tropical Pacific usually contributes to relatively cooler years. However, emphasis is on the relative since more recent La Niña events have been among the top ten warmest years ever.  One can see that much of the global oceans are warmer than average, going beyond El Niño.

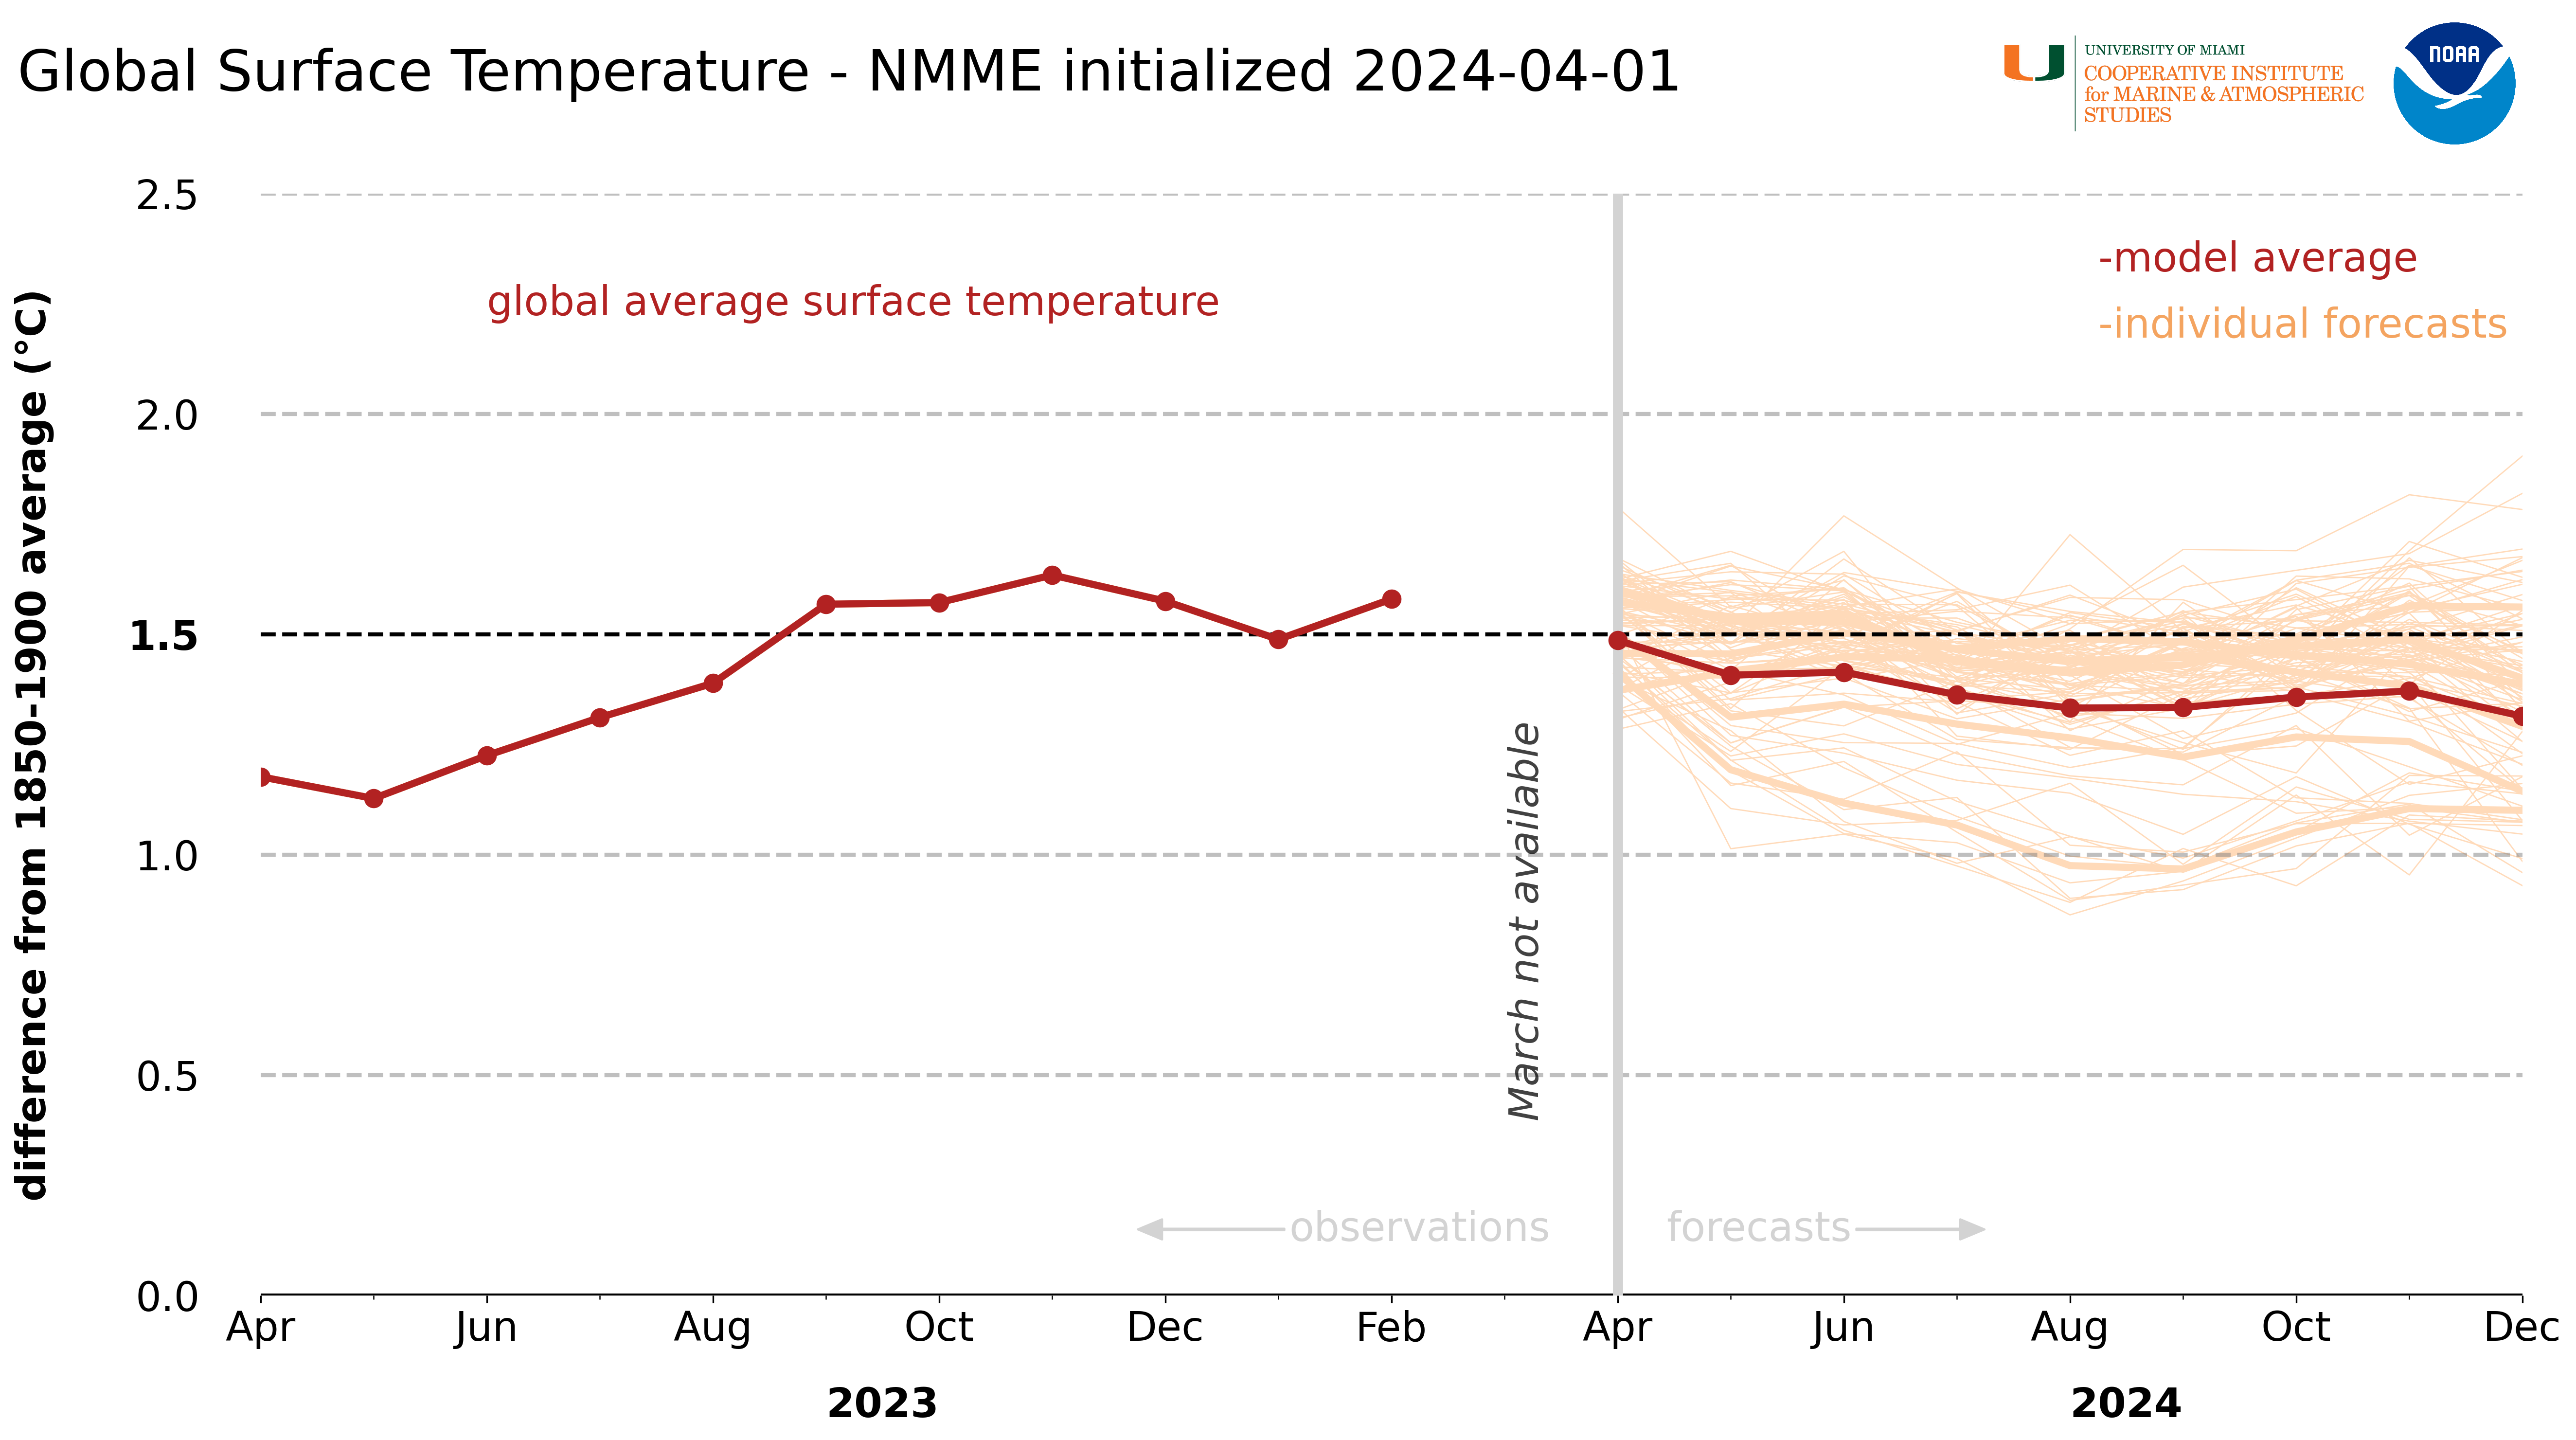
Like with ENSO, we track the global surface temperature anomaly as the departure from the long-term average. Unlike ENSO, a few different “long-term” base periods are used by different researchers and in different situations, including 1991–2020 (recent normal), 1901–2000 (the 20th century), and 1850–1900 (the pre-industrial era). However, so long as you pay attention to which base period is being used, the message is still the same—the global average temperature anomaly is breaking records.

According to NOAA’s National Center for Environmental Information, “the February global surface temperature was 2.52 °F (1.40 °C) above the 20th-century average of 53.8 °F (12.1 °C), making it the warmest February on record [dating back to 1850] and the ninth consecutive month of record-high global temperatures.”

This map from the National Center for Environmental Information shows where February 2024 temperatures fall in the 1951–2024 record. Record-warm February temperatures covered large areas of the Atlantic and Indian Oceans. Approximately 13.8% of the world’s surface experienced record warm temperature this February, the highest percentage for February since the start of records in 1951.

Could a developing La Niña return the global average surface temperature closer to normal? Not very likely. We are just a few months in, and NCEI’s Global Annual Temperature Outlook already predicts “a 45% chance that 2024 will rank as the warmest year on record and a 99% chance that it will rank in the top five.” For more info on how NCEI makes this prediction, check out this post.

The forecast from the North American Multi-Model Ensemble (NMME), a collection of state-of-the-art climate models from U.S. and Canadian centers, predicts only a slight reduction in the global surface temperature anomaly over the next several months. Note that the NMME prediction uses a base period of 1850–1900 to provide an estimate of the increase in global temperature over “pre-industrial” times.

Monthly average temperatures (red dots and line) rose to more than 1.5 degrees Celsius above the pre-industrial average in late 2023. On average, forecasts from the North American Multi-model Ensemble (NMME) system indicate temperatures are likely to decline only slightly as El Niño continues to wane through early 2024. Graph by Kayla Besong based on data from NCEI and Emily Becker/IRI.

It could be another very interesting year, climate-wise. Stay tuna-ed for more from us on ENSO and global climate!

‘Peak #snowpack’ can pack a surprise punch: Mountain snowpack typically peaks in April, but there have been some harrowing, far-from-typical years — News on Tap #ColoradoRiver #SouthPlatteRiver #COriver #aridification

Click the link to read the article on the Denver Water website (Todd Hartman):

April 22, 2024

April is a big month for water watchers. That’s when Colorado’s snowpack typically reaches its highest level before the big melt-out that follows. 

The watchers call this moment “peak snowpack.” And it can be a useful measure to predict water supplies for the warm months to come.

The snow-covered Continental Divide, seen from Loveland Pass. Melted snow, captured and stored in mountain reservoirs, is the source of nearly all the water Denver Water provides to customers every day. Photo credit: Denver Water.

Peak moments that fall earlier on the calendar can mean a spring runoff that ends too soon and reservoirs that don’t fill. Conversely, late peaks can mean reservoirs spill and high-water flows that can overtop riverbanks. 

Indeed, a closer look at “peak” numbers over the last several decades reveals some big surprises when the timing of the maximum snowpack falls outside the late April norm. Such off-rhythm peaks can lead to watering limits or, in the other extreme, raging runoff that can do damage to land and property.

For Denver Water, this year’s peak snowpack numbers look good. 

A mid-to-late April high point appears likely, and a healthy amount of water in the snow supports the utility’s forecast for full reservoirs for the upcoming irrigation season.

In short, it’s what Denver’s water watchers might call “a typical year.”


Join people with a passion for water, at denverwater.org/Careers.


In fact, though, the timing of the peak snowpack and how much frozen water the snow holds at that point is a highly variable condition and can leave water supply managers scrambling. This variability can be easy to forget when most years follow the script, or don’t veer far from it.

“As a water manager, if I only had one piece of data to determine how water supply was looking for a given year, it would be peak snowpack,” said Nathan Elder, who manages the tricky business of water supply for Denver Water. 

“Snowpack peaks can be highly variable in quantity and timing, and those factors indicate what the runoff and water supply situation will look like.” 

Take a look at the following graphs, which show the wide variability in the amount of water frozen in the snow at the point of “peak snowpack” over the past 45 years. The range in both the Colorado and South Platte river basins where Denver Water collects water can stretch from 10 inches to more than 25 inches of water in the snow.

The amount of water frozen in the snow at the moment of “peak snowpack” over the last 45 years in the Colorado River Basin, where Denver Water collects water. Image credit: Denver Water.
The amount of water frozen in the snow at the moment of “peak snowpack” over the past 45 years for the South Platte River Basin, where Denver Water collects water. Image credit: Denver Water.

Denver Water gets its water from parts of two major river basins — the South Platte and the Colorado. Both tend to hit peak snowpack in late April (the 23rd and the 25th respectively) and hit an average of about 12 and 17 inches of “snow-water equivalent,” or SWE, a fancy way of saying amount of water in the snowpack.

But some years Mother Nature has ignored those averages by frightening margins.

One of the scariest was 2012, when peak snowpack for Denver Water collection areas in both basins came not in mid-to-late April, but early March — March 5 in the South Platte and March 6 in the Colorado. 

That was about seven weeks ahead of average and it forced Denver Water to implement outdoor restrictions as reservoirs failed to replenish.

Then there was the infamous spring of 2002, when snow-water totals for Denver Water collection areas at peak were a mere 50% of average in the South Platte Basin and 56% in the Colorado — another example, like 2012, of terrible numbers striking both of Denver Water’s collection basins in the same year. 


Learn more about how Denver Water monitors the snowpack


The spring 2002 peak snowpack contained some of the lowest amount of water in the snow over the last 45 years of records. 

My kids and their friends built a small terrain park in front of their house near Sloans Lake after the March 2003 St. Patrick’s Day blizzard.

That early 2000s drought hung on until the following spring in 2003, when it was busted — fantastically and famously — with a late March blizzard that dropped 7 feet of wet snow in the foothills, 3 feet of snow in the city and put an end to 19 months of below-average precipitation in Denver. 

“Liquid Gold,” blared the banner headline of the now-closed Rocky Mountain News. Anyone living in Denver more than 20 years remembers the storm. 

Peak snowpack has also offered surprises on the opposite end of the spectrum, bringing late peaks and a wealth of water.

In 2015, the peak snowpack date in both basins came a month later than normal, on May 23. That meant a more compressed runoff season and flooding challenges, particularly along the South Platte.

Watch this video about the epic spring runoff of 2015: 

In 1997, the South Platte’s peak snowpack hit a stunning 203% of average. In all, that was 24 inches of water in the snow, twice the average level in a basin that fills four major reservoirs for Denver Water.

Another mark experts like to track is date of melt-out — the date when the last of the snow melts at various measuring spots in the high country. In both basins that typically happens in early June. But, like peak snowpack, melt-out dates can surprise too.

Way back in 1981, a terribly dry year, the South Platte basin saw melt-out April 27 — about the time when Denver Water would typically see peak snowpack! Scary stuff.

Alas, in 1995, the South Platte went to different extremes, with the final melt recorded July 4, an entire month later than average.

During the 1983 Colorado River flood, described by some as an example of a “black swan” event, sheets of plywood (visible just above the steel barrier) were installed to prevent Glen Canyon Dam from overflowing. Source: Bureau of Reclamation

In the Colorado River Basin, the latest such melt-out stretched to July 12, in 1983. That year is famous for the swollen river flows all the way to Lake Powell, where Glen Canyon Dam nearly overtopped.

That runoff season was memorialized in the “The Emerald Mile,” a remarkable book that chronicled attempts to take advantage of record river flows to set speed records boating through the Grand Canyon. 

All of it is a reminder that average years are just another way nature leaves room for surprises. 

So, let’s be satisfied this spring with an “average” peak and a solid water supply for 2024.

The Environmental Protection Agency, South Adams County Water and Sanitation District to break ground on drinking water treatment enhancements for #PFAS chemicals on April 25, 2024

This USGS map shows the number of PFAS detected in tap water samples from select sites across the nation. The findings are based on a USGS study of samples taken between 2016 and 2021 from private and public supplies at 716 locations. The map does not represent the only locations in the U.S. with PFAS. Sources/Usage: Public Domain. Visit Media to see details.

From email from the EPA:

DENVER (April 23, 2024) — On Thursday, April 25, U.S. Environmental Protection Agency (EPA) Regional Administrator KC Becker will join U.S. Senator Michael Bennet on a visit to the South Adams County Water and Sanitation District (SACWSD) to break ground on a water treatment system that will allow SACWSD to deliver high-quality drinking water that meets all state and federal regulations, including EPA regulations for to treat PFAS chemical contamination by 2029.

WHO:       

·       U.S. Senator Michael Bennet

·       EPA Regional Administrator KC Becker

·       South Adams County Water and Sanitation District Board President Heidi McNeely

·       South Adams County Water and Sanitation District Manager Abel Moreno

Additional representatives from South Adams County Water and Sanitation District will be in attendance, along with other key project partners from:

·       Brown & Caldwell, engineering consultant

·       PCL Construction, construction manager

·       United States Environmental Protection Agency

·       Colorado Department of Public Health and Environment

WHAT:  

EPA and partners will break ground on the Klein Enhancement Project. The project, a partnership with Brown & Caldwell Engineering and PCL Construction, will construct an ion-exchange water treatment system that will allow SACWSD to deliver high-quality drinking water that meets all state and federal regulations, including EPA regulations required to treat for PFAS chemical contamination. SACWSD was recently awarded nearly $61 million in federal funding to complete the construction. The project is expected to be completed in late 2026. 

Tours of existing treatment facilities and the enhancement project site will be available after speakers’ remarks.

WHEN:         2 p.m., Thursday, April 25, 2024

WHERE:       7400 Quebec Street, Commerce City, Colorado 

U.S. Bureau of Land Management #conservation rule likely to survive challenges, advocates say — @WyoFile

A Sublette Herd pronghorn sizes up an intruder in its habitat within the confines of Jonah Energy’s Normally Pressured Lance gas field in August 2023. (Mike Koshmrl/WyoFile)

Click the link to read the article on the WyoFile website (Angus M. Thuermer Jr.):

April 22, 2024

A federal rule to put conservation on par with extractive industries will not be subject to the Congressional Review Act that could allow it to be easily overturned, a U.S. representative from New Mexico said Monday.

The Bureau of Land Management has drawn criticism from Wyoming’s governor, its D.C. delegation, industrial leaders and agricultural interests after finalizing the Public Lands Rule last week. But a coalition of conservationists defended the BLM in a press call Monday organized by the Conservation Lands Foundation and The Wilderness Society.

The rule will allow the BLM to consider “mitigation restoration leasing” equally with other uses like grazing, mining and oil and gas development.

The rule identifies conservation tools to keep natural landscapes intact and restore them where degraded, a move advocates say marks a shift from what the BLM has considered or ignored when setting frameworks for use of its 18.4 million acres in Wyoming.

Although Republican U.S. Sen. John Barrasso, a staunch advocate for the energy industry, has said he would use the Congressional Review Act to block the rule, U.S. Rep. Melanie Stansbury, a Democrat from New Mexico, said that’s not going to happen.

The review act, successfully employed by former U.S. Rep. Liz Cheney to block another BLM planning effort in 2017, is subject to time limits and deadlines that make its successful use improbable in this instance, Stansbury said. “This rule being finalized now should protect it from a rollback by Congress,” she said. “It should be fine in terms of making it ineligible for Congressional Review Act repeal.”

Wyoming native Jordan Schreiber, a lobbyist for The Wilderness Society, said she was “very confident” about defending the rule. “I’m not losing sleep over it,” she said of congressional discomfort.

A durable measure

To thwart the rule, Barrasso last year introduced a bill that targets the BLM initiative. Nine senators, including U.S. Sen. Cynthia Lummis, another Republican, joined as sponsors. The bill has not advanced.

Industrial users also have challenged the plan, as has Gov. Mark Gordon, who questioned the constitutionality of the BLM action. The Petroleum Association of Wyoming called it “a new, extra-legal, executive branch authority.” That suggests lawsuits will be filed.

BLM supporters said the rule will survive such legal challenges. “We are confident that the rule will prove durable over time and we intend to strongly defend the rule … in the courts,” said Michael Carroll, BLM campaign director with The Wilderness Society.

The Sand Dunes Wilderness Study Area encompasses 27,000 acres of BLM land in the Red Desert. There, people can hike, bird watch and hunt. (Bob Wick/BLM/FlickrCC)

New Mexico’s Stansbury also dismissed misinformation. “This is not a land grab,” she said, blaming Republicans for inaccurate spin.

“This is not an attempt by the federal government to take away activities on public lands,” including utilizing resources “that we use in everyday life,” Stansbury said. “This is really about modernizing the way that we do land management. It’s about putting conservation and cultural uses on par with extractive uses.”

Congress stated that the BLM “should not emphasize the greatest short-term economic element,” when outlining how to manage its 30% of Wyoming’s land and 245 million acres nationwide, said Chris Winter, a professor at the University of Colorado Law School. The U.S. 10th Circuit Court of Appeals has said that “conservation to protect environmental balance” is one of the uses the BLM must weigh along with oil and gas development, grazing and so on, Winter said.

Lander resident Bailey Brennan, an attorney and farmer, said her 3-year-old daughter has been with her on three pronghorn hunts on public lands, all possible because of intact migration corridors. With the rule, restoration leases will allow the National Wildlife Federation she works for to help fight cheatgrass and restore riparian areas along those routes.

That type of work will ensure daughter Frances could have the same pronghorn hunting experience “when she is a grown-up with her children,” Brennan said.