
Click the link to read the article on the Inkstain website (John Fleck):
April 1, 2024
Inspired by Jack Schmidt’s monthly “how much water is in Colorado River storage” posts (see here for last month’s), I’ve been playing with a similar tool to help me think about the status of our reservoirs on the Rio Grande system here in New Mexico.
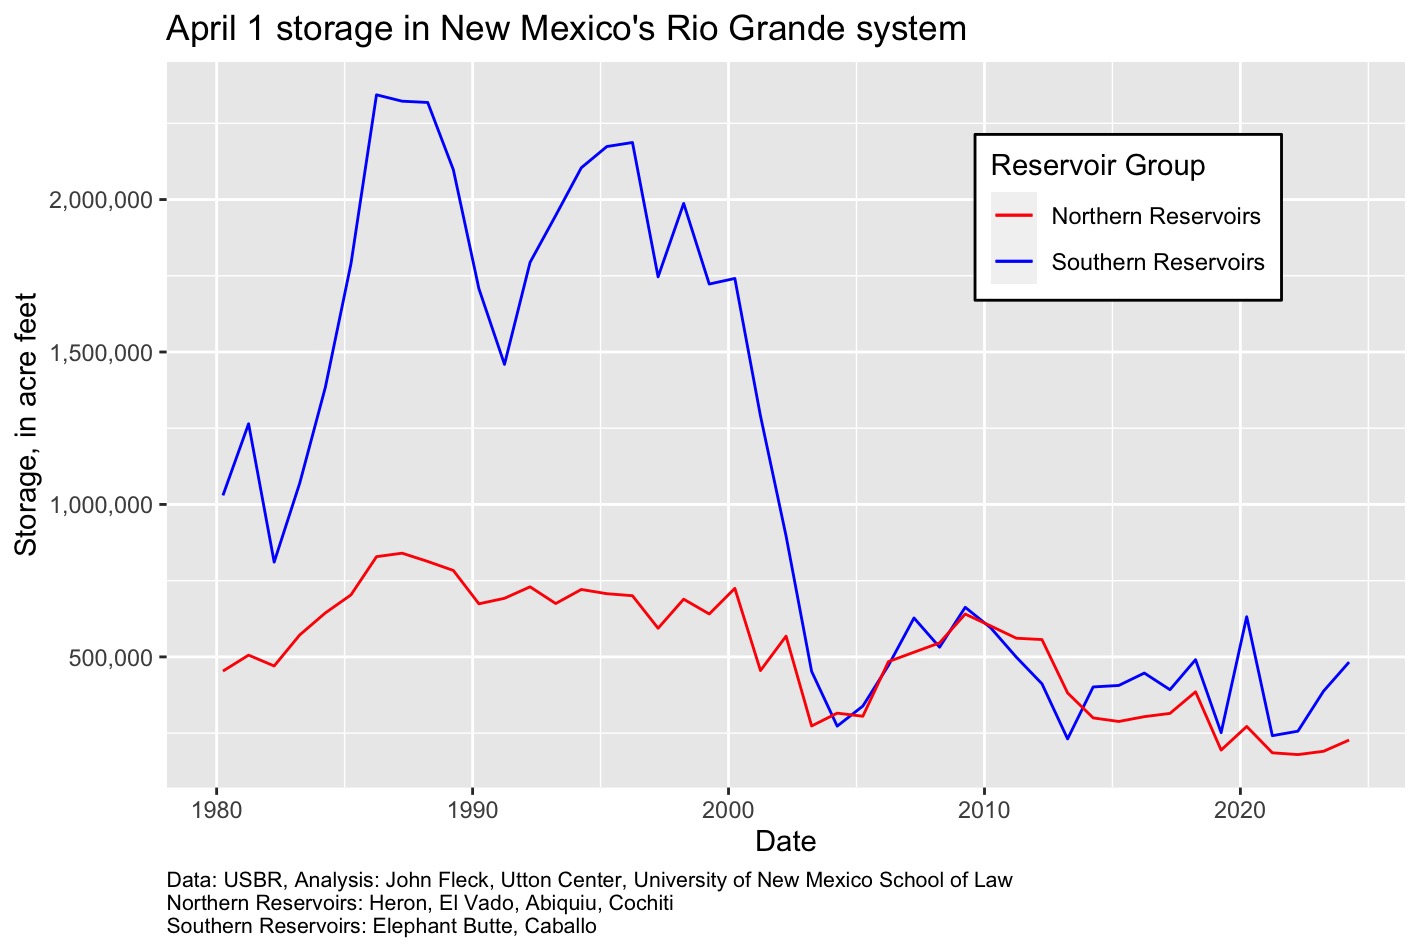
The graph above helps me with two important intuitions about how the system is functioning.
At the decadal scale, the water management shift in the early 2000s from a time of plenty to a time of not plenty is dramatic.
At the interannual scale, the decline in water kept in storage upstream of the middle valley (the red line above) goes from bad to worse beginning in the late teens.
Data choices
NORTH AND SOUTH
Based on a useful conversation with Jack about this, it makes sense here to split things up into two bins – the northern reservoirs (which hold the water available for our use here in New Mexico’s Middle RIo Grande Valley) and the southern reservoirs (which hold storage for the Elephant Butte Irrigation District, El Paso and surrounds, and Mexico).
TIME SERIES
Because of a quirk in the data I have access to, and because I am too lazy to do the work to overcome the quirk, it makes sense to start the time series at 1980. But that also makes conceptual sense in terms of how I think about the system – our “modern era” of water management includes these two broad multi-decadal periods – the wet stuff 1980-2000, and the dry stuff ever since.
TIME STEP
I find it most helpful to plot this at an annual time step. How does storage right now compare to last year at this time? So the graph above is the storage as of April 1 (actually March 31). I’ve plotted it both ways (daily as well), but the interannual ups and downs make it harder for me to see what’s going on.
2024 v. 2023
After last year’s unusually wet year:
- Northern reservoirs are up ~27,000 acre feet on April 1
- Southern reservoirs are up ~95,000 acre feet.
The Loss of El Vado

The loss of El Vado Reservoir, currently under repair, is striking. But what’s also striking is how significantly we were draining it in recent years, before the current repairs started in 2022.
The Middle Rio Grande Conservancy District built El Vado in the 1930s (with an under-appreciated amount of federal subsidy) to extend the irrigation season, capturing spring runoff for use in the dry months of late summer and fall. (“Canals move water in space, dams move water in time.”)
I’m still playing with how best to illustrate this. The graph above shows how full El Vado gets each year as it swells with spring runoff (blue dot) and how far we’ve drained it by the end of the year (red dot).
Catchy Song Lyric version
