Click the link to read the article on The Denver Post website (Elise Schmelzer). Here’s an excerpt:
February 11, 2025
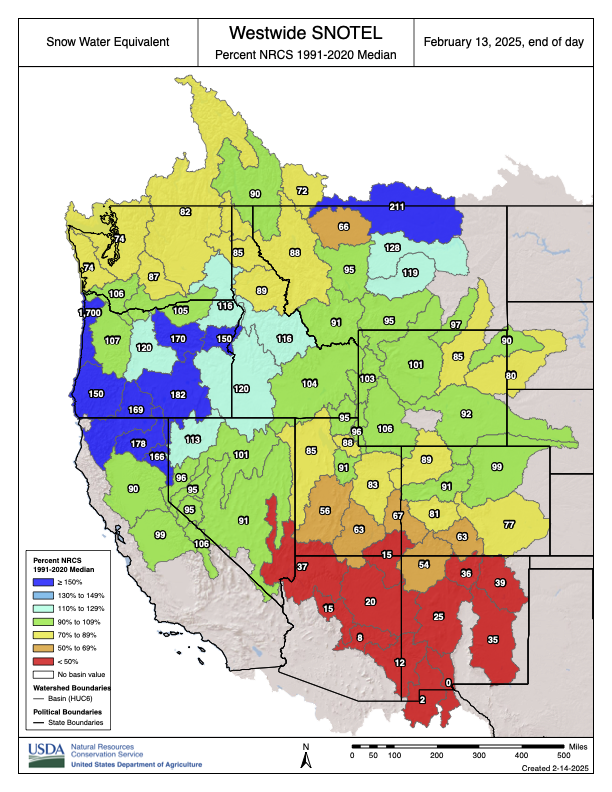
Snowpack across Colorado ranges from close to normal levels near the Colorado River headwaters, outside Grand Lake, to troublingly low along the state’s southern border. The pattern of snow conditions worsening from north to south is also visible across the broader mountain west — where snowpack is near normal in the most fortunate places and drastically below normal in the southern tail of the Rocky Mountains…
West Drought Monitor map February 11, 2025.
The drought across much of the mountain west follows a year when many states recorded some of their warmest average temperatures in the last 130 years. 2024 was Colorado’s fourth-warmest year in that time period, and it was the second-warmest year for New Mexico and Utah and the third-warmest year for Arizona and Wyoming…
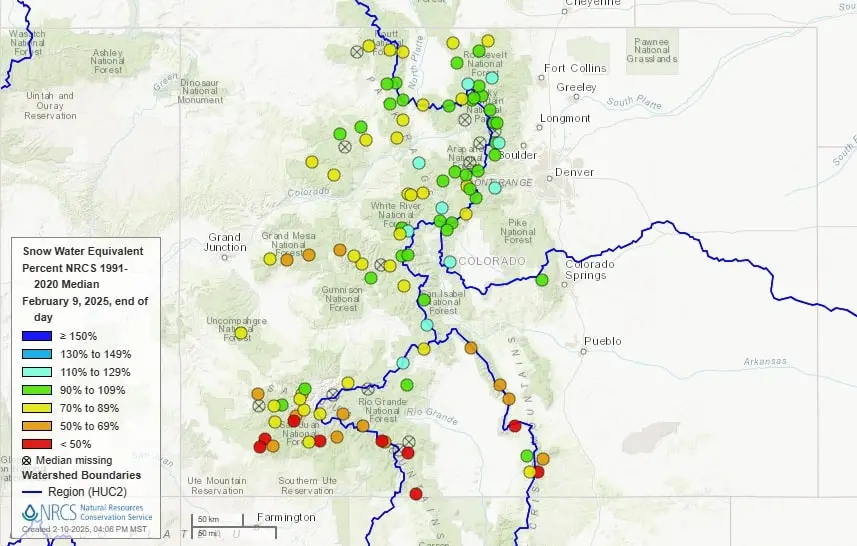
A map from the U.S. Department of Agriculture’s National Water and Climate Center shows Colorado snowpack levels as of Feb. 9, 2025, compared to the median recorded from 1991 to 2020. (Image courtesy of National Water and Climate Center)
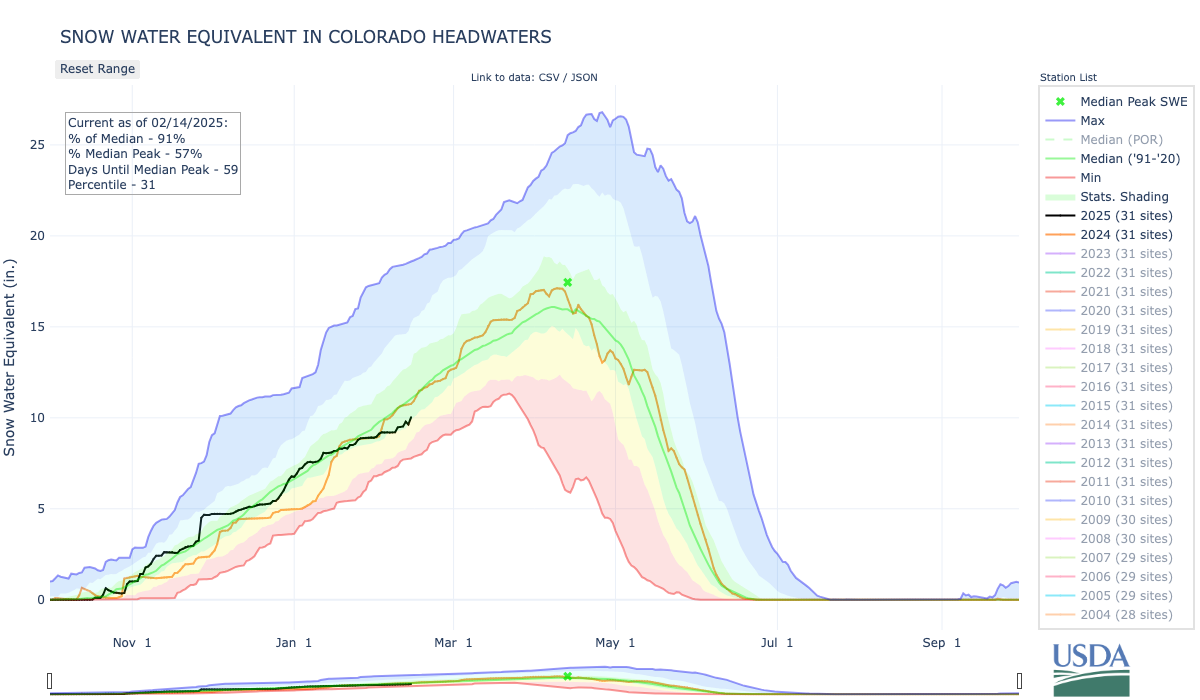
Statewide, the snowpack is at 82% of the median between 1991 and 2020. Snowpack in the mountains from near Rocky Mountain National Park to the ranges in the south near Aspen, Silverthorne and Buena Vista are generally sitting at near-to-above normal. Mountains farther south and west, however, remain much more dry. A snow observation station near Mancos is recording snowpack at 31% of normal — the lowest in the state.
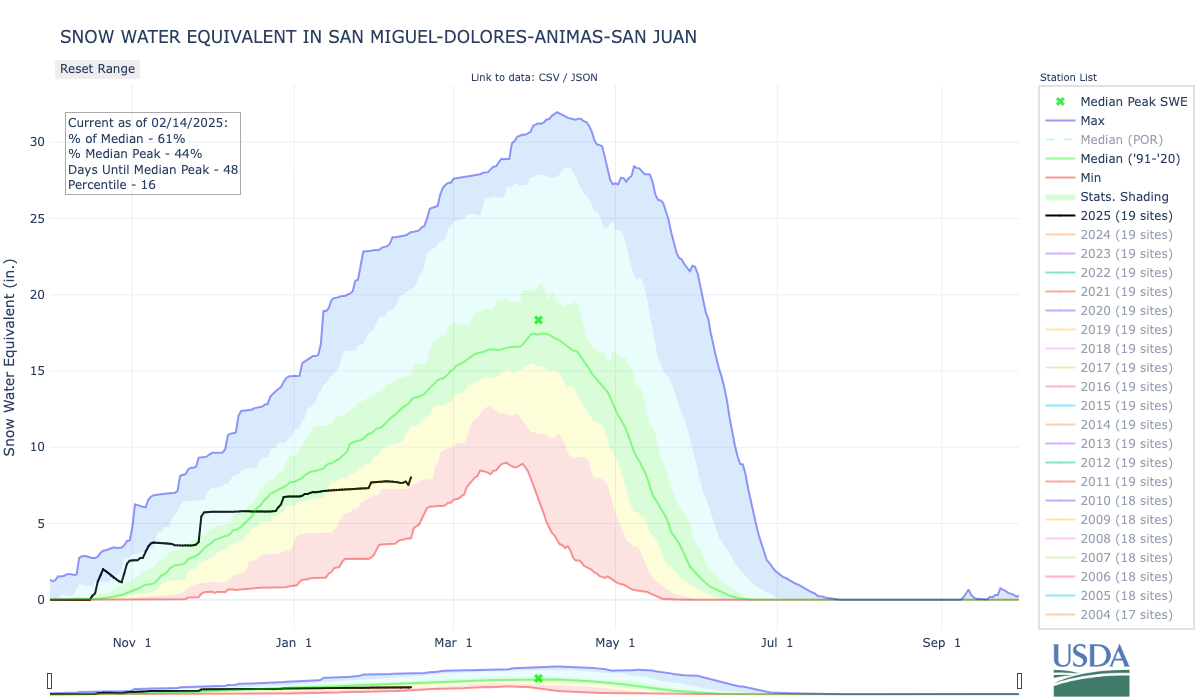
In southwest Colorado, snowpack in the San Miguel, Dolores, Animas and San Juan basins is at only 61% of median. The Upper Rio Grande Basin, similarly, sits at 64% of median.
Three of Colorado’s top water experts hammered home the idea that Colorado’s water situation id precarious, at best, and almost always on the brink of crisis. The day-long Voices of Rural Colorado symposium in Denver was the setting for an hour-long discussion of Colorado water. Attendees heard from, and interacted with, Rebecca Mitchell, former executive director of the Colorado Water Conservation Board and now Colorado’s representative on the Upper Colorado River Commission; Zane Kessler, director of government relations for the Colorado River District; and Jim Yahn, Logan County Commissioner and manager of the North Sterling Irrigation District. One of the points that was repeatedly made during the discussion was that the Colorado River is Colorado’s River. Besides watering most of the Western Slope of Colorado, the river is tapped for more than a half-million acre feet of water to the Front Range and eastern plains. Nearly half of that, about 200,000 acre feet per year, is fed directly into the Big Thompson River at Estes Park, primarily for irrigation in the South Platte River Basin. The remaining 330,000 acre feet is diverted to cities on the Front Range like Denver, Colorado Springs and Pueblo. That water ends up in the South Platte and Arkansas River basins…
Yahn told the attendees that continued drought in the Colorado River Basin will have an impact on the South Platte Valley, which is why projects like the Chimney Hollow Reservoir, nearing completion next to Carter Lake west of Berthoud, are important…Mitchell said that the crisis on the Colorado is easily seen in the water levels of the two largest reservoirs on the river, Lake Mead on the Nevada-Arizona state line near Las Vegas, and Lake Powell, halfway between Salt Lake City and Phoenix on the Utah-Arizona state line.
In January, precipitation varied across the region, from much below average conditions in Utah and western Colorado to much above average conditions in eastern Colorado and southeastern Wyoming. January temperatures were colder than usual, especially in Colorado and Wyoming where temperatures were 6 to 10°F below average. Snow-water equivalent (SWE) was generally below normal, particularly in southern Utah and southwestern Colorado. Seasonal streamflow forecasts for February 1st indicate below average runoff for much of the region, with the worst forecasts for Utah. Drought coverage increased across the region, affecting 56% of the region as of February 4th. La Niña conditions emerged in the Pacific Ocean but are expected to transition back to ENSO-neutral by spring 2025. NOAA seasonal forecasts for February-April suggest an increased probability of below average precipitation for the majority of the region.
January precipitation was below to much below average in Utah, western Colorado, and southwestern Wyoming, and above to much above average in eastern Colorado and central to southeastern Wyoming. Large areas of 200-400% of average precipitation occurred from Laramie County in southeastern Wyoming down to Pueblo County in southeastern Colorado, with small pockets of 200-400% of average precipitation in Natrona County in central Wyoming and Uintah County in northeastern Utah. Large areas of less than 2% of average precipitation occurred in southern Utah. Record-dry conditions occurred across Utah and in the West Slope of Colorado.
Precip_1.2025
Precip_Percentile_1.2025
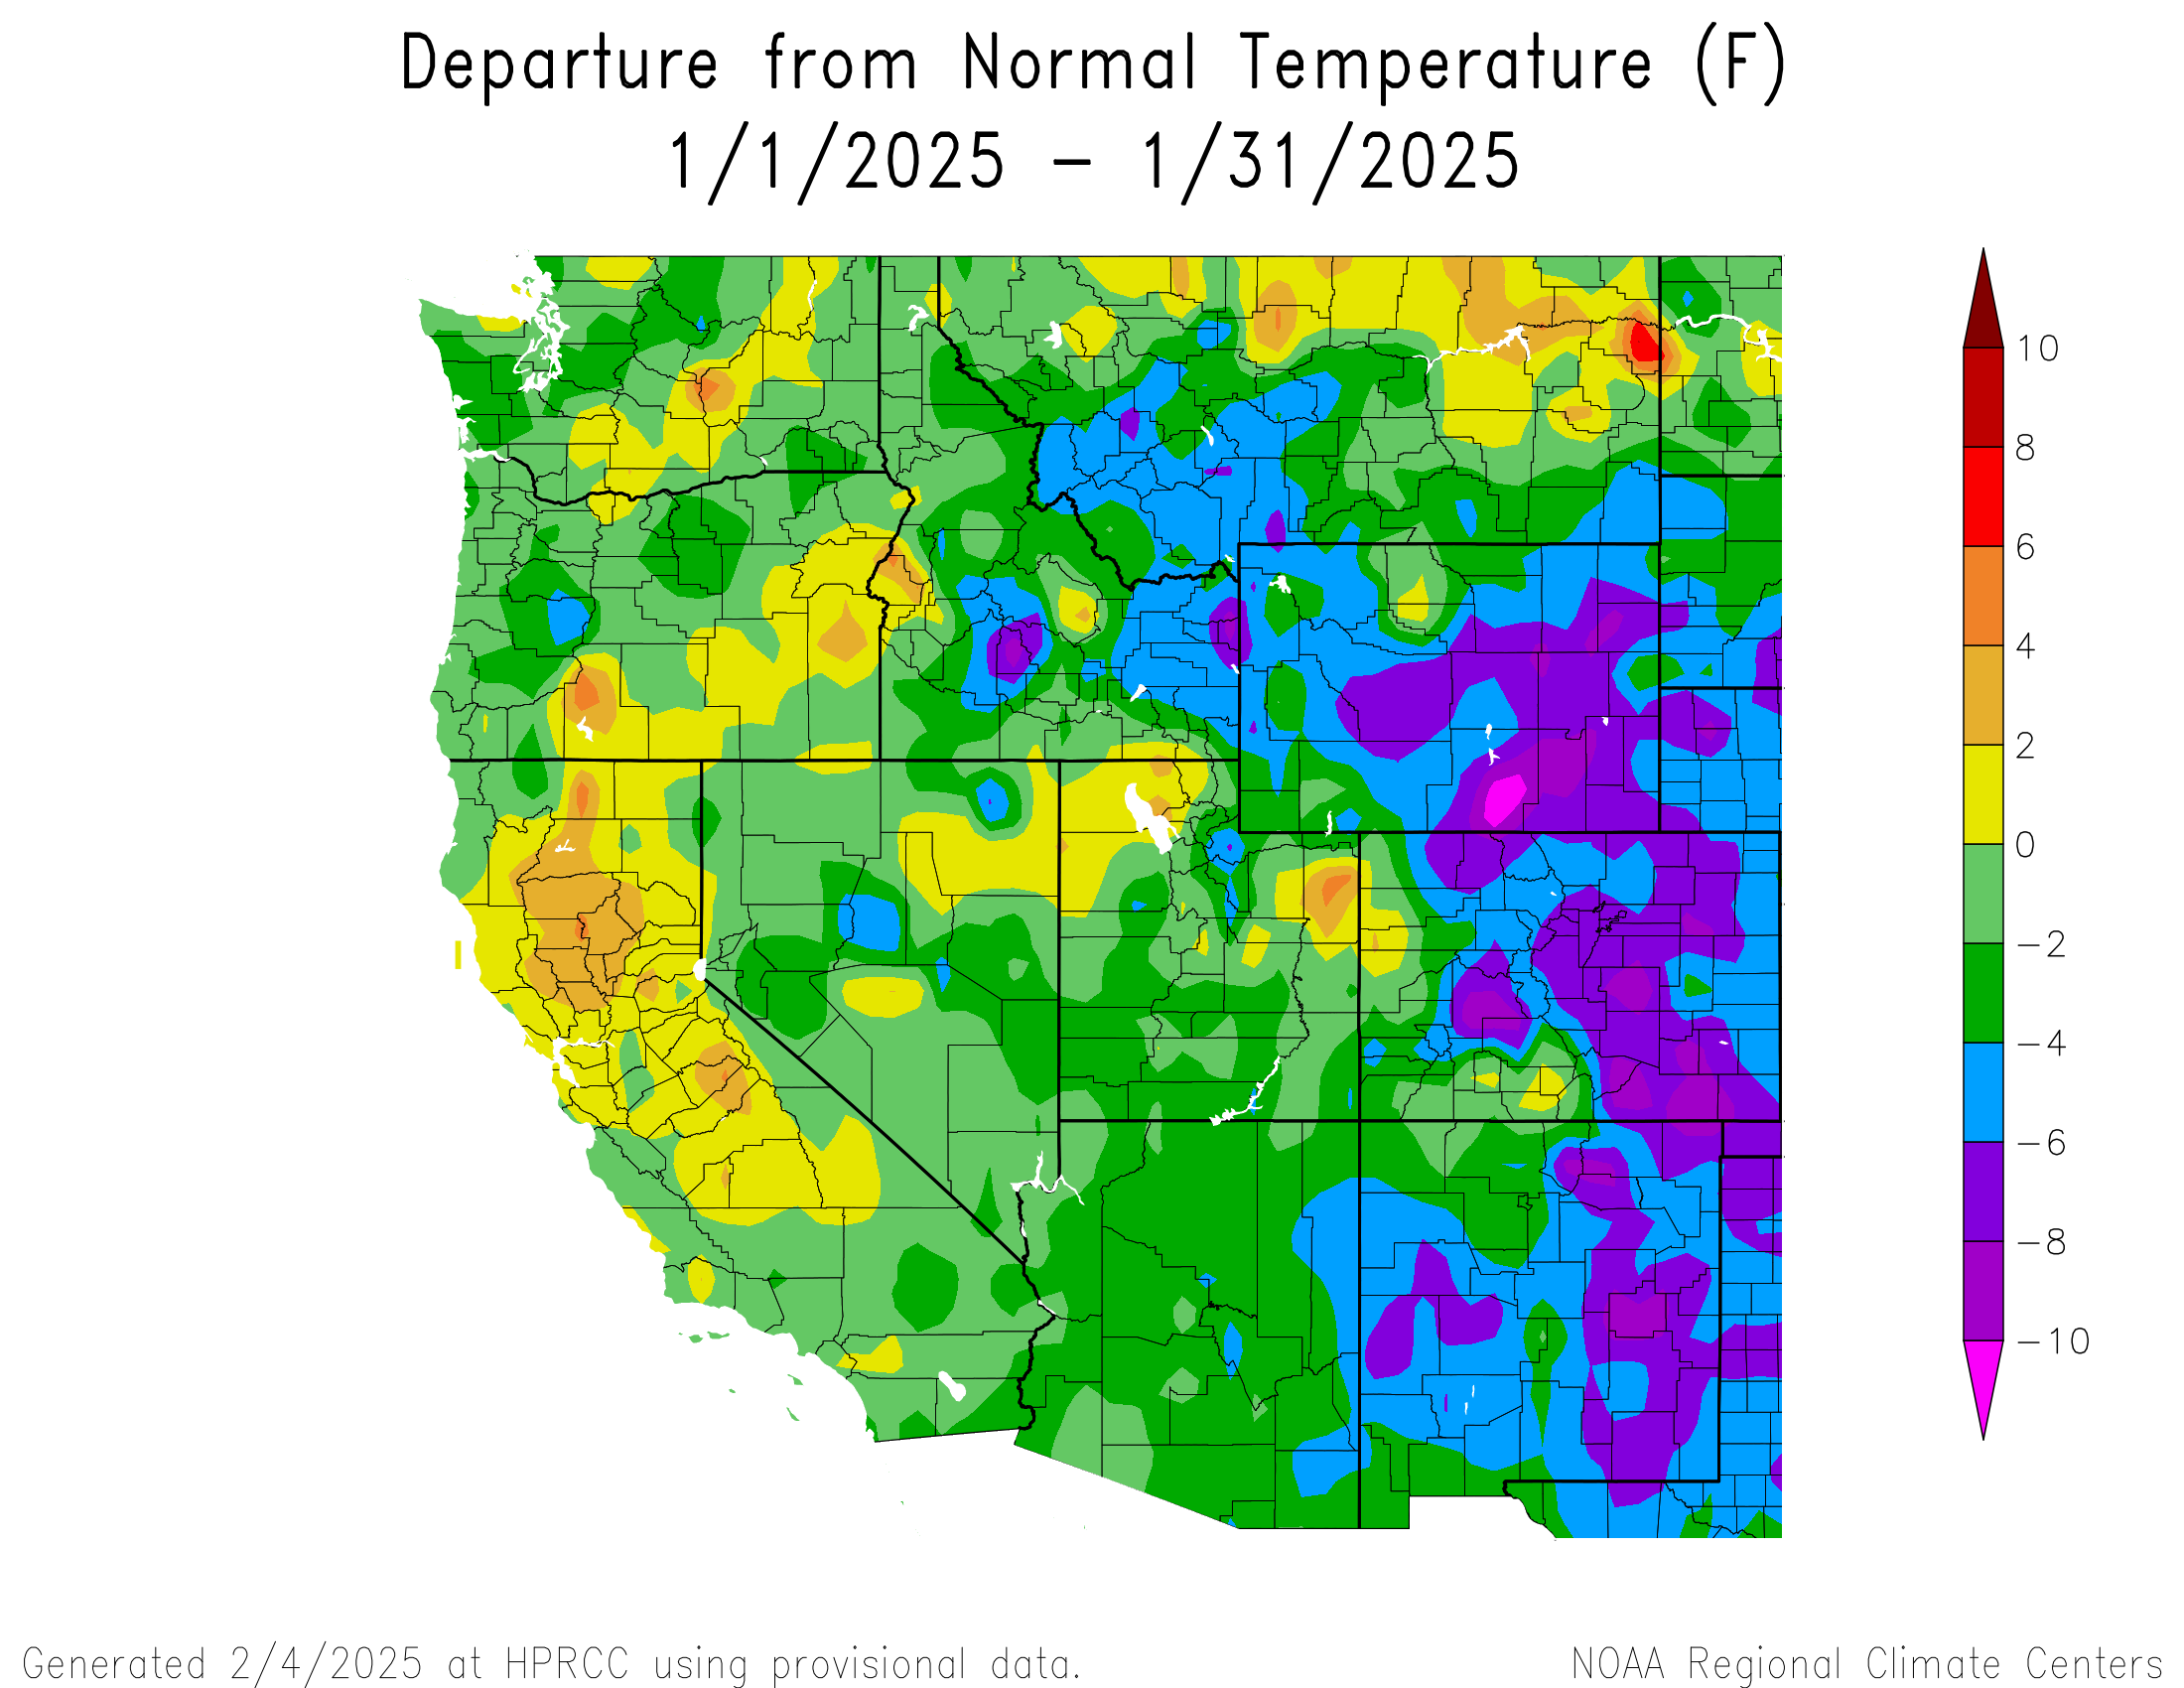
January temperatures were near to below average in Utah and below to much below average in Colorado and Wyoming. Temperatures of 6 to 8°F below average occurred throughout most of Colorado and Wyoming with scattered pockets of 8 to 10°F below average. One pocket of lower than 10°F below average temperatures occurred in Carbon County in southern Wyoming.
Temp_1.2025
temp_Percentile_1.2025
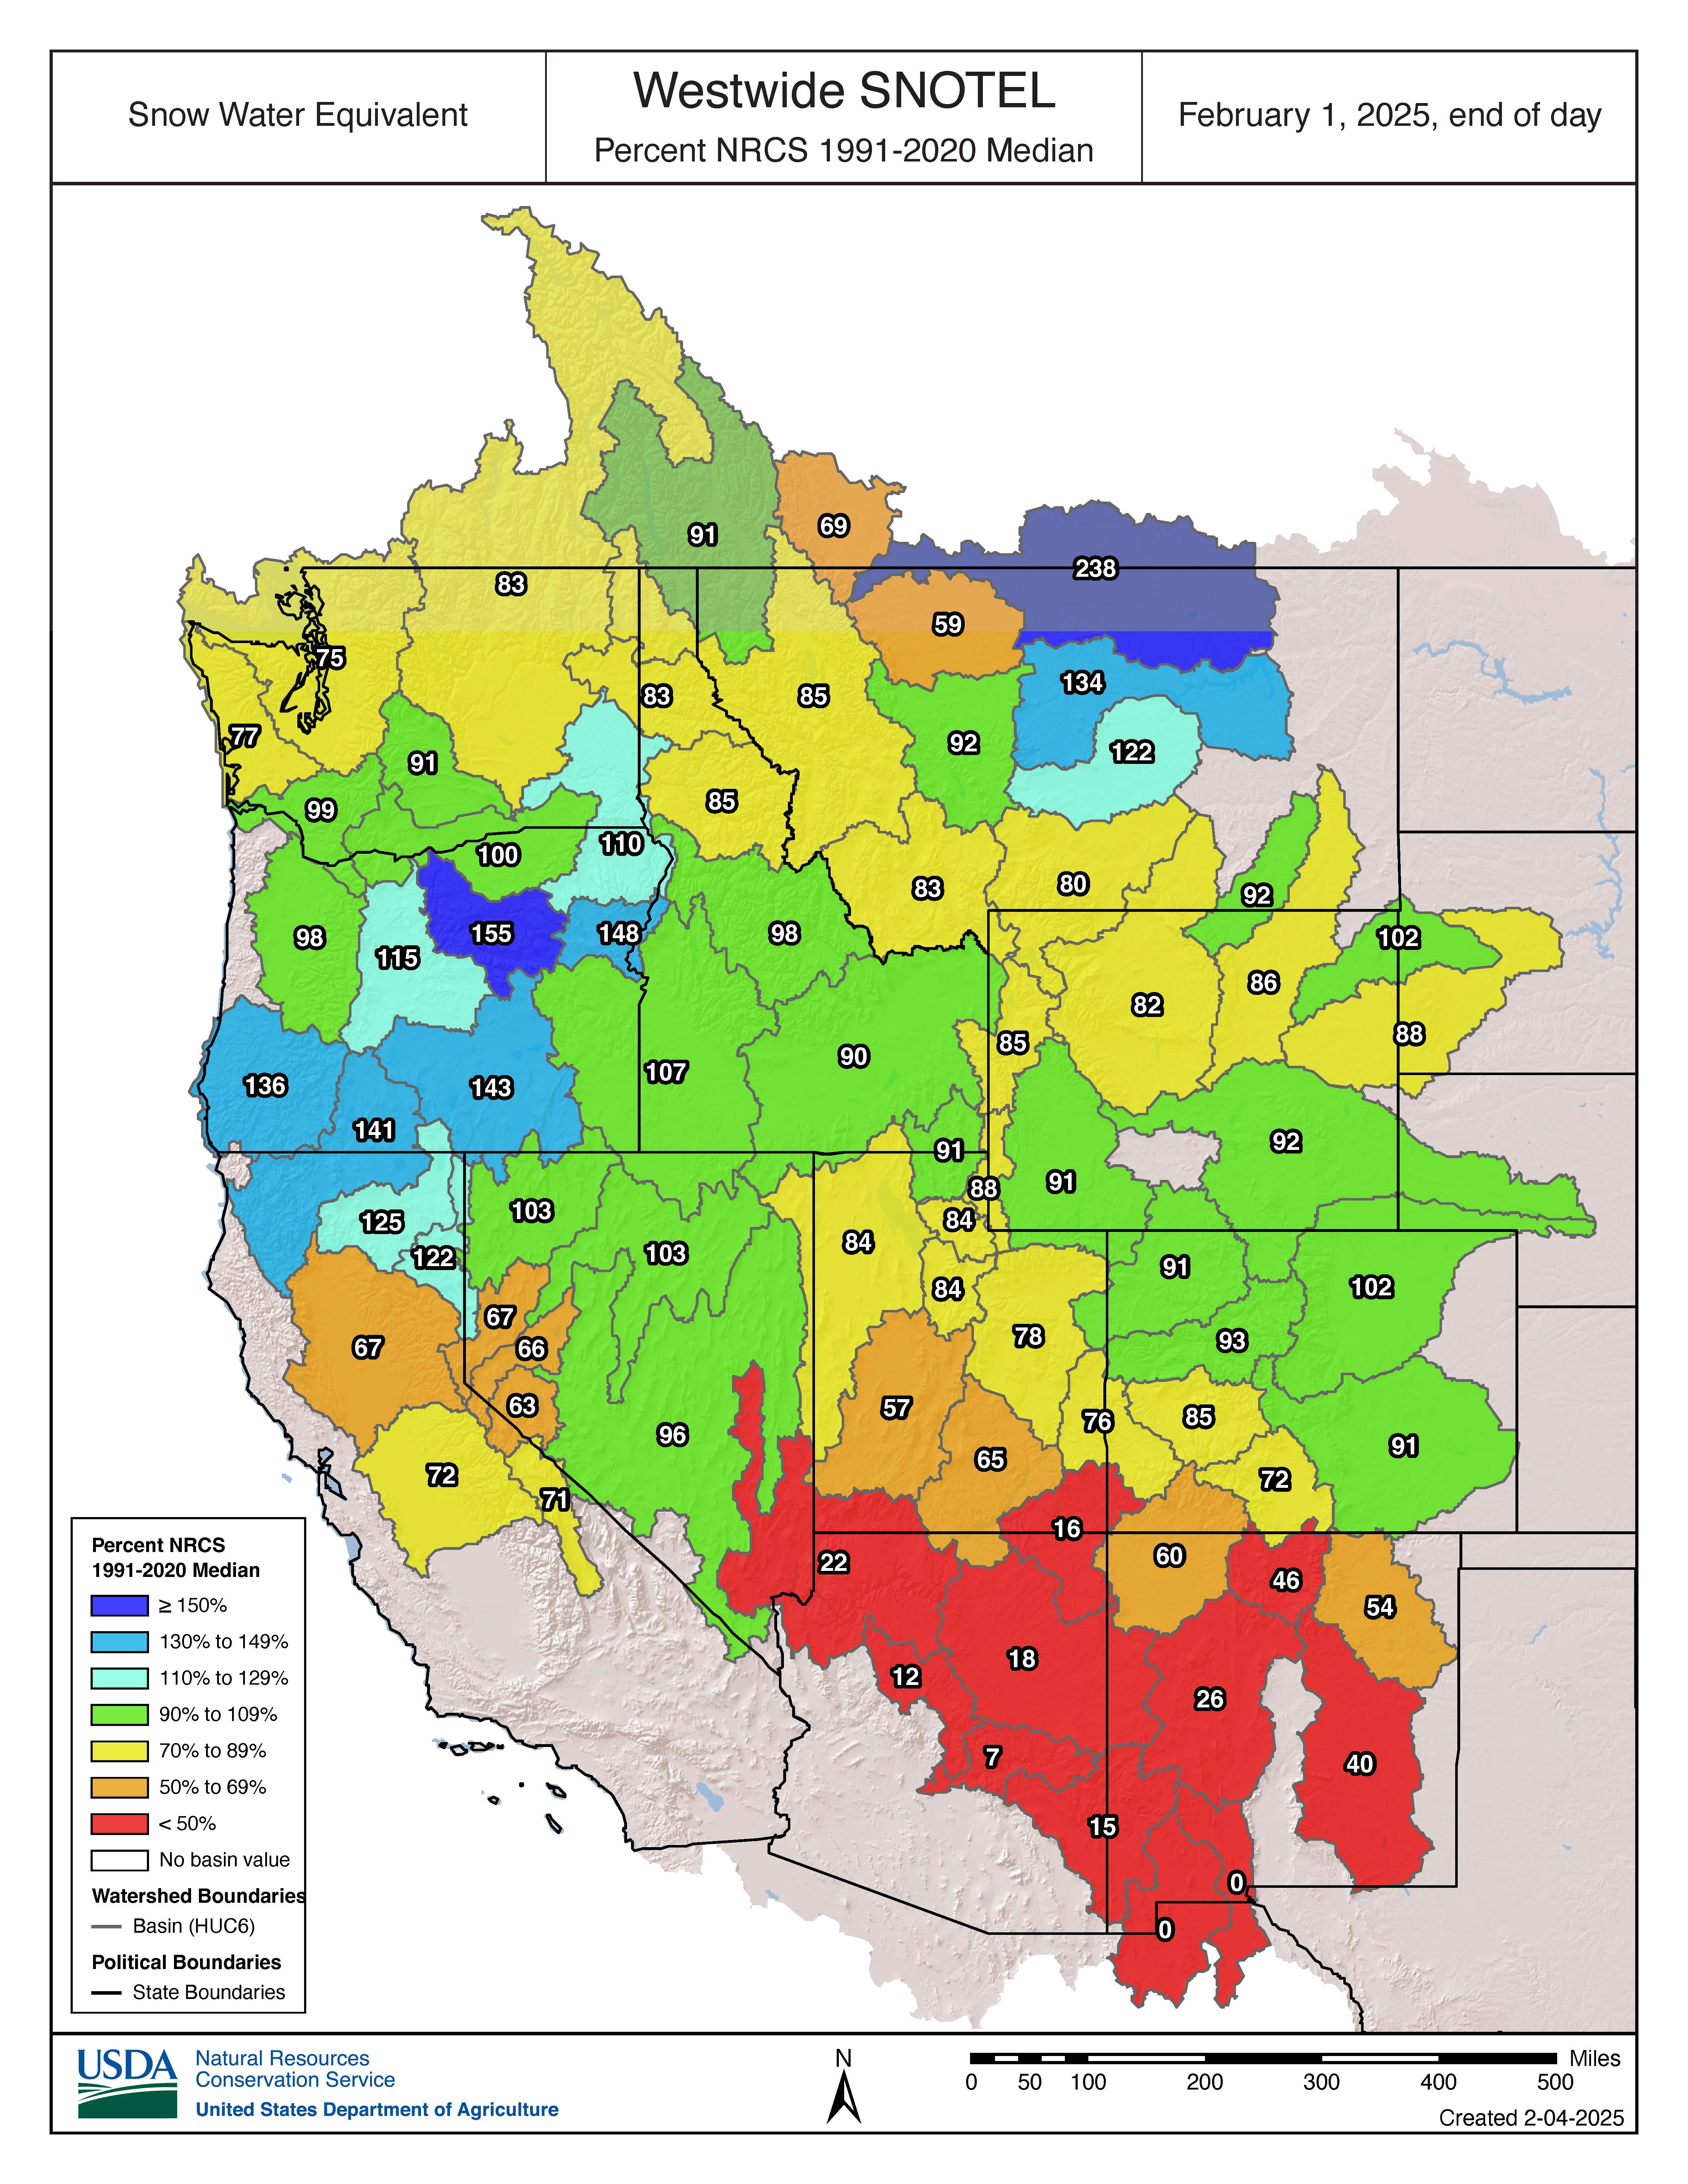
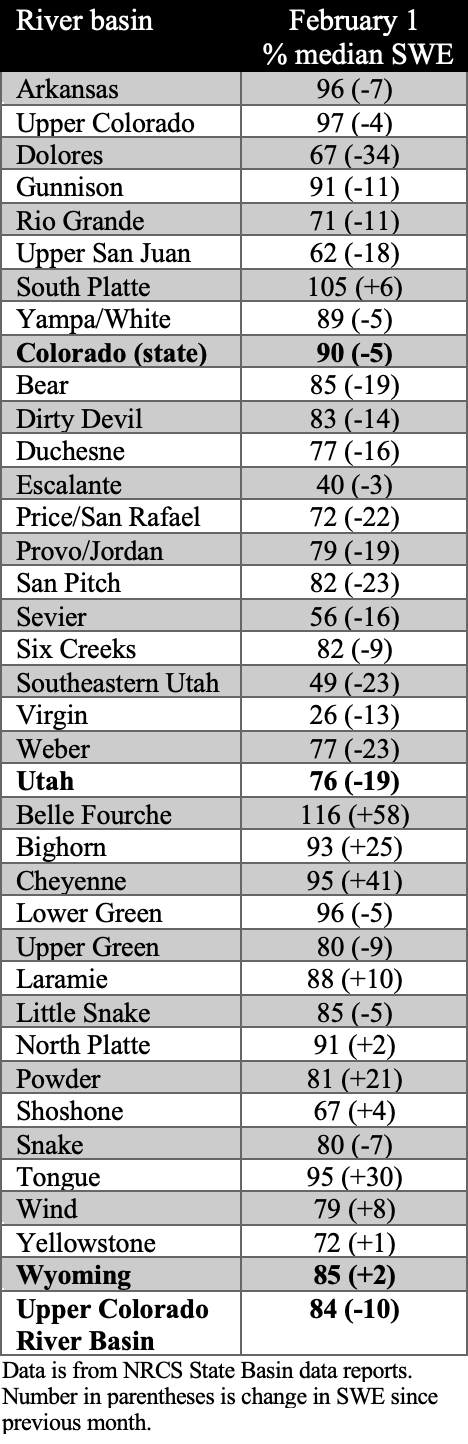
Snow-water equivalent (SWE) was near to below normal for the majority of the region, with much below normal conditions in southern Utah and southwestern Colorado. The majority of river basins in Colorado and Utah saw a significant decrease in SWE conditions relative to median during January, whereas many Wyoming river basins saw a significant increase, particularly the Belle Fourche, Cheyenne, Tongue, Bighorn, and Powder River Basins. On a statewide basis, February 1st SWE conditions in Colorado were near normal (90%) and below normal in Wyoming (85%) and Utah (76%). Southern Utah is still experiencing the worst snow drought conditions with the Virgin River Basin at 26% of normal and the Escalante River Basin at 40% of normal. According to the Real-Time Spatial Estimates of Snow-Water Equivalent (SWE) tool, all major river basins in the region have below average February 1 SWE except for the Tongue and Powder River Basins in Wyoming which are slightly above average at 113% and 108%, respectively. The Lower Colorado and Lower San Juan River Basins in southern Utah are experiencing the lowest average SWE at 4% and 1%, respectively.
swe_2.1.25
SWE_basin_020125
Real-Time-SWE_HUC_2.1.2025
February 1st seasonal streamflow forecasts suggest below average runoff throughout much of the region, with much below average runoff in Utah, and near average runoff in eastern Colorado and northeastern Wyoming. In Colorado, seasonal streamflow forecasts for the Animas, Upper Colorado, and Gunnison are below average (70-89%), and the Dolores and San Juan River Basins are much below average (50-69%). In Utah, seasonal streamflow forecasts for the Lower Green, Price, Provo, and Six Creeks are below average and the Bear, Colorado, and Weber are much below average, with exceptionally below average forecasts for the Duchesne, Sevier, and Virgin River Basins (<50%). In Wyoming, seasonal streamflow forecasts for the North Platte and Snake are below average and the Bighorn, Upper Green, Shoshone, and Wind River Basins are much below average.
Streamflow_Forecast_2.1.2025
ForecastByBasin_020125
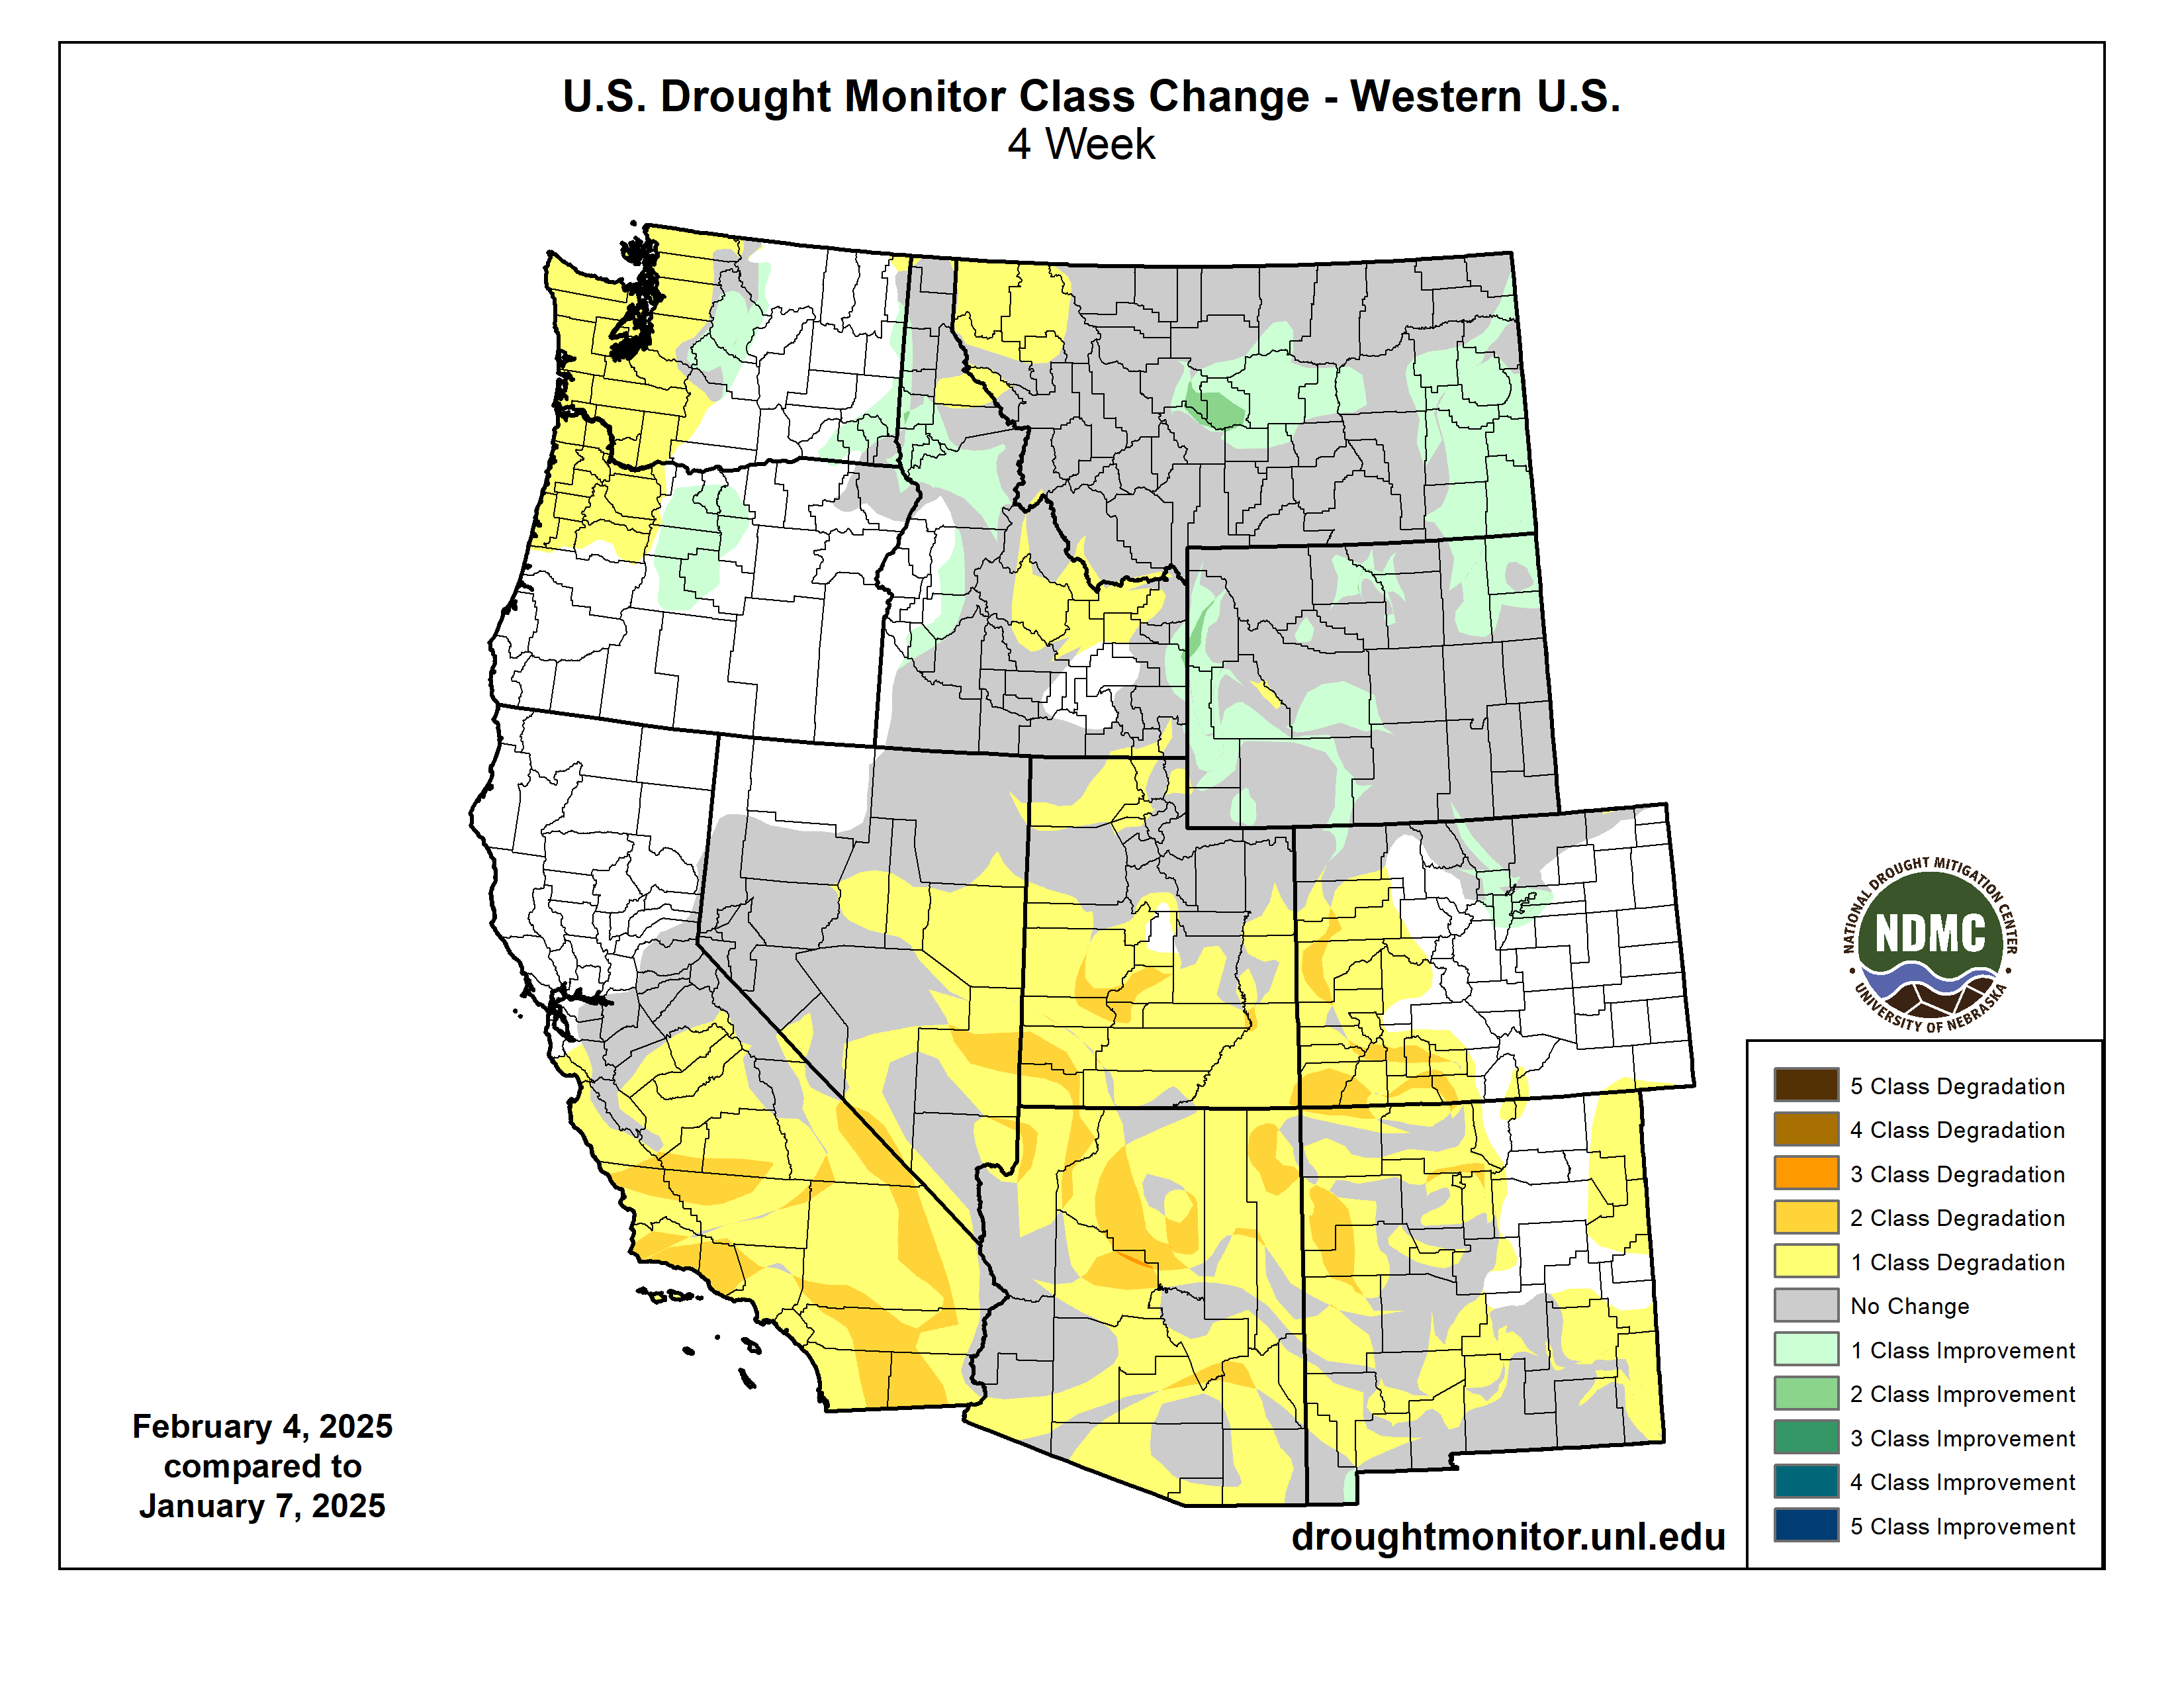
Regional drought coverage increased in January and now, as of February 4th, covers 56% of the region, compared to 39% in early January. Drought coverage nearly quadrupled in Utah and doubled in Colorado, while Wyoming saw a slight decrease in drought coverage. In Colorado, moderate (D1) drought expanded in the West Slope and severe (D2) drought developed in the southwest. In Utah, D1 drought expanded across the state, D2 drought expanded in the southwest, and extreme (D3) drought developed in the southwest. Despite Wyoming still experiencing over 80% drought coverage, there was a slight improvement in drought conditions across the state in January.
Drought_2.4.25
Drought_Change_2.4.25
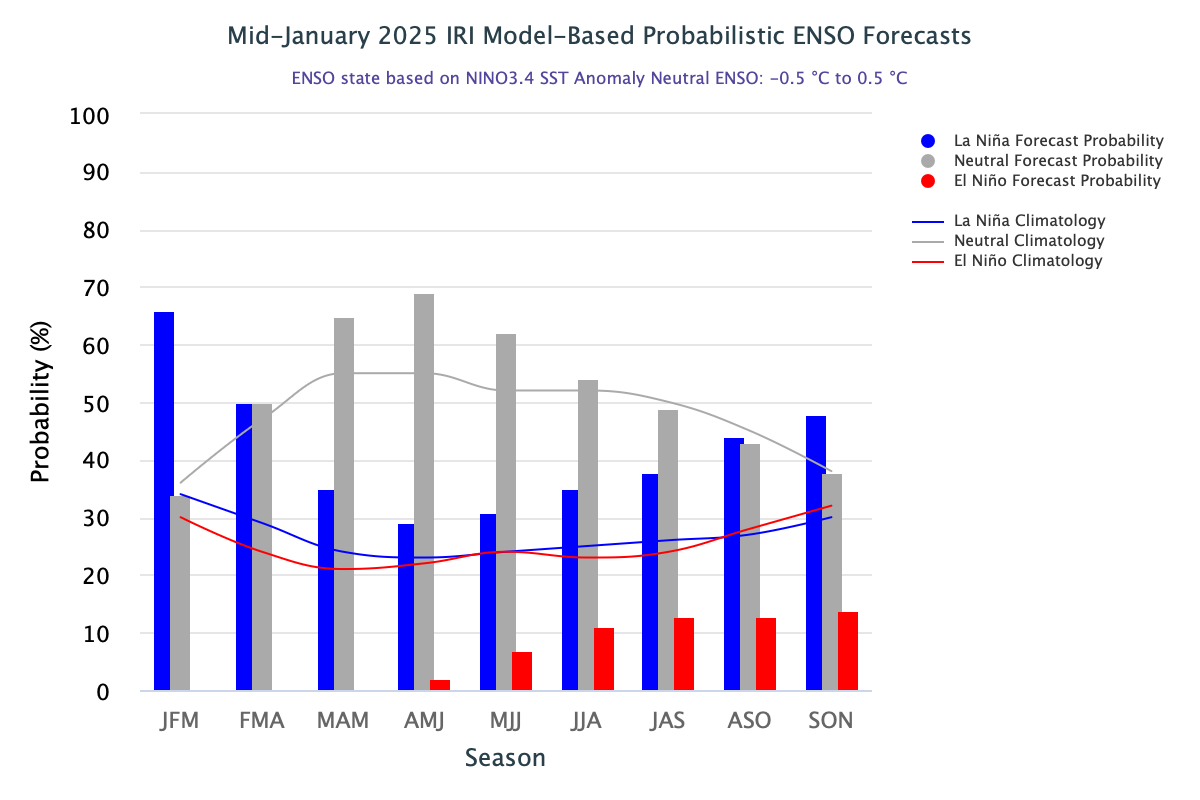
After many months of ENSO-neutral conditions, La Niña conditions emerged during January. These conditions will most likely be short-lived as there is a 60-70% probability of ENSO-neutral conditions emerging by spring 2025. NOAA monthly forecasts for February suggest an increased probability of above average precipitation for northern Utah and western Wyoming, above average temperatures for southeastern Utah and southwestern Colorado, and below average temperatures for northeastern Wyoming. NOAA seasonal forecasts for February-April suggest an increased probability of below average precipitation for the majority of the region, below average temperatures for northern and eastern Wyoming, and above average temperatures for southern Utah and southwestern Colorado.
Precip_Outlook_1.31.25
Precip_Seasonal_Outlook_1.16.25
Temp_Outlook_1.31.25
Temp_Seasonal_Outlook_1.16.25
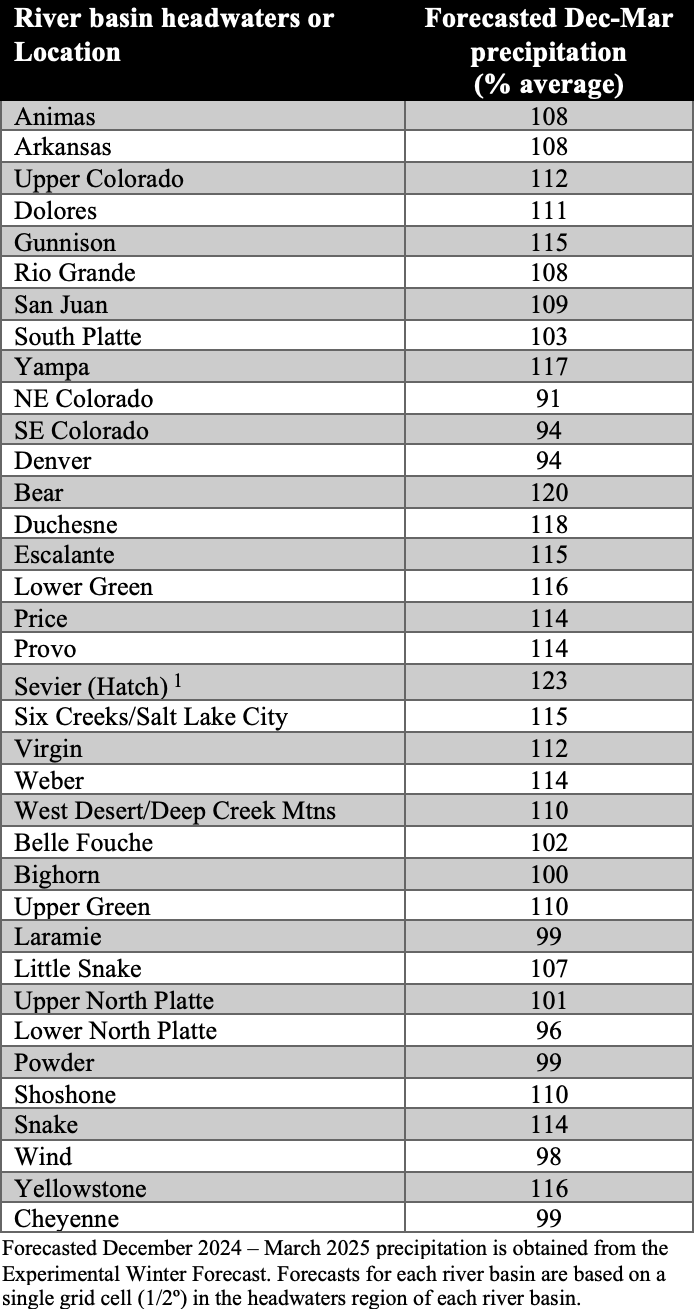
The new Experimental Winter Forecast predicts December-March precipitation in the western United States using Pacific and Atlantic Ocean temperatures. The most current forecast uses October-December ocean temperatures and indicates slightly above average winter precipitation for much of the region. The regional pattern of precipitation reflects average Pacific Ocean and warm Atlantic Ocean temperatures. Slightly above average winter precipitation is forecasted for most of the region with the highest precipitation relative to average in southern Utah and the lowest in central Wyoming and eastern Colorado.
ExpWinterForecast_020425
ExpWinterForecast_020425
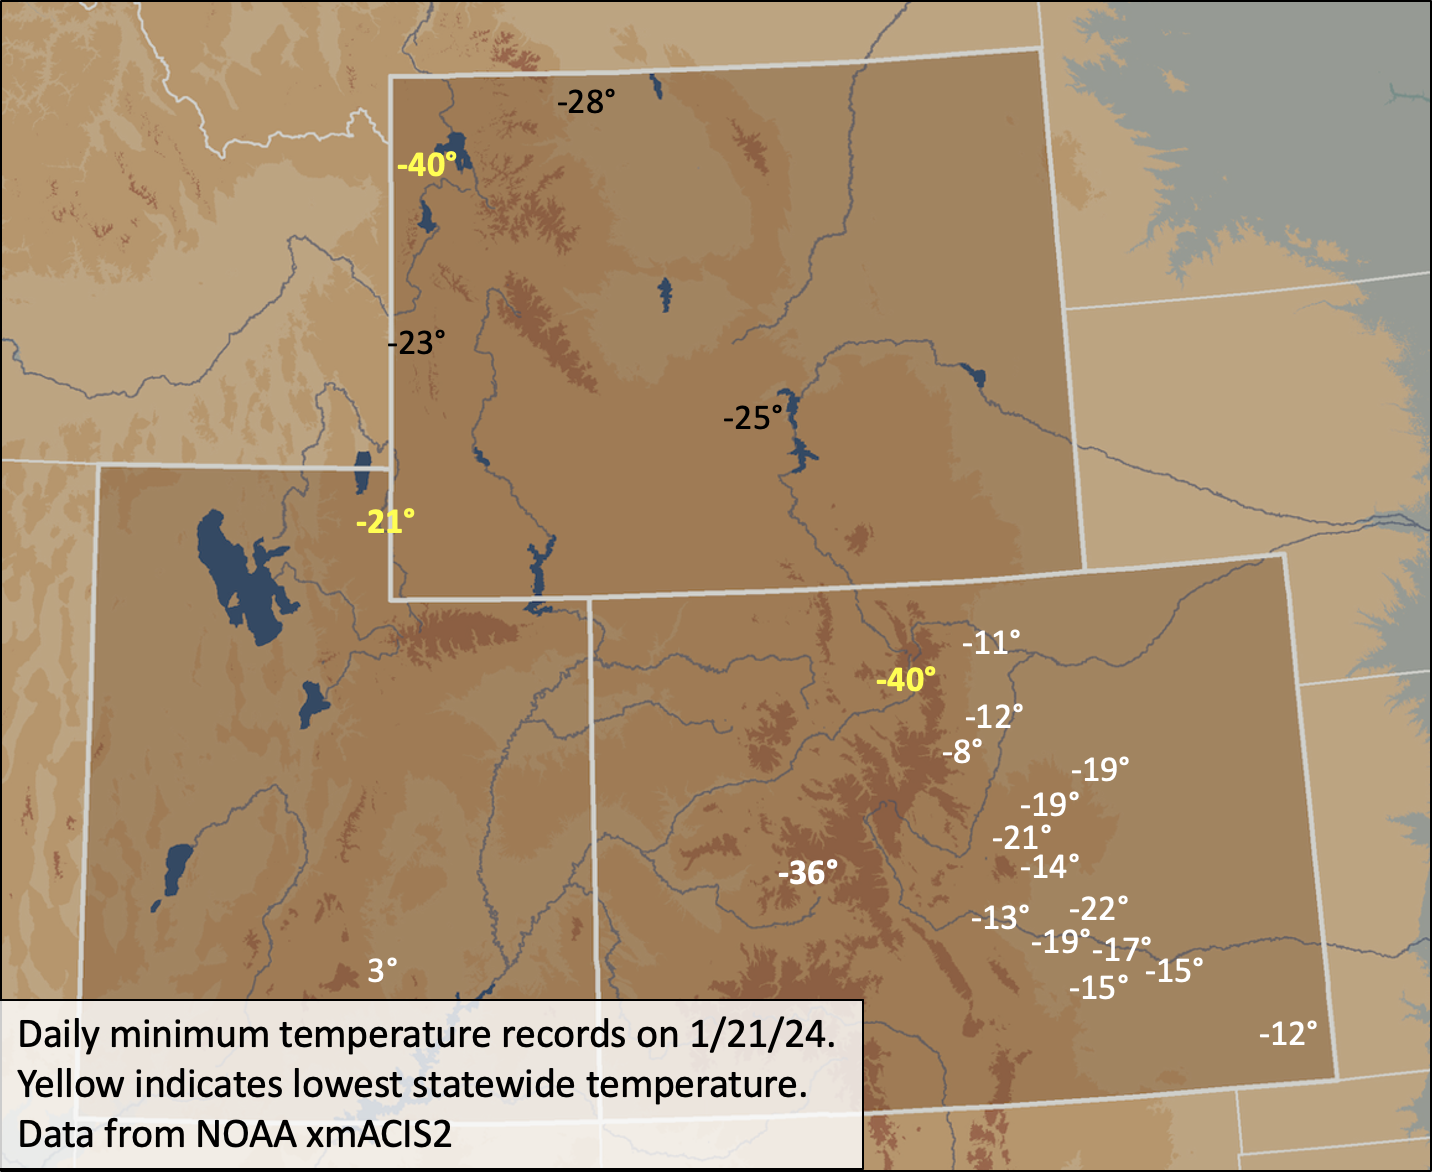
Significant weather event: Polar vortex descends on Intermountain West. A severe cold wave impacted the Intermountain West on January 19-23. Winter cold waves in temperate latitudes are sometimes referred to as a polar vortex. A polar vortex is an area of low pressure and cold temperatures that always occurs around the North and South Poles. During winter, the polar vortex periodically expands in size and covers more temperate latitudes; this is the source of a cold wave, or Arctic blast in the United States. The severity of the cold wave peaked on 1/20 and 1/21 in Wyoming and Colorado, with slightly warmer temperatures in Utah. Considering weather sites with at least 50 years of data, daily minimum temperature records were set at 9% and 17% of Colorado sites and 21% and 5% of Wyoming sites on 1/20 and 1/21. Daily minimum high-temperature records were set at 17% of Colorado sites on 1/20 and 30% of Colorado sites on 1/21. Temperatures were particularly cold in the lower Arkansas River valley with record daily minimum temperatures of -19ºF in Pueblo and -22ºF in Tacony, CO on 1/21. In Colorado, -40ºF was the coldest temperature of the event, observed at Harbison Meadow near Grand Lake. In Crested Butte, -36ºF was the coldest temperature recorded since 2011. The coldest temperature observed in Wyoming, while not a daily record, was a frigid -40ºF at Old Faithful in Yellowstone, the site’s coldest temperature since 2016. The cold wave was not as severe in Utah as a whole, but a unique site at Peter’s Sink in northern Utah bottomed out at -56.1ºF. In case you were wondering, the coldest recorded temperature in the Lower 48 was -69.7ºF at Rodger’s Pass Montana; the second coldest temperature recorded was at Utah’s Peter’s Sink where temperatures dipped to -69.3ºF in 1985. For the week surrounding the cold wave, average temperatures were 15ºF to 20ºF below normal for large parts of Colorado and Wyoming with small areas up to 25ºF below normal.
Click the link to read the global climate report for January on the NOAA website:
January Highlights:
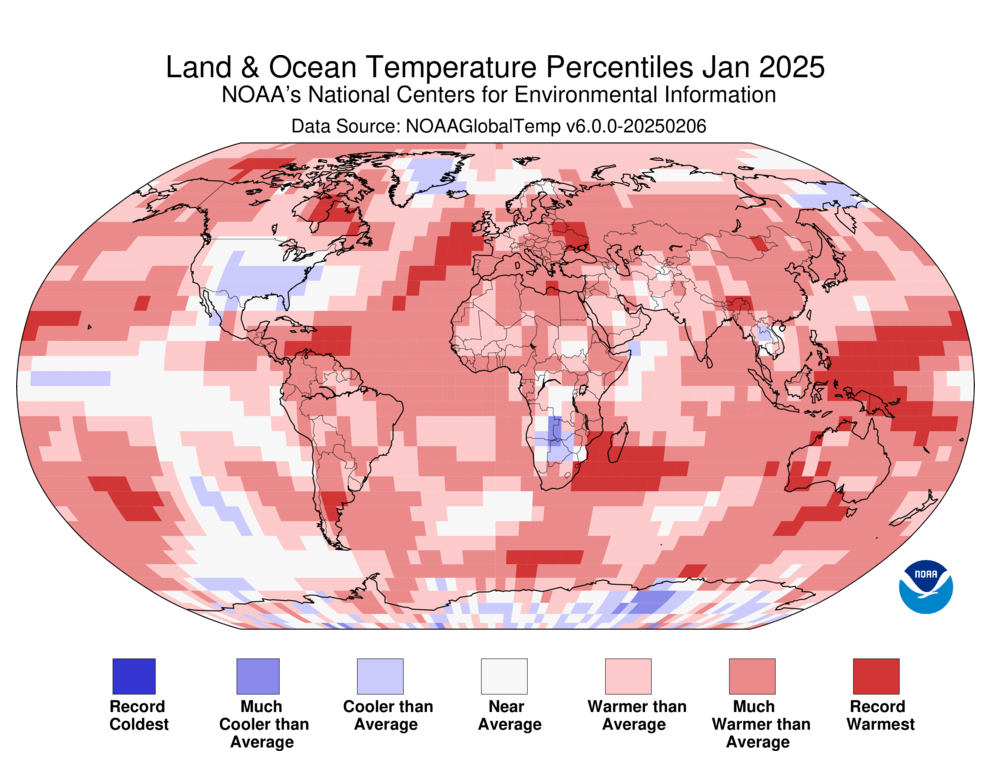
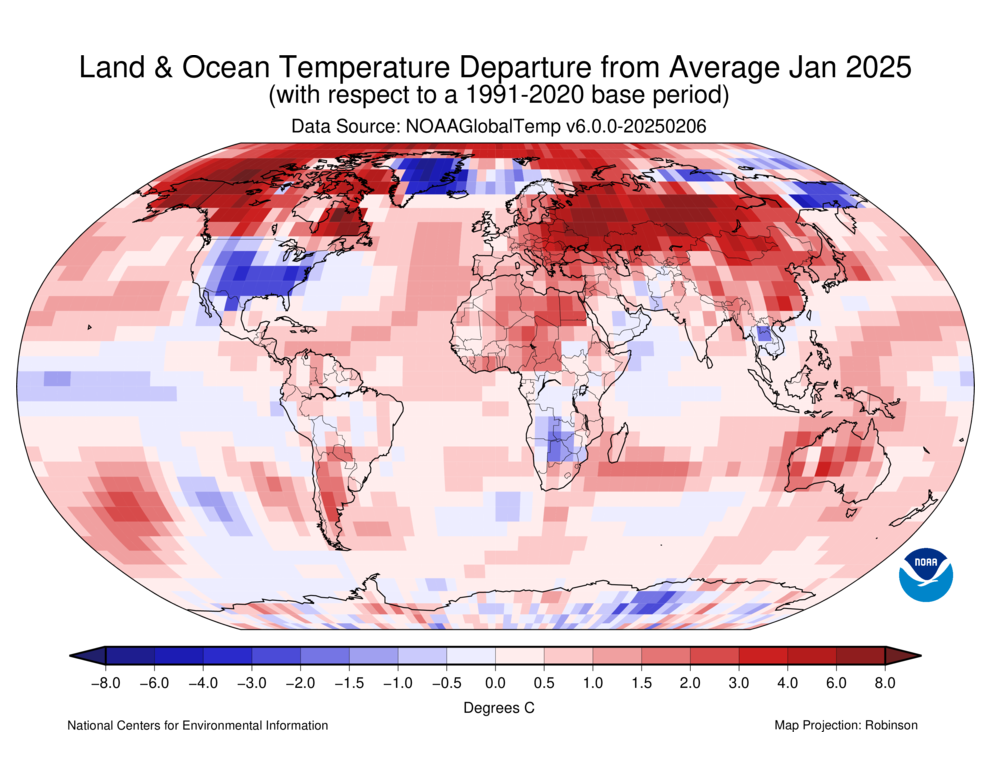
Temperatures were above average over much of the globe, but much below average over the United States, Greenland and far eastern Russia.
Eurasian snow cover extent and Arctic sea ice extent both ranked second lowest on record for January.
Global tropical cyclone activity was slightly below average with five named storms, three of which occurred in the Indian Ocean.
Temperature
The January global surface temperature was 2.39°F (1.33°C) above the 20th-century average of 53.6°F (12.0°C) and 0.05°F (0.03°C) above the previous record set last year, making last month the warmest January on record. According to NCEI’s Global Annual Temperature Outlook, there is a 7% chance that 2025 will rank as the warmest year on record.
The new January global record is particularly notable for having occurred during a La Niña episode, the cold phase of El Niño Southern Oscillation (ENSO). Global temperatures tend to be cooler during periods of ENSO-neutral conditions and even cooler during La Niña. According to NOAA’s Climate Prediction Center’s January 9 ENSO Diagnostic Discussion, La Niña conditions emerged in December 2024 and are expected to persist through February–April 2025 (59% chance), with a transition to ENSO-neutral likely during March–May 2025 (60% chance).
January temperatures were above average across much of the global land surface, particularly over Alaska, much of western Canada and most of central Eurasia. The United States, Greenland, far eastern Russia and parts of southern Africa and Antarctica were colder than average. Overall it was the warmest January on record over global land areas. Sea surface temperatures were above average over most areas, while much of the central and eastern tropical Pacific was below average (consistent with La Niña), as were parts of the southeast Pacific, western North Atlantic and the northwestern Indian Oceans. The global ocean was the second warmest on record for January.
Snow Cover
The Northern Hemisphere snow cover extent in January was the fourth lowest on record. While snow cover over North America and Greenland was slightly above average (by 80,000 square miles), Eurasia ranked second lowest on record (940,000 square miles below average). Areas of below-average snow cover stretched across most of Europe southeastward into central Asia.
Sea Ice
Global sea ice extent was the seventh smallest in the 47-year record at 6.89 million square miles, which was 1.17 million square miles below the 1991–2020 average. Arctic sea ice extent was below average (by 330,000 square miles), ranking second lowest on record, and Antarctic extent was slightly below average (by 130,000 square miles).
Tropical Cyclones
Five named storms occurred across the globe in January, which was below the average of seven. Three named storms formed in the southwestern Indian Ocean, the most impactful being Intense Tropical Cyclone Dikeledi, which made landfall on Madagascar and Mozambique, bringing high winds and heavy rains to the affected regions.
An annotated map of the world plotted with the most significant climate events of January 2025. See the story below as well as the report summary from NOAA NCEI at http://bit.ly/Global202501offsite link. (Image credit: NOAA/NCEI)
Synopsis: La Niña conditions are expected to persist in the near-term, with a transition to ENSO-neutral likely during March-May 2025 (66% chance).
La Niña conditions continued this past month, as indicated by the below-average sea surface temperatures (SSTs) across the central and east-central equatorial Pacific Ocean. The latest weekly indices were -0.6°C in Niño-3.4 and -0.9°C in Niño-4, with values close to zero in Niño-1+2 and Niño-3. Below-average subsurface temperatures persisted, with below-average temperatures dominating the central and eastern equatorial Pacific Ocean. Low-level wind anomalies remained easterly over the western and central Pacific, while upper-level wind anomalies were westerly over the central Pacific. Convection was suppressed over the Date Line and western Pacific and was enhanced over Indonesia. The traditional and equatorial Southern Oscillation indices were positive. Collectively, the coupled ocean-atmosphere system indicated La Niña conditions.
The IRI multi-model average predicts weak La Niña conditions to continue through February-April 2025 and then transition to ENSO-neutral. The IRI dynamical model average and several of the models from the North American Multi-Model Ensemble (NMME) predict an earlier transition to ENSO-neutral in January-March 2025. The forecast team favors a weak La Niña through February-April, but there is also a 41% chance of ENSO-neutral emerging in this season. A weak La Niña is less likely to result in conventional winter/spring impacts, though predictable signals can still influence the forecast guidance (e.g., CPC’s seasonal outlooks). In summary, La Niña conditions are expected to persist in the near-term, with a transition to ENSO-neutral likely during March-May 2025 (66% chance).
…lackluster January precipitation led snowpack to decline in those states. Last month, snow levels above Lake Powell were 94% of average. As of Feb. 6, snowpack fell to 83% of normal above Lake Powell…At the start of January, hydrologists predicted that spring runoff into Lake Powell between April and July would be 81% of average. Forecasters now expect runoff into the second largest reservoir in the U.S. to be just 67% of normal…The Upper Basin’s snow season is 65% complete as of Feb. 1. But the next month could bring relief, forecasters said. Lake Powell water levels have rebounded more than 40 feet since hitting a record low in 2023. The reservoir currently sits at roughly 34% full, or 3,566 feet above sea level.
Westwide SNOTE basin-filled map February 13, 2025 via the NRCS.