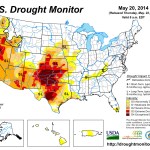
Click on a thumbnail graphic for a gallery of drought data from the US Drought Monitor. Click here to go to the US Drought Monitor website. Here’s an excerpt:
Summary
This US Drought Monitor week was dominated by a weather system that moved across the Southern Plains and Midwest and through the South and Mid-Atlantic. The system brought damaging wind and hail throughout the impacted area and tornadoes in the Southeast and Mid-Atlantic. Widespread areas of three to four inches of precipitation fell while areas of eastern Texas received over seven inches…
The Plains
Locally heavy rain came to the South early in the Drought Monitor week. Areas of Texas, Louisiana and Arkansas benefitted. Areas of Abnormal Dryness (D0) were removed from southern and eastern Texas, northern Louisiana into southern Arkansas, and northern Arkansas into southern Missouri. Mounting deficits saw degradation of drought conditions in western and central Texas. Areas of Exceptional Drought (D4) expanded in central Texas where lake and stream levels are exceptionally low, water supplies are dwindling, and water restrictions are the norm. With some places going months without appreciable precipitation, degradation was in line in most locations in Oklahoma, with the exception of the extreme southeast part of the state. Areas of Exceptional (D4), Extreme (D3), Severe (D2), and Moderate Drought (D1) and Abnormal Dryness (D0) expanded eastward this week in Oklahoma…
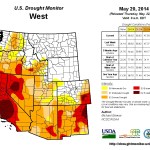
The West
Conditions remain very dry across the West as much of the West moves into its dry season. Areas of Extreme Drought (D3) expanded in western and eastern New Mexico, as did Exceptional Drought (D4) in eastern New Mexico as precipitation deficits mount. The state overall experienced its seventh driest Year-to-Date (January to April) and 12th driest Water Year (October 2013 – April 2014) on record. The rest of the West remained unchanged.
Wildfires remain a problem in parts of the West. According to the US Forest Service, the current large incidents are all in California, Arizona, and New Mexico. The fires around San Diego, CA resulted in at least one death, approximately 125,000 evacuees, and millions of dollars in property damage. So far this year nationwide, there have been 22,863 fires that have burned 471,875 acres which is below the 10-year average (2004 – 2014 average, year to date, is 27,895 fires and 1,053,217 acres according to the National Interagency Fire Center)…
Looking Ahead
During the May 21-26, 2014 time period, precipitation is expected across the Plains, from South Dakota to northern Texas, and into eastern Colorado and Wyoming. Additional precipitation is expected around the Great Lakes and into the Mid-Atlantic and Northeast. Precipitation is estimated to approach two inches in select locations during this time period. At the same time, below normal temperatures are expected in the Southwest, east of the Rockies and into the Southern Plains. Above normal temperatures are expected along the West Coast, through the Central US, and into the Southeast.
For the ensuing 5 days (May 27-31, 2014), the odds favor normal to above-normal temperatures across the entire contiguous US and southern Alaska, with the exception of the western Gulf Coast. Below-normal temperatures are favored in northern Alaska and along the aforementioned area around the Gulf of Mexico. Above-normal precipitation is likely across the Eastern half of the US and in the far Northern Plains and northern Alaska. Below-normal precipitation is expected in the Southern Plains, the Pacific Northwest, as well as in southern Alaska.
A record-setting drought grips the United States, and the foremost tool for measuring its severity is the U.S. Drought Monitor, a weekly national assessment of moisture levels written by 10 federal and academic scientists. Led by the National Drought Mitigation Center, the Monitor is a collaboration that includes the U.S. Department of Agriculture, the National Oceanic and Atmospheric Administration (NOAA), and experts around the country. The Monitor’s slowly shifting galaxy of red and orange warning splashes is regularly cited on the Weather Channel and in Corn Belt newspapers. Federal agencies use it to make disaster determinations.
The latest Drought Monitor, released on July 19, revealed that drought has been declared for 63 percent of the contiguous U.S., a larger area of the country affected by pervasively dry weather than any time since 1956. All of this means that Mark Svoboda — a climatologist at the National Drought Mitigation Center in Lincoln, Nebraska, and one of the writers of the Drought Monitor — is a busy man.
“This is my fifteenth interview today,” he told Circle of Blue near the end of office hours on a mid-July afternoon…
“No one person could do this job,” Svoboda said with a laugh. “I’d give them a month on it before they’d lose their sanity.”
Writing the Monitor, which publishes every Thursday, is demanding extracurricular work, requiring its authors to consider oodles of data, attend conference calls, and be the arbiter of classification disputes. That is why scientists from the three collaborating agencies take a two-week rotation at the helm.
When he is in charge, Svoboda looks at 50 to 75 data sets — data on streamflow, reservoir levels, soil moisture, precipitation, and vegetation — before submitting a first draft on Monday. The draft is circulated through a protected email list-serve comprising more than 350 experts from around the country.
List members are “our eyes and ears on the ground,” Svoboda said, and they will bandy recommendations and offer first-hand observations.
“The local people bring a lot more to the table than me trying to cover 50 states in two days,” said Svoboda, who will post revisions on Tuesday and Wednesday mornings, each iteration going through another round of criticism.
When the Drought Monitor began in 1999, it was rather rudimentary, an experimental product that was suddenly and unexpectedly expedited. You see, a drought that summer hung over the nation’s capital, said Svoboda, and policymakers, seeing the effects themselves, wanted better information quickly.
“At first, we were thinking this would be a quarterly or monthly thing,” said Svoboda, who has been on the writing team since the beginning. “But then the drought hit the Northeast and Washington, D.C., and NOAA administrators said ‘You’ll do this weekly, starting in six weeks.’”[…]
Understanding the scale is essential to understanding the Drought Monitor. The categories are based on the question ‘How rare is this event?’ Moderate drought, a D1, means that conditions happen on average once every five to 10 years. At the top end, a D4 ranges from a once-in-50-years event to a record-setting drought.
The designations refer to local conditions. So, a D2 in Georgia and a D2 in Arizona do not mean that the hydrology is similar; rather, it means that the current conditions in each state are occurring there with the same historical frequency.
Because the Monitor pulls in data from multiple indices, in addition to gleaning in-person observations, assigning a drought classification is never as simple as just looking at the numbers. The National Drought Mitigation Center says that the Monitor is a blend of art and science — that was certainly on display during one of the regional climate discussions that Circle of Blue sat in on earlier this week…
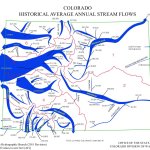
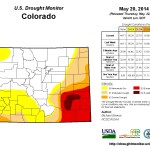
On Tuesday morning, 26 people dialed into the weekly drought assessment conference call for the Upper Colorado River Basin (which ended up covering the entire state of Colorado). The author of this week’s Drought Monitor, Richard Heim of the National Climatic Data Center, was on the line and the half-hour discussion would inform his report.
After various experts presented recent data on precipitation, streamflow, soil moisture, evapotranspiration, and reservoir levels, the debate centered on two points: whether to expand an area of D4 in southeastern Colorado and whether to downgrade a D4 zone in the Yampa River Basin.
“We’ve had several ranches near Pueblo that liquidated their herds in the last week,” said Chuck Hanagan, describing what he saw in Otero and Crowley counties. Hanagan works for the USDA’s Farm Service Agency in southeastern Colorado.
“Our grass is dormant,” Hanagan said later in the day during an interview with Circle of Blue. “It is not growing. We got a couple inches of rain last week, but you can’t even tell. The cattle should be grazing right now, but ranchers are already using hay.”
Hanagan said the value of the Drought Monitor comes from these interactions that allow the instrumental data to be validated and augmented by people working in the field. It gives the scientific observation a “ground-truth,” as he put it…
When the discussion moved to the Yampa, a National Weather Service meteorologist based in Pueblo, Colorado, said that he would like to see the D4 dropped down to a D3. Some rain had fallen recently, and he did not believe D4 was warranted. Other observers, however, said the situation was so tenuous that if more rain did not come in the next week, circumstances would flip again.
In the end, the group recommended the status quo, though this week’s Drought Monitor author had the final say. “We’ll leave it up to Richard Heim,” said the call moderator, “But we’re leaning toward waiting a week and seeing if those rains come.” For southeastern Colorado, the group recommended a slight expansion of the D4 area…
These kinds of debates may seem trivial, like baseball scorekeepers arguing a hit versus an error, but the designations do matter — for drought scientists and regular Joes, alike.
Just last week the USDA revised its disaster declaration process. Any U.S. county in a D2 drought for more than eight consecutive weeks is declared a primary disaster area, which makes farmers eligible for low-interest loans. As soon as a county gets a D3 drought label, it is immediately declared a disaster area. The department also makes it easier for areas in D2 or D3 to get a waiver for developing farmland placed in a conservation reserve.