

Statewide snowpack map May 21, 2015 via the NRCS

Arkansas River Basin High/Low graph May 21, 2015 via the NRCS

Upper Colorado River Basin High/Low graph May 21, 2015 via the NRCS

Gunnison River Basin High/Low graph May 21, 2015 via the NRCS

Laramie and North Platte Basin High/Low graph May 21, 2015 via the NRCS

Upper Rio Grande River Basin High/Low graph May 21, 2015 via the NRCS

San Miguel, Dolores, Animas, and San Juan Basin High/Low graph May 21, 2015 via the NRCS

South Platte River Basin High/Low graph May 21, 2015 via the NRCS

Yampa and White Basin High/Low graph May 21, 2015 via the NRCS
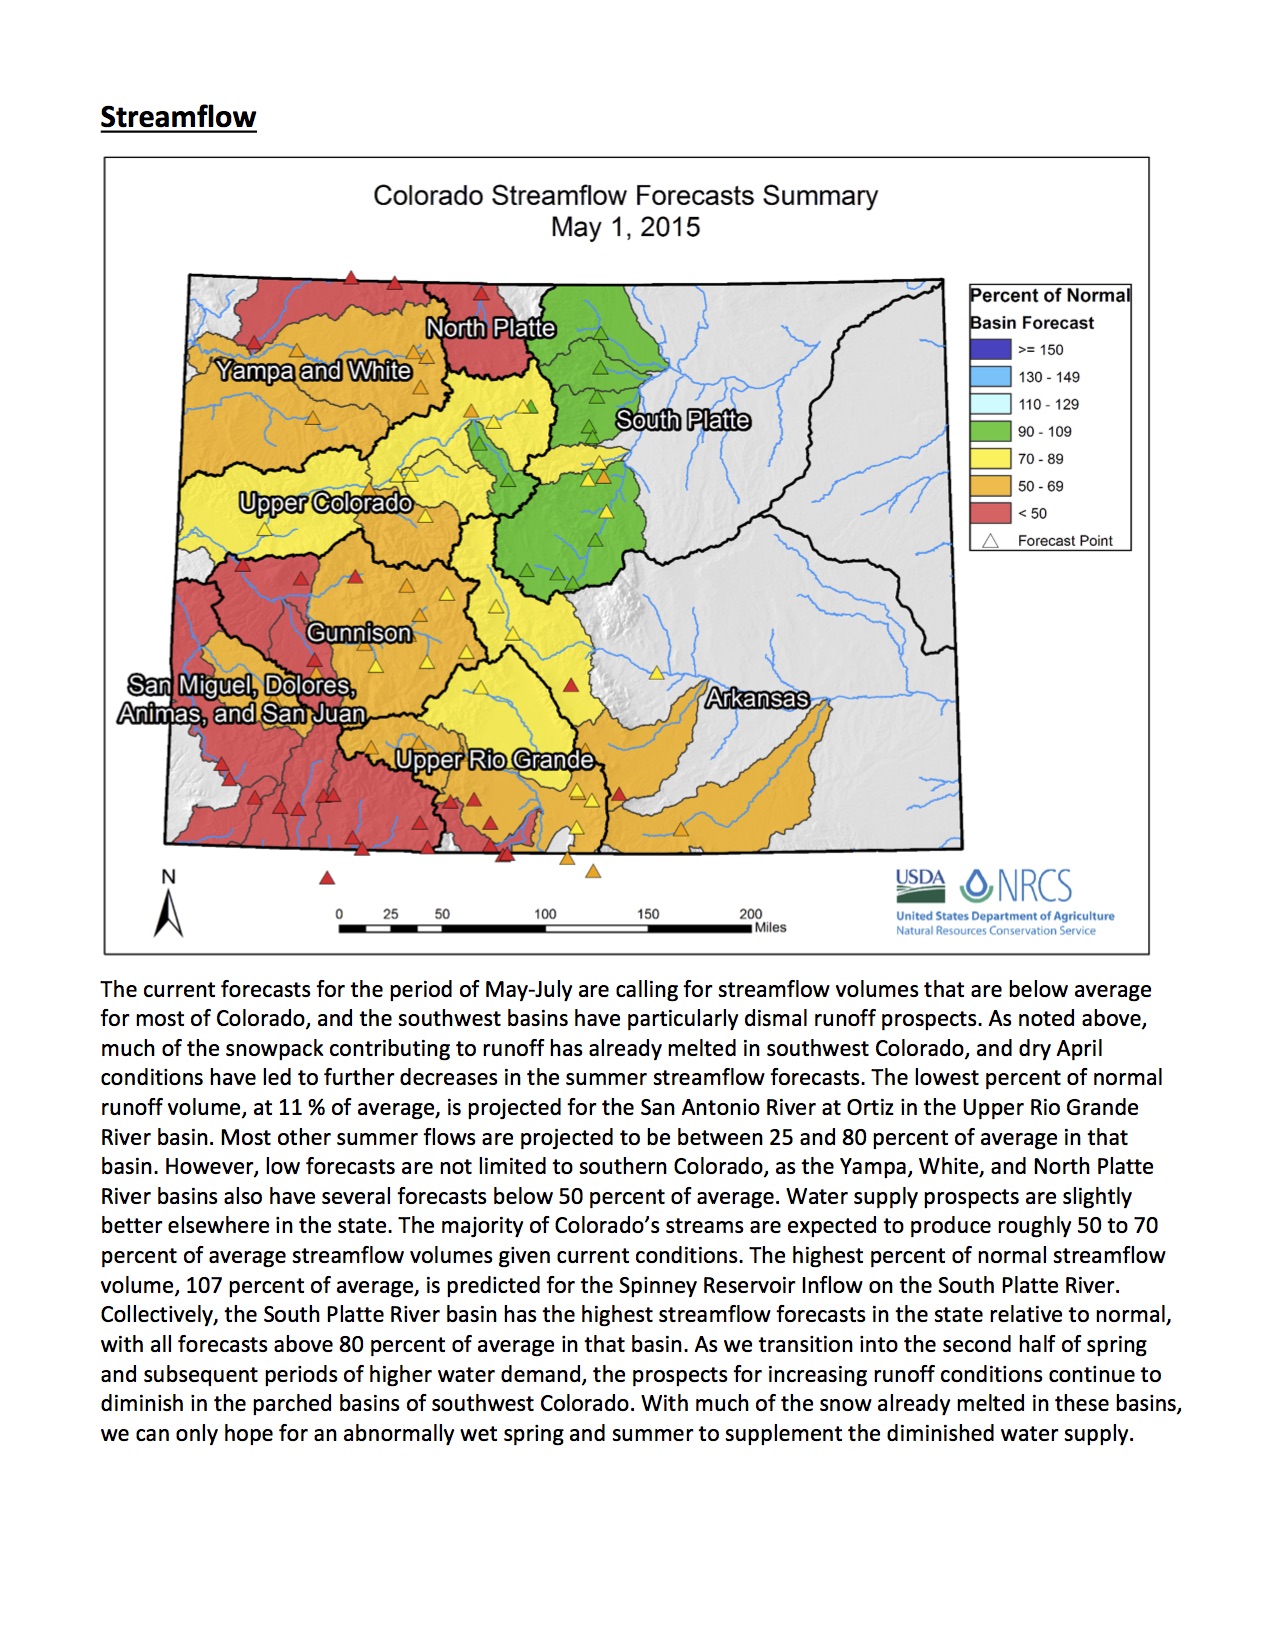
Check out the Basin High/Low graph for your favorite basin to see how much snow water equivalent is left. There will be a new streamflow forecast for Colorado released week after next. Below is the streamflow forecast from May 1.
Hi,
Thanks as always for your tireless work. I would be interested in seeing a primer post from you explaining why “% of normal is misleading after runoff starts.”
You’ve mentioned this a few times in your posts, but I am unclear about why.
Thanks! Gunnar Paulsen
Good suggestion, and thanks for commenting.
Here you go:
https://coyotegulch.wordpress.com/2015/05/23/the-case-that-of-normal-can-be-misleading-after-runoff-starts/
John Orr
http://coyotegulch.net/