Water court referee finds it ‘lawful’ to issue a water right to grow pot

The High Valley Farms marijuana cultivation facility near Basalt.

By Brent Gardner-Smith, Aspen Journalism

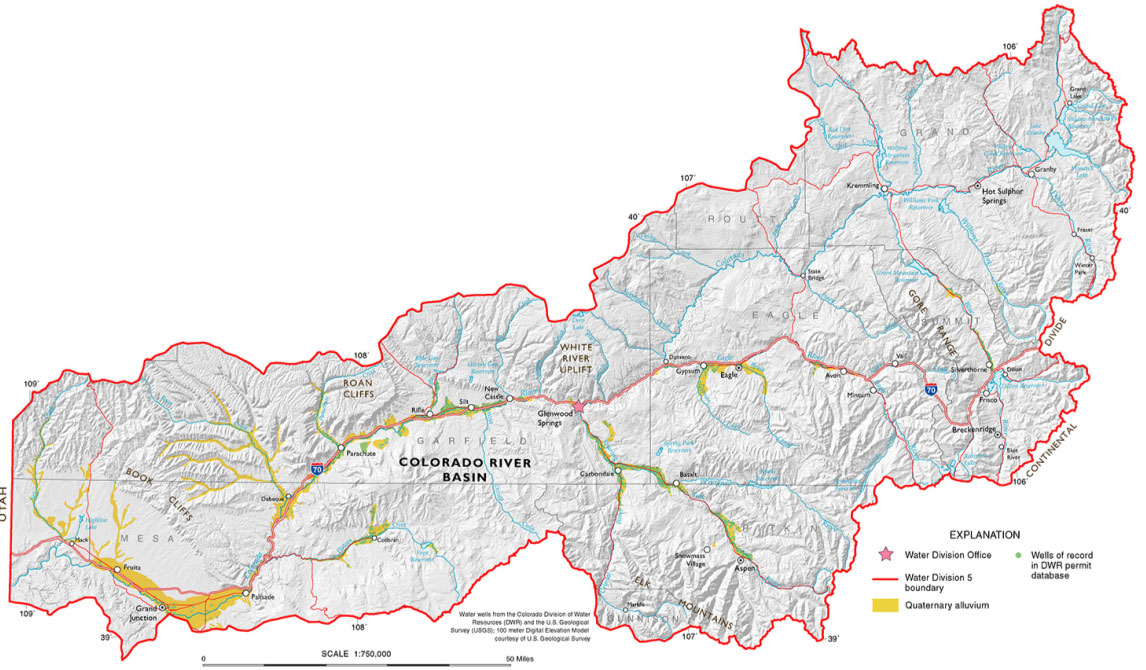
GLENWOOD SPRINGS – The water referee in Division 5 Water Court in Glenwood Springs, in a case involving a major marijuana grow operation in the midvalley, has found that Colorado courts can lawfully issue a new water right specifically to grow the plant, even though it’s still illegal to grow pot under federal law.

“The fact that the Controlled Substances Act [CSA] prohibits marijuana use does not make an otherwise lawful appropriation of water under Colorado law illegal,” wrote Susan Ryan, the water referee, in Friday’s order on High Valley Farms, the grow site for Aspen’s Silverpeak Apothecary. “Instead, the validity of the appropriation is governed by Colorado water laws.”

Ryan’s 12-page order found that the actual legal process of the state issuing a water right to grow pot does not conflict with federal law, even though the watering itself of cannabis plants still may be in conflict.

“Establishing a valid appropriation does not require an analysis of the legality of the subsequent use of the water right,” Ryan’s order says. “Because water-right appropriations are governed exclusively by Colorado law, there is no conflicting provision in the CSA.”

With the order, High Valley Farms LLC is able to continue to pursue its application for a new water right to irrigate marijuana, and a novel question under Colorado water law has been answered.

Ryan’s order is the most detailed articulation to date of the state’s position on the question of whether a new water right specifically to irrigate marijuana can be issued, although it applies only to Division 5.

And it’s possible that a water court referee or judge in another water court division could issue a differing opinion should the question arise in other ongoing cases. The Colorado Supreme Court might have to eventually sort out opposing views.

Rhonda Bazil, the Aspen-based water attorney for High Valley Farms, declined to comment on the order, as did Jordan Lewis, the owner of both High Valley Farms and the Silverpeak marijuana store in downtown Aspen.

A graphic from High Valley Farms showing the location of the facility and water sources.

Posing the question

Ryan, the water referee, recently took her position in the water court in Glenwood Springs after working as a water attorney in private practice at a law firm in Denver. She found herself having to rule on a question that had been posed in August 2015 by the preceding water referee, Holly Strablizky, who is also an attorney and now works for Eagle County, and state division engineer Alan Martellaro, who is based in Glenwood.

Strablizky and Matellaro jointly reviewed the 2014 water rights application from High Valley Farms, in which it openly told the water court it was seeking a water right to irrigate up to 3,000 marijuana plants in a facility near Basalt.

After amending its original application, High Valley Farms is now seeking the right to use 9.24 acre-feet of water a year from the Roaring Fork River and an existing well on the site.

After their joint review of the water rights application, the water referee and the division engineer issued a customary “summary of consultation.” In it, they posed a question to the court: Is it OK to issue a water right in Colorado specifically to grow pot, which is still an illegal act under federal law?

The question, however, was not stated in such plain terms.

“The application must explain how the claim for these conditional water rights can be granted in light of the definition of beneficial use as defined [under state law],” the summary of consultation says. “Specifically, beneficial use means the ‘use of that amount of water that is reasonable and appropriate under reasonably efficient practices to accomplish without waste the purpose for which the appropriation is lawfully made.’”

In the summary of consultation, the officials put the word “lawfully” in italics.

An underground water tank, poised to be buried, next to the High Valley Farms grow facility in Basalt in February 2016.

Answering the question

Ryan, in the Friday order, reframed the question from the summary of consultation in more direct terms.

“The issue before the court is whether High Valley can lawfully appropriate water to cultivate marijuana and for use in its greenhouse facilities in light of the federal Controlled Substances Act, which prohibits all marijuana use,” Ryan wrote. “Whether High Valley can seek to appropriate water for marijuana cultivation is a threshold issue in this case. To resolve this issue, the court must determine how ‘lawful’ is used in the water law statutes and if there is a conflict between those statutes and the CSA.”

After digging into the issue, Ryan determined that the “lawfully” in question does not pertain to the end use of the water, but to the legal framework and process that allows the water right itself to be granted.

In explaining her conclusion, she focused on two words, “lawfully made,” and not just on the word “lawfully” that had been emphasized in the summary of consultation.

“In this provision ‘lawfully made’ is closer to the word ‘appropriation’ than the word ‘use,’” Ryan wrote, turning to the “principles of statutory construction,” or the actual words used in a given law, for guidance.

The term “lawfully made,” she concluded, “modifies appropriation, not use.”

“The water court must determine whether the claimed appropriation is lawful, not whether the claimed beneficial use is lawful,” Ryan concluded. “A lawful appropriation of water does not require an analysis of the lawfulness of the subsequent use of that water.”

A view of the High Valley Farms marijuana-growing facility near Basalt. High Valley Farms LLC has applied for a water right specifically to grow marijuana.

No conflict with federal law

Ryan also found there was no conflict between state and federal laws in creating the High Valley Farms water right, which was a key concern in the case.

“There is no federal law that prohibits the appropriation of unappropriated water, if that appropriation is done in compliance with state law or lawfully,” she wrote.

As part of her finding, Ryan cited two other recent decisions by the Colorado Supreme Court that centered on conflicts between Colorado and federal law relating to marijuana, Coats v. Dish Network, LLC, which concerned an employee using medical marijuana, and People v. Crouse, which dealt with law enforcement officers having to return confiscated marijuana.

In both cases, there was a direct conflict between federal and state laws, and federal law prevailed.

“In contrast to the facts in those cases, there is no federal water law that governs the appropriation of water from intrastate water sources,” Ryan wrote. “The regulation and allocation of a state’s internal water resources has been expressly delegated to the states by the federal government. There is no way to determine whether an appropriation is lawful under federal law. Thus, lawful appropriation means lawful under Colorado water law.”

Ryan did recognize the federal government’s ability to overrule Colorado’s pot laws via the federal Supremacy Clause, but said applying federal law to marijuana would pertain to possessing and using marijuana, not to the “lawful appropriation” of water.

“If the federal government decides to enforce the CSA’s provisions, the Supremacy Clause would apply, and federal law trumps Colorado state law allowing the possession and use of marijuana,” Ryan wrote. “However, this does not change the analysis of whether a lawful appropriation is made under Colorado water law.”

A sign, and a statue, outside of the SIlverpeak marijuana store in downtown Aspen.

Will it stand?

Ryan’s order could be challenged and referred to the Division 5 water court judge, James Boyd, by one of the three other parties in the case, each of whom owns property near the High Valley Farm facility: the Roaring Fork Club; WCAT Properties, LLC; and the Spencer D. Armour III 2012 Trust.

But Jason Groves, a water attorney at Patrick, Miller and Noto of Aspen and Basalt, who represents all three opposing parties in the case along with his colleague at the firm, Scott Miller, said their clients are focused on the amount of water proposed by High Valley Farms, and not the marijuana question. As such, they do not plan on challenging the order.

“The current objectors in the case, which we represent, have no concerns about the beneficial use question raised in the summary of consultation,” Groves said. “Our concerns are on the amount of water they propose to use, which is nearly a four-fold increase in use from the existing well on the property.”

It is also possible that another party could file a motion to intervene in the case and contest the referee’s order, but so far no other person or entity has indicated they are inclined to take such action.

Please see related stories:

Sept. 7, 2016
Hazy legal question lingers over rights for Basalt marijuana facility

Feb. 8, 2016
Basalt water case could affect states pot industry

Jan. 2, 2015
Can Colorado approve a water right to grow pot?

Oct. 14, 2014
Silverpeak owner applies for water rights for pot greenhouse near Basalt

Editor’s note: Aspen Journalism, the Aspen Daily News and Coyote Gulch are collaborating on the coverage of rivers and water. The Daily News published this story on Tuesday, Feb. 21, 2017.

Big Johnson Reservoir outlet works repair update

Big Johnson Reservoir via Dan Aquino

From The Colorado Springs Gazette (Matt Steiner):

The diminishing water level in the 280-acre lake south of the Colorado Springs Airport is intentional. Gary Steen, manager of the Fountain Mutual Irrigation Company that owns the Big Johnson, said Tuesday morning that his company has been draining the reservoir since the summer of 2016 and preparing to repair three outlet gates…

The irrigation company typically fills the reservoir in the fall and winter months before the irrigation season begins in early April. Steen said crews have been building a bypass pipeline for the last few weeks and will finish the work prior to April 1.

When Fountain Mutual built the reservoir in 1910, it took control of a water storage decree that dates back to 1903, Steen said. That decree allows the company to store up to 10,000-acre feet of water in the lake. But, according to Steen, sediment in the reservoir has diminished its capacity over the years to about 5,000-acre feet.

@NOAAClimtate: Unprecedented Arctic weather has scientists on edge

Click here to read the article:

As station chief at NOAA’s Point Barrow, Alaska, observatory, Bryan Thomas works close to the edge of the Arctic Ocean. What he saw from his office in early February, looking north toward the horizon, was troubling.

Unconsolidated sea ice January 39,, 2017 off Barrow, Alaska. Photo credit NOAA.

“I could see what’s known as water-skyoffsite link — the reflection of dark water on clouds on the horizon,” Thomas said. “From land, you can maybe see 10 miles, and the clouds were telling us that somewhere in that distance there was open water.”

Normally, there would be unbroken sea ice for hundreds of miles.

“Here we are in February, when we expect maximum sea ice extent,” Thomas added. “This might be all we’re going to get.”

Arctic sea-ice concentration for the week ending February 12, 2017. The gold line shows the historic median extent for the month, showing how far behind this year’s ice cover is. Map image based on NASA and NOAA satellite data provided by NSIDC. Check out this animation of weekly Arctic sea-ice concentration from Sep. 6, 2016, through Feb. 12, 2017, which shows how sluggish ice growth has been this winter. (NOAA/climate.gov)

The Arctic’s new abnormal
It’s a time of tumult in the Arctic, with record temperatures and extraordinary sea-ice conditions now becoming the norm. For starters:

  • Sea ice observed in January in the Arctic was the lowest in the 38 years of satellite recordoffsite links and 100,000 square miles less than 2016. That’s equivalent to the size of Colorado.
  • The average temperature of 4.4 degrees F in Barrow, Alaska, from November 2016 through January 2017 shattered the old record of 0 degrees set between 1929 and 1930. From 1921 to 2015, the average November-to-January temperature in Barrow was -7.9 degrees F.
  • Temperatures in the Arctic for the calendar year 2016 were by far the highest since 1900. Each of the past four years was among the top 10 warmest on record.

The late and faltering formation of sea ice this winter is one of many signs of extraordinary change in the Arctic, said Mark Serreze, director of the National Snow and Ice Data Center. He added that repeated surges of extremely warm air have stunted the growth of sea ice during fall and winter.

This graphic depicts the record low winter sea-ice extent in 2016-2017 (blue), compared with the previous record set in 2011-2012 (dotted line) and the 1981-2010 average (gray line). The light gray bar captures 95 percent of the observed natural range of variability from the average during that period. (National Snow and Ice Data Center)

Melt season is dead ahead, and it’s not looking good
Will 2017 set a record for the least amount of sea ice ever recorded at winter’s end? Serreze said it’s probably a given: “We’re starting melt season on very, very bad footing.offsite link”

What’s happening in the Arctic isn’t staying in the Arctic, added Richard Thoman, a meteorologist for NOAA’s National Weather Service Alaska Region. Profound changes are coming to the state’s interior as well.

“This winter was cold by today’s climate standards,” Thoman said. “By historic standards, it was completely uninteresting. I’m ready to say beyond any doubt that interior Alaska simply does not experience the temperatures it did in the past. “

The rapid changes are bewildering, even to scientists who’ve studied it for decades.

“We knew the Arctic would be the place we’d see the effects of climate change first, but what’s happened over the last couple of years has rattled the science community to its core,” Serreze said. “Things are happening so fast, we’re having trouble keeping up with it. We’ve never seen anything like this before.”

From the World Meteorological Organization:

The extended spell of high global temperatures is continuing, with the Arctic witnessing exceptional warmth and – as a result – record low Arctic sea ice volumes for this time of year. Antarctic sea ice extent is also the lowest on record.

Reports from the U.S. National Oceanic and Atmospheric Administration and NASA’s Goddard Institute for Space Studies said that global average surface temperatures for the month of January were the third highest on record, after January 2016 and January 2007. NOAA said that the average temperature was 0.88°C above the 20th century average of 12°C. The European Centre for Medium Range Weather Forecasts, Copernicus Climate Change Service, said it was the second warmest.

Natural climate variability – such as El Niño and La Niña – mean that the globe will not break new temperature records every month or every year. More significant than the individual monthly rankings is the long-term trend of rising temperatures and climate change indicators such as CO2 concentrations (406.13 parts per million at the benchmark Mauna Loa Observatory in January compared to 402.52 ppm in January 2016, according to NOAA’s Earth Systems Research Laboratory).

The largest positive temperature departures from average in January were seen across the eastern half of the contiguous U.S.A, Canada, and in particular the Arctic. The high Arctic temperatures also persisted in the early part of February.

At least three times so far this winter, the Arctic has witnessed the Polar equivalent of a heatwave, with powerful Atlantic storms driving an influx of warm, moist air and increasing temperatures to near freezing point. The temperature in the Arctic archipelago of Svalbard, north of Norway, topped 4.1°C on 7 February. The world’s northernmost land station, Kap Jessup on the tip of Greenland, swung from -22°C to +2°C in 12 hours between 9 and 10 February, according to the Danish Meterological Institute.

“Temperatures in the Arctic are quite remarkable and very alarming,” said World Climate Research Programme Director David Carlson. “The rate of change in the Arctic and resulting shifts in wider atmospheric circulation patterns, which affect weather in other parts of the world, are pushing climate science to its limits.”

As a result of waves in the jet stream – the fast moving band of air which helps regulate temperatures – much of Europe, the Arabian peninsular and North Africa were unusually cold, as were parts of Siberia and the western USA.

Antarctic sea ice extent February 5, 2017 via the National Snow & Ice Data Center.
Arctic sea ice extent January 2017 via the National Snow & Ice Data Center.

Sea ice extent was the lowest on the 38-year-old satellite record for the month of January, both at the Arctic and Antarctic, according to both the U.S. National Snow and Ice Data Center and Germany’s Sea ice Portal operated by the Alfred-Wegener-Institut.

Arctic sea ice extent averaged 13.38 million square kilometres in January, according to NSIDC. This is 260,000 square kilometersbelow January 2016, the previous lowest January extent – an area bigger than the size of the United Kingdom. It was 1.26 million square kilometers (the size of South Africa) below the January 1981 to 2010 long-term average.

“The recovery period for Arctic sea ice is normally in the winter, when it gains both in volume and extent. The recovery this winter has been fragile, at best, and there were some days in January when temperatures were actually above melting point,” said Mr Carlson. “This will have serious implications for Arctic sea ice extent in summer as well as for the global climate system. What happens at the Poles does not stay at the Poles.”

Antarctic sea ice extent was also the lowest on record. A change in wind patterns, which normally spread out the ice, contracted it instead.

The Water Values Podcast: Current Issues with the Clean Water Act with Mark Ryan

screen-shot-2017-02-21-at-11-23-40-am

Click here to listen to the podcast. (via David McGimpsey)

Mark Ryan, a former top US EPA attorney now in private practice, joins The Water Values Podcast and provides an insider’s view on the Clean Water Act and several important developments affecting the Clean Water Act. Apart from his outstanding analysis of three pending cases (Waters of the U.S. Rule, Water Transfer Rule, and Des Moines), Mark also fills us in on some general administrative law issues (the Regulatory Accountability Act of 2017) and his thoughts on how the Trump administration might handle these issues.

In this session, you’ll learn about:

  • The history of the Clean Water Act
  • What limnology is
  • What the purpose of the Clean Water Act is
  • How the Clean Water Act is administered
  • The five-part test for Clean Water Act applicability
  • How the Clean Water Act has evolved from 1972 to present
  • The Waters of the U.S. Rule & related litigation
  • The Water Transfer Rule case
  • The Des Moines drainage tile point source case
  • What “point source” means
  • How safe are Denver Water’s dams? – News on TAP

    Dam safety team conducts annual inspections, manages upgrades and trains for emergencies to keep facilities secure.

    Source: How safe are Denver Water’s dams? – News on TAP

    Your Watershed: We all can help protect our water supply — Annie Whetzel

    Colorado River Basin in Colorado via the Colorado Geological Survey
    Colorado River Basin in Colorado via the Colorado Geological Survey

    Here’s a guest column from Annie Whetzel that’s running in the Glenwood Springs Post Independent:

    If the fight in Battlement Mesa over the proposed injection well zone and its proximity to the water intake for the public water supply taught us two things, it is that our drinking water comes from the river and it is vulnerable.

    Throughout the Roaring Fork Valley and the middle Colorado River watershed, unless you have a well in your backyard, our water comes from surface water. (In fact, even if you have a private well, it is susceptible to surface water and chemicals at the surface that leach down.)

    Surface water includes the water that runs off the surface of the ground, everything from the mountains upvalley to the sidewalk downtown, flows to the river, and into our home.

    Source water, essentially the source of our water, is important to protect. It is the water we depend on for daily life. The Middle Colorado Watershed Council hosted an event recently and many participants wanted to know how they could help our watershed now. A quick answer is: protect source water.

    Last year, Glenwood Springs finalized its source Source Water Assessment and Protection Plan. The city worked with a statewide organization called the Colorado Rural Water Association to identify where our water comes from, understand areas where the source water might be at risk, and ways to mitigate those risks to water.

    Glenwood Springs highlighted two crucial areas. One area comes from the Flat Tops and flows into the Colorado River in Glenwood Canyon. This tributary, while remote, is extremely vulnerable to severe fire damage.

    If a large fire rolls across the area, the resulting sediment in the tributary could be enough to affect our water supply. It happened in Fort McMurray, Alberta. A fire tore through the area followed by heavy rains filling the river with sediment. The water treatment facility managers had to shut down their intake valve to the facility because the sediment in the water was too great for the system to handle.

    The second area highlighted as at risk for contamination is along the Lower Roaring Fork River. This area is impacted by industry, transportation and the public. Here is where we get to work together and take feasible steps to ensure safe water.

    The first step we all can easily take in protecting our source water is making sure we are handling our home waste and house run-off effectively. Paul Hempel, source water specialist for the Colorado Rural Water Association, said to best protect source water at an individual level is to “take care of household activities.”

    Taking care of household activities includes managing toxic household supplies effectively and ensuring something as simple as oil and grease are handled correctly. That is, don’t pour it down the drain.

    In a prepared statement, Trent Mahaffey from Glenwood Springs Waste Water Treatment Facility, explained that oil and grease can easily damage water and septic systems and can “create overflows into local waterways or property.” He reminds us all to freeze oil and grease and dispose of it in our household trash, and wipe out oily pans with a paper towel before washing them, to prevent excess oil going down the drain.

    Another common source water contamination is runoff directly from a house or driveway. Hempel mentioned that porous surfaces are helpful to prevent excess runoff. Runoff from the house directly to a sidewalk or down a driveway can easily collect debris, oil, animal droppings and other contaminants like fertilizers on its way to the storm drain or ditch. If you have a downspout, create a gravel catchment for the water so it doesn’t have the opportunity to pick up large contaminants on its way to the river.

    Better yet, avoid potential contaminants all together. Hempel stresses that the most important aspect of protecting source water is to simply be aware. This means understanding that what we spray down our driveway or pour down our drain affects our water supply. We should strive to avoid fertilizers with nitrates and washing our car in the driveway. Even if we protect the flow of water to the storm drain with porous surfaces, it is possible for surface water to seep into our groundwater, which will also make its way to the river.

    How can we help our watershed? Be aware of where our water comes from and be aware of what we are adding to the system. Let’s protect our source water.

    Annie Whetzel is with the Middle Colorado Watershed Council, which works to evaluate, protect and enhance the Middle Colorado River Watershed through the cooperative effort of watershed stakeholders. To learn more, go to http://www.midcowatershed.org or on Facebook at http://facebook.com/midcowatershed.

    @ClimateSociety: Weak La Niña Replaced With Neutral ENSO, and Uncertainty

    Here’s the release from the International Research Institute for Climate and Society (Elisabeth Gawthrop):

    Since last month’s briefing, sea-surface temperatures have warmed in the area of the central equatorial Pacific Ocean that define El Niño and La Niña events, called the Nino3.4 region. Last week, the weekly anomaly for Nino3.4 was +0.1ºC — the first time it’s been above 0.0ºC since June. The first image below shows the latest week’s anomalies.

    While the sea-surface temperatures (SSTs) point to a neutral ENSO state, the convection patterns in the equatorial Pacific (i.e. at what longitudes along the equator clouds and thunderstorms form) continue to show a La Niña-like pattern. Although this pattern is what is most likely to in turn influence precipitation patterns around the world, it is expected to weaken or disappear during the remainder of February and early March.

    The upcoming seasonal forecasts are not showing much in the way of La Niña influence. “The models are expecting the convection patterns to return to neutral very soon, such as within the coming few weeks,” said Barnston. “The March-May climate is not expected to be materially influenced by the current cloudiness conditions.” The National Oceanic and Atmospheric Administration’s Climate Prediction Center issued a Final La Niña Advisory last week.

    ENSO Forecasts
    To predict ENSO conditions, computers model the SSTs in the Nino3.4 region over the next several months. The graph in the first image of the gallery below shows the outputs of these models, some of which use equations based on our physical understanding of the system (called dynamical models), and some of which use statistics, based on the long record of historical observations.

    The mean of the statistical models’ forecast is similar to that of last month, with Nino3.4 SSTs staying around 0ºC or just above through the end of the year. The mean of the dynamical models’ forecast, especially later in the year, has increased from last month’s forecast. These dynamical models now call for anomalies around +0.8ºC as the northern hemisphere’s summer comes to a close. Last month’s forecast from the dynamical models didn’t quite reach +0.5ºC.

    These forecasts, however, extend past what’s known as the spring predictability barrier — a function of ocean dynamics that makes it hard to predict ENSO past June of each year, so uncertainty is high.

    The IRI/CPC probabilistic ENSO forecast issued mid-February 2017. Note that bars indicate likelihood of El Niño occurring, not its potential strength. Unlike the official ENSO forecast issued at the beginning of each month, IRI and CPC issue this updated forecast based solely on model outputs. The official forecast, available at http://1.usa.gov/1j9gA8b, also incorporates human judgement.
    The IRI/CPC probabilistic ENSO forecast issued mid-February 2017. Note that bars indicate likelihood of El Niño occurring, not its potential strength. Unlike the official ENSO forecast issued at the beginning of each month, IRI and CPC issue this updated forecast based solely on model outputs. The official forecast, available at http://1.usa.gov/1j9gA8b, also incorporates human judgement.
    This graph shows forecasts made by dynamical and statistical models for SST in the Nino 3.4 region for nine overlapping 3-month periods. Note that the expected skills of the models, based on historical performance, are not equal to one another.
    This graph shows forecasts made by dynamical and statistical models for SST in the Nino 3.4 region for nine overlapping 3-month periods. Note that the expected skills of the models, based on historical performance, are not equal to one another.

    Based on these model outputs, odds for La Niña are close to zero for the next several seasons, with neutral conditions dominating (see second graph in gallery above). The warmer SSTs shown in the plume graph, especially in the dynamical models, are reflected in the increasing likelihood for El Niño conditions later in the year.

    The official probabilistic forecast issued by CPC and IRI in early February shows a similar overall pattern. This early-February forecast uses human judgement in addition to model output, while the mid-February forecast relies solely on model output.

    From NOAA (Emily Becker):

    Well, that was quick! The ocean surface in the tropical Pacific is close to average for this time of year, putting an end to La Niña, and forecasters expect that it will hover around average for a few months. Let’s dig in to what happened during January, and what the forecast looks like.

    Not with a bang

    This La Niña wasn’t exactly one for the record books. Our primary index, the three-month-average sea surface temperatures in the central Pacific Niño3.4 region, only dipped to about 0.8°C cooler than the long-term average during the fall of 2016. However, these cooler-than-average temperatures persisted for several months, and the atmosphere over the tropical Pacific responded as expected to the cooler waters. Namely, during the fall and winter to date, the Walker Circulation was strengthened: stronger near-surface east-to-west trade winds, stronger upper-level west-to-east winds, more rain than usual over Indonesia, and less rain over the central Pacific.

    Monthly sea surface temperature in the central tropical Pacific Niño 3.4 region, from OISST.v2 temperature data. Data shown is the difference from the 1981-2010 average. Climate.gov graph from CPC data.
    Monthly sea surface temperature in the central tropical Pacific Niño 3.4 region, from OISST.v2 temperature data. Data shown is the difference from the 1981-2010 average. Climate.gov graph from CPC data.

    During January, the sea surface temperature edged close to normal, and the average temperature in the Niño3.4 region was just about 0.3°C below normal by the end of the month. (Note, this is using the weekly OISST data. There are some differences between our sea surface temperature data sets, which Tom described in detail here.)

    Another factor that we watch is the temperature of the tropical Pacific Ocean below the surface. Over the past few months, the amount of cooler-than-average water at depth has been decreasing, and by the end of January it had disappeared. These deeper waters often give an idea of what we can expect at the surface in following months. Meaning, the lack of cooler water at depth makes it unlikely that the surface will cool off again substantially in the next few months

    Monthly average heat content in the upper 300m of the equatorial Pacific. Data shown is the difference from the 1981-2010 average between 180°W and 100°W. Climate.gov graphic from CPC data.
    Monthly average heat content in the upper 300m of the equatorial Pacific. Data shown is the difference from the 1981-2010 average between 180°W and 100°W. Climate.gov graphic from CPC data.