The January 2020 “Fountain Creek Chronicles” is hot off the presses

Click here to read the newsletter from the Fountain Creek Watershed & Flood Control District. Here’s an excerpt:

UCCS Values Relationship with Fountain Creek District
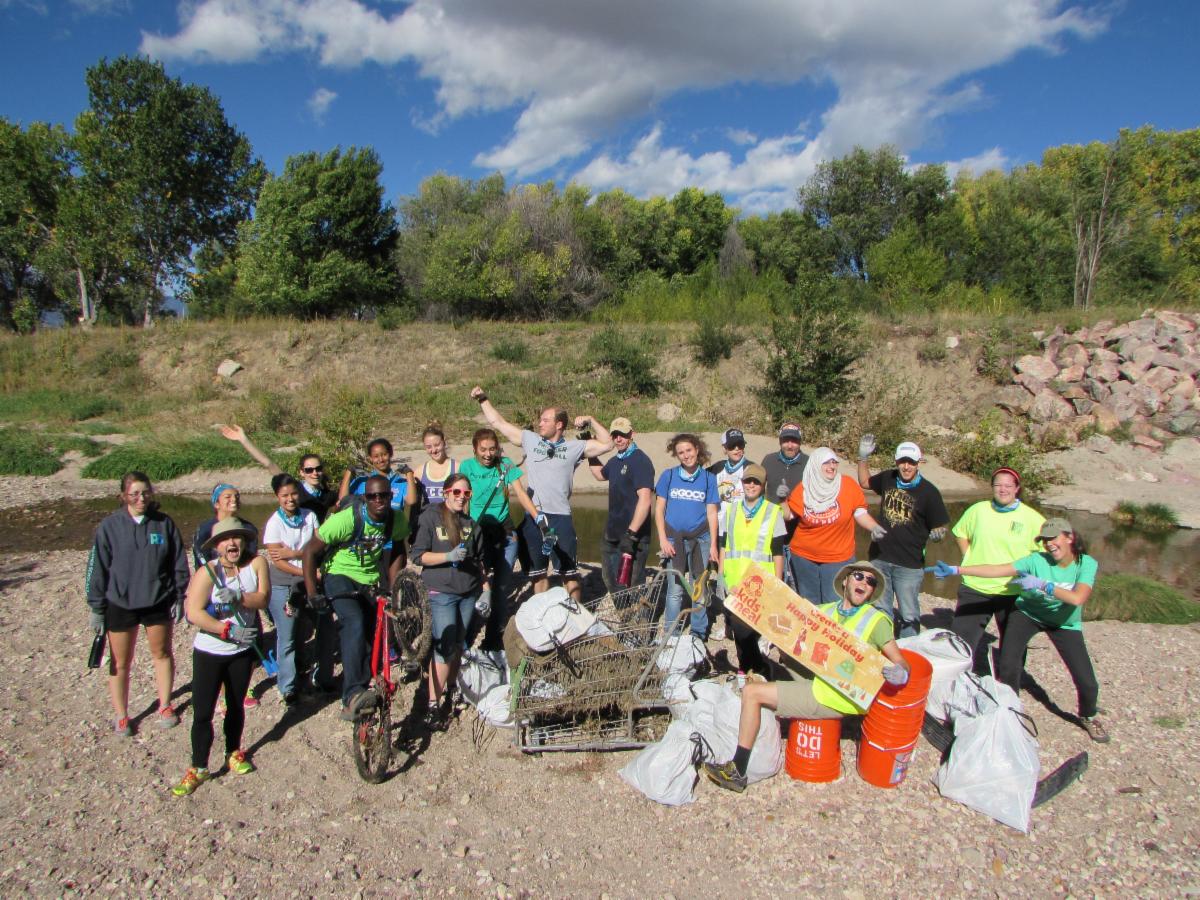
Contributed by: Kimberly Reeves, UCCS

More than 100 volunteers from the University of Colorado – Colorado Springs (UCCS) participated in Colorado Springs’ sixth annual Creek Week, working to clear the Templeton Gap Floodway of 40 bags of trash, one and a half grocery carts, and a bicycle wheel.

The District’s Creek Week events raise awareness about the Fountain Creek watershed, by educating volunteers about Colorado’s waterways while clearing litter and debris from the 75-mile long Fountain Creek and 927 square-mile watershed that drains into the Arkansas River. UCCS’ Office of Sustainability has championed efforts to promote events on and around campus since the inaugural event in 2014.

This collaborative effort of private companies, city and county organizations, and non-profits has broadened the reach for our campus community by using resources from all partners to ensure we are communicating the same message to our circles of influence. The connection for students to volunteer through opportunities that support our surrounding community allows them to strengthen their civic engagement and development as world citizens. Creek Week provides a platform to talk about the bigger picture of community members across our watershed from Palmer Lake to Pueblo, which is all supporting healthy waterways through volunteerism.

The past two years, Creek Week has increased its efforts from volunteer clean-up events to involve citizen scientist opportunities, which engaged faculty from UCCS to incorporate these opportunities into their courses. This ability to use the surrounding ecosystem as a place to conduct research benefits our students in not only experiential learning, but also the City of Colorado Springs because our students are investing their time to strengthen our community.

The UCCS community asks for Creek Week dates year-round. It has become a positive expectation that our universities invest in our broader community and provides opportunities to make an impact one clean-up at a time.

The Fountain Creek Watershed is located along the central front range of Colorado. It is a 927-square mile watershed that drains south into the Arkansas River at Pueblo. The watershed is bordered by the Palmer Divide to the north, Pikes Peak to the west, and a minor divide 20 miles east of Colorado Springs. Map via the Fountain Creek Watershed Flood Control and Greenway District.

@NOAA: 2019 was the 2nd wettest year on record for the U.S.

(Left) The smoke plume from California’s Kincade Fire, as seen from the NOAA-20 satellite on October 27, 2019. (Right) Hurricane Dorian spinning near the Bahamas, as seen by the GOES-16 satellite on September 1, 2019. Dorian, and the wildfires in California and Alaska combined, were two of 14 disasters in the U.S. in 2019 that each exceeded $1 billion in damages.

Here’s the release from NOAA:

It was another year of record-making weather and climate for the U.S. in 2019, which was the second wettest behind 1973.

Warmer-than-average temperatures were felt by much of the country including Alaska, which logged its hottest year on record.

Alaska also experienced destructive wildfires that, when combined with those in California, caused damages in excess of $1 billion. Thirteen other billion-dollar disasters that struck the U.S. last year included Hurricane Dorian, historic flooding and severe storms.

Here’s a recap of the climate and extreme weather events across the U.S.in 2019:

Climate by the numbers
2019 | January through December

Precipitation across the contiguous U.S. totaled 34.78 inches (4.48 inches above the long-term average), ranking 2019 as the second-wettest year on record after 1973, according to scientists from NOAA’s National Centers for Environmental Information.

By year’s end, 11 percent of the contiguous U.S. was in drought. In April, drought conditions had reached a low of 2.3 percent, the smallest drought footprint in the 20-year history of the U.S. Drought Monitor.

The average temperature measured across the contiguous U.S. in 2019 was 52.7 degrees F (0.7 of a degree above the 20th-century average), placing 2019 in the warmest third of the 125-year period. Despite the warmth, it was still the coolest year across the Lower 48 states since 2014.

There were some standouts in 2019, including Alaska, which had its hottest year ever recorded — 6.2 degrees F warmer than the long-term average. Georgia and North Carolina also saw their hottest year on record, while Michigan, Minnesota, North Dakota, South Dakota and Wisconsin each had their wettest year ever recorded.

This U.S. map shows the locations of all 14 billion-dollar disasters that happened across the country in 2019.

Billion-dollar disasters in 2019

Last year, the U.S. experienced 14 weather and climate disasters with losses exceeding $1 billion each and totaling approximately $45 billion. At least 44 people died and many more were injured during the course of these disasters that included:

  • 1 wildfire event (affecting multiple areas in Alaska and California);
  • 2 tropical cyclones (Dorian and Imelda);
  • 3 inland floods (affecting the Missouri, Arkansas and Mississippi Rivers); and
  • 8 severe storms.
  • The extreme weather with the most widespread impact was the historically persistent and destructive U.S. flooding across more than 15 states. The combined cost of just the Missouri, Arkansas and Mississippi River basin flooding ($20 billion) was almost half of the U.S. cost total in 2019.

    Billion-dollar disasters: The historical perspective

    During the 2010s, the nation saw a trend of an increasing number of billion-dollar inland flooding events. Even after adjusting for inflation, the U.S. experienced more than twice the number of billion-dollar weather and climate disasters during the 2010s (119) as compared with the 2000s (59).

    The billion-dollar disaster damage costs over the last decade (2010-2019) for the U.S. were also historically large — costs exceeded $800 billion from 119 separate billion-dollar events.

    Since 1980, the U.S. has sustained 258 billion-dollar disasters overall that have exceeded $1.75 trillion in total damages.

    The latest #ENSO diagnostic discussion is hot off the presses from the Climate Prediction Center


    Click here to read the discussion:

    ENSO Alert System Status: Not Active

    Synopsis: ENSO-neutral is favored through Northern Hemisphere spring 2020 (~60% chance), continuing through summer 2020 (~50% chance).

    During December 2019, near-to-above-average sea surface temperatures (SSTs) were evident over the equatorial Pacific Ocean. Most SST indices increased in the past week, with the eastern Niño-1+2 and Niño-3 regions remaining near average (+0.1°C to +0.3°C), while the Niño-4 and Niño-3.4 regions were warmer at +1.2°C and +0.7°C, respectively. The recent increase in SST anomalies was partially driven by a combination of low-level westerly wind anomalies and the growth in positive equatorial subsurface temperature anomalies (averaged across 180°-100°W;. The latter indicates a downwelling Kelvin wave, which was evident in the above-average temperatures in the central and east-central Pacific Ocean. Over the month, westerly wind anomalies persisted over small regions of the western and eastern equatorial Pacific Ocean, while upper-level winds were near average over most of the equator. Tropical convection remained suppressed over Indonesia and east of the Date Line, and was enhanced to the west of the Date Line. The overall oceanic and atmospheric system was consistent with ENSO-neutral, though recent observations reflected a trend toward warmer conditions that will be monitored.

    The majority of models in the IRI/CPC plume continue to mostly favor ENSO-neutral (Niño-3.4 index between -0.5°C and +0.5°C) through the Northern Hemisphere summer. For the December 2019-February 2020 season, the Niño-3.4 index is predicted to be near +0.5°C, which is consistent with the latest observations. The forecasters also favor above-average ocean temperatures to continue in the next month or two, but, in alignment with most model guidance, do not foresee a continuation over several consecutive seasons or shifts in the atmospheric circulation that would indicate El Niño. In summary, ENSO-neutral is favored through Northern Hemisphere spring 2020 (~60% chance), continuing through summer 2020 (~50% chance; click CPC/IRI consensus forecast for the chance of each outcome for each 3-month period).

    #Snowpack News: Statewide percent of normal = 113%

    Click on a thumbnail graphic to view a gallery of snowpack data from the NRCS.

    And here’s the Westwide SNOTEL basin-filled map for January 13, 2020 via the NRCS.

    Westwide SNOTEL basin-filled map January 13, 2020 via the NRCS.

    #Colorado Has $500,000 Ready For #PFAS Water Testing. So Far, There Are Few Takers — Colorado Public Radio

    The team responsible for the development of the enhanced contact electrical discharge plasma reactor, a novel method for degrading poly- and perfluoroalkyl substances (PFASs). Professors Selma Mededovic Thagard and Thomas Holsen with Nicholas Multari and Chase Nau-Hix (shaved head), pose in the CAMP lab, October 6, 2017.

    From Colorado Public Radio (Grace Hood):

    Colorado officials will continue to reach out to drinking water districts to encourage testing for synthetic chemicals known as Per- and Polyfluoroalkyl Substances — otherwise known to the public under the PFAS acronym umbrella.

    The sign-up rate, however, has been minimal.

    About one week into the Colorado Department of Public Health and Environment’s campaign, officials said about 8 percent of Colorado’s roughly 790 drinking water districts have signed up for tests…

    That’s not to say that officials aren’t pleased with the sign-up rate so far. They plan to send email notifications to drinking water districts to remind them of the available funds over the coming weeks…

    While the [EPA’s] current advisory limits are voluntary, they are determining whether to formally regulate two of the chemicals, PFOA and PFOS. A decision is expected later in 2020.