Click here to read the newsletter. Here’s an excerpt:
Demand Management – a Hot Topic!!
There was an in-depth conversation around the Demand Management topic!
Celene Hawkins stated that the Demand Management workgroups are just at the beginning stages of work and there are still many questions. There is a greater need for coordination and keeping a steady pace of the work, while not moving too quickly so as to not miss things, as these are very complicated issues and need to take that time that is needed to do the work. There will be a joint IBCC and Demand Management work-group meetings that will take place March 4-5 where discussion could take place about that better coordination and how the CWCB can support the work-groups moving forward.
Russell George stated that the IBCC is not a work-group in Demand Management, they intentionally stand aside because they wanted to be ready as the IBCC to pick any particularly thorny question with the statewide implication that needed their help. The IBCC believes that at this point in time, and because of what’s going on with the river as a whole and the water levels of the big reservoirs, Demand Management becomes probably one of the most important issues for discussion on Colorado water issues that there is today. George explained that we owe it to the other Upper Basin states who are going through this drill, to work together to find an approach that works in all four states or to learn together that Demand Management can’t be done. Whatever conclusion is reached, it needs to be based on open and careful consideration of Demand Management as a tool that is being evaluated, as called for in the Drought Contingency Plans and Legislation.
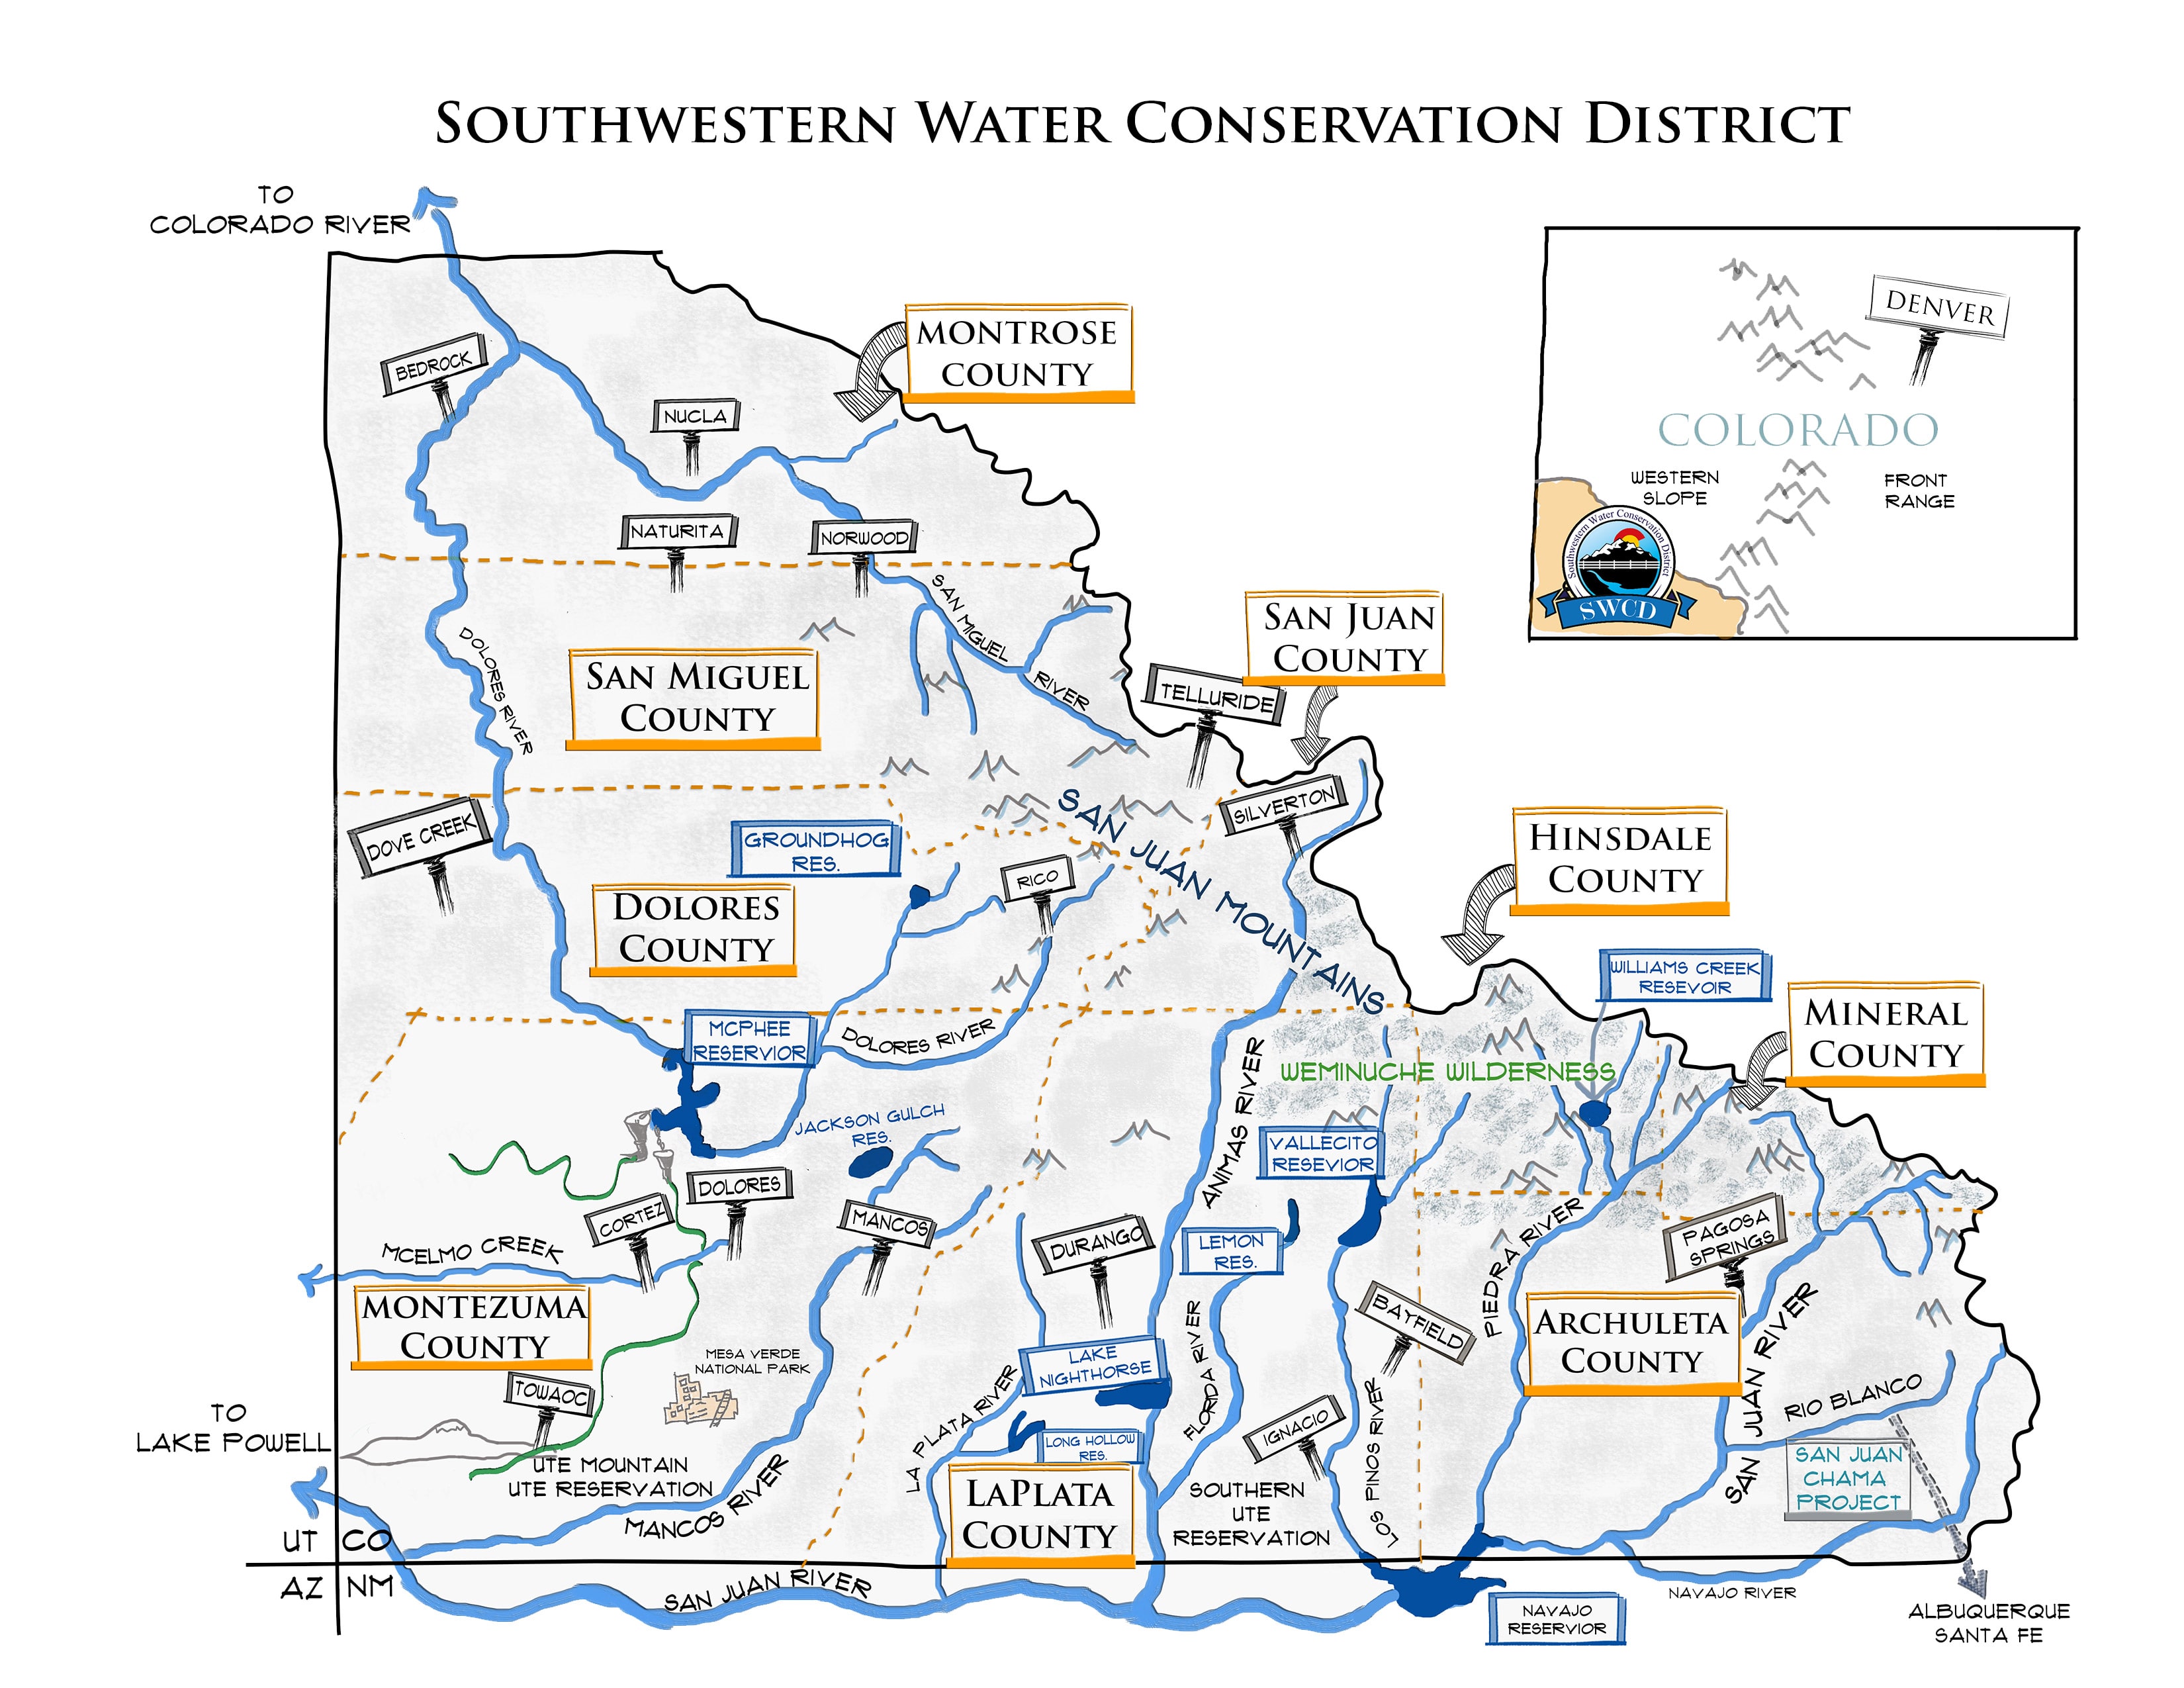
Southwestern Water Conservation District Area Map. Credit: SWCD
From Weather5280.com (Becky Bollinger). Click through for additional maps and the interactive map from Becky:
We’re almost one month into 2020, and this is an exciting time for climatologists. Upon the completion of this year, calculations will begin to update the climatological normals. Wondering what those are? Well, any time you hear your local meteorologist mention the average for the day, or see headlines like “temperatures much above average” or “expect drier than average conditions,” that average is based on climatology that has been calculated, using the most recent 3 decades, by NOAA’s National Centers for Environmental Information.
Our averages are currently based off temperatures and precipitation observed 1981-2010. After the end of this year, the new averages (or normals) will be for the period 1991-2020 (basically we’re dropping the 1980s and adding the 20-teens). Why update the normals? Well, whether you think climate change is human caused or not, we all agree that the climate is variable. It’s important to make sure that we’re accurately representing the current climate when talking about what’s “normal.”
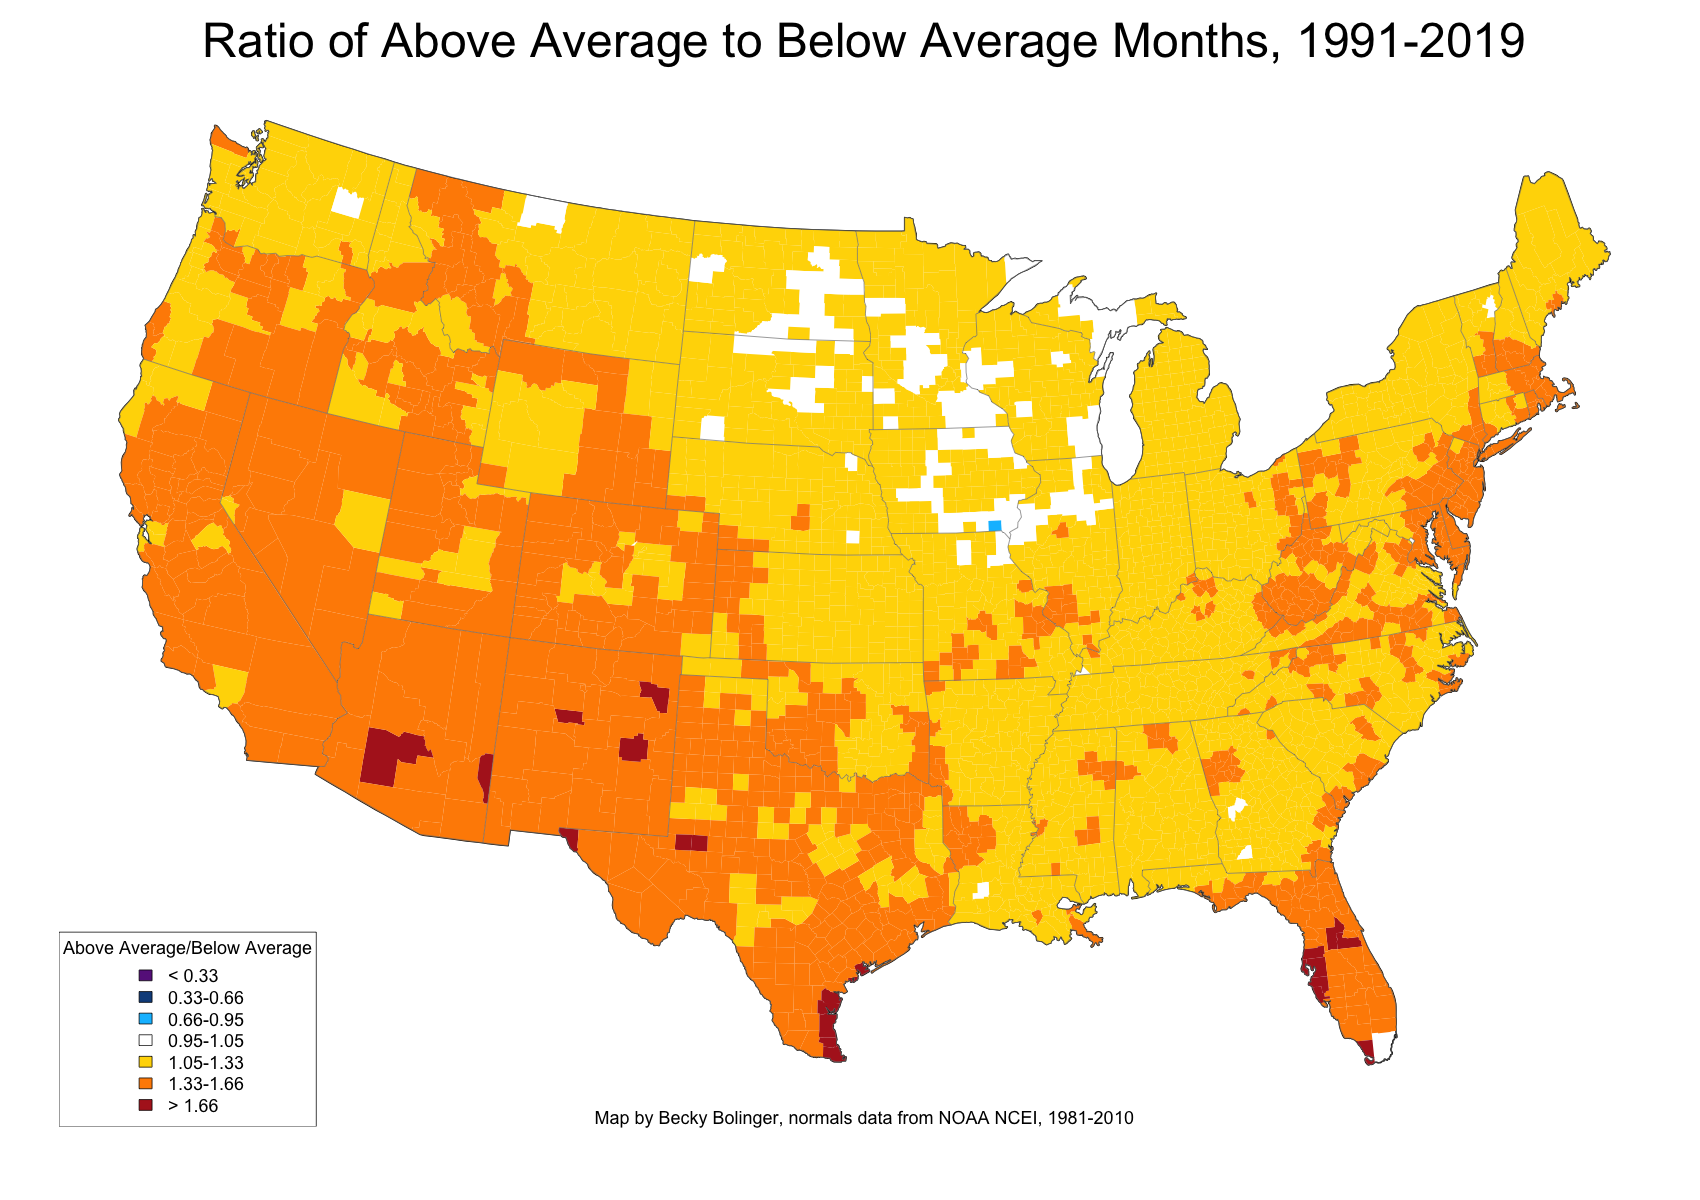
If weather conditions were truly random and the variability around the average never changed, we could assume to experience an equal number of above average or below average conditions. Like flipping a coin, we’d expect, with enough coin tosses, we’d have an equal number of heads and tails. Have we experienced the same number of above average temperatures vs. below average temperatures? Take a look at the map below (number of above average months vs. below average months for the 1991-2019 period) to see that, simply, the answer is no. If the data were truly randomly distributed, we’d see mostly white on this map (i.e. the ratio between above average and below average conditions would be 1 to 1). Overwhelmingly, most of the counties show a ratio greater than 1.
Using 1981-2010 as average, number of above average months divided by number of below average months from 1991-2019. Credit: Becky Bollinger via Weather5280.com.
Areas in blue would indicate that we see a greater number of cooler than average months compared to warmer than average months. Notably, there is only one county, in Iowa, that comes up blue. And only a small handful of counties in the upper Midwest that are near 1.
Warmer colors indicate more warmer than average months have occurred. Areas in orange show counties that have observed 33-66% more warmer than average months than colder than average months (i.e. for every 3 colder than average months, you could expect 4-5 warmer than average months). Most of the southwestern counties are orange. A handful of counties – located in Arizona, New Mexico, Texas, and Florida – have a number higher than 1.66.
So, comparing to the 1981-2010 normals, we see that for most of the country there have been a higher number of warmer than average months from 1991 to 2019. Does this mean we’ll see higher averages when the 1991-2020 normals are calculated? Let’s see what things look like when we break it down by month.
For each month, I’m estimating what the new average might be by calculating the mean of the observations for 1991-2019 (caveat: obviously we still have one year to go, and also NCEI does additional calculations to smooth data, remove biases, add/remove stations, etc. Meaning, what I’ve estimated here is not necessarily going to match exactly what the new normal becomes). Some very interesting patterns emerge:
In the cold season months, monthly averages through much of the upper Midwest will be cooler than the current average. In fact, from January – August, there is very little warming observed between the two averaging periods for a lot of the central to northern plains. It’s speculated that this is linked to agricultural and irrigation practices throughout the region (wetter soils will prevent the air above it from warming as much).
For the southeast, we can expect to see cooler averages estimated in the month of November. This is possibly driven by a significant increase in fall precipitation over the southeast.
Widespread warmer averages can be expected across the U.S. during September and December. While the warming looks more extreme for December, the difference there is largely due to dropping a couple of extreme cold months in the 1980s. For September, there is quite a significant and consistent amount of warming occurring, especially in low temperatures.
August is the month where we would expect the least changes for much of the country. This makes sense if you consider that August is the warmest month for much of the northern hemisphere, so there’s “less room to grow” so to speak.
Agritourism is becoming more and more popular as a secondary (or even a primary) revenue stream for all sorts of producers and growers. There are a number of agritourism enterprises on the Western Slope, including Orchard Valley Farm, The Living Farm, Covered Bridge Ranch, Mr. B’s, Prock Elk Ranch, Bray Ranches, and others…
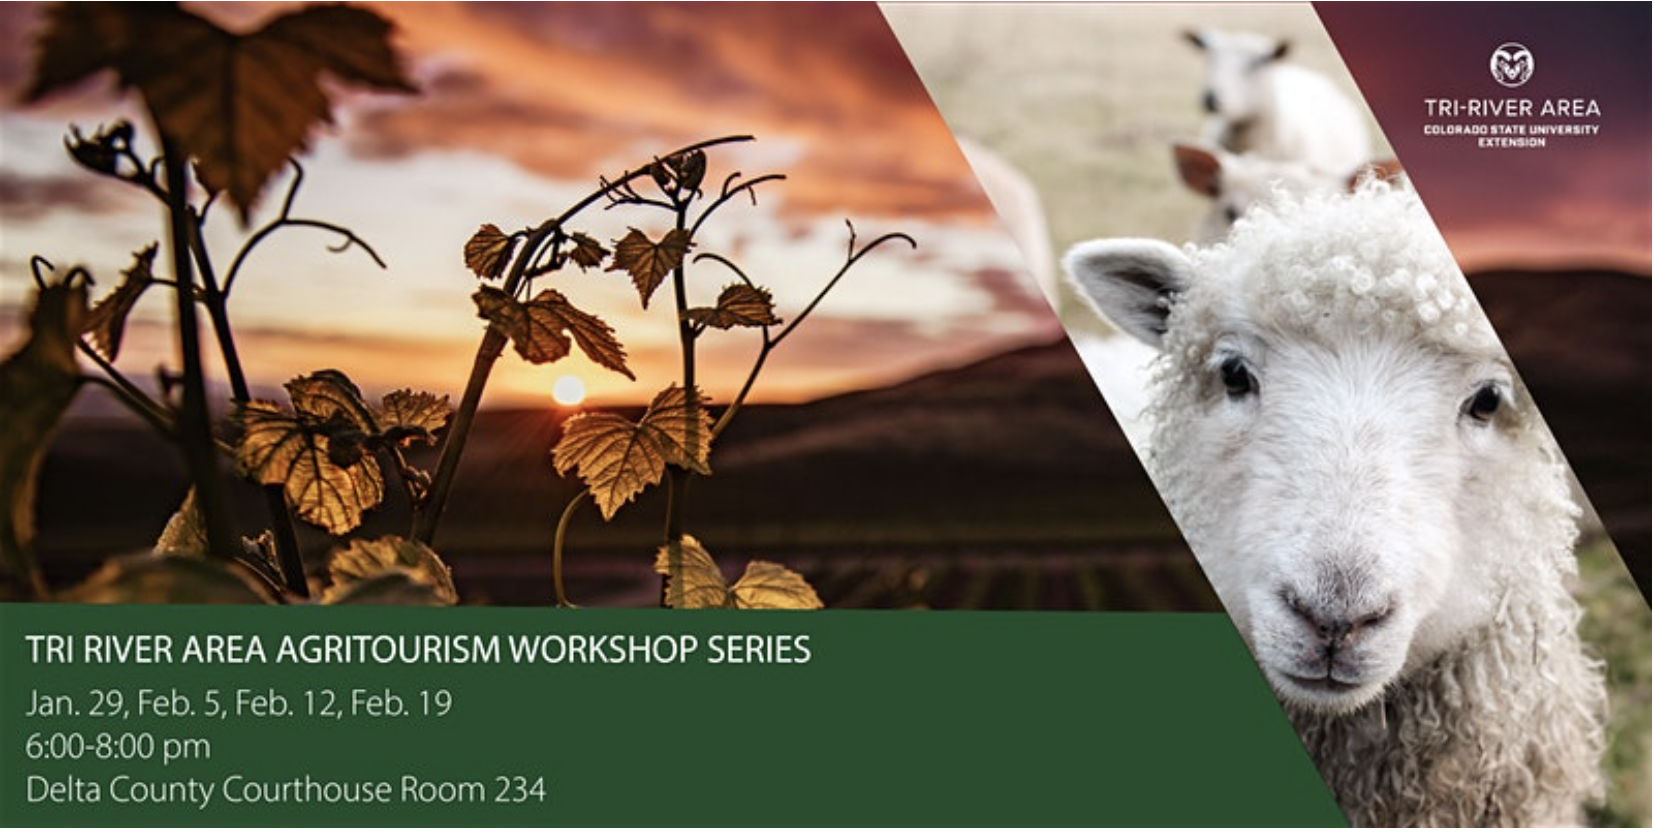
Tri-River Area Agritourism Series – Growers and producers are invited to attend this 4 part series from 6-8pm at the Delta County Courthouse Room #234 each Wednesday night beginning January 29, 2020. The Tri River Area Agritourism Workshop Series will cover topics including, Legalities and Insurance, Marketing and Advertising, Special Events, and Partnership Building and Craft 101 Applications. The workshop series features industry leading speakers from Colorado Agritourism Association, Colorado Department of Agriculture, Colorado State University, Rocky Mountain Farmers Union and more. Registration includes dinner at each session, attend all four sessions for $50 or $15 per session.
Questions? Contact Kelsi Seymour at kelsi.seymour@colostate.edu
The series will cover a number of critical topics presented by industry leaders from the Colorado Agritourism Association, Colorado Department of Agriculture, Rocky Mountain Farmers Union and others.
Key topics to be covered include Legalities and Insurance, Marketing and Advertising, Special Events, and Partnership Building and CRAFT Program.
The Jan. 29 evening will be the Legalities and Insurance forum led by Corry Mihm, executive director, Colorado Agritourism Association and Joshua Applegate of Farmers Insurance.
The Marketing and Advertising workshop will be on Feb. 5 with the speakers Wendy Lee White, marketing specialist, Colorado Department of Agriculture, Markets Division and Kelli Hepler, Delta County Agritourism, VP of the Colorado Agritourism Association Board.
Lynn Gillespie, of The Living Farm, Susie Kaldis-Lowe, executive director NFV Creative Coalition, and Andrea Earley Coen, executive director, Guidestone Colorado will lead the Special Events workshop on Feb. 12.
The last session, on Feb. 19 will be on Partnership Building and the CRAFT program. The presenter will be Dawn Thilmany, associate director, Community and Economic Development, professor of Ag and Resource Economics at Colorado State University; Harrison Topp, director of membership, Rocky Mountain Farmers Union.
“The Trump Administration’s new water rule makes it a lot easier to pave America’s critical wetlands and put up parking lots,” said David Yarnold, president and CEO, National Audubon Society (@david_yarnold) after the Administration announced the finalization of its rollbacks to the Clean Water Act. “Wetlands are not only important places for birds, they also are natural buffers that absorb flood waters and purify water for us all.”
The newly published, Navigable Waters Protection Rule, removes Clean Water Act protections for many rivers, streams, and wetlands that could allow them to be altered, degraded or filled. For example, a large number of streams and wetlands that are only wet for part of the year are now exempt from Clean Water Act protections. Some 138 species and subspecies of birds in the U.S. are designated as “wetland dependent” and many more are threatened by the new rule.
“This disintegration of Clean Water Act protections further threatens birds by putting critical habitat at risk of pollution and destruction of habitat,” said Julie Hill-Gabriel, vice president for water policy at the National Audubon Society. “We’ve already lost 3 billion birds in the past 50 years and we know that two-thirds of North American bird species are at risk of extinction from climate change.”
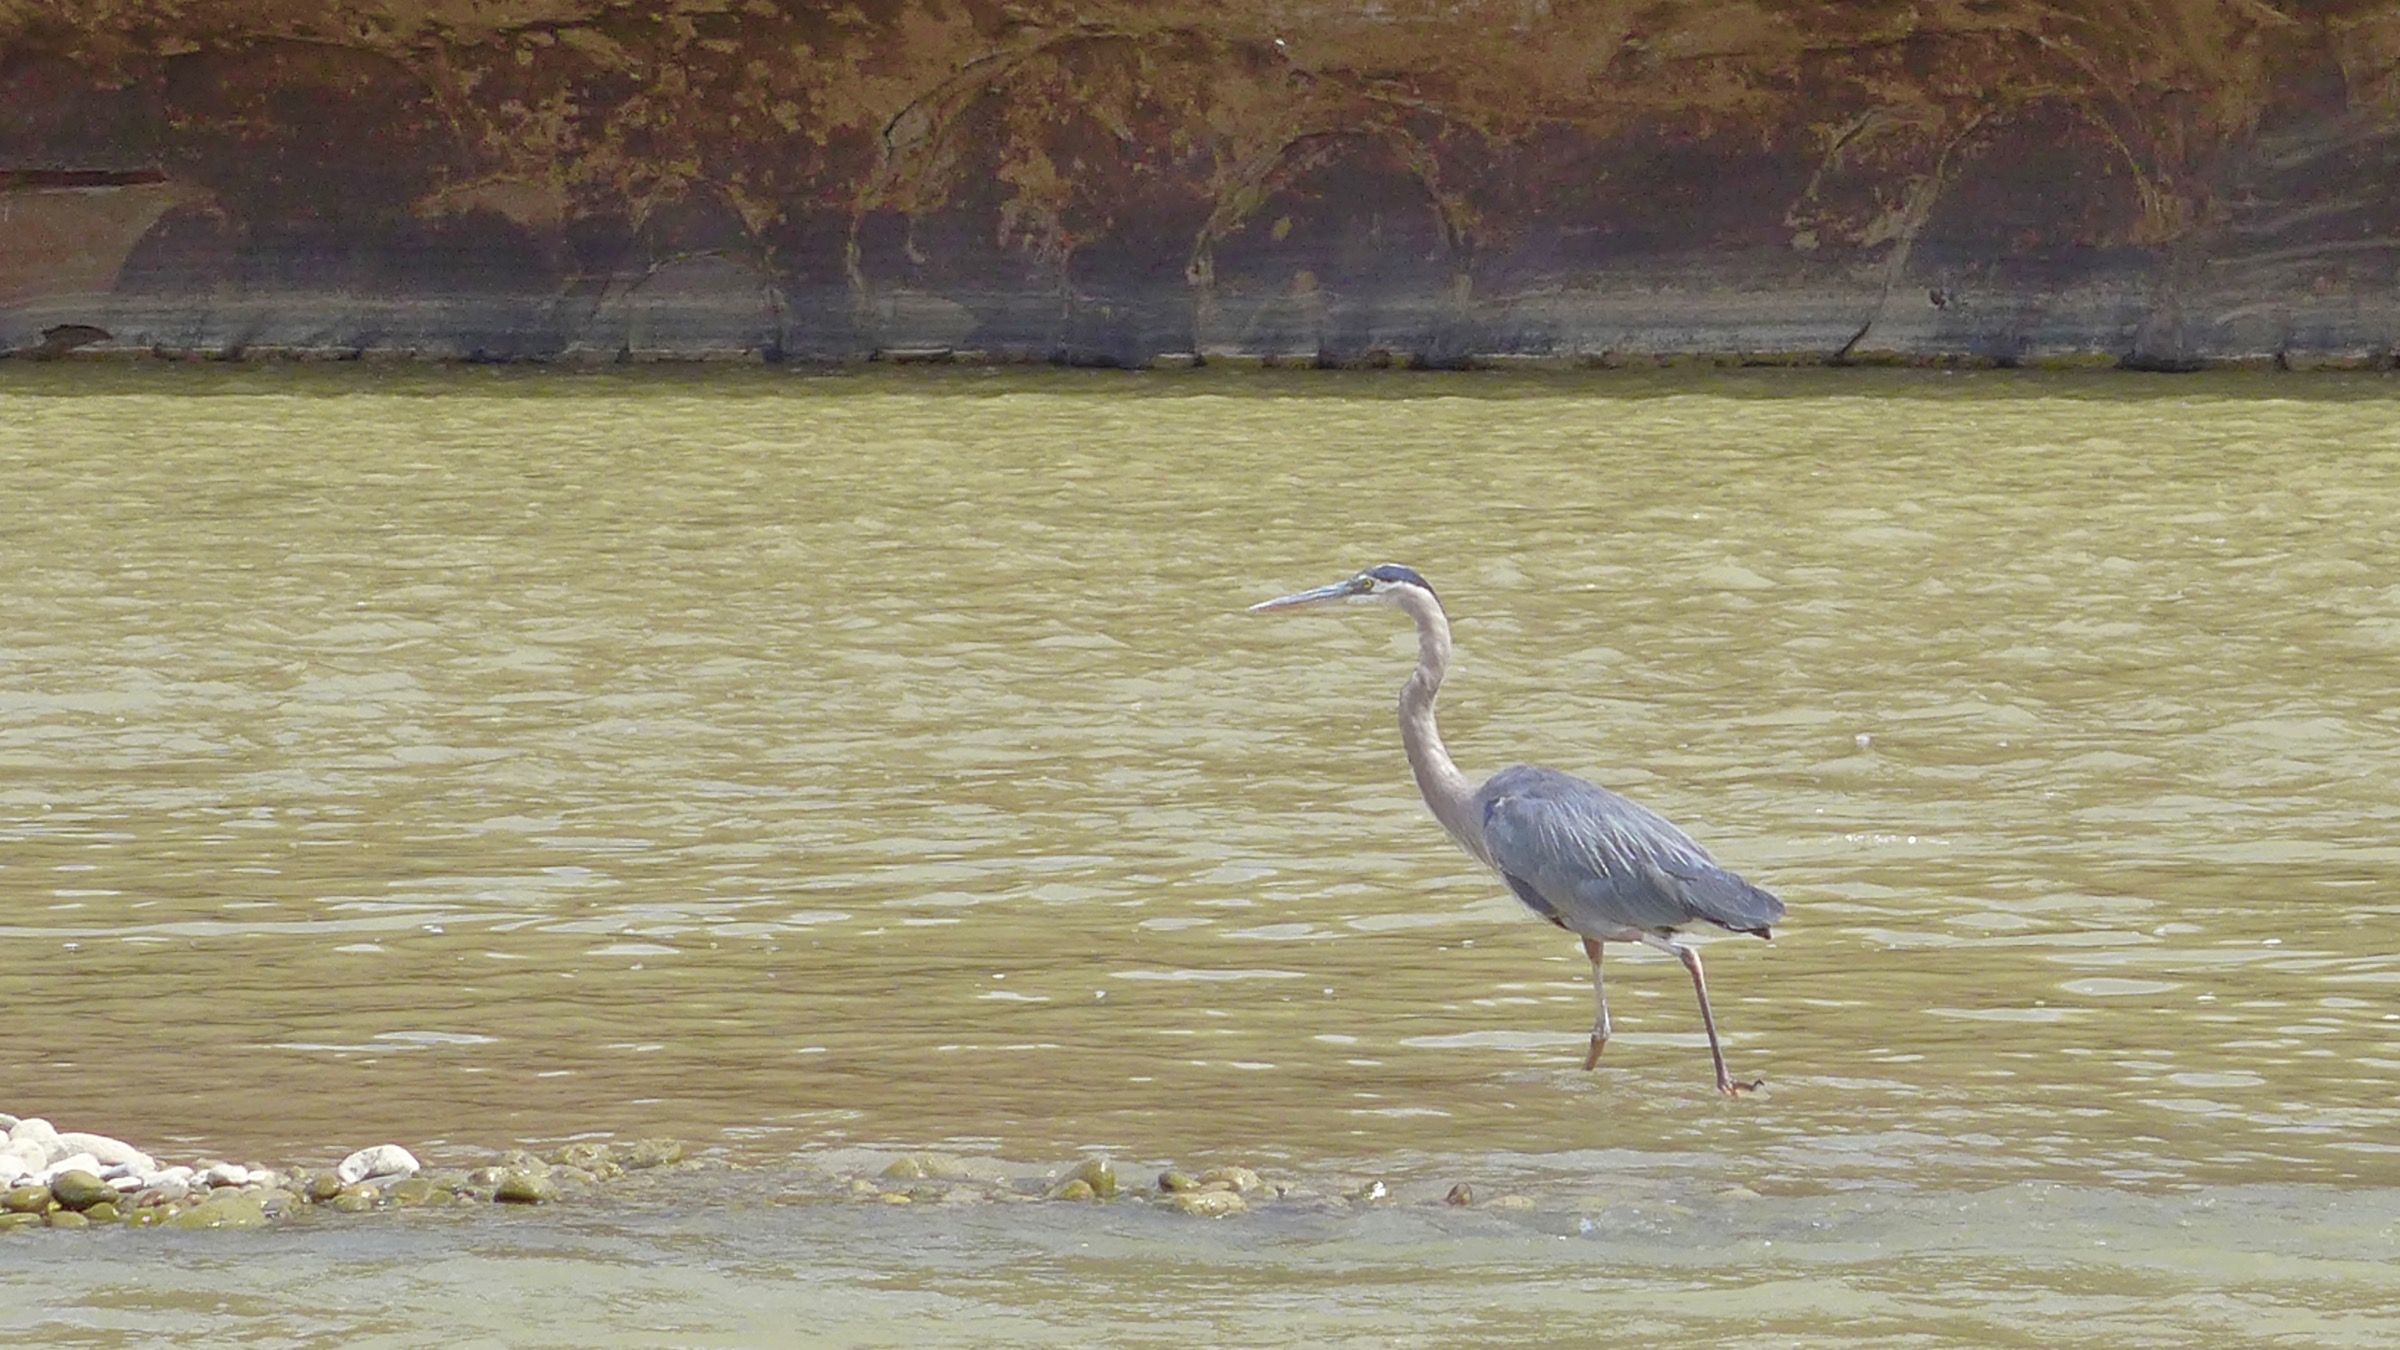
Birds use lakes, tributaries, streams, ponds, wetlands, prairie potholes, and other water bodies for breeding, nesting, and raising young. These water bodies provide crucial sources of drinking water and food, stop-over locations during migration and needed shelter for birds as they seek protection from predators and harsh weather.
The rule will adversely impact birds in the arid southwest, in the Great Lakes to the north, in the Everglades to the south, and in the Delaware River basin to the east. The Clean Water Act is one of our most powerful environmental laws. The final rule undermines the science-based definition of “Waters of the United States” and is another example of this Administration passing laws and policies that are bad for birds and people.
Local groups call for plugging of discharging mines
Todd Hennis, owner of the Gold King Mine, is not happy about the proposed Superfund cleanup around Silverton, saying the suggestion to plug more mines only redistributes potentially toxic water and doesn’t solve the problem…
In December, two community groups formed to help guide the Superfund process – the Citizens Advisory Group and the Silverton-San Juan County Planning Group – submitted letters to the EPA with a similar recommendation.
The main message: focus on the sites – namely the Gold King, American Tunnel, Mogul and Red & Bonita – which are contributing the most amount of contaminated metals into Cement Creek, a tributary of the Animas River.
According to data from the now-defunct Animas River Stakeholders Group, almost half of all metal loading from the 120 draining mines sampled around Silverton comes from these four sources.
And the suggested solution? Place more bulkheads.
“While currently the (Bonita Peak) enjoys high-priority status as a Superfund site, the (community group) is quite concerned its priority could change in the future,” the CAG wrote. “… Bulkheads can be funded with manageable, annual budgeting, unlike a large water treatment facility, which may need a big financial infusion all at once.”
Hennis, for his part, has long maintained that the original bulkheads placed on the American Tunnel caused his mines to start to discharge mine wastewater. Sunnyside Gold has adamantly denied the Sunnyside Mine is connected geologically to Hennis’ mines.
Regardless, Hennis said he was “shocked and appalled” to learn the community groups were in favor of more bulkheads as a main treatment option.
“Bulkheading doesn’t work,” Hennis wrote. “It appears all they accomplished in the long term was to re-distribute acid mine water flows elsewhere, and in the same volume as the original problem.”
Hennis says that if the Gold King and Red & Bonita are plugged, it could shift water back into the American Tunnel, where bulkheads there could be overwhelmed.
“Rolling the dice on a potential catastrophic failure of the American Tunnel bulkheads makes no sense whatsoever,” he said. “If a release of 3 million gallons of mine water from the Gold King raised absolute havoc downstream, a potential release of billions of gallons from the Sunnyside Mine Pool would have unthinkable consequences.”
Hennis instead said the only long-term solution would be to drain the Sunnyside Mine pool, treat the water and shut off spots where water gets into the Sunnyside Mine network.
But this could be costly.
Richard Mylott, spokesman for EPA, said the agency is working to understand the impacts that bulkheading would have on water quality and water levels within the Cement Creek area…
Mylott said EPA has installed several wells to monitor the groundwater system when it tests the closure of the Red & Bonita.
Prior to mining, snowmelt and rain seep into natural cracks and fractures, eventually emerging as a freshwater spring (usually). Graphic credit: Jonathan Thompson
Since 2007, Parks and Wildlife has conducted a biennial fishery survey of the reach with assistance from Summit County, the U.S. Forest Service and the Colorado Water Quality Control Division. After evaluating the latest survey, Parks and Wildlife aquatic biologist Jon Ewert found “an obvious and significant decline occurring in this fishery.”
That conclusion is based on the steady drop in total biomass of surveyed fish collected during each survey since 2011. The 2011 estimated trout biomass was 228 pounds per surface acre. Since then, the figure has dropped by more than 50%.
“The 2019 survey yielded the lowest estimate to date, which is less than half of the peak values observed in 2009 and 2011,” the report said. “The consistency and repeated observations of this downward trend over a period of several years makes it a virtual certainty that this is not an artifact of sampling error.”
The survey was conducted on a 581-foot stretch of the Blue River, named the Fourmile Bridge reach, that is 2.7 miles upstream of the Dillon Reservoir…
While the report does not make any conclusion as to what might be causing the decline, it does urge action and study to discover the root causes for the fishery depletion and address them to improve the health of aquatic wildlife in the Blue River…
Ewert said the report is meant to jumpstart that investigation.
“The purpose of the report is to highlight the fact that there’s this situation developing where we can observe a steady decline in fish,” Ewert said Wednesday. “It means to say, ‘Let’s come together and figure out how to improve the situation.’”
Though no cause has been established, the report does speculate as to the possibility that the stretch’s habitat has changed so that it no longer supports a high density of fish. That could include contamination from abandoned mine runoff, obstructions in the water placed by humans or other disruption caused by human activity.
Richard Van Gytenbeek, Colorado River Basin outreach coordinator for freshwater habitat conservation nonprofit Trout Unlimited, said that areas worth exploring include the health of the aquatic food chain, which starts with algae.
“Aquatic invertebrates need algae to graze on, they are really dependent on that food source,” Van Gytenbeek said. “You need more phosphorus and nitrogen in the water to get the algae. Without that, you don’t have the bugs fish feed on, which puts that population under stress, as well.”
The other area Van Gytenbeek believes is worth exploring is the characteristics of the current fish population.
“If you have a bad spawn year, and not many fish go upstream to spawn, you’re going to have very low numbers in that year’s class,” Van Gytenbeek said. “Two, three, four years down the road, when that year’s class of fish get sexually active, there’s not as many spawning.”
Van Gytenbeek also suggested that high elevation environments might have a part to play, with lower water temperatures than at sea level.
Ewert pointed out in the report that despite the decline, the surveyed stretch of river is still a healthy fishery.
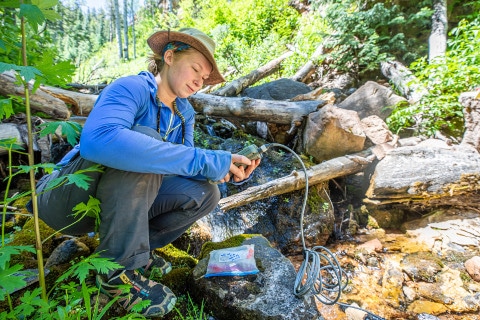
Natalie Jones in the field July 17, 2019. Photo credit Northern Arizona Univeristy
Here’s the release from Northern Arizona University (Heidi Toth):
Where does the water in the Grand Canyon come from?
We all know the Colorado River, but it’s not the most mysterious water resource in the Grand Canyon; we know it moves through at a rate of about 12,000 cubic feet per second as it travels from the Rocky Mountains to the Gulf of California. But Roaring Springs, Grand Canyon National Park’s only water source, is a bigger mystery—one NAU researcher Natalie Jones hopes to have a hand in solving.
Jones, an NAU research technician and graduate student contracted by the Grand Canyon Physical Sciences program, asked where the water in Roaring Springs comes from in research she did with School of Earth and Sustainability professor Abe Springer. It’s building on previous research for both of them. They published their findings in November in Hydrogeology Journal, with Jones as the lead author and in collaboration with researchers at the Grand Canyon National Park, Nez Perce-Clearwater National Forests and the Kentucky Geological Survey at the University of Kentucky.
So, where does the water come from? It’s complicated. But this research helps to pinpoint the region feeding the springs and, importantly, the risk of contamination in that region. It takes researchers one step closer to understanding how to protect this vital resource.
Jones and her co-authors set out to investigate how to create a better way to model karst-aquifer vulnerability in the Grand Canyon. Having a model that more accurately predicts different variables in the geology and water behavior in the park will benefit future researchers and water managers as they consider individual recharge areas and how best to protect them.
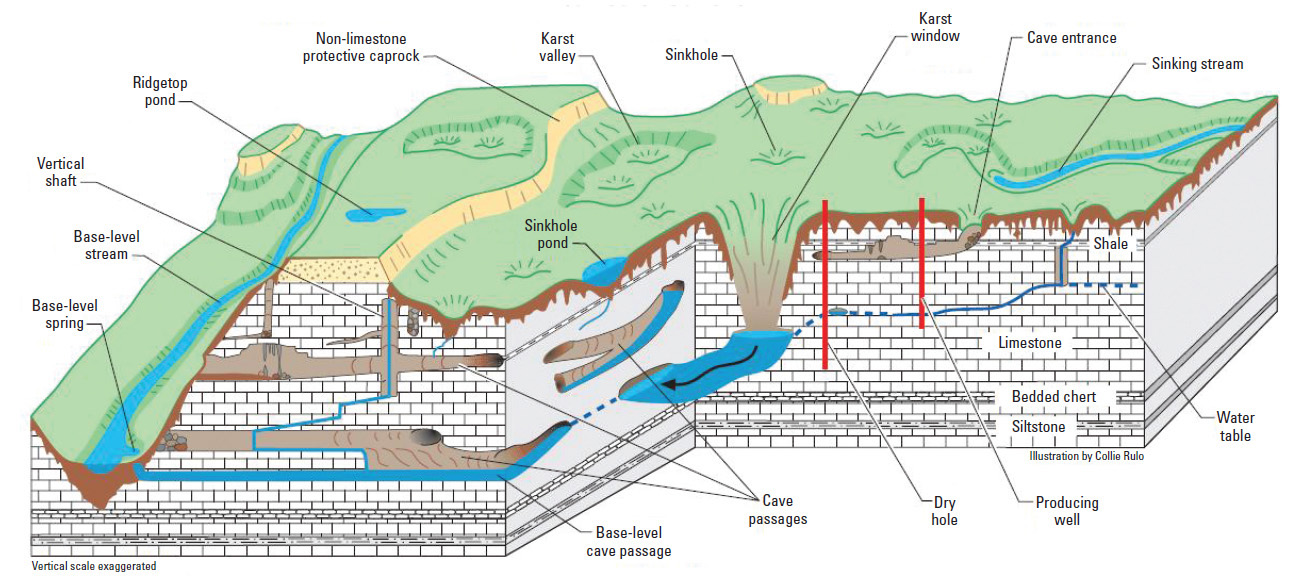
Did you know water can sometimes dissolve rock? Karst is a type of rocky feature such as a cave or sinkhole that forms in dissolvable rocks. Karst creates pathways that can carry water quickly from the land surface directly to underground aquifers. Karst landscapes cover about 16 percent of the Earth’s land surface, including most of the Colorado Plateau around Flagstaff and the Grand Canyon. It’s an important geologic feature that most of us have never heard of.
Karst aquifers, which have a pipe-like flow network of caves and conduits, directly supply up to 25 percent of the world population with water for drinking, agriculture and other needs and they are uniquely vulnerable to contamination. Two such aquifers, the Redwall and Coconino aquifers, supply water to Roaring Springs and many other Grand Canyon springs. The two aquifers are stacked on top of each other. While there are many types of vulnerability models, most ignore the complication of layered karst aquifer systems; this results in oversimplified, less accurate modeling.
“Vulnerability models identify regions of high, moderate and low vulnerability on the land surface, which directly relates to how quickly and efficiently water or contaminants would sink and enter the aquifer,” Jones said. “However, existing well-regarded vulnerability modeling methods for karst aquifers did not produce realistic results for our region.”
How does the modeling work?
Jones modified the well-known concentration-overburden-precipitation method (COP). This method is effective, the researchers say, but it oversimplifies some details, which limits the model. She presented two new models that better address the factors that help scientists predict vulnerability.
The modifications more accurately account for recharge patterns in the Grand Canyon region, which has many karst features and a deep, complex aquifer system. Jones and the research team automated a process to identify sinkholes from high-resolution topography data, converted those data into sinkhole densities, and combined those data with a map of fault locations in the region. Jones then incorporated these features into the existing model using a geographic information system to produce the final vulnerability model.
It meant significant data processing, but the result was a model that produced greater resolution of vulnerability regions and fit well with previous groundwater flow path analyses. In addition to creating a better model on which future research can build, Jones found similar patterns in vulnerability between the two karst aquifers in the Grand Canyon region, despite them being separated by more than 600 meters of impermeable rock.
Jones also learned that about a fifth of the Kaibab Plateau has high vulnerability to contamination of the Redwall-Muav aquifer, which is about 1,000 meters deep, and almost half of the plateau surface (45.6 percent) has high to very high vulnerability for the Coconino aquifer, which is much closer to the surface.
What does this mean for me?
If you’ve stopped to fill your water bottle while you’re hiking the Grand Canyon or admiring the views on the canyon rim, this matters to you. Since the Roaring Springs is the only source of water in the park, its quality has significant value. This research provides better information to water managers to protect the Grand Canyon’s water resources, including creeks on the north side, which researchers think are recharged by the Kaibab Plateau.
“These springs and streams support diverse ecosystems, and many hikers and wildlife rely on them for survival,” Jones said. “This research helps narrow down where these water sources are coming from and could help us better protect them in the future.”
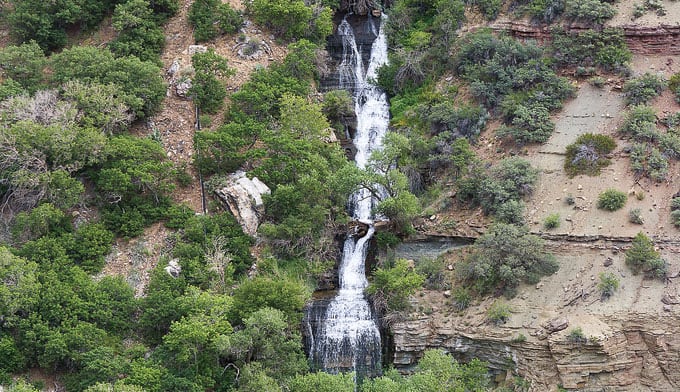
Roaring Springs Waterfall along North Kaibab Trail. Photo by Whit Richardson via MyGrandCanyonPark.com