Assessing the U.S. Climate in April 2020 — @NOAA

Near-average April across the contiguous U.S. for temperature and precipitation

Photo credit: Pixabay via NOAA

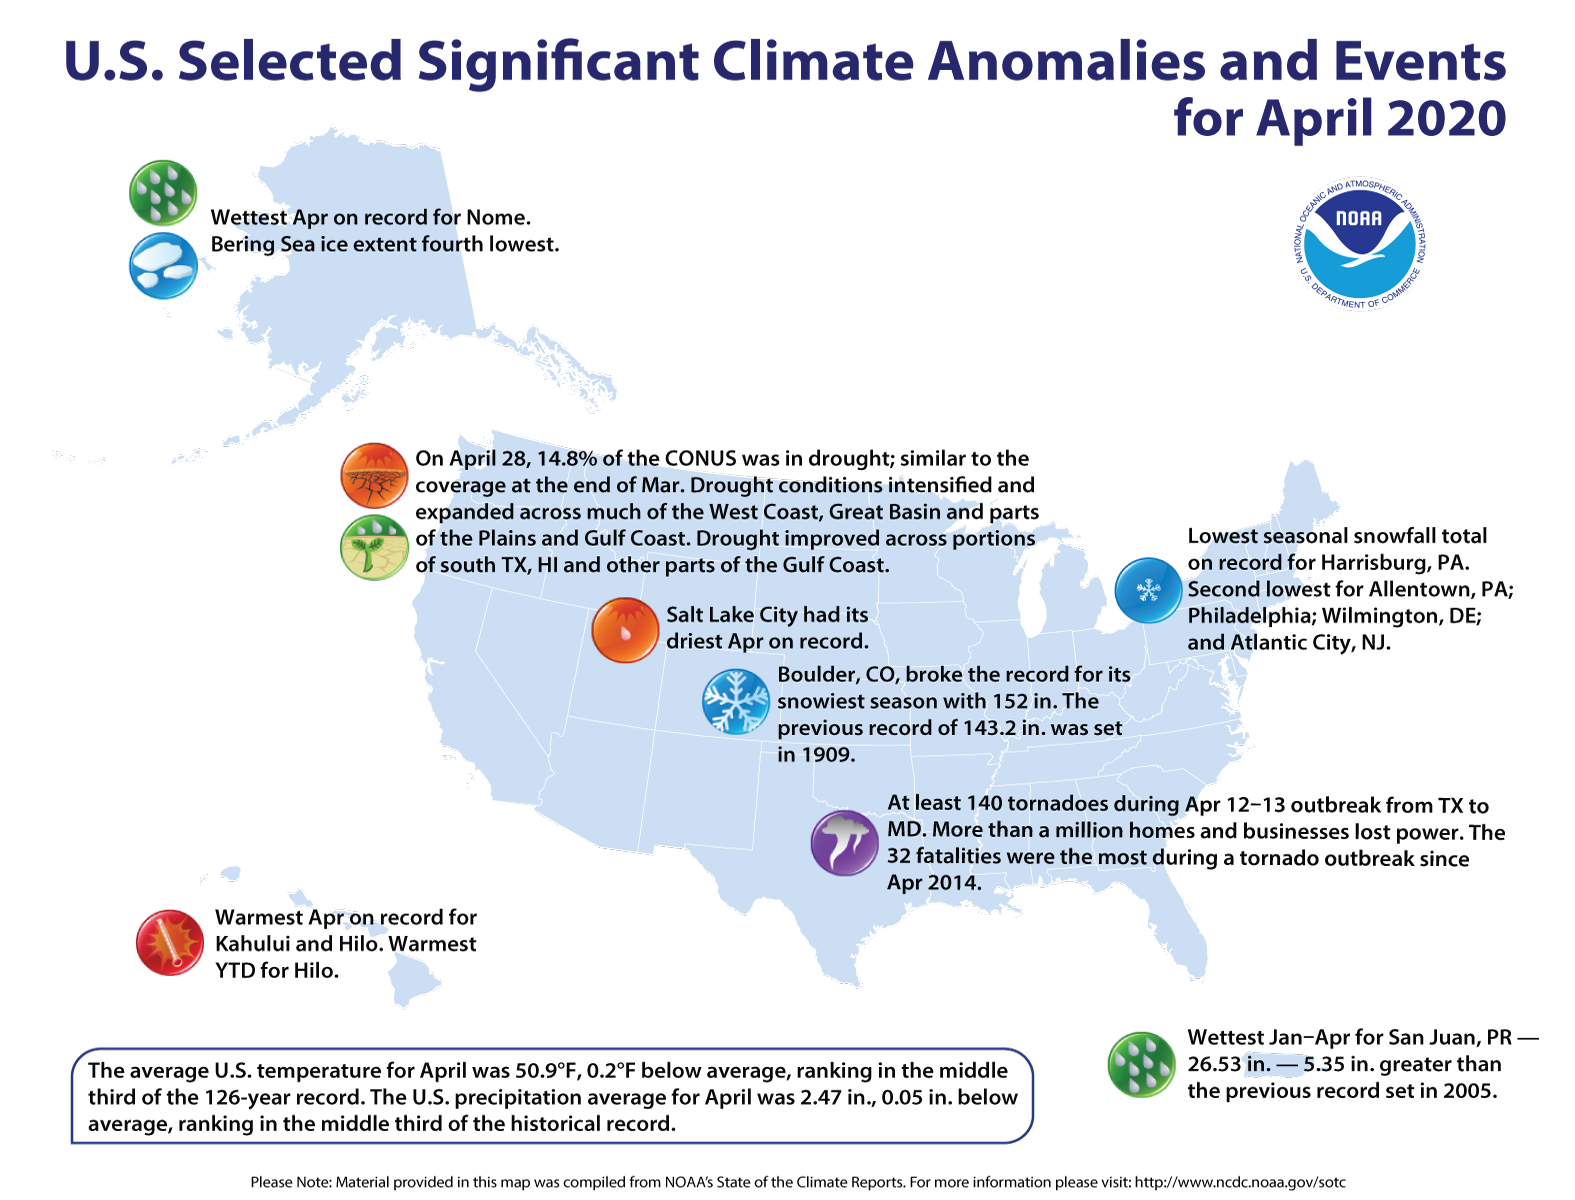
The most notable event during the month was an outbreak of at least 140 tornadoes from Texas to Maryland mid-month — the deadliest such event since 2014.

During April, the average contiguous U.S. temperature was 50.9°F, 0.2°F below the 20th-century average. This ranked in the middle third of the 126-year period of record. The year-to-date (January-April) average contiguous U.S. temperature was 42.2°F, 3.0°F above average, ranking 10th warmest on record. The April precipitation total for the contiguous U.S. was 2.47 inches, 0.05 inch below average, and ranked in the middle third of the 126-year period of record. The year-to-date precipitation total was 10.53 inches, 1.06 inch above average and ranked in the wettest third of the January-April record.

This monthly summary from NOAA National Centers for Environmental Information is part of the suite of climate services NOAA provides to government, business, academia and the public to support informed decision-making.

April Temperature

  • Above-average temperatures were observed across much of the West Coast and Southwest as well as portions of the Gulf Coast and Florida. Florida ranked sixth warmest on record for April.
    • Miami experienced its warmest April on record with an average temperature of 81.9°F. The previous record was 80.4°F set in 2015. In fact, April 2020 was warm enough to rank fifth warmest among all average temperature values on record for May.
  • A large portion of the contiguous U.S., from the northern Rockies to the Great Lakes and from the southern Plains to the Northeast, experienced below-average temperatures.
  • The Alaska April temperature was 27.5°F, 4.2°F above the long-term average. This ranked in the warmest third of the 96-year period of record for the state. On average, the North Slope, West Coast, Bristol Bay and Aleutian divisions had temperatures that were much-above average, while the southeast mainland and Panhandle regions were near to below average for the month.
    • Utqiaġvik reported a record low temperature of −20°F on April 29. This is the first record low temperature reported at this station since December 21, 2007, and is the latest in the season with a low temperature of −20°F or colder.
  • Bering Sea ice cover for April was greater than the extent observed in both 2018 and 2019, but was still fourth lowest on record.

April Precipitation

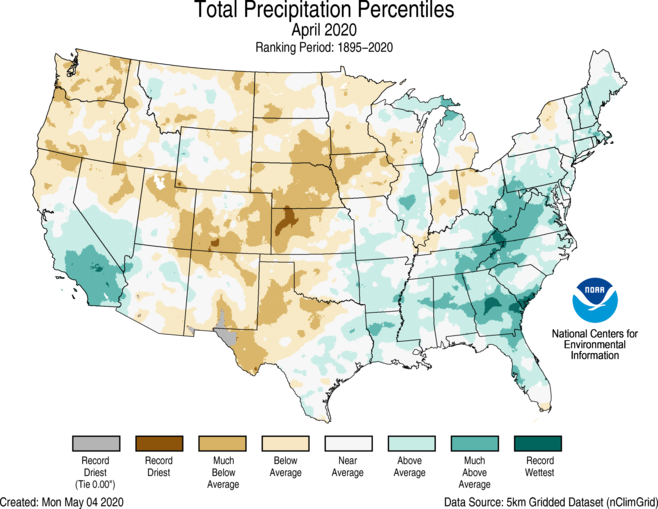
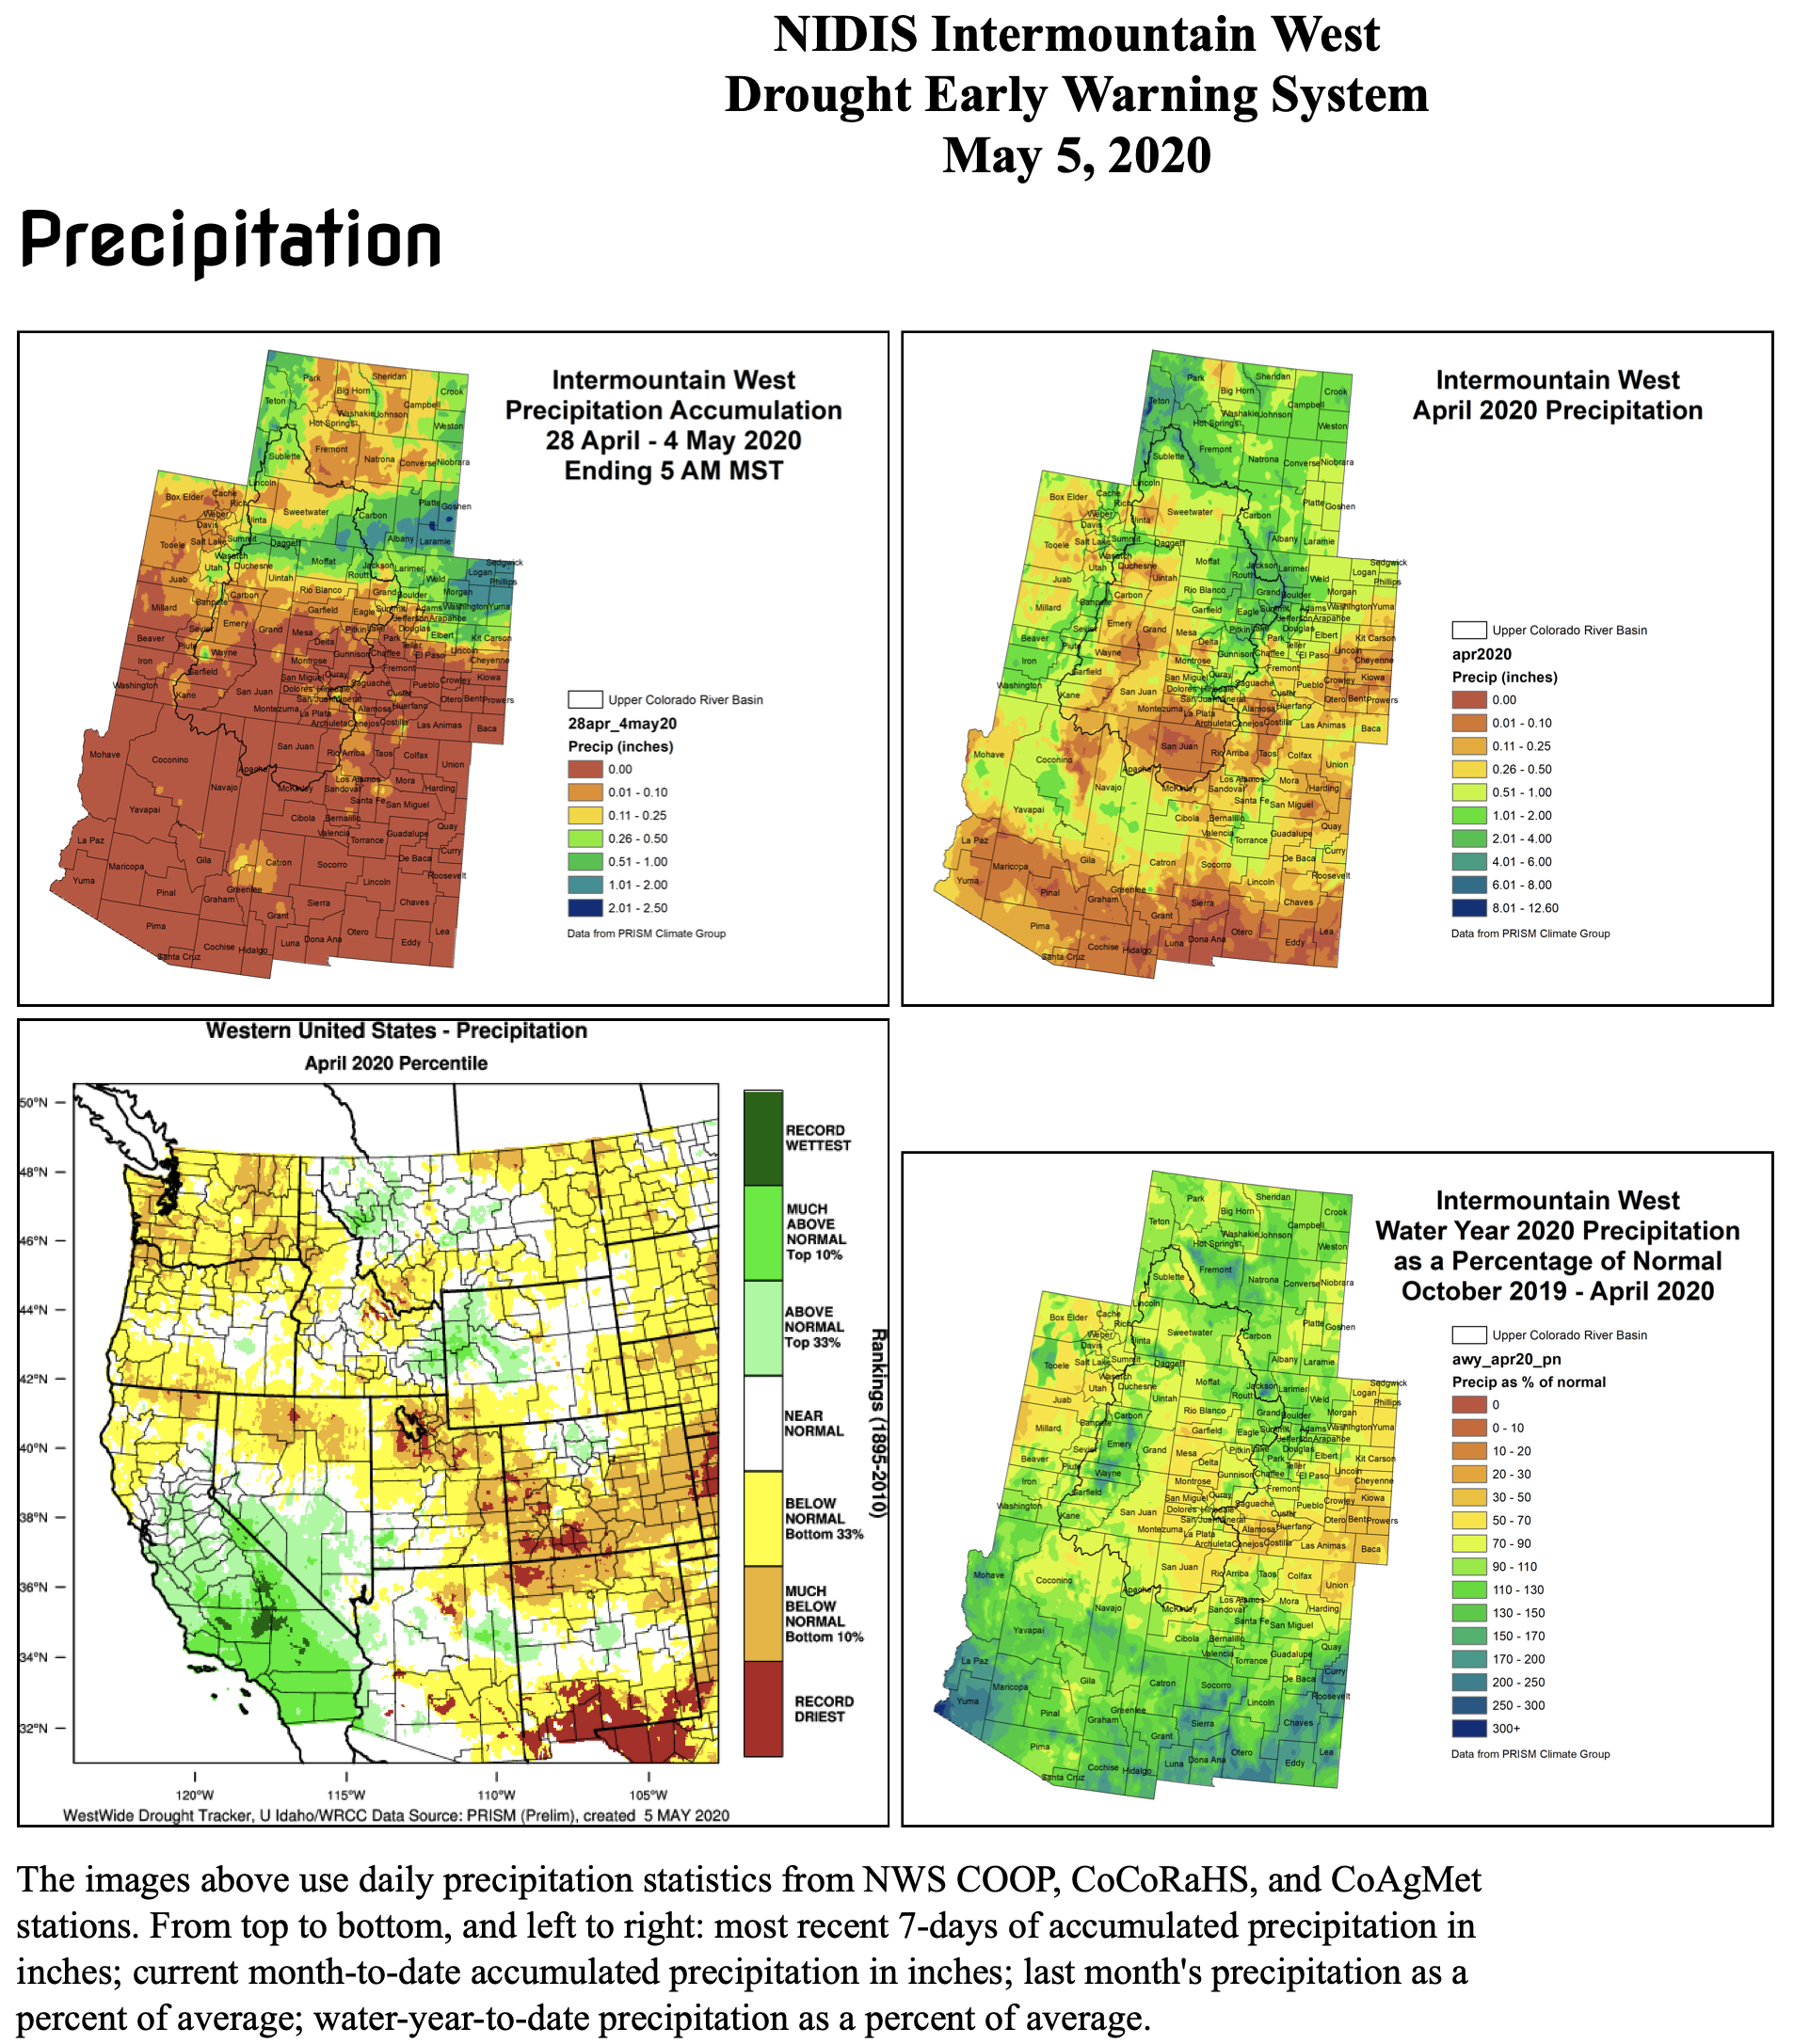
  • Above-average precipitation was observed across parts of the West, lower Mississippi Valley, Great Lakes, Southeast, Mid-Atlantic and New England. West Virginia ranked fifth wettest while Virginia and Georgia ranked sixth wettest April on record.
    • With 16.9 inches of snowfall reported on April 16, Boulder broke the record for its snowiest season. For the season and through the end of April, Boulder received 152 inches of snow, surpassing the record of 143.2 inches set in 1909.
    • Rapid City, South Dakota, had its second snowiest season on record in 2019-2020 with 86.9 inches of snow. The record of 90.2 inches occurred during the snow season of 2008-2009. The third snowiest season occurred a year ago during 2018-2019.
  • Below-average precipitation was observed from the Pacific Northwest to the western Great Lakes and from the Southwest through central Texas to the Canadian border. Nebraska and Colorado ranked sixth driest for April while Washington state ranked 13th driest.
    • Salt Lake City had its driest April on record with 0.26 inch for the month, breaking the previous record of 0.45 inch set back in 1981 and 1934.
  • April is climatologically either the driest or second driest month of the year across Alaska. Precipitation received during April 2020 was three to five times the average value in many locations and ranked in the wettest one-third of the historical record for the state. For some interior locations, this exacerbated an already above-average snow pack season.
    • Nome received a record 2.47 inches of precipitation for the month of April, breaking the previous record of 2.15 inches set in 1961.
    • Nome had its wettest March-April on record and Fairbanks its second wettest.
    • Snowpack was at or near record levels at some locations from the upper Kuskokwim River to the Alaska Range. This helped raise water levels on some of the largest Alaskan rivers.
  • According to the April 28 U.S. Drought Monitor report, 14.8 percent of the contiguous U.S. was in drought, up slightly from 14.5 percent at the end of March. Drought conditions intensified and expanded across much of the West Coast, Great Basin and parts of the Plains and Gulf Coast. Drought improved across portions of south Texas, Hawaii, and other parts of the Gulf Coast.

April Extremes

  • A notable ridge of high pressure in the Gulf of Alaska mid-month contributed to the large trough of low pressure over the Central U.S. This was accompanied by a big cold-air outbreak across the central Plains.
    • On the leading edge of the trough was a strong cold front, which brought significant precipitation across much of the Southeast and was accompanied by severe weather, including the Easter Sunday/Monday tornado outbreak on April 12–13.
    • Based on preliminary surveys and analysis, 140 tornadoes have been confirmed from Texas to Maryland: 3 EF4s, 12 EF3s, 20 EF2s, 77 EF1s and 28 EF0s.
    • More than a million homes and businesses lost power. With 32 tornado-related fatalities reported, this was the deadliest tornado outbreak since April 27–30, 2014.

Year-to-date (January-April) Temperature

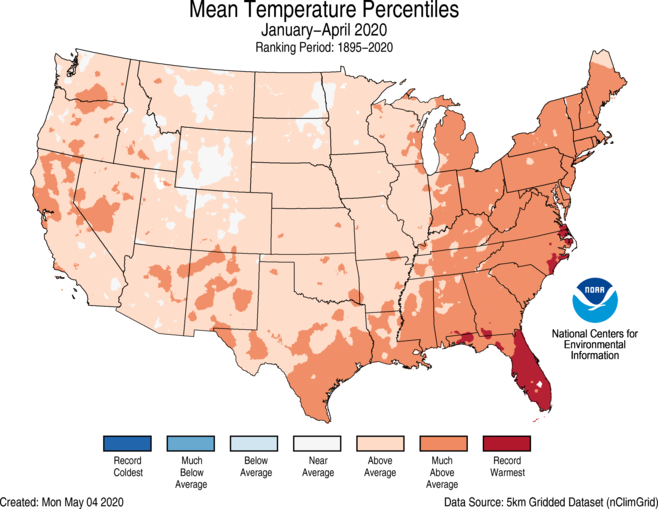
  • Above-average to record-warm temperatures blanketed most of the Lower 48. Florida ranked warmest on record for the first four months of the year with 12 additional states from the Deep South to New England experiencing a top-five warmest January-April period.
  • The Alaska January-April temperature was 8.7°F, 1.6°F below the long-term average and ranked in the coldest one-third of the record. Below-average temperatures blanketed an area from the Central Interior to the Northeast Gulf and westward into the Bristol Bay division. A small portion of the Aleutians ranked above average during this time.

Year-to-date (January-April) Precipitation

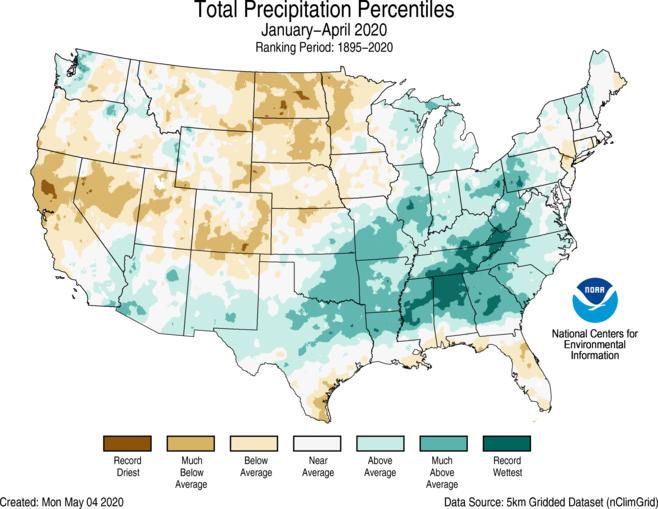
  • Above-average precipitation stretched from parts of the Southwest to the Southeast and from the Tennessee Valley to the Great Lakes and into portions of the Northeast. Tennessee ranked wettest for this four-month period while West Virginia and Alabama ranked second and third wettest on record, respectively.
  • Below-average precipitation was observed from the West Coast, across the central Rockies and into the northern Plains as well as across portions of the Gulf Coast and Florida. North Dakota ranked fourth driest for the first four months of the year, while South Dakota ranked 10th driest.
  • Harrisburg, Pennsylvania, reported its lowest seasonal snowfall total on record — second lowest for Philadelphia and Allentown, Pennsylvania; Wilmington, Delaware; and Atlantic City, New Jersey.
  • San Juan, Puerto Rico, received above-average precipitation again in April. The airport received a total of 26.53 inches of precipitation for the period January-April — the wettest such period on record and 5.35 inches greater than the previous record set in 2005.
  • The (March-April) snowfall total for Fairbanks, Alaska, through April 30, is 35.4 inches. This is more than four times the average amount and ties with 1963 as the third highest spring total on record. The current March-April record is held by 1918 with 40 inches of snow.

@ColoradoClimate: Weekly #Climate, #Water and #Drought Assessment for the Intermountain West

Click here to read the current assessment. Click here to go to the NIDIS website hosted by the Colorado Climate Center. Here’s the summary:

Summary: May 5, 2020

Dryness prevailed through most of the Intermountain West Region in April. Must of western and southern Colorado saw the driest or one of the driest Aprils on record. Northern Utah also got in on the extreme dryness that was April 2020 with the Salt Lake area seeing some of their lowest April precipitation amounts on record. For both Utah and Colorado, this was an inopportune time to see this much dryness since April is still a wetter month of the year. Continuing with the dry theme of the week, eastern Colorado started off the growing season with much below normal precipitation. Some wetter spots in the IMW region included north-central Colorado, northwestern Wyoming, and parts of Arizona and New Mexico, see normal or above-normal precipitation.

The first week of May has seen the dry pattern continue except for northern Colorado and southeastern Wyoming where thunderstorm season has started up. Precipitation amounts ranging from 1.00 to over 2.00 inches has fallen over northeast Colorado and southeast Wyoming. The rest of the IMW saw little to no precipitation.

Typically by this time of year the snowpack season is in full snowmelt form with the occasional May storm that brings a pause to melt and a small increase in the snowpack. This means we have passed the peak snowpack of the year. Most of the IMW saw near normal peaks, with many on the lower end of normal. With little snow in April and a quick warmup, the snowpack is melting quickly.

The quick snowmelt means streamflows are starting to come up. Most of the streams with above normal flows means the snow is melting quicker and earlier than normal. We are seeing above normal flows in the headwaters of the Colorado River and the Yampa River. However, we are also seeing below normal flows on the White, Colorado, Gunnison, San Miguel, and San Juan Rivers. Our three main sites are barely in the normal flow range.

Temperatures for April were not as bad as most years with the dryness we’ve seen. Most of the northern portion of the IMW region saw below normal temperatures and the southern portion saw near normal temperatures, with some isolated warmer spots. One of the areas much above normal is southwestern Colorado and the Rio Grande River Basin, which did not help the lack of snowfall. More recently, the last week’s temperatures across the IMW have been 6+ degrees F above normal.

Little precipitation is forecast to hit our region with small amounts in the higher elevations. The 8-14 day outlook is hinting at chances of above normal precipitation with New Mexico looking dry.

#ColoradoRiver keeps flowing — so do concerns about its future — The Grand Junction Daily Sentinel #COriver #aridification #COWaterPlan

Palisade is just east of Grand Junction and lies in a fertile valley between the Colorado River and Mt. Garfield which is the formation in the picture. They’ve grown wonderful peaches here for many years and have recently added grape vineyards such as the one in the picture. By inkknife_2000 (7.5 million views +) – https://www.flickr.com/photos/23155134@N06/15301560980/, CC BY-SA 2.0,

Here’s a guest column from Hannah Holm that’s running in The Grand Junction Daily Sentinel:

It seems like the pandemic has soaked up most of the newsprint lately, but even now, when so much has come to a standstill, our rivers keep flowing. As Jim Pokrandt pointed out in a recent op-ed, our canals have started flowing, too, as Grand Valley farmers begin the annual ritual of putting water on the land to reap a harvest, and an income, later in the year.

Another annual ritual, monitoring the forecasts for how much spring snowmelt will flow down the rivers, has also begun. This year, we have an above-average snowpack in the mountains that feed the Colorado River, but below-average runoff into Lake Powell is expected. Parched soils from last year’s dry summer are expected to soak up much of the water before it can make it into the river.

If that forecast proves accurate, it will mark the 15th time in 20 years in which runoff into Lake Powell has been below average. This is one more piece of data to support the conclusion that the Colorado River is shrinking. Coming to terms with this fact is the central challenge facing all who depend on the Colorado River — about 40 million people throughout the Southwest.

A shrinking river is a particularly hard to adapt to when it is already being completely used up — the Colorado River rarely reaches the sea any more, and its major reservoirs are less than half full. So how, and what, are we doing? Here’s a rundown of a few things that are happening.

Downstream, California, Arizona and Nevada agreed to a detailed schedule of water delivery cuts triggered by different water levels in Lake Mead. This is the first year they are taking reduced deliveries.

Here in Colorado, along with Wyoming, Utah and New Mexico, water leaders are continuing to study “demand management:” paying water users to temporarily leave some of the water they are entitled to in the river. State-sponsored work groups on demand management are hashing out technical details on financing, legal issues, how to measure saved water, and the potential economic and environmental impacts of different approaches. You can learn more about these discussions here: https://cwcb.colorado.gov/demand-management.

In related efforts, scientists and ranchers are about to start working together in Grand County to figure out what happens to high-elevation hay fields if you take a pause on irrigating them. This will help ranchers determine whether they might want to participate in demand management or not. Other studies are also looking at the potential impacts on communities of reductions in irrigated agriculture.

Scientists are also working hard to refine their tools for understanding and forecasting water supplies. A new report from Western Water Assessment at CU-Boulder synthesizes information from nearly 800 studies and reports on Colorado River Basin science and hydrology. If you are interested, you can check it out at https://wwa.colorado.edu/.

So far, we’re mostly studying different options for cutting back our water use from the Colorado River, without many people actually having to do it yet. But if current trends continue, which long-term projections indicate that they will, that day will come.

Any change is hard, and abrupt change is especially hard. Abrupt change without data is terrifying, as we’ve recently learned. The good thing about the troubling situation on the Colorado River is that we don’t have to suffer the terror of change without data. The bad thing about the situation on the Colorado River is that we can’t study our way out of actually having to do something about it — sooner or later. [ed. emphasis mine]

Hannah Holm coordinates the Hutchins Water Center at Colorado Mesa University, which promotes research, education and dialogue to address the water issues facing the Upper Colorado River Basin. Support for Hutchins Water Center articles is provided by a grant from the Walton Family Foundation. You can learn more about the center at http://www.coloradomesa.edu/water-center.

Hayfield message to President Obama 2011 via Protect the Flows