A strong area of mid-level high pressure, anchored over the southern tier of the country, continued to promote above-normal temperatures and mostly dry weather across the Rio Grande Valley, Texas, and the lower Mississippi Valley. Weekly temperatures (August 2 to 8) averaged more than 6 degrees F above normal across portions of Louisiana, Texas, and southern New Mexico. The persistence of this pattern led to rapidly developing and intensifying drought across Texas and the lower Mississippi Valley. The Monsoon remains suppressed with increasing short-term drought across Arizona, New Mexico and southwest Colorado. Frequent rounds of heavy rainfall occurred from the central Great Plains southeastward to the middle Mississippi Valley. During the first week of August, parts of Missouri received 5 to 10 inches (locally more) of rainfall. The wet start to August resulted in improving drought across parts of the Corn Belt. Farther to the north, drought continues to intensify across Wisconsin. On August 7, a severe weather outbreak with heavy rainfall affected the East. Short-term drought expanded this past week across parts of the Hawaiian Islands…
Above normal precipitation since the beginning of July and a lack of support from the long-term indicators led to a 1-category improvement to west-central Nebraska and bordering areas of Kansas. Recent beneficial precipitation also resulted in improving conditions across parts of the Dakotas and Wyoming. Short-term drought was expanded across northeast North Dakota which remained to the north of the storm track. The lack of Monsoon rainfall this summer resulted in the addition of short-term drought to southwestern Colorado…
Colorado Drought Monitor one week change map ending August 8, 2023.
The suppressed Monsoon and associated above-normal temperatures resulted in a 1-category degradation across Arizona and New Mexico. Recent rainfall supported a decrease in abnormal dryness (D0) in southeast Montana, while a 1-category degradation was made to parts of northern Montana based on worsening short-term indicators. Following 1-category degradations to parts of Oregon and Washington the previous week, no changes were made…
Increasing 30 to 60-day precipitation deficits coupled with excessive heat and high evapotranspiration rates support a widespread 1-category degradation across Texas, Louisiana, and southwest Mississippi. 30 to 60-day SPI/SPEI, NDMC’s short-term blend, and soil moisture were leaned on for these degradations. During the past two months, temperatures have averaged 2 to 6 degrees F above normal across parts of Texas and Louisiana. Heavy rainfall (more than 2 inches) resulted in a 1-category improvement to northern and eastern Oklahoma along with parts of Tennessee…
Looking Ahead
According to the Weather Prediction Center (WPC), during the next five days (August 10 – 14, 2023), moderate to heavy precipitation (0.5 to 2 inches, locally more) is forecast for the Midwest, Ohio and Tennessee Valleys, and Northeast. Farther to the south, little to no precipitation and above-normal temperatures are forecast to persist across the lower Mississippi Valley and Texas. Scattered thunderstorms may result in local amounts in excess of 0.5 inches for the Four Corners region. A warming trend is expected for the Pacific Northwest and intermountain West during mid-August.
The Climate Prediction Center’s 6-10 day outlook (valid August 15 – 19, 2023) depicts large probabilities (more than 60 percent) for above-normal temperatures throughout much of the West, southern Great Plains, and Gulf Coast. Probabilities for above-normal temperatures decrease farther to the north with a slight lean towards below-normal temperatures across the northern Great Plains. Above-normal precipitation is slightly favored across the northern Rockies, northern Great Plains, upper Mississippi Valley, and New England, while below-normal precipitation is more likely across the southern Great Plains and lower Mississippi Valley.
US Drought Monitor one week change map ending August 8, 2023.
Much of the water in the Colorado River Basin and to areas where it is exported outside the basin gets used for growing grass of one type or another. A hay meadow near Kremmling, Colo., August 2016. Photo: Allen Best
Click the link to read the assessment on the NOAA website:
Key Points:
Heat waves impacted much of the U.S. in July and brought record temperatures to parts of the Southwest. The region as a whole tied with 2003 as the warmest July on record.
Much of the eastern U.S. has been consistently warmer than average during 2023 with 28 states experiencing a top-10 warmest January–July including Florida, which ranked warmest on record.
A total of 15 billion-dollar weather and climate disasters have been confirmed this year—the most events since 1980 for the January-July period. These consisted of 13 severe storm events, one winter storm and one flooding event.
This July was the 11th warmest on record for the nation, while precipitation ranked in the middle third of the historical record.
Other Highlights:
Temperature
July overnight temperatures were warmest on record across the New England region. The average temperature of the contiguous U.S. in July was 75.7°F, 2.1°F above average, ranking 11th warmest in the 129-year record. Generally, July temperatures were below average in the central and northern Plains and Upper Midwest. Temperatures were above average from the West Coast to the southern Plains and along the Gulf and East coasts and in parts of the Great Lakes. Arizona, New Mexico, Maine and Florida ranked warmest on record for July while Louisiana ranked second warmest on record. An additional 13 states ranked among their top-10 warmest July on record.
The Alaska statewide July temperature was 56.1°F, 3.4°F above the long-term average, ranking fifth warmest in the 99-year period of record for the state. Above-normal temperatures were observed across most of the state while pockets of near-average temperatures were observed in south central and southwestern portions of the state.
For the January–July period, the average contiguous U.S. temperature was 53.0°F, 1.7°F above average, ranking 16th warmest on record for this period. Temperatures were above average from the southern Plains to the East Coast and along parts of the Northern Tier, with near- to below-average temperatures from the northern Plains to the West Coast. Florida ranked warmest on record while Massachusetts, Connecticut, New Jersey, Delaware, Maryland, Mississippi and Louisiana each ranked second warmest for the January–July period. An additional 20 states had a top-10 warmest year-to-date period. No state experienced a top-10 coldest event for this seven-month period.
The Alaska January–July temperature was 27.6°F, 1.8°F above the long-term average, ranking in the warmest third of the historical record for the state. Much of the state was above normal for the seven-month period while temperatures were near average across much of the Interior and West Coast.
Precipitation
July precipitation for the contiguous U.S. was 2.70 inches, 0.08 inch below average, ranking in the middle third of the historical record. Precipitation was below average across much of the West and in parts of the northern and southern Plains, Upper Mississippi Valley and Southeast. Precipitation was above average across much of the Northeast, the Great Lakes and in central parts of the Plains and Mississippi Valley. Idaho, Arizona and Minnesota each had their third-driest July on record, while two additional states had a top-10 driest July on record. Conversely, Vermont and Connecticut ranked second wettest for the month with seven additional states ranking among their top-10 wettest July on record.
Across the state of Alaska, the average monthly precipitation was 3.51 inches, ranking in the middle third of the historical record. Conditions were wetter than average across most of the state while parts of the North Slope were near normal during the month. Below-normal precipitation was observed in parts of the Southeast Interior and Panhandle while parts of the Northeast Gulf had their driest July on record.
The January–July precipitation total for the contiguous U.S. was 18.41 inches, 0.32 inch above average, ranking in the middle third of the 129-year record. Precipitation was near to above average from California to the western Great Plains, Northeast, and in parts of the southern Mississippi Valley, northern Great Lakes and Southeast. New Hampshire had its fifth wettest year-to-date period on record while two additional states ranked among their top-10 wettest for this period. Conversely, precipitation was below average across parts of the Northwest, eastern Plains, Southwest, central Mississippi Valley, Mid-Atlantic and along parts of the Gulf during the January–July period. Maryland had its 10th-driest January–July on record.
The January–July precipitation ranked 15th wettest in the 99-year record for Alaska, with above-average precipitation observed across much of the state. Near-normal precipitation was observed in parts of south-central Alaska, Southeast and in parts of the Aleutians during this period.
Billion-Dollar Disasters
Three new billion-dollar weather and climate disasters were confirmed this month, two of which occurred during the month of June and one during April. All of these disasters were severe storm events.
There have been 15 confirmed weather and climate disaster events, each with losses exceeding $1 billion this year. These disasters consisted of 13 severe storm events, one winter storm and one flooding event. For this year-to-date period, the first seven months of 2023 rank highest for disaster count, ahead of 2017 with 14 disasters. The total cost of these events exceeds $39.7 billion, and they have resulted in 113 direct and indirect fatalities.
The U.S. has sustained 363 separate weather and climate disasters since 1980 where overall damages/costs reached or exceeded $1 billion (including CPI adjustment to 2023). The total cost of these 363 events exceeds $2.590 trillion.
Other Notable Events
A series of heat waves brought record-breaking temperatures to portions of the U.S. during July:
July was the warmest month on record for Arizona and New Mexico by nearly 2°F.
Across the Southwest, 36 counties each had their warmest July on record while an additional 63 counties ranked in the top-10 warmest for the month.
Phoenix, Arizona had an average temperature of 102.8°F for the month of July—the hottest month on record for any U.S. city. Contributing to the record, Phoenix had 31 consecutive days of temperatures above 110°F from June 30 to July 30—breaking the previous record of 18 days set in 1974.
On July 16, Death Valley soared to 128°F, setting a daily-temperature record, and reported its hottest midnight temperature on record at 120°F on July 17.
Several notable weather systems produced severe storms that impacted portions of the U.S. in July:
On July 10, severe storms brought devastation and flooding to portions of the Northeast, as areas reported up to eight inches of rain within a 24-hour period. Montpelier, Vermont received a record-breaking 5.28 inches of rain, flooding the city and damaging thousands of homes and businesses.
On July 18-19, a historic flash flood occurred over portions of Kentucky and Illinois after areas received rainfall totals up to 12 inches, causing significant damage and trapping residents in their homes. Mayfield, Kentucky received 11.28 inches of rain in a 24-hour period, likely breaking the state record for 24-hour rainfall.
On July 24-25, an extreme thunderstorm outbreak produced more than 19,000 lightning strikes causing dozens of new wildfires in the state of Alaska. Overall, 2023 ranks as the second-lowest fire season, by acres burned, in the past 30 years for the state.
US Drought Monitor map August 1, 2023.
Drought
According to the August 1 U.S. Drought Monitor report, about 28.1% of the contiguous U.S. was in drought, up about 1.2% from the beginning of July. Moderate to exceptional drought was widespread across much of the Great Plains, with moderate to extreme drought in much of the Midwest and Florida Peninsula. Moderate to severe drought was present in parts of the Northwest, Southwest, southern Mississippi Valley, Mid-Atlantic, Michigan and Puerto Rico as well as moderate drought in parts of the Northeast and Alaska.
Drought conditions expanded or intensified along the Northern Tier, Upper Midwest, Southwest, southern Plains, Alaska and Puerto Rico during July. Drought contracted or was reduced in intensity across portions of the central Plains, Great Lakes, Ohio Valley, Northeast and in parts of the Great Basin.
Monthly Outlook
According to the July 31 One-Month Outlook from the Climate Prediction Center, much of the southern contiguous U.S., Pacific Northwest and Alaska favor above-normal monthly average temperatures in August, with the greatest odds along the Gulf Coast. The best chances for below-normal temperatures are forecast for the northern parts of the Rockies and Plains and in the Northeast. Much of the northern Rockies to the Mid-Atlantic and Northeast are favored to see above-normal monthly total precipitation whilebelow-normal precipitation is most likely to occur from eastern Arizona to the Florida Panhandle, as well as southwestern and southeastern Alaska.Drought improvement or removal is forecast from the central Plains to parts of the Great Lakes and in parts of the Mid-Atlantic, Florida and Puerto Rico, while persistence is more likely in portions of the Northwest, Southwest, southern Plains, northern Great Lakes and parts of the northern Plains and Hawaii. Drought development is likely in parts of the Northwest, Southwest, southern Plains and Hawaii.
According to the One-Month Outlook issued on August 1 from the National Interagency Fire Center, Hawaii and portions of the Northwest, Upper Midwest, Southwest, southern Plains, Lower Mississippi Valley, Southeast and eastern Alaska have above-normal significant wildland fire potential during August, while parts of California are expected to have below-normal potential for the month.
This monthly summary from NOAA’s National Centers for Environmental Information is part of the suite of climate services NOAA provides to government, business, academia and the public to support informed decision-making. For more detailed climate information, check out our comprehensive July 2023 U.S. Climate Report scheduled for release on August 11, 2023. For additional information on the statistics provided here, visit the Climate at a Glance and National Maps webpages.
Buried methane gas lines. Photo credit: Allen Best/Big Pivots
Click the link to read the article on the Big Pivots website (Allen Best):
Colorado is starting another chapter in what could be a future history book, “How We Decarbonized our Economy.”
In that book, electricity will be the easy part, at least the storyline through 80% to 90% reduction in emissions. That chapter is incomplete. We may not figure out 100% emissions-free electricity on a broad scale for a couple more decades.
This new chapter is about tamping down emissions associated with buildings. This plot line will be more complicated. Instead of dealing with a dozen or so coal plants, we have hundreds of thousands of buildings in Colorado, maybe more. Most burn natural gas and propane to heat space and water.
I would start this chapter on August 1. Appropriately, that’s Colorado Day. It’s also the day that Xcel Energy and Colorado Springs Utilities will deliver the nation’s very first clean-heat plans to state regulators.
Those clean heat plans, required by a 2021 law, will tell state agencies how they intend to reduce emissions from the heat they sell to customers. The targets are 4% by 2025 and 22% by 2030.
Wishing I had a sex scandal to weave into this chapter or at least something lurid, maybe a conspiracy or two. Think Jack Nicholson and Faye Dunaway in “Chinatown.”
Arguments between utilities and environmental advocates remain polite. Both sides recognize the need for new technologies. The disagreements lie in how best to invest resources that will pay off over time.
The environmental groups see great promise in electrification, particularly the use of air-source heat pumps. Heat pumps milk the heat out of even very cold air (or, in summer, coolness from hot air).
Good enough for prime time? I know of people in Avon, Fraser, and Gunnison who say heat-pumps deliver even on the coldest winter days.
Xcel says that heat pumps have a role—but cautions that cold temperatures and higher elevations impair their performance by about 10% as compared to testing in coastal areas. They will need backup gas heat or electric resistance heating. After two winters of testing at the National Research Energy Laboratory in Golden, the testing of heat pumps will move to construction trailers set up in Leadville, Colorado’s Two-Mile City next winter.
Xcel also frets about adding too much demand, too quickly, to the electrical grid.
Another, perhaps sharper argument has to do with other fuels that would allow Xcel to use its existing gas pipelines. Xcel and other gas utilities have put out a request for renewable natural gas, such as could be harvested from dairies. Xcel also plans to create hydrogen from renewable resources, blending it with natural gas. It plans a demonstration project using existing infrastructure in Adams County, northeast of Denver.
Jeff Lyng, Xcel Energy’s vice president for energy and sustainability policy, talks about the need for a “spectrum of different approaches.” It is far too early, Lyng told me, to take any possible technology off the table.
In a 53-page analysis, Western Resource Advocates sees a greater role for weatherization and other measures to reduce demand for gas. It sees renewable gas, in particular, but also hydrogen, as more costly and slowing the broad market transformation that is necessary.
“I think there’s a real tension that came out between different visions of a low-carbon future when it comes to the gas system,” Meera Fickling, an economist with WRA, told me.
We already have a huge ecosystem of energy, a huge investment in natural gas. Just think of all the natural gas lines buried under our streets. No wonder this transition will be difficult.
“It’s more difficult because everything you do in the gas sector now has a spillover effect in the electric sector,” says Jeff Ackermann, the former chair of the Colorado Public Utilities Commission. “Each of these sectors moves in less than smooth, elegant steps. We don’t want people to fall off one and onto the other and get lost in the transition. There has to be sufficient energy of whatever type.”
Getting back to the book chapter. Colorado has nibbled around the edges of how to end emissions from buildings. With these proceedings, Colorado is moving headlong into this very difficult challenge. The foreplay is done. It’s action time.
Xcel talks about a decades-long transition and stresses the need to understand “realistic limitations in regard to both technologies and circumstances.”
Keep in mind, 25 years ago, it had little faith in wind and even less in solar.
Do you see a role for Jack Nicholson in hearings and so forth during the next year? I don’t. Even so, it promises to be a most interesting story.
The shiny new cold-weather heat pump recently installed at Coyote Gulch Manor.
Beavers have constructed a network of dams and lodges on this Woody Creek property. Pitkin County is betting big on beavers, funding projects that may eventually reintroduce the animals to suitable habitat on public lands. CREDIT: HEATHER SACKETT/ASPEN JOURNALISM
During the summer of 2020, Woody Creek landowner Jennifer Craig noticed that beavers had taken up residence on her property, building a dam across the channel and creating a pool.
The network of dams, pools and lodges has continued to grow over the past few seasons, creating a lush, muddy wetland thick with willows. And despite what Craig characterized as complaints about flooded land from downstream neighbors and calls for her to clear out the beaver handiwork she says the beavers are beneficial because they keep water on the landscape.
“As an upstream landowner, the best thing I can do is nothing,” she said. “Flooding from a beaver dam is natural, but people don’t like the chaos. Beavers provide habitat for so many other creatures, and they are keeping water in that whole corridor down there.”
Pitkin County is hoping that other landowners see things the way Craig does as it makes beavers a top priority, funding measures that may eventually restore North America’s largest rodent to areas it once lived in the Roaring Fork watershed.
Prized among early trappers for their fur that made fashionable hats, beavers were also seen as a nuisance to farmers and ranchers — perspectives used to justify killing them. But there has been a growing recognition over the past few years that beavers play a crucial role in the health of ecosystems. By building dams that pool water, the engineers of the forest can transform channelized streams into sprawling, soggy floodplains that recharge groundwater, create habitat for other species, improve water quality, and create areas resistant to wildfires and climate change.
The growing popularity of the animal caught the attention of Healthy Rivers board members, a group whose mission includes improving water quality and quantity. They are hoping to teach landowners how to coexist peacefully with beavers, correct beaver misconceptions and maybe even reintroduce them onto carefully chosen areas of the watershed. The Pitkin County Healthy Rivers board has spent just over $70,000 to date, with another $50,000 planned toward bringing back beavers, according to Healthy Rivers staff.
“They are so important for our environment and, in particular, our water environments,” said Wendy Huber, chair of the Healthy Rivers board. “How do we shift people’s perception of them from being destructive rodents to being our partners in protecting the environment?”
Woody Creek landowner Jennifer Craig points out the network of beaver dams, ponds and lodges on her property. She first noticed the animals had moved in during the summer of 2020 and the beaver dam complex has been growing each season. CREDIT: HEATHER SACKETT/ASPEN JOURNALISM
Forest Service inventory
Healthy Rivers has, so far, come up with two ways to do that.
One is a public-awareness campaign called Bring Back Beavers that features cute yet edgy beaver characters and catchphrases (“It’s About Dam Time,” for example), with plans to put the slogans on T-shirts and stickers. A new website presents beaver facts (their teeth never stop growing) and busts beaver myths (they don’t eat fish).
The other part of the strategy is to fund a program with the U.S. Forest Service for a beaver survey that aims to document more than 200 randomly selected riparian sites on public land in the headwaters over two years to find where beavers are thriving and identify locations where they could be successfully relocated in the future. Healthy Rivers has spent $50,000 on the project, which paid for two Forest Service technicians to carry out the work and has earmarked another $50,000 for next season.
Clay Ramey, a fisheries biologist with White River National Forest, is leading the effort, along with two technicians in the field, Samantha Alford and Stephanie Lewis, who are spending the summer chasing beavers. Ramey said that for a watershed-scale project such as this, it is important to analyze data collected from around the entire region, not just in places where beavers live.
“Beavers come and go, so measuring known sites is not helpful,” he said. “We are in the habitat business, so we want to know the big-picture questions like where do we have beavers, where do we not have beavers and what is the habitat like at the places where we do have beavers and what is the habitat like at the places where we do not have beavers.”
To that end, Alford and Lewis have been heading into sometimes-remote sites on streams throughout the watershed — North Thompson Creek, Fryingpan River, Conundrum Creek, Hunter Creek, Snowmass Creek and others — to measure the width of waterways, the slope of streams, the types of vegetation present and any signs of beaver activity, past or present, such as dams, lodges or chewed sticks.
Beavers generally like slow-moving streams that are not too steep and have plenty of nearby willows, aspens, cottonwoods and alders, which they can use for food and building materials.
“We know slope is relevant to where a beaver can prosper,” Ramey said. “Aspen, cottonwood, alder — a site that has none of those is not a place a beaver is going to do well because it doesn’t have any food.”
Ramey hopes the information collected by the inventory project will be incorporated into revisions for the updated forest-management plan, which is in progress.
Samantha Alford, right, and Stephanie Lewis, technicians with the U.S. Forest Service, measure the slope and width of Conundrum Creek. Pitkin County has spent $50,000 on this summer’s beaver habitat survey and has earmarked another $50,000 for next season.
CREDIT: HEATHER SACKETT/ASPEN JOURNALISM
Beaver relocation
Tom Cardamone, executive director of the Watershed Biodiversity Initiative and former longtime director of the Aspen Center for Environmental Studies, is one of several beaver boosters who have been quietly meeting over the past few months, plotting how to communicate with the public about beaver restoration.
With permission from Colorado Parks & Wildlife, Cardamone has relocated nuisance beavers on Nicholson Creek, which is a tributary of Capitol Creek, but he realized that a more formal protocol will be needed if rehoming them becomes more frequent. An eventual outcome of Pitkin County’s campaign may be relocating troublemaking beavers on private land to sites identified by the Forest Service survey as prime habitat on public land.
“You need to catch a whole group and move them to get them to stick,” Cardamone said. “It takes a few days to catch them and you have to hold them someplace that’s protected and secure, so no predators. You have to clean them and make sure they are healthy and then move them all as a group. That’s a bit of a lift.”
But there may be a looming legal question about new ponds created by relocated beavers. This year, Colorado lawmakers rejected a version of a bill that would have made it easier for environmental groups to do stream-restoration projects that mimic beaver activities because of potential unknown impacts to downstream water rights holders. Engineers from the Division of Water Resources last year told groups proposing projects on Eagle County Open Space that would have included beaver dam analogues that they must get an augmentation plan — which are costly, require the work of attorneys and engineers, and involve a lengthy water court process — to replace the water lost to evaporation by the creation of small ponds.
Could the same thing happen if the ponds were created by actual beavers on Forest Service land?
“We have not seen any indication that there’s a substantial legal concern,” said Pitkin County Assistant Attorney Laura Makar.
That’s good news for Huber, who has such an affection for the creatures that she once tried but failed to carry a favorite stick she found on a Montana fishing trip — its ends chewed and denuded of bark by beaver incisors — through airport security.
“Let’s bring them back,” she said. “They were here first. It’s a no-brainer.”
Aspen Journalism is a nonprofit, investigative news organization covering water, environment, social justice and more. Visit http://aspenjournalism.org. Aspen Journalism is supported by a grant from the Pitkin County Healthy Community Fund. Jennifer Craig is the daughter of Carol Craig, a long-time Aspen Journalism supporter.
American beaver, he was happily sitting back and munching on something. and munching, and munching. By Steve from washington, dc, usa – American Beaver, CC BY-SA 2.0, https://commons.wikimedia.org/w/index.php?curid=3963858
Sunrise over Golden, Colorado. Photo credit Terry Smith via The City of Golden.
Click the link to read the article on the Ark Valley Voice website (Jan Wondra). Here’s an excerpt:
The month of July 2023 just ended. It is in the record books as the hottest month in the history of the world while humans have been around; or at least in the past 120,000 years or so. It will obliterate the record for the hottest recorded month, upping the record by a formerly unheard of potential 2.7 degrees Fahrenheit. In fact, according to a report from the United Nations’ World Meteorological Organization and the European Commission’s Copernicus Climate Change Service, it was hotter this past month than anything we’ve seen in the last 80 or so years. But then again, humans only have data for about 100 years or so; an era considered the “sweet spot” in planet livability for humans.
This past month is the latest in a string of records that have made the past nine years the hottest in the history of our planet. Anyone who can read data knows we’re in trouble. On July 27, the United Nations Secretary-General António Guterres made an urgent speech in New York warning that the only surprise is the speed of climate change, saying “Climate change is here, it is terrifying and it is just the beginning.” He declared that “the era of global boiling has arrived.” Add to the extreme heat, the extreme weather that feels as if it is all happening at once, and we could be forgiven for wondering what on earth is going on. The answer is that ‘on earth”, we humans continue to screw it up, pumping billions of particles of CO2 and methane into the atmosphere; fueling an accelerating climate crisis.
In the ultimate irony, as the temperatures have surged across the affluent parts of the world, people there are cranking up their air conditioning — creating an endless cycle of climate disruption.
KARACHI: The month of July has rewritten the record books as it stands out as the hottest month ever on a global scale. Unrelenting heat waves have sizzled large swathes of Europe, the United States, and parts of Asia, leaving countries grappling with severe weather conditions. From Puerto Rico to Pakistan, Iran, India, and all the way to Siberia, climate records have not just been shattered, but smashed.
In June more than 4.7 million hectares of land in Canada were scorched by wildfires, painting skylines an eerie shade of orange over Ottawa, Montreal, and Toronto, where a dense haze obstructed views of the CN Tower, a 553.3-meter-tall iconic landmark that dominates the downtown skyline of one of Canada’s largest cities. However, this was not just Canada’s problem; billowing smoke traveled across continents, reaching as far as Europe, serving as a wake-up call for everyone trying to ignore the climate crisis and its far-reaching consequences.
A month later, all efforts were concentrated on dousing blazes raging on the Greek islands of Evia and Corfu, in addition to Rhodes, where wind-whipped infernos forced the government to evacuate more than 19,000 tourists and residents. The scars left behind by these fires are all too visible. Many towns in Greece were left with a severe shortage of water because of the damage to their resources. According to the country’s weather Institute, Greece faced the longest heatwave in its history, with its hottest July weekend in 50 years, with the mercury rising in some parts up to 45 Celsius (113 Fahrenheit).
To leading scientists, none of this comes as a surprise. The likely trajectory of climate change, given the current global performance on emissions reduction, has been spelled out repeatedly by climate experts, and their cries have been falling on deaf ears for quite some time. While warming caused by greenhouse gases is not unexpected, seeing some of the climate records being broken was not anticipated. The global average temperature has been rising, and in July this year, it broke through 17 degrees for the first time. Furthermore, the record for the hottest day on earth fell not just once but three times in a week. And it is not just the land that is warmer; the oceans, which take up most of the world’s heat, have also witnessed unprecedented temperatures.
A new state Colorado River Drought Task Force will meet nine times between now and early December, and hold two public hearings to develop recommendations on how the parched river’s supplies will be managed inside state lines as its flows continue to decline.
At its first meeting Monday [July 31, 2023], 100 people joined the virtual session as the 17-member task force began planning the work it must conclude by Dec. 15.
“We are at a truly historic moment in Colorado River history,” said Kathy Chandler-Henry, an Eagle County Commissioner who is non-voting chair of the group.
“We are tasked with providing recommendations for programs addressing drought in the Colorado River Basin. … It’s a tall order but I am confident we can deliver. … My hope is that we can reach a broad consensus. My concern is the time crunch … 4.5 months in water time is a blink of an eye.”
Lawmakers created the Colorado River Drought Task Force in May when they approved Senate Bill 23-295. The 17-member task force includes representatives of environmental groups, urban and agricultural water users, and the Southern Ute and Ute Mountain Ute tribes, among others. Its task: to recommend state legislation that would create new tools and programs to address drought and declining flows on the Colorado River.
The seven-state Colorado River Basin is divided into two regions, with Colorado, New Mexico, Utah and Wyoming comprising the Upper Basin, and Arizona, Nevada and California making up the Lower Basin.
But it is in the Upper Basin and in Colorado, specifically, where roughly two-thirds of its flows originate.
Colorado is home to eight major rivers, four of which are major tributaries to the Colorado River on the West Slope. They are the Yampa/White/Green, the Gunnison, the San Juan/San Miguel/Dolores, and the Colorado River itself.
Four river basins, the Colorado, Yampa/White, Gunnison and Southwest would participate in a demand management program that eventually will include the entire state. Source: Colorado River District
This year, negotiations among the states and the federal government are beginning on how to manage and protect the river now and beyond 2026, when many of the existing Colorado River management agreements expire.
Overuse in the Lower Basin is considered to be the largest issue to resolve, but Upper Basin states may be called on to reduce their agricultural water use as well. One proposal, known as demand management, is to create a new drought pool in Lake Powell by having farmers and ranchers fallow their fields in return for cash payments. And the state’s urban water users may also be called on to cut back.
Colorado water users on the West Slope and Front Range are concerned that changes to the river’s seven-state management system could harm their water rights.
Scott Hummer, water commissioner for District 58 in the Yampa River basin, checks out a recently installed Parshall flume on an irrigation ditch in this August 2020 photo. Compliance with measuring device requirements has been moving more slowly than state engineers would like.
CREDIT: HEATHER SACKETT/ASPEN JOURNALISM
Mike Camblin, a task force member representing agricultural water users, said it would be critical to find ways to ensure farmers’ and ranchers’ lands remain healthy and their operations profitable. Agriculture uses 80% of the Colorado River’s supplies across the basin and the agricultural industry is deeply worried that it will take the hit if and when reductions are required.
“I hope we can come up with a plan. I would hate to see our ancestors cuss us down the road,” Camblin said.
Melissa Youssef, a task force member who is also mayor of Durango, said her city is already seeing its water supplies reduced. She said she was glad to have a seat on the task force and to have a say in how her community should be protected.
“My hope is that we can come together, making our positions abundantly clear. We have senior water rights on two rivers, but we are exposed to a reduction in water supplies through drought,” Youssef said.
Alex Davis, assistant general manager of Aurora Water, is a task force member representing Front Range water users. She said urban reliance on the Colorado River is significant.
Colorado transmountain diversions via the State Engineer’s office
Roughly half of water supplies for Aurora and Denver, among others, come from the Colorado River.
“My concern is that people will bring very specific agendas from different entities that will benefit their constituents but may not be beneficial to the state as a whole,” she said.
The group will meet at sites around the state, with one meeting each month slated to be in-person and the others designed to be virtual. The next meeting is Aug. 10 in Denver. It is in-person. A location has not yet been determined. All meetings are open to the public.
Jerd Smith is editor of Fresh Water News. She can be reached at 720-398-6474, via email at jerd@wateredco.org or @jerd_smith.
Rio Grande in Albuquerque, Aug. 4, 2023. Photo by John Fleck
Click the link to read the article on the InksStain website (John Fleck):
The Rio Grande, already dry in the San Acacia reach south of Socorro, has begun drying in the Isleta reach south of Albuquerque. And with a record hot dry summer, we could see it dry in Albuquerque again this year, as it did last year for the first time in 40 years.
Problem 1 this year is that it’s hot and dry. Problem 2 is that El Vado Reservoir, built in the 1930s to store spring runoff for use at times like this, is under repair. So the stored water that would provide both irrigation and environmental benefits is unavailable.
This morning’s water management notes from the USBR noted 30 miles dry in the San Acacia Reach and a mile of dry riverbed in the Isleta reach.
Flow this morning through Albuquerque was a bit above 300 cubic feet per second. The median for this point in August is ~600 cfs.
The San Juan Water Conservancy District (SJWCD) Board of Directors approved moving forward with a contract with Rick Ehat for engineering consultation on the district’s reservoir project and discussed a lease agreement for river access on a 20-acre parcel ing that governmental immunity jointly owned by SJWCD and the ing that governmental immunity jointly owned by SJWCD and the Pagosa Area Water and Sanitation District.
Colorado River “Beginnings”. Photo: Brent Gardner-Smith/Aspen Journalism
Click the link to read the article on the Colorado Public Radio website (Michael Elizabeth Sakas). Here’s an excerpt:
The Colorado state legislature created the task force last year to bring together representatives from agriculture, water managers from Front Range cities and Western Slope towns, environmentalists, Southern Ute and Ute Mountain Ute representatives and industry. The 17 members will meet 10 times until Dec. 7, when it will submit a report of recommendations to lawmakers ahead of the 2024 legislative session…Colorado’s new task force will consider how the state might be affected if the Colorado River and its reservoirs drop to critically-low levels. The federal government has threatened to step in and make water cuts necessary to prevent that. There’s also concern that, eventually, Colorado and the other upper-basin states— Wyoming, Utah and New Mexico — might have to respond to legal challenges if the downstream states — Arizona, Nevada and California — feel they aren’t getting enough water.
“My greatest fear about the task force is that we know that the lower basin is going to be watching, other states in the Colorado River Basin are watching,” said Lee Miller, general counsel of the Southeastern Colorado Water Conservancy District. “That we don’t give them fuel to divide us more or use it against us in the negotiations for the interim guideline extension.”
[…]
Upper Colorado River Commissioner Rebecca Mitchell, who was recently appointed as the state’s first full-time Colorado River representative and negotiator, is a member of a subcommittee that will focus on tribal water issues.
“I think really my focus is to make sure that as I go into the negotiations, that Colorado stands united, because I think that’s going to be incredibly important,” Mitchell said at the meeting.
She said the current guidelines on how managing the Colorado River and Lake Mead and Lake Powell, “aren’t working for us right now, and they really have not worked for the tribes ever.”
Native America in the Colorado River Basin. Credit: USBR
In October 2022, Canada-based Atomic Minerals Corporation announced it had “acquired by staking” more than 6,500 acres of public land on Harts Point in southeastern Utah, a sandstone mesa just outside Bears Ears National Monument that’s bordered on one side by Indian Creek, a popular rock-climbing area. The company’s word choice was a bit off: It didn’t actually acquire the land, it merely secured the right to exploit it: to mine it by locating — or staking — 324 lode claims.
Atomic Minerals didn’t need to get a permit from regulators or inform the public in order to do this. Nor did it have to consult with the tribal nations that had unsuccessfully urged the Obama administration to include Harts Point in Bears Ears. Nope; the uranium mining company’s American subsidiary merely needed to file the locations with the Bureau of Land Management and pay $225 per claim in processing, filing and maintenance fees. The BLM then gave the company the preliminary go-ahead to do exploratory drilling on the land, once again without public notice or rigorous review.
If the corporation decides to go forward with mining, the proposal will become subject to environmental analysis. But once it obtains the relevant permits, Atomic Minerals is free to ravage Harts Point and yank uranium and other minerals belonging to all Americans out of the ground, without paying a cent in royalties.
If this sounds like a scenario right out of the 19th century, that’s because it is. Hardrock mineral exploration on public lands is governed by the General Mining Law of 1872, which makes “all valuable mineral deposits” in public lands “free and open to exploration.” The law hasn’t fundamentally changed in 151 years, making it one of the most persistent of what the late scholar Charles Wilkinson dubbed the “Lords of Yesterday,” the old and obsolete laws governing natural resource use and extraction.
Over the past couple of years, companies have staked a slew of new claims on public lands. The current land rush mirrors that of the late 1800s, when corporations used the law to profit from places like the Red Mountain region of Colorado, where the mining legacy lives on in the form of tainted water and torn-up landscapes. Only this time, they’re going after more than gold and silver; they also want the so-called “green metals” — the lithium, cobalt, copper and rare earth elements used in electric vehicles and other clean energy applications. At the same time, a recent push to start building advanced nuclear reactors appears to be rousing the domestic uranium mining industry from its decades-long slumber.
That, in turn, has sparked a new push from lawmakers, environmentalists and the Biden administration to finally bring federal mining law into the 21st century. But can this Lord of Yesterday really be deposed? Or will corporate greed, profit and political inertia once again use their influence and money to prop up this rusty old framework?
Map: The Barry Lawrence Ruderman Map Collection/Stanford University Libraries
Prospectors flocked to the Red Mountain Mining District in the San Juan Mountains of Colorado in the 1880s and 1890s, staking claims on the iron-rich red-orange slopes that give the place its name.
The only thing a claimant needed was evidence that some minerals were present and the willingness to do $100 worth of work annually. Today, claimants merely have to pay an annual maintenance fee of $165 per claim in order to keep it active.
Most of these were 10-acre lode claims that follow a mineral vein. A few larger placer claims can also be seen on this map; they were usually staked along riverbeds for extracting minerals from gravel or sand. Scattered amid the chaos are also smaller mill sites, which are claims on non-mineral lands used to build mills or dispose of tailings.
This image was taken during the peak outflow from the Gold King Mine spill at 10:57 a.m. Aug. 5, 2015. The waste-rock dump can be seen eroding on the right. Federal investigators placed blame for the blowout squarely on engineering errors made by the Environmental Protection Agency’s-contracted company in a 132-page report released Thursday [October 22, 2015]
The typical claimant back then was an individual, like Olaf Arvid Nelson, who staked the Gold King claim over the hill from here in 1887. (It was the site of a notorious disaster in 2015.) Claimants then usually leased or sold their claims to corporations or investors with resources to develop the mine.
Then, as now, corporations could pull unlimited quantities of minerals from their claims without paying a cent of royalties to the minerals’ actual owner — the American public. This amounts to a subsidy of hundreds of millions of dollars per year, mostly to multinational corporations. No one knows exactly how much, because no one keeps track of mineral production from federal lands.
The 1872 General Mining Law allows claimants to patent, or acquire, clear title to their claims, for a paltry fee just five years after staking it. This provision encouraged the privatization of thousands of acres of public lands, resulting in a chaotic land-ownership pattern — and headaches for local officials — in former mining zones like Red Mountain.
Then, in 1994, Congress put a moratorium on all new land patents. But it did so without changing the law itself, meaning that lawmakers must renew the moratorium on a yearly basis. Meanwhile, companies continue to stake and mine un-patented claims under the 151-year-old law.
The General Mining Law of 1872 contains no environmental provisions and no reclamation requirements, so corporations can simply walk away from their mines once they’re no longer profitable. Hundreds of thousands of legacy mining sites now dot the Western U.S.; many of them have never been cleaned up and continue to spew acid mine drainage into streams. Most of the claims on this map were part of the Idarado Mine Colorado Superfund cleanup in the 1990s.
Mining law by the numbers
11.36 million Acres of public land staked with active mining claims at the end of the 2022 fiscal year. This is a 932,000-acre increase from the previous year.
228,696 Number of active mining claims covering nearly 6 million acres of federal land in Nevada at the end of FY 2021.
267,535 Number of active mining claims on federal land in Nevada as of June 12, 2023, an increase of nearly 40,000 in just 18 months.
13 Minimum number of active mining claims staked within Bears Ears National Monument since 2016. These claims were located either in the months just before the national monument was established, or after it had been shrunk by then-President Donald Trump but before President Joe Biden restored the boundaries. National monument status bars new mining claims, but does not affect existing ones like these.
$34.4 billion Value of non-fuel mineral production in 2019 on all lands in 12 Western states.
Unknown Amount of that mineral production extracted from federal lands. The number is unknown because federal agencies do not track production. Earthworks, a mining watchdog group, has estimated that $2 billion to $3 billion worth of minerals is extracted from public lands annually.
12.5% to 18.75% Royalty rate on oil, natural gas and coal extracted from public lands.
$14.8 billion Royalties paid on oil and gas production from federal lands in 2022.
$0 Royalties paid on hardrock minerals extracted from mining claims on public land, including copper, gold, silver, lithium, uranium and various “green metals,” between 1872 and 2023.
SOURCES: Bureau of Land Management, Government Accountability Office, Congressional Research Service, Earthworks, Center for American Progress
The Klamath River Basin was once one of the world’s most ecologically magnificent regions, a watershed teeming with salmon, migratory birds and wildlife that thrived alongside Native American communities. The river flowed rapidly from its headwaters in southern Oregon’s high deserts into Upper Klamath Lake, collected snowmelt along a narrow gorge through the Cascades, then raced downhill to the California coast in a misty, redwood-lined finish.
For the past century, though, the Klamath – a name derived from a Native American term for swiftness – hasn’t been free-flowing or flush with salmon. Dams block fish from the upper watershed’s spawning grounds. Reservoirs host toxic algae blooms. Parasites and pathogens that can flourish when dam-regulated flows are low have wiped out salmon by the tens of thousands.
The Klamath’s ecological vitality — above and below the dams — has diminished along with longstanding tribal connections to the river.
Now, after decades of tireless negotiating among myriad parties, the Klamath is being given a chance to return to a more natural state. Construction crews this summer are taking out the first of four essentially defunct hydroelectric dams choking a 64-mile stretch, with the remaining three slated to come out by the end of 2024 in the largest dam removal project ever undertaken.
But several questions remain: Will the Klamath’s damaged ecosystem recover? How will salmon respond, and can they find their way back above the former dam sites for the first time in more than 100 years? How will the river’s food web change? Will the algae blooms disappear with the reservoirs?
Scientists aren’t exactly sure — a river restoration plan of this size has never been tried — but they are pouncing on the opportunity to find out.
Using techniques and lessons learned from previous dam removals, biologists are studying salmon ear bones to track migratory routes, charting water temperature and chemistry changes and mapping cold water pools salmon use to survive the summer heat.
Native Americans most affected by the dams are on the front lines of the research. Along the river, from its origin in Klamath Falls, Oregon to its mouth near Crescent City, California, basin tribes are tracking fish populations, monitoring water quality and gathering other data across a rugged, remote watershed larger than the states of Vermont and Connecticut combined.
Success on the Klamath River could serve as a blueprint for restoring other watersheds and, proponents say, energize a growing worldwide trend of removing obsolete or seismically unsafe dams.
Klamath River Basin and dams. Source: U.S. Geological Survey
“We’re now in the age of dam removal, so we’re going to learn a ton out of this,” said Robert Lusardi, a freshwater ecologist with the University of California, Davis, who is tracking watershed changes in collaboration with the Karuk and Yurok tribes. “There’s such a larger purpose here for the science and the work and understanding what dam removals mean for the ecology — and also the people of the Klamath River.”
Removing the dams won’t fully return the Klamath to its natural state. Other major dams on the 254-mile-long river will remain and growers and communities will continue to take their legal share of its flows. Also, river temperatures are bound to grow warmer with climate change and water quality problems tied to the basin’s legacy of gold mining and logging will linger.
Nevertheless, the world is paying close attention to the remote basin that straddles California and Oregon, eager to see how the dam removals will change the well-being of the river, its fish and the region’s Native Americans who see themselves as part of the Klamath’s ecosystem.
“A dam removal project of this scope is unprecedented,” said Sarah Null, a Utah State University professor who studies the effects of dams on ecosystems and fish diversity. “Everyone, I would say, is watching this.”
Nation’s Biggest Dam Removal Takes Shape
The four dams were built between 1908 and 1962 to generate electricity for the developing agricultural region, but cost concerns and political pressure from tribes and environmental groups ultimately drove the decision to remove them.
Crews tear down the Copco No. 2 power dam on the Klamath River in July 2023. Photo by Shane Anderson/Swiftwater Films
The dams’ owner, PacifiCorp, couldn’t get them relicensed in the early 2000s without spending at least $450 million on fish ladders and other renovations. Besides, there was little demand for the electricity, the reservoirs weren’t designed for irrigation or flood control, and they were slowly filling with sediment. The Berkshire Energy subsidiary decided to abandon the federal relicensing process.
A constellation of tribes, environmental groups and fishing interests blamed the dams for “cutting the river in half,” spurring algae blooms and blocking salmon from more than 400 miles of their critical spawning and rearing habitat. They used an unprecedented 2002 disease outbreak on the Klamath that killed more than 34,000 adult salmon to generate public and political support for dam removals.
The Klamath’s salmon populations were sliding toward extinction and removing the dams was the quickest way to arrest the decline of the fish and the tribes’ cultural ties, the groups argued. Since the first power dam was built more than a century ago, an entire run of chinook went extinct and other salmon species have declined by 90 percent.
“We’ve changed the ecosystem to be unfit for a lot of species,” said Alex Gonyaw, senior fish biologist for the Klamath Tribes. “We have seven species that are struggling or are extinct from here and then there’s a lot of others that are holding on but very much struggling.”
In 2016, dozens of parties signed the Klamath Hydroelectric Settlement Agreement, including the Department of the Interior, the states of Oregon and California, basin tribes and several local governments and irrigation districts.
Still, it took several years for PacifiCorp to clear regulatory hurdles and devise a plan that would limit its financial obligations. It ultimately handed control of the dam demolitions and habitat restoration to a newly created nonprofit, the Klamath River Renewal Corporation, which is run by a group of appointees representing Oregon and California, basin tribes and non-governmental organizations. A similar nonprofit was created a decade ago to remove two dams and build a fish bypass around a third impoundment on Maine’s Penobscot River.
Last fall, after negotiations that spanned more than 20 years, the long-held aspirations of tribes and environmentalists became reality. Federal regulators approved a sweeping dam removal plan.
“It’s not the only dam removal but it’s the biggest one so far in terms of complexity, number of dams and positive impact for rivers,” said Brian Johnson, president of the renewal corporation’s board of directors. “We think of it as the start of the biggest river restoration effort that anybody has ever seen.”
The project’s estimated $450 million cost is being covered by surcharges PacifiCorp collected over nine years from customers in Oregon and California and $250 million from Proposition 1, a sweeping water bond California voters approved in 2014.
Brian Johnson
In June, the dam removal proponents’ efforts began to pay off as heavy machinery started tearing away the gates and spillway of the smallest dam, Copco No. 2. The dam will be completely out by September and the reservoir drawdowns will begin early next year along with the demolition of the three other dams.
The combined height of the four dams is more than 400 feet and up to 15 million cubic yards of impounded sediment will wash down the river toward the ocean. Draining the reservoirs will muddy stretches of the river and may cause short-term water quality issues for fish. However, that is scheduled in the winter when salmon aren’t migrating.
Experts predict the bulk of the sediment will settle in the river system or reach the estuary after two years. This sediment removal approach has been used in other high-profile dam removals without causing major changes to river channels.
“If the experts are wrong, the habitat is degraded and anadromous fish stocks don’t recover, our concern is that the water needed to clean up the mess will come at the expense of agriculture,” said Moss Driscoll, director of water policy for the Klamath Water Users Association.
Providing Scientific Clues
Scientists and conservationists see the Klamath dam removals as a rare opportunity to chronicle a large-scale restoration of a watershed.
For the past several years, researchers with government agencies, universities, tribes and non-governmental groups have been gathering information on the river’s current state. After the dams are gone, they will use the data to detect changes in fish migration, water quality, food webs and sediment.
Algae blooms flourish in Klamath’s Iron Gate Reservoir. Photo by EcoFlight
Salmon will be reintroduced to the formerly dam-blocked stretches of Klamath, and scientists want to make sure the river habitat has enough deep pools and vegetation to shelter juvenile fish from predators and hot temperatures. Healthy rearing habitat in the river is key to salmon survival and rebuilding the Klamath’s beleaguered native fish populations. Knowing favored salmon hideouts and rearing areas can help take the guesswork out of post-dam habitat restoration work.
One group of researchers believes clues can be culled from the salmon’s ear bones.
Ear bones, or otoliths, taken from salmon carcasses have markings that track a fish’s rate of growth, like tree rings. Researchers have long used otoliths to measure the age of fish, but now a team led by UC Davis’ Lusardi, the Yurok Tribe, U.S. Fish and Wildlife Service and the National Marine Fisheries Service are using them to map salmon movements.
About the size of a black bean, otoliths have unique patterns that correspond to levels of strontium, a silvery earth metal that seeps into waterways naturally. Researchers measure the percentages of strontium in the otoliths and compare the data with strontium water samples collected throughout the Klamath basin.
“We can understand where salmon rear, how long they rear and what time they leave for the ocean by using this strontium identifier or geolocator,” said Lusardi, who also works for California Trout, a nonprofit group.
Lusardi called the method “pioneering” in relation to dam removal and said the results will help guide habitat restoration work in the Klamath basin and elsewhere.
Further up the river in California’s Humboldt and Siskiyou counties, Karuk Tribe biologists are working with Lusardi and Alison O’Dowd, a river ecologist at Cal Poly Humboldt, to track how salmon diets change during and after the dam removals.
Researchers are using carbon and nitrogen isotopes from fish collected by the Karuk to establish baseline salmon diets. The sampling process will continue over the next several years to gauge how a more free-flowing river affects aquatic food webs.
The Karuk Tribe has witnessed firsthand the dams’ devastating effects on salmon as its ancestral territory is just downstream of the lowest hydroelectric dam to be removed. Like the others, Iron Gate Dam was built in 1962 without a fish ladder so it became the final stopping point for sea-run fish.
Toz Soto, Karuk fisheries program manager, said Iron Gate Dam and other dams are largely to blame for the extinction of an entire run of spring-run chinook that once supported a bustling tribal fishery. He said the Karuk Tribe, California’s second largest in enrolled members, is optimistic about the possibility of resuming a salmon fishery once the dams are gone.
“The ability for Karuk tribal people to practice their ceremonies again and harvest spring-run salmon…it’s a big deal,” Soto said. “We’re hoping within a few generations of salmon returns we’ll start to see positive impacts from the dam removals.”
In addition to the dams, the Karuk are trying to document other contributing factors to the salmon decline.
Soto said the tribe has a variety of research projects in addition to food webs, including chinook genotyping, water quality on the Klamath and the Scott and Shasta river tributaries and wildfire effects on fish and hydrology. He predicts the algae blooms that have become emblematic of Klamath reservoirs will happen less frequently once the dams are gone.
Robert Lusardi
The Karuk have looked to a major dam removal project in Washington state to guide their own research. The tribe has visited and held conferences with the Lower Elwha Klallam Tribe, which played a prominent role in the demolition of two salmon-blocking dams on the Elwha River more than a decade ago. Soto said the Elwha created a “proof of concept” that the Karuk and other Klamath basin tribes have tried to implement.
“There’s a lot of cross-pollination between the two removal efforts,” he said.
Meanwhile, upstream of the dam removals, at the top of the Klamath watershed, the Klamath Tribes and the Oregon Department of Fish and Wildlife are releasing juvenile salmon into the upper basin for the first time since the hydroelectric dams were built.
The Klamath Tribes, whose members include the Klamath, Modoc and Yahooskin-Paiute, want to understand how chinook salmon will navigate stretches above the dam that have been blocked for more than 100 years. To do this, biologists implant acoustic tags in young hatchery salmon and release them strategically throughout the upper basin. The goal is to pinpoint areas the fish find hospitable for habitat restoration.
Once salmon and other native fish species like steelhead trout and Pacific lamprey can move back by themselves into the upper basin, they will face a completely altered and, in many ways, impaired ecosystem. One major hurdle is Upper Klamath Lake, the largest freshwater body west of the Rocky Mountains where the river’s headwaters drain in southern Oregon.
Early results have been encouraging. Fish have found their way from the upper tributaries to the southern end of Upper Klamath Lake. The next test is whether fish can withstand the lake’s poor water quality and warm water during the often inhospitable summer months.
“The big question is will they survive Upper Klamath Lake?” said Gonyaw, a Klamath Tribes biologist. “We’ve added (non-native) fish species that weren’t there before, we’ve likely added diseases and we’ve altered the hydrology of the lake.”
After Upper Klamath Lake, salmon will still face a gauntlet of obstacles on their journey to the ocean, including navigating fish ladders on dams that aren’t being removed and predatory fish and birds.
Prepping the Ecosystem
Repairing ecosystem damage caused by humans is important to the ultimate success of the Klamath dam removals.
Karuk fisheries workers net chinook salmon at one of the tribe’s ceremonial fishing locations. Source: Resource Environmental Solutions/ Swiftwater Films
Habitat work is underway between Iron Gate and Keno dams, a severely degraded 60-mile stretch where little research or restoration work has been done compared with other parts of the watershed.
To help fill the data gaps, researchers are using helicopters equipped with thermal infrared cameras to map cold springs where salmon can still thrive in a warming climate, said Bob Pagliuco, a marine habitat specialist with the National Oceanic and Atmospheric Administration, which is responsible for recovery of struggling salmon populations. Little is known about these cold springs because they have been covered by reservoirs over the last century or are on private land largely inaccessible to researchers.
On the ground, Pagliuco’s team is investigating ways to reconnect the Klamath to its floodplains, developing relationships with private landowners and evaluating whether canals and diversions need fish screens. He said more than 25 groups have expressed interest in the 82 projects ranked in a restoration guidebook his agency prepared with Trout Unlimited and the Pacific States Marine Fisheries Commission.
“There hasn’t been a lot of investment here so it’s kind of fertile ground,” Pagliuco said of the stretch of the river between the four dams being removed. High on the repair list are the Klamath’s tributaries that were drowned by the dam. They must be cleared of the muck the reservoirs leave behind.
The Yurok Tribe is one of the groups restoring the landscape around Iron Gate Reservoir and has recruited an ecologist who headed the Elwha River revegetation in Washington. The tribe is clearing invasive grasses and will monitor changes in stream velocity and water quality. Billions of native plant seeds and thousands of trees such as oaks will be planted across 2,200 acres of previously submerged land.
Reintroducing native species to sites where they haven’t been for decades will deter starthistle, meadow knapweed and other non-native invasive plants from overtaking the riverbanks.
The tribe is also planning habitat work downstream of the dams on the Trinity River, the largest Klamath tributary.
Onna Joseph, a Yurok restoration technician, gathers seeds for revegetating beds of drained reservoirs on the Klamath. Source: Restoration Environmental Solutions/Swiftwater Films
Earlier this year, the Yurok received a $4 million California state grant to remove mine tailings and bring back 32 acres of degraded floodplain. The Yurok hope the Oregon Gulch Project will provide badly needed juvenile salmon and steelhead habitat and allow the approximately one-mile-long river corridor to evolve into a more natural state.
The Yurok Tribe, California’s largest by enrolled members, canceled its commercial salmon fishery in 2023 for the fifth year in a row due to dwindling salmon populations.
“I am confident that we can rebuild salmon stocks through dam removal, habitat restoration, and proper water management, to a level that would support tribal, ocean commercial and recreational fisheries,” Barry McCovey Jr., Yurok Fisheries Department director, said in a statement.
Trish Chapman, who managed the 2015 removal of San Clemente Dam on the Carmel River for the California State Coastal Conservancy, said the restoration challenges will continue after the Klamath dams are gone and that planners must adapt to unforeseen changes.
“Ecological restoration, by its very nature, comes with large uncertainties. For a project to be resilient, you need to account for those uncertainties in the design,” said Chapman, whose agency is helping with the removal of the Klamath dams and Matilija Dam in Ventura County.
‘If You Unbuild it, They Will Come’
In late June, the nonprofit entity in charge of the demolitions released aerial photos showing excavators digging into the core of Copco No. 2. The photos garnered press coverage and were shared on social media, but more importantly they signaled the Klamath project had finally moved out of the planning phase.
Fog on the lower Klamath River near Arcata, California. Photo by Steve Gough/ U.S. Fish and Wildlife Service
The images of yellow heavy machinery tearing into the dam’s spillway gates prompted a cathartic release for many who have been fighting for decades to open this stretch of the Klamath.
“I’m still in a little bit of shock,” said Soto, the Karuk biologist. “This is actually happening…It’s kind of like the dog that finally caught the car, except we’re chasing dam removal.”
Old dams are coming out across the nation and in Europe more frequently than ever before: Last year, 65 U.S. dams were removed in 2022 and a total of 2,025 since 1912. In Europe, at least 325 dams or weirs came down last year alone, according to American Rivers which advocates for and tracks the removals.
Recent history has shown that aquatic species can bounce back quickly once rivers are undammed.
A pair of hydroelectric dams came out on the Elwha River in 2012 and 2014, allowing federally threatened salmon, bull trout and steelhead to approach the river’s headwaters in Washington’s Olympic Mountains for the first time in nearly a century.
Summer steelhead, chinook and coho salmon are no longer fenced out of their spawning areas and have recolonized naturally above the old dams. One species, sockeye salmon, has returned to the Elwha from as far away as Alaska.
“If you unbuild it, they will come,” said Sam Brenkman, a National Park Service chief fisheries biologist whose team is monitoring fish populations in 12 major watersheds, including the Elwha.
Brenkman also attributed the recovery to a fishing moratorium on the Elwha that has been in place since 2011.
Klamath proponents are also buoyed by a similar recovery on Maine’s Kennebec River, where large numbers of native sea-run species such as shad, salmon, sturgeon and blueback herring have returned nearly 25 years after the removal of Edwards Dam. The resurgence of the Kennebec fish populations has roundly surpassed biologists’ expectations and many credit the 1999 project with igniting the dam removal trend that continues today.
In California and Oregon, the Klamath project is setting a new bar: “Never before have so many large dams been removed from a single river at one time in the United States,” a Congressional Research Service report states. Many are interested in the project as a proof of concept for other major dam removals.”
You don’t have to look far from the Klamath basin to find other dams that have outlived their usefulness, said Soto, the Karuk fisheries manager. He noted the Wiyot Tribe and others on the nearby Eel River are pushing for the removal of two hydroelectric dams that are close to the end of their lifespans.
“We have set a good example (on the Klamath),” Soto said. “I think the biggest lesson is it takes time and persistence and I think tribes have that. They’re not going anywhere and there’s people who will fight for dam removal and when they’re gone, their kids will fight for dam removal.”
Know someone who wants to stay connected to water in the West? Encourage them to sign up for Western Water and follow us on Facebook, Twitter, LinkedInand Instagram.
Dry conditions dominated the West and southern Plains, coupled with above-normal temperatures. Precipitation was most widespread throughout much of the upper Midwest and central Plains and into the Northeast. Almost the entire country had near- to above-normal temperatures this last week, with the greatest departures over the Southwest and central Plains where temperatures were at least 4-7 degrees above normal. Cooler-than-normal temperatures were recorded in the Pacific Northwest with departures of 3-6 degrees below normal. At the end of the current U.S. Drought Monitor period, significant rains developed over portions of the Midwest and central Plains, and they will be accounted for in the next analysis…
Precipitation was mixed in the region for the week. Areas of northwest North Dakota and throughout much of Nebraska recorded above-normal precipitation while most of Kansas, eastern South Dakota and eastern Colorado were below normal for the week. Temperatures were above normal for the week along with some areas of high dew point temperatures too. Departures were generally 2-4 degrees above normal for the week, with areas of central Kansas, western North Dakota and eastern Nebraska 6-8 degrees above normal. The recent trend of wetter conditions over Nebraska allowed for improvements to be made to the drought depiction this week. Extreme and severe drought were improved over north central Nebraska and southeast Nebraska. Drought expanded and intensified over most of northern North Dakota where moderate drought conditions now cover much of the northern tier of the state. Abnormally dry conditions expanded over northern South Dakota…
Colorado Drought Monitor one week change map ending August 1, 2023
Temperatures were mixed in the region with areas of the Pacific Northwest recording below-normal temperatures with departures of 3-6 degrees below normal. Most of the rest of the region was near normal to above normal, with the greatest departures over the Southwest with temperatures generally 3-6 degrees above normal. The monsoon moisture became more widespread throughout the Southwest, with areas of the Four Corners states all seeing scattered rain events. The central valley of California as well as the Pacific Northwest also recorded above-normal precipitation. Moderate drought was introduced in southeast Utah into southwest Colorado and expanded in southern New Mexico. Abnormally dry conditions expanded over northern New Mexico and southwest Utah and southwest Colorado. Montana had an expansion of severe and moderate drought and a large expansion of abnormally dry conditions. In the Pacific Northwest, severe drought was expanded in Washington and Oregon, moderate drought expanded in northeast and southwest Oregon and abnormally dry conditions expanded into more of central Washington…
Temperatures were near normal to slightly above over most of the region, with the greatest departures from normal in west Texas and the Texas and Oklahoma panhandles, where departures were 4-6 degrees above normal. It was an incredibly dry week over the region with only a few pockets of showers over northern Arkansas and coastal areas of Texas. Most of the region recorded zero precipitation for the week. Severe drought expanded over east Texas and southern Louisiana and a new area of severe drought was introduced over far west Texas. Moderate drought expanded over southwest Oklahoma and northern Texas…
Looking Ahead
Over the next 5-7 days, precipitation chances are anticipated to be best over the northern Rocky Mountains, central Plains and into the Southeast where forecasted rain totals could approach 3-4 inches in places. Dry conditions will dominate the southern Plains, Southwest and along the West Coast. Temperatures will be 12-15 degrees below normal over the central Plains to the northern Rocky Mountains and 8-12 degrees above normal in the southern Plains and Southwest.
The 6–10 day outlooks show a high probability of cooler-than-normal temperatures over the Northern Rocky Mountains, central and northern Plains and into the Midwest. The best chances of above-normal temperatures are over the Southwest, southern Plains and into the Southeast. Much of the country is showing an above-normal chance of above-normal precipitation, with only the Southwest and far southern Plains having high probabilities of below-normal precipitation.
US Drought Monitor one week change map ending August 1, 2023
Just for grins here’s a slideshow of US Drought Monitor maps for early August for the past few years.
The Nation had called on the federal government under its treaty obligations to the tribe to assess Navajo water needs and make a plan to fulfill them if necessary, but the court’s decision was that the government had no obligation to do that. It was a blow to a place where nearly a third of people don’t have reliable access to clean water.
But as the Navajo Nation Council celebrated 100 years of governance earlier this month, President Buu Nygren raised the Supreme Court ruling in his opening speech.
“Many feel this 5-4 ruling was a loss for us, but it wasn’t,” he said.
That is because, according to President Nygren: “Both the majority and dissenting opinions noted correctly that the Navajo Nation has a claim to the water rights in the mainstream Colorado River.”
And the majority opinion notes that the Navajo, “may be able to assert the interests they claim in water rights litigation, including by seeking to intervene in cases that affect their claimed interests.”
The dissenting opinion, written by Justice Neil Gorsuch, included this note:
“After today, it is hard to see how this Court (or any court) could ever again fairly deny a request from the Navajo to intervene in litigation over the Colorado River or other water sources to which they might have a claim.”
Now that July is over, the official meteorological diagnosis of the month is in: It was friggin’ hot! On a global level, it was the hottest month on record, maybe even the hottest in the last 120,000 years. The figures for the West aren’t in yet, but I think we can all agree it was an abnormally warm and dry month for most places.
Phoenix experienced a full month — i.e. 31 consecutive days — of 110+ degrees Fahrenheit maximums (from June 30 to July 30; the streak was broken July 31, when the mercury topped out at a chilly 108 F). That included three 119-degree F days and a record-breaking overnight low of 97 F. And the average daily temperature for the month was nearly 103 degrees, shattering the old record and more than seven degrees above “normal.”
Although the monsoon has made it to some parts of southern Arizona, dumping three-fourths of an inch of rain on Tucson and knocking out power to some 50,000 people, it’s missing other parts of the state. Phoenix-proper hasn’t received measurable precipitation since March 22. Ugh.
Sure, that’s Phoenix, which is always a cauldron. But how about these all-time record-breakers?:
120 degrees F: Maximum temperature in Ajo, Arizona, on July 20, breaking the previous record of 119 F set in 2021.
93 F: Maximum temperature in Del Norte, Colorado — at nearly 7,900 feet above sea level — on July 26 and 27, breaking the record set in 2015.
85 F: Maximum temperature at Parker Peak, Wyoming — at 9,400 feet in elevation — on July 24, breaking the record set a day earlier (previous record: 82 F set in 2002).
78 F: Minimum temperature at Bredette, Montana, on July 23.
The point being it’s hot everywhere, even in the high country, and always, even in the coolest part of the night in Montana.
The good news is that all that heat was preceded by a really wet winter and spring, saving us from complete disaster. The bad news is the heat has conspired with a late-arriving monsoon to suck up a lot of that moisture, leaving less for the rivers and vegetation tinder-dry and flammable.
Here’s a look at precipitation at the Columbus Basin SNOTEL site in the La Plata Mountains of southwestern Colorado. There were big snows from late December into March, then someone turned off the taps it seems and the usual mountain rains didn’t materialize in early July, per normal. Now it’s just started raining. Let’s hope it keeps up.
The big winter resulted in a big spring runoff, naturally. But the high heat + low spring-summer precipitation melted and evaporated the snow, dashing hopes of an extra-long rafting season on many streams. After running far above median levels even into late July, many rivers — including the Dolores and Animas — are now running below normal for this time of year. That ripples downstream to Lake Powell, where inflows have also dropped rapidly since July 1, and are now even below 2022 levels for this date, causing reservoir surface levels to drop four feet in less than a month. A good, Colorado Plateau-wide monsoon will help fix that — if it materializes — but continued heat will continue to sap moisture from the streams and reservoirs.
This all meshes with a new study on climate change’s effects on the Colorado River. The researchers nicely summarize the key points of the study:
“We find that the basin has roughly 10% less water available under present-day conditions due to warming since the 1880s. The majority of water loss has occurred due to a heightened sensitivity to warming in the basin’s regions associated with snowpack, compared to regions without snowpack. We also demonstrate that without this warming, the Colorado Basin would have had significantly larger amounts of water available, equal to the size of Lake Mead, over the duration of the 2000–2021 megadrought.“
Did you get that? Climate change has stolen a whole Lake Mead from the Colorado River over the last couple of decades and the hydro-thievery will continue and even accelerate as temperatures rise.
This should provide yet more impetus to efforts to stop burning fossil fuels in the hope of slowing warming. But it also should be a reminder that even if drought conditions have subsided, the big aridification has not ended. We can’t be lulled into complacency by a good snow year, even a record-breaking one, or some flash-flood-triggering downpours. Lake Powell is still less than 40% full. The Colorado River still carries less water than has been allocated to its users, meaning they collectively must cut consumption by at least 2 million acre-feet per year, likely a lot more. Easing water use restrictions is a bad idea. The heat is in it for the long haul, I’m afraid, and we must act accordingly.
Fire season got a pretty slow start across most of the West, but now it’s upon us and it’s getting ugly in some places, with new blazes in Arizona, Montana, Alaska and Washington. The Hayden Fire in Idaho has burned through 18,000 acres.
Perhaps the most severe blaze is the one that may have seemed the most unlikely: The York Fire, which has torn through 77,000 acres of Joshua Trees, junipers, cacti, and other Mojave Desert vegetation along the California-Nevada border southwest of Las Vegas. It has bled into the newly established Avi Kwa Ame National Monument and is moving toward the Wee Thump Joshua Tree Wilderness. The fire’s severity has been exacerbated by a buildup of fuel — including invasive grasses and mustards — resulting from the wet winter and spring.
Chris Clarke, in his Letters From the Desert newsletter, has a short yet powerful, heartfelt early impression of the fire. I’d suggest you read it and then subscribe to his newsletter, a lovely chronicle of the Mojave Desert.
Random Real Estate Room
Christian Burney has a nice piece in today’s Durango Herald about how “Bicycle Bob” Gregorio — an all-around good guy, genius bicycle mechanic, and longtime fixture of the Durango cycling community — is building an adobe home in Aztec, New Mexico. The project is cool; the thing compelling him to do it in Aztec, not so much. Gregorio was priced out of the Durango housing market after living there for decades. It just seems wrong that one of the town’s icons can’t live in the place he loves and to which he as contributed so much.
The Colorado River Basin is an important natural resource for the semi-arid southwestern United States (US), where it provides water to more than 40 million people. While nearly 1.5°C of anthropogenic warming has occurred across this region from the 1880s to 2021, climate models show little agreement in the precipitation change during the same historical period, with no trend in the mean of the latest (sixth) generation of Global Climate Models. As such, here we focus on how the CO2 increase and associated anthropogenic warming over the historical period has impacted runoff across the Colorado Basin. We find that the Colorado Basin’s runoff over the historical period has decreased by 8.1% per degree Celsius of warming (°C−1). However, the magnitude of this sensitivity is reduced to 6.8% °C−1 when considering vegetation response to historical CO2. For present-day conditions, this translates to runoff reductions of 10.3% due to anthropogenic increases in both temperature and CO2 since 1880. We demonstrate that Colorado Basin’s natural flow has been decreased by roughly the storage of Lake Mead during the 2000–2021 megadrought due to this long term anthropogenic influence, suggesting the basin’s first shortage in 2021 would likely not have occurred without anthropogenic warming. We further show warming has led to disproportionate aridification in snowpack regions, causing runoff to decline at double the rate relative to non-snowpack regions. Thus, despite only making up ∼30% of the basin’s drainage area, 86% of runoff decreases in the Colorado Basin is driven by water loss in snowpack regions.
Updated Colorado River 4-Panel plot thru Water Year 2022 showing reservoirs, flows, temperatures and precipitation. All trends are in the wrong direction. Since original 2017 plot, conditions have deteriorated significantly. Brad Udall via Twitter: https://twitter.com/bradudall/status/1593316262041436160
Key Points
A 10.3% reduction in Colorado Basin’s present-day natural flow exists due to anthropogenic warming despite vegetation response to CO2
Anthropogenic warming reduced Colorado Basin’s natural flow by roughly the storage of Lake Mead during the ongoing megadrought (2000–2021)
Greater aridification in snowpack regions is causing water losses to occur roughly twice as fast compared to non-snowpack regions
Plain Language Summary
The Colorado River Basin provides a crucial source of water for an expansive water-limited region covering the southwestern US and its major cities. Several studies have demonstrated that this basin has experienced substantial reductions in water availability due to warming. Here, we quantify how reductions in water availability have varied from 1954 to 2021 across this basin due to human-driven warming that has occurred since 1880. As a part of this analysis, we include how the vegetation response to historical increases in CO2 has impacted water losses. We find that the basin has roughly 10% less water available under present-day conditions due to warming since the 1880s. The majority of water loss has occurred due to a heightened sensitivity to warming in the basin’s regions associated with snowpack, compared to regions without snowpack. We also demonstrate that without this warming, the Colorado Basin would have had significantly larger amounts of water available, equal to the size of Lake Mead, over the duration of the 2000–2021 megadrought.
For more than 30 years, climate researchers have been puzzling about how human-forced climate change affects the El Niño Southern Oscillation (ENSO), the warm phase of which we refer to as El Niño and the cold phase as La Niña. There are two aspects to this question:
Has climate change affected ENSO already? and
How will climate change affect ENSO in the future?
Arguably, we have made more progress on the second question than the first because greenhouse gas forcing in the future is expected to be stronger than it has been up to now; the stronger the forcing, the more obvious its impacts become. Whether climate change has already affected ENSO has been a harder nut to crack. A previous blog article by Tom DiLiberto summarized the conclusions from the latest IPCC report, which essentially found that there was no clear evidence yet for an impact of climate change on tropical Pacific sea surface temperature (SST) anomalies related to ENSO. However, in a recent study published in Nature Reviews Earth and Environment, Wenju Cai and colleagues revisit this question, reviewing past studies and performing new analyses to provide additional insights on this important question.
One of the primary sources of information we have for past ENSO behavior is the instrumental record of sea surface temperatures (SST) from the tropical Pacific. Many have noted that the most recent period of the observed SST record in key ENSO index regions, like Niño-3.4, exhibits higher-amplitude variability than the early part of the record. The most recent 50-60 years, for example, appears to be more energetic, with larger swings up and down, than the previous 50-60 years. Cai and colleagues make this point using several different data sources and methods—evidence that the pattern is real, not just a data quality problem due to the relative sparsity of data before 1950.
Sea surface temperature in the Niño-3.4 region of the tropical Pacific from 1900 to 2023. Monthly data have been smoothed with a 5-month running mean after removing a seasonal climatology for 1981-2010. Red peaks are El Niño events and blue troughs La Niña events. The approximate mid-point of the time series is indicated by the vertical black line in 1960. The white area between ±0.5°C signifies neutral conditions. Data is from HadISST, which uses satellites and other in situ observational data.
Assuming the bigger swings are real, the key question is why? We might expect climate change to have already made an impact on ENSO because the atmosphere now holds 50% more heat trapping greenhouse gas concentrations than it did at the start of the Industrial Revolution (footnote #1). The challenge is to tease the forced part of the signal out of the background noise of natural ENSO variations. The question can’t be answered by just the data itself because the record is too short and the farther back in time we go, the less reliable the data becomes. Just because the most recent period has stronger variability (those larger ups and downs mentioned above) than earlier periods does not automatically mean that climate change is the cause, since it could be just the natural waxing and waning of ENSO cycle variations from one decade to the next.
Cai and colleagues use the full arsenal of multi-century-long computer simulations from the latest generation of climate models, combined with sophisticated analysis techniques, to address this question. The model simulations are not intended to exactly mimic the historical record of ENSO variations. However, many of these models can reasonably simulate key aspects of the observed dynamics and statistical behavior of ENSO (footnote #2). The authors use multiple different analysis approaches from which a consistent result emerges: there is a high likelihood that ENSO variations have increased in amplitude by up to 10% since 1960 due to the observed rise of greenhouse gas concentrations in the atmosphere.
An ENSO index that characterizes variability in the 60 years before 1960 (green) and the 60 years after 1960 (purple) for several models, each with a very large ensemble (about 40 on average) of simulations (footnote #3). The y-axis shows the standard deviation of the index. The mean across the multimodel large ensemble averages is designated LE MMEM and the multimodel ensemble average across all Coupled Model Intercomparison Project 6 (CMIP6) models is designated as CMIP6 MMEM. See paper for details.
One manifestation of this amplified cycle is that strong El Niño and La Niña events are becoming stronger and more frequent, just as we’ve observed in the more recent historical record. The big events pack the most punch, so even though 10% doesn’t sound like much, it juices up the strongest and most societally relevant year-to-year climate fluctuation on the planet. Combined with the other ways global warming has affected ENSO impacts (footnote #4), this amplified cycle translates into more extreme and frequent ENSO-linked droughts, floods, heat waves, wildfires and severe storms like we observed during the recent triple dip La Niña that ended last March and the major 2015-16 El Niño a few years ago.
Illustration by Anna Eshelman, NOAA Climate.gov.
This work forms a bridge to past research that clearly indicates ENSO variations are likely to become even stronger (by 15-20% under high emission scenarios) later this century if atmospheric greenhouse gas concentrations continue to rise. The article also goes beyond just saying that there is a detectable signature of climate change in ENSO cycle variations today; it also explains how this happens in physical terms. ENSO arises from self-reinforcing feedbacks between the atmosphere and ocean and those feedbacks become stronger in a warmer world. Under increased greenhouse gas forcing, the upper layers of the tropical Pacific warm faster than the deeper ocean. The warmer surface layer enhances precipitation, and together they increase the density stratification of the upper ocean, making it more sensitive to wind forcing. Thus, the coupling of the ocean and atmosphere becomes stronger, making the swings between El Niño and La Niña more extreme.
There are caveats though. The saying “All models are wrong, but some are useful,” attributed to the British statistician George Box, applies here. The conclusions of this study rely on the current generation of climate models, which have known limitations in the tropical Pacific Ocean. However, they are the best tools available to us for addressing this problem, and Cai and colleagues wring out every bit of information there is from them to make their case.
Lead Editor: Michelle L’Heureux (NOAA)
Footnotes:
(1) Why might increasing greenhouse gases lead to increased variability? Climate change can exert its influence in two ways: through “thermodynamics” and “dynamics.” Thermodynamics is easy to understand as it is the direct response to increases in heat trapping greenhouse gases in the atmosphere. The dynamics, related to winds and currents in our atmospheric and oceanic system, can change too, leading to increased ENSO variability as we explain later in this blog post.
(2) Because of known imperfections in climate models, we don’t want to rely on just one model. So, Cai and colleagues used over 40 models (called an “ensemble”) and while these models may all be imperfect, they are imperfect in different ways. So, if we make an average across the ensemble (what we call an “ensemble mean”) we can extract useful information that will be more reliable than provided by any individual model alone.
(3) Single-model large ensemble experiments are useful for characterizing uncertainty due to internal variability as opposed to uncertainty due to model differences. Each ensemble member is generated from slightly different initial conditions, which through the “butterfly effect” of chaos, yields a different time history for each ensemble member. The spread of the different members is a measure of internal variability, which can be reduced by averaging across all members to form an ensemble mean. In the study by Cai and colleagues, further confidence is gained by averaging the ensemble mean of seven model large ensemble experiments (what they call the large ensemble multimodel mean, or LE MMEM).
(4) Climate change can amplify ENSO impacts, even if ENSO properties and dynamics are not affected. The reason is simple. A warmer atmosphere holds more moisture, so that when ENSO events lead to conditions that favor enhanced precipitation in a particular region, it can rain even harder. Likewise, greenhouse gas forced warming trends can lead to soil moisture deficits that help to intensify ENSO-related drought development. So, it’s a double whammy if in fact greenhouse gas forcing does boost the variability in ENSO cycle sea surface temperatures, like Cai and colleagues argue, since not only will ENSO be stronger but its impacts will be further amplified.
Updated Colorado River 4-Panel plot thru Water Year 2022 showing reservoirs, flows, temperatures and precipitation. All trends are in the wrong direction. Since original 2017 plot, conditions have deteriorated significantly. Brad Udall via Twitter: https://twitter.com/bradudall/status/1593316262041436160
Click the link to read the article on the CBS News website (Bill Whitaker). Here’s an excerpt:
Brad Udall, a climate scientist at Colorado State University, went out on Lake Powell with us…
Bill Whitaker: So what does this tell you about what’s happening on the Colorado River?
Brad Udall: Well, it’s a signal of the long-term problem we’ve been seeing since the year 2000, which is climate change is reducing the flows of the Colorado significantly…
Brad Udall has strong connections to the river. As secretary of the interior, his uncle, Stewart Udall, opened the Glen Canyon Dam. His father, Congressman Mo Udall, fought to channel river water to Arizona. As a young man, Brad was a Colorado River guide. Today he analyzes the impact of climate change on water resources.
Bill Whitaker: Is the west on a collision course with climate change?
Brad Udall: In some ways yes, but we have fully utilized this system. We’ve over-allocated it, and we now need to think about how to turn some of this back. ‘Cause the only lever we control right now in the river is the demand lever. We have no control over the supply. So we have to dial back demand.
Seventy percent of Colorado River water goes to agriculture. When the federal government declared the water shortage, it triggered mandatory cutbacks. Pinal County, Arizona got hit hard…
Amelia Flores: All the water users are gonna have to give up something to keep that water in the lake.
Amelia Flores is chairwoman of The Colorado River Indian Tribes, a reservation of four tribes a few hours west of Phoenix, with the oldest and largest water rights in Arizona. After being moved to reservations, Southwest tribes got rights to about a quarter of the river’s flow, but government red tape and lack of infrastructure have prevented them from using their full allotment. Flores told us until this drought, tribes were never included in water negotiations.
Bill Whitaker: Why had you not had a seat at the table before this?
Amelia Flores: Because the tribes have always been overlooked in the policymaking and– and in– in the law of the river. But that day has come to an end.
Native America in the Colorado River Basin. Credit: USBR

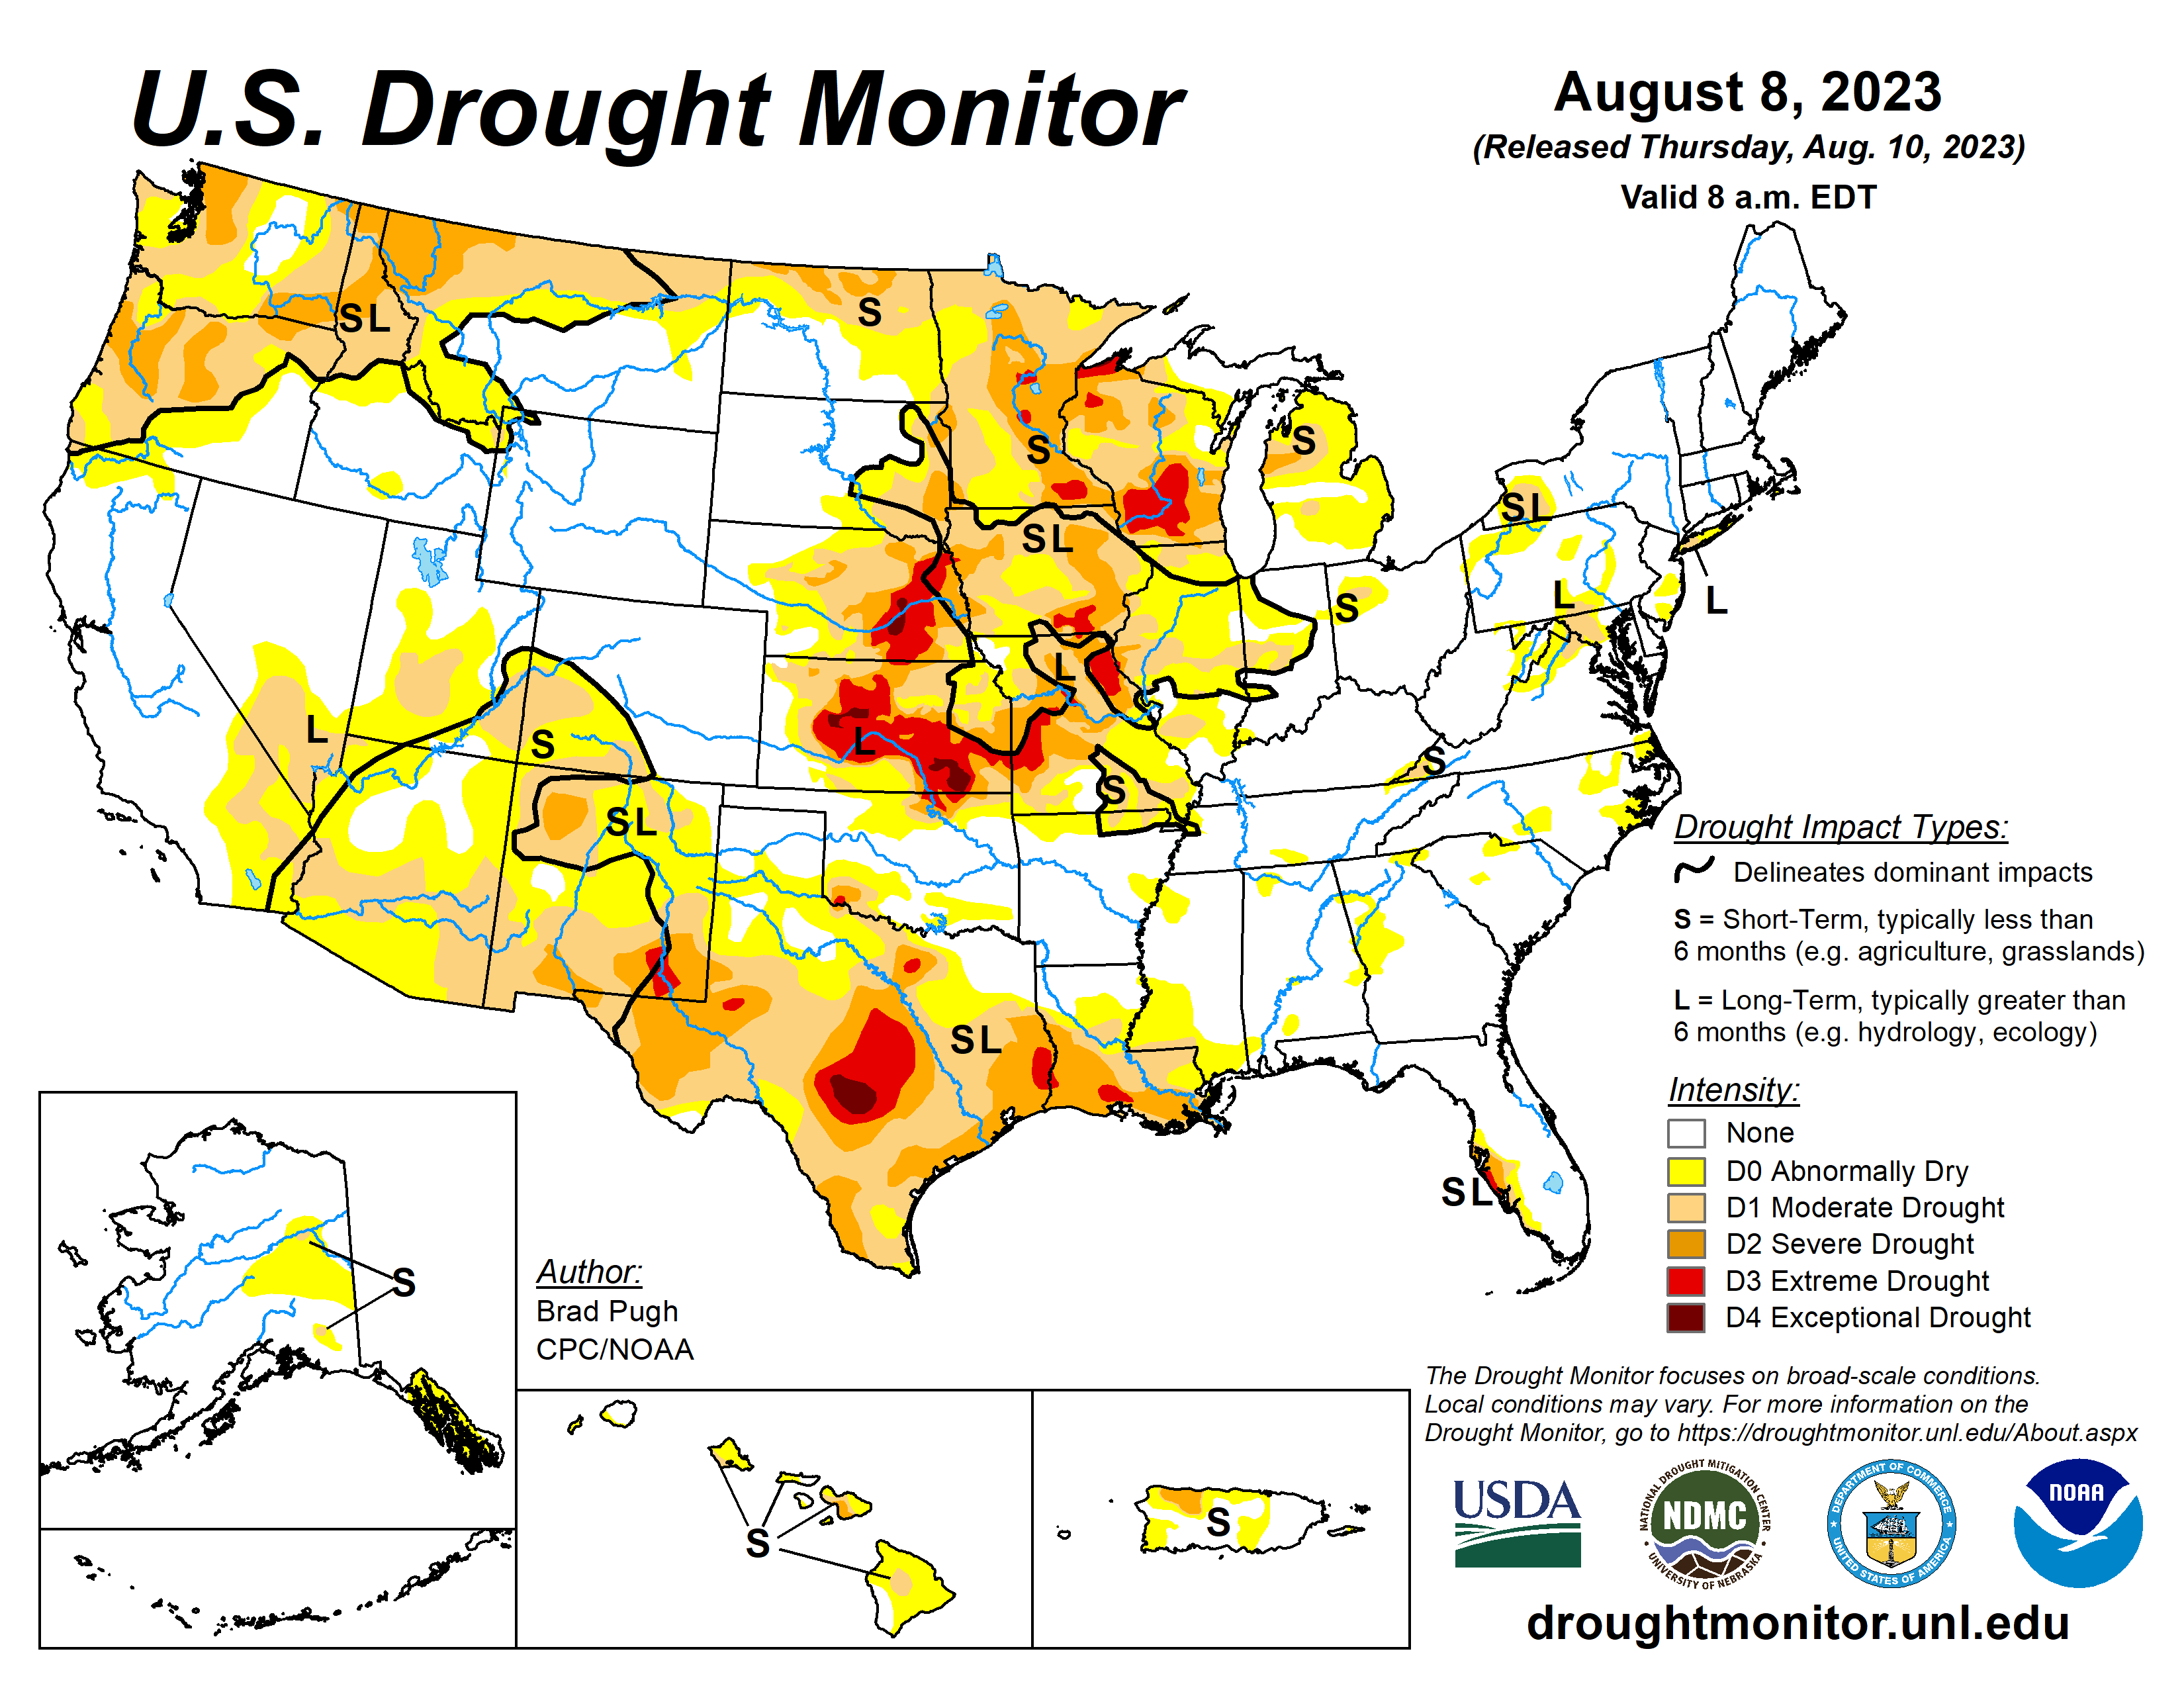
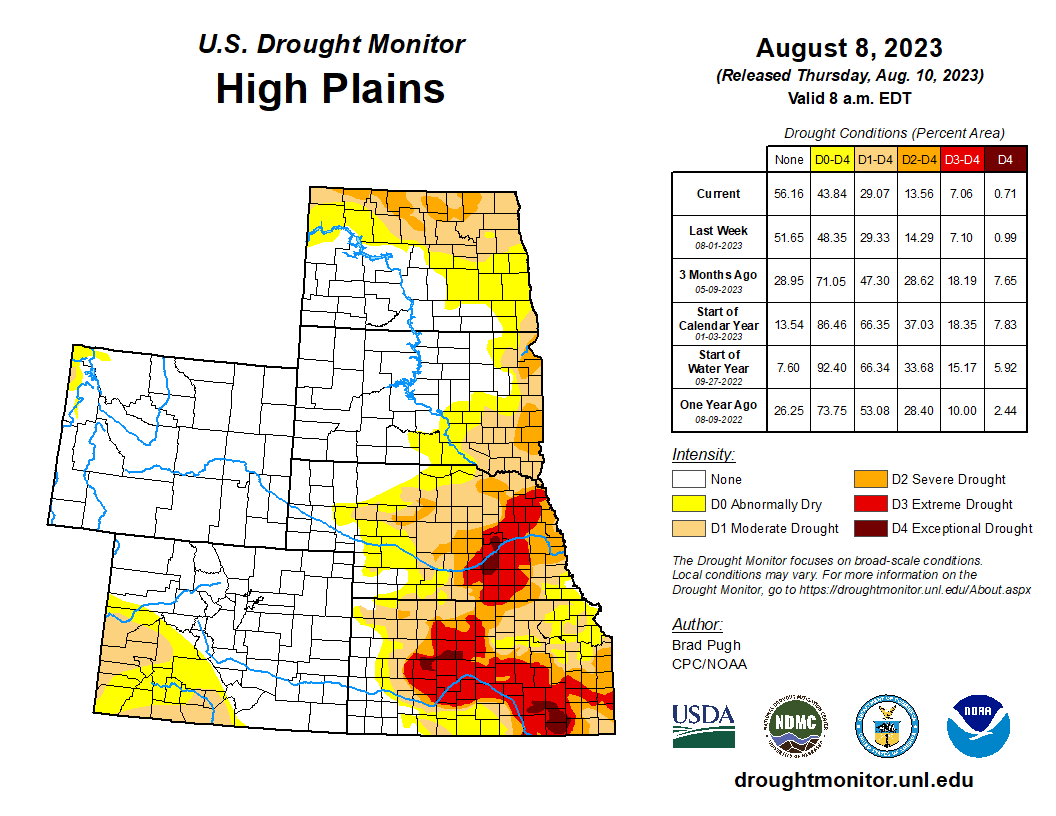

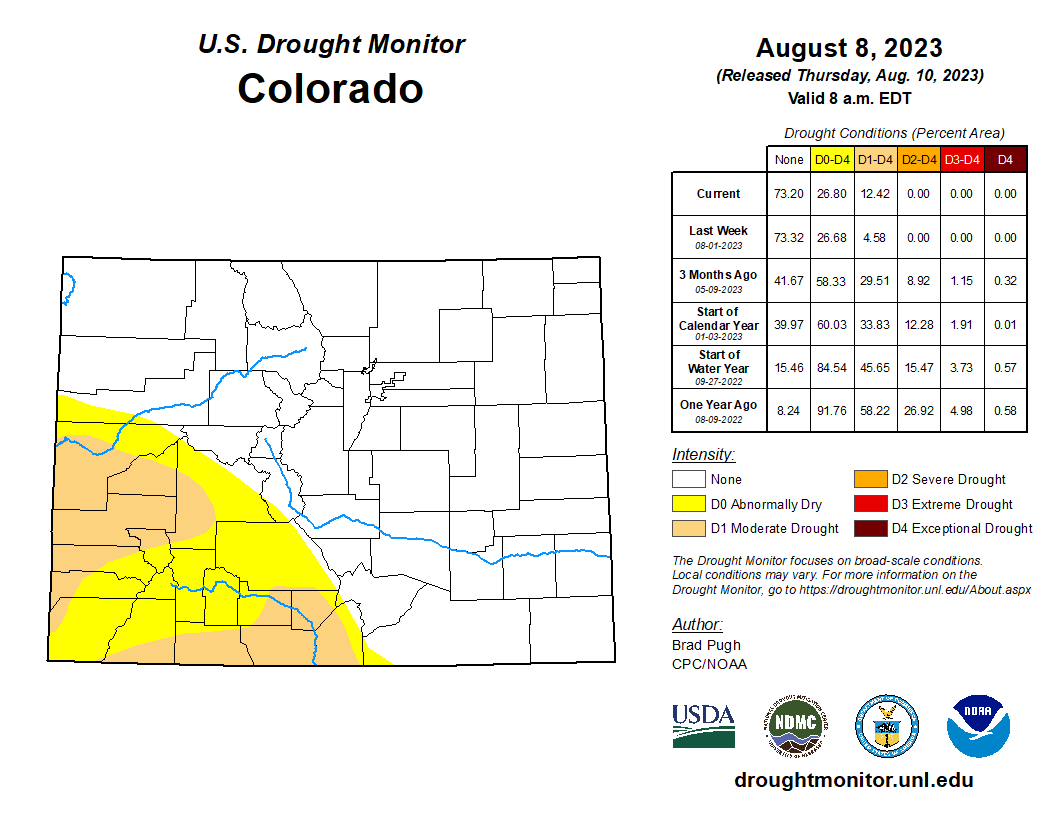
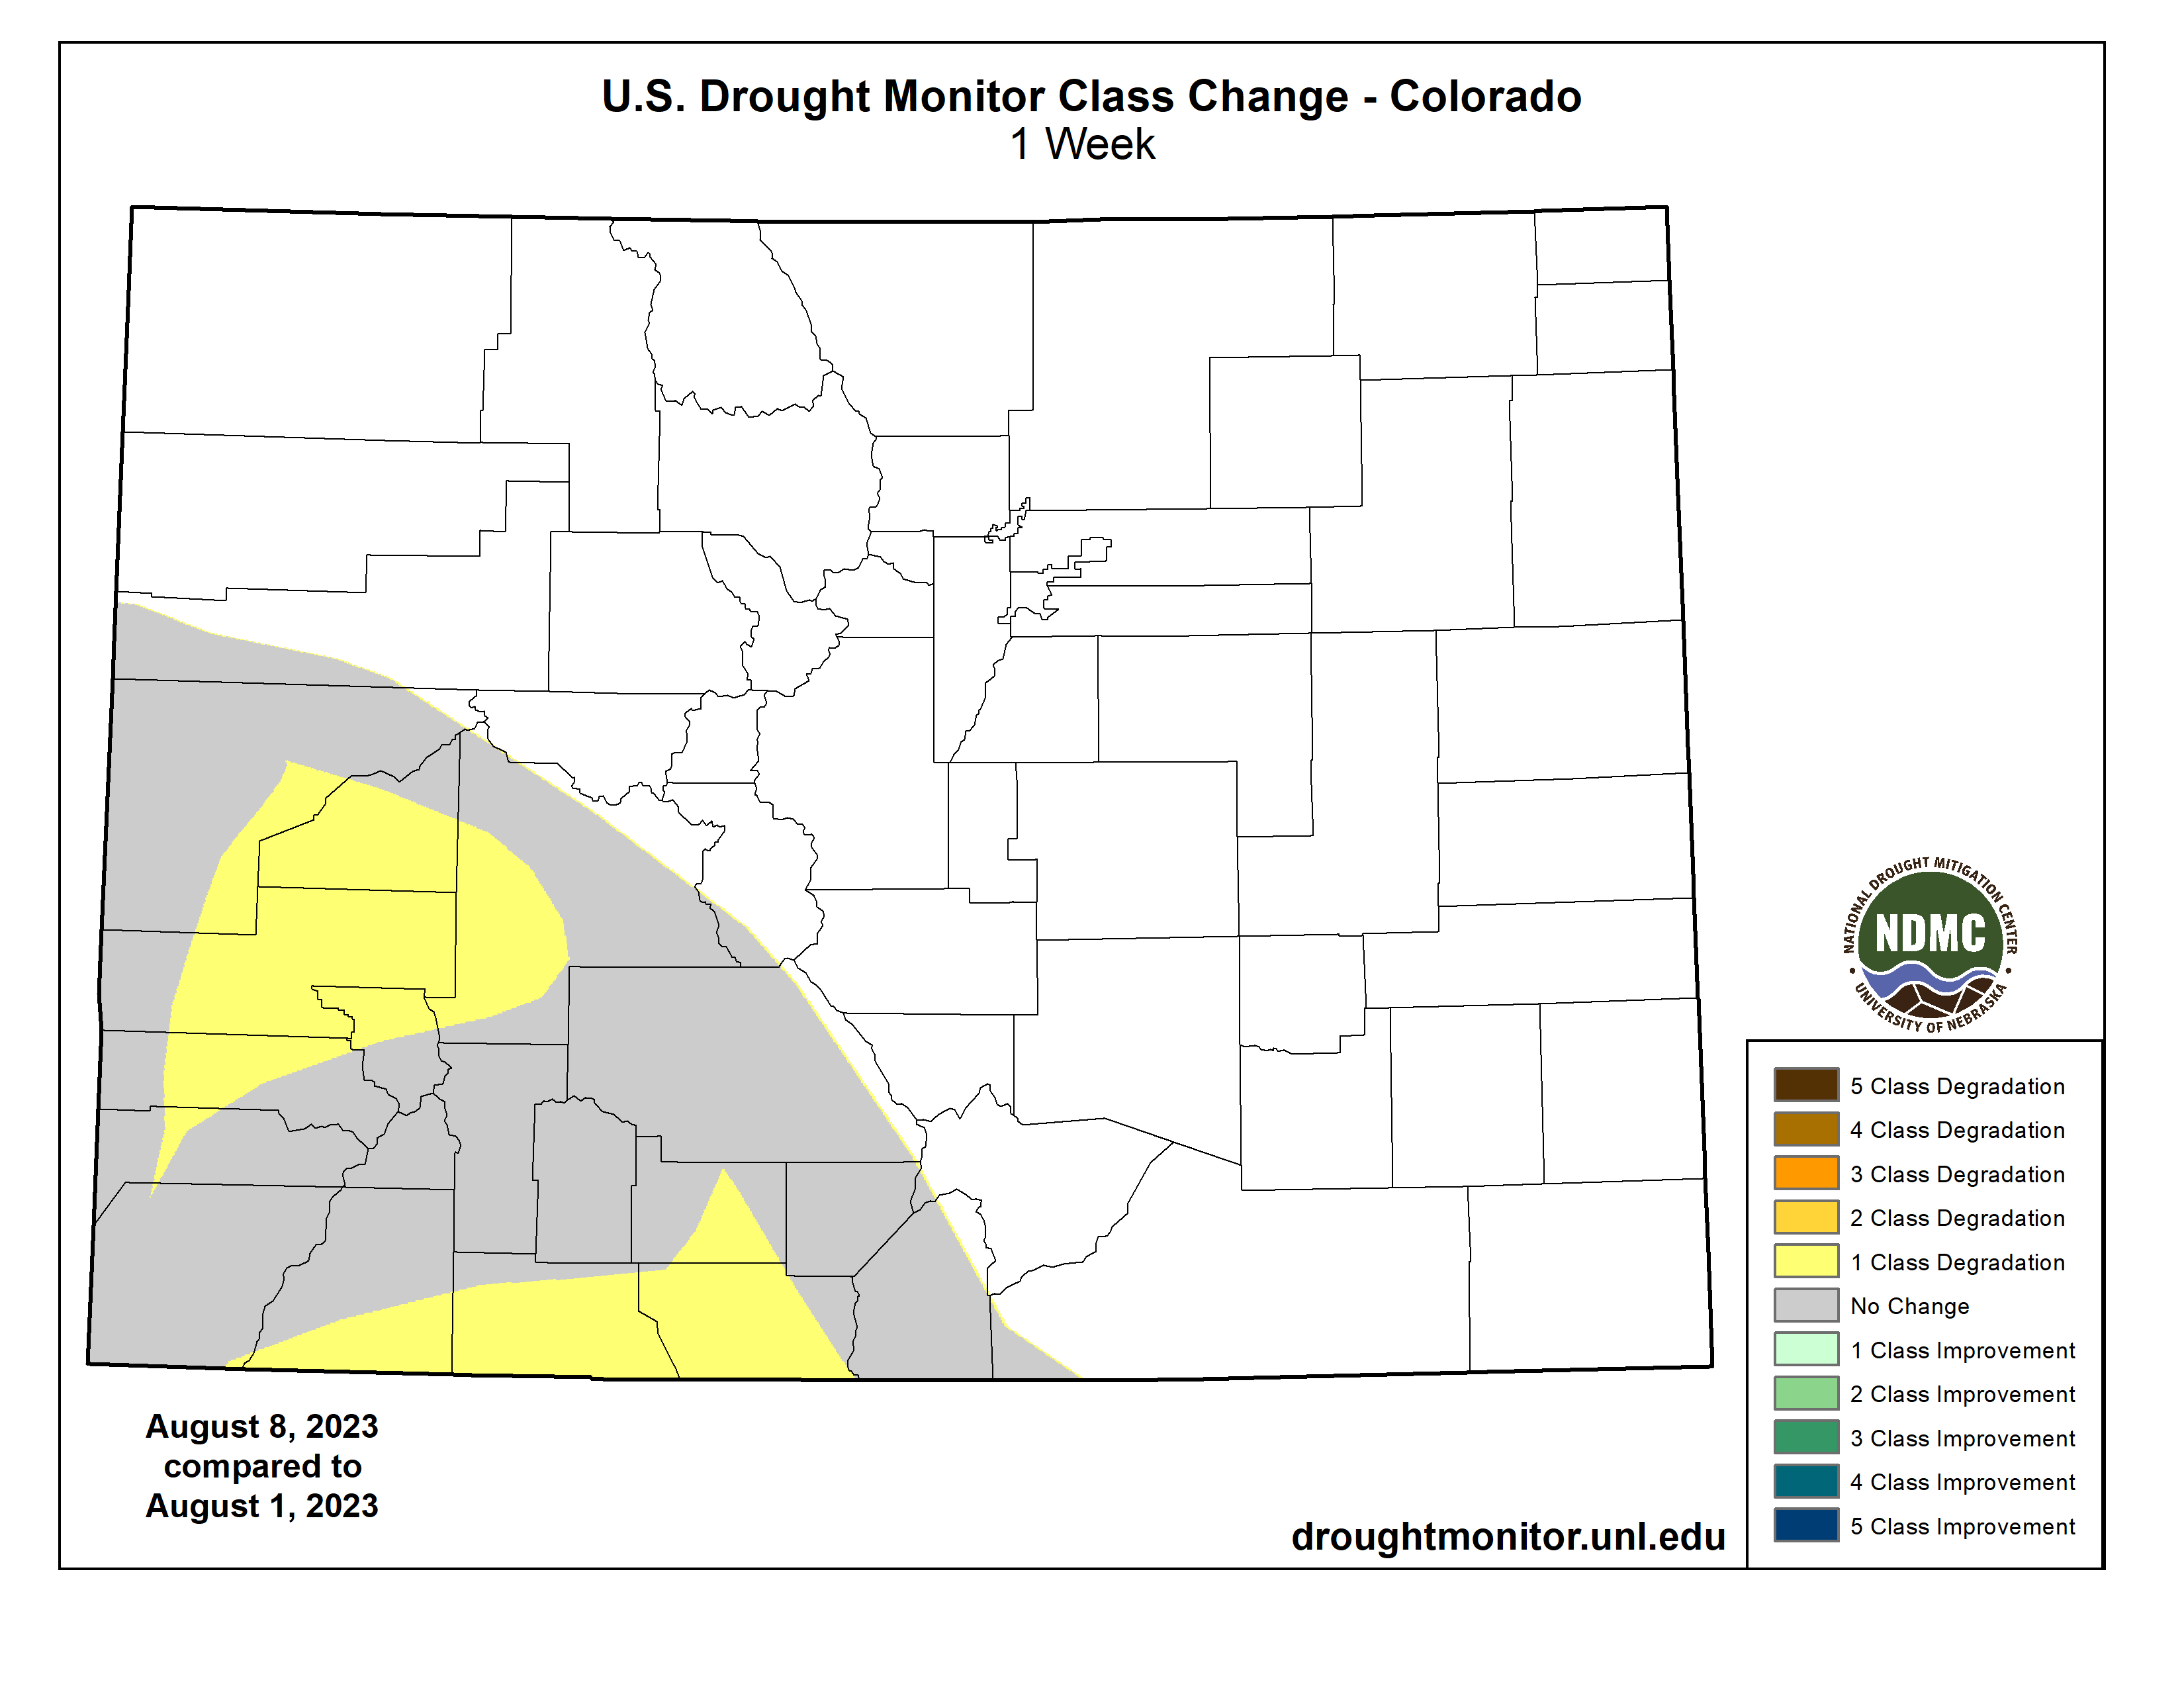
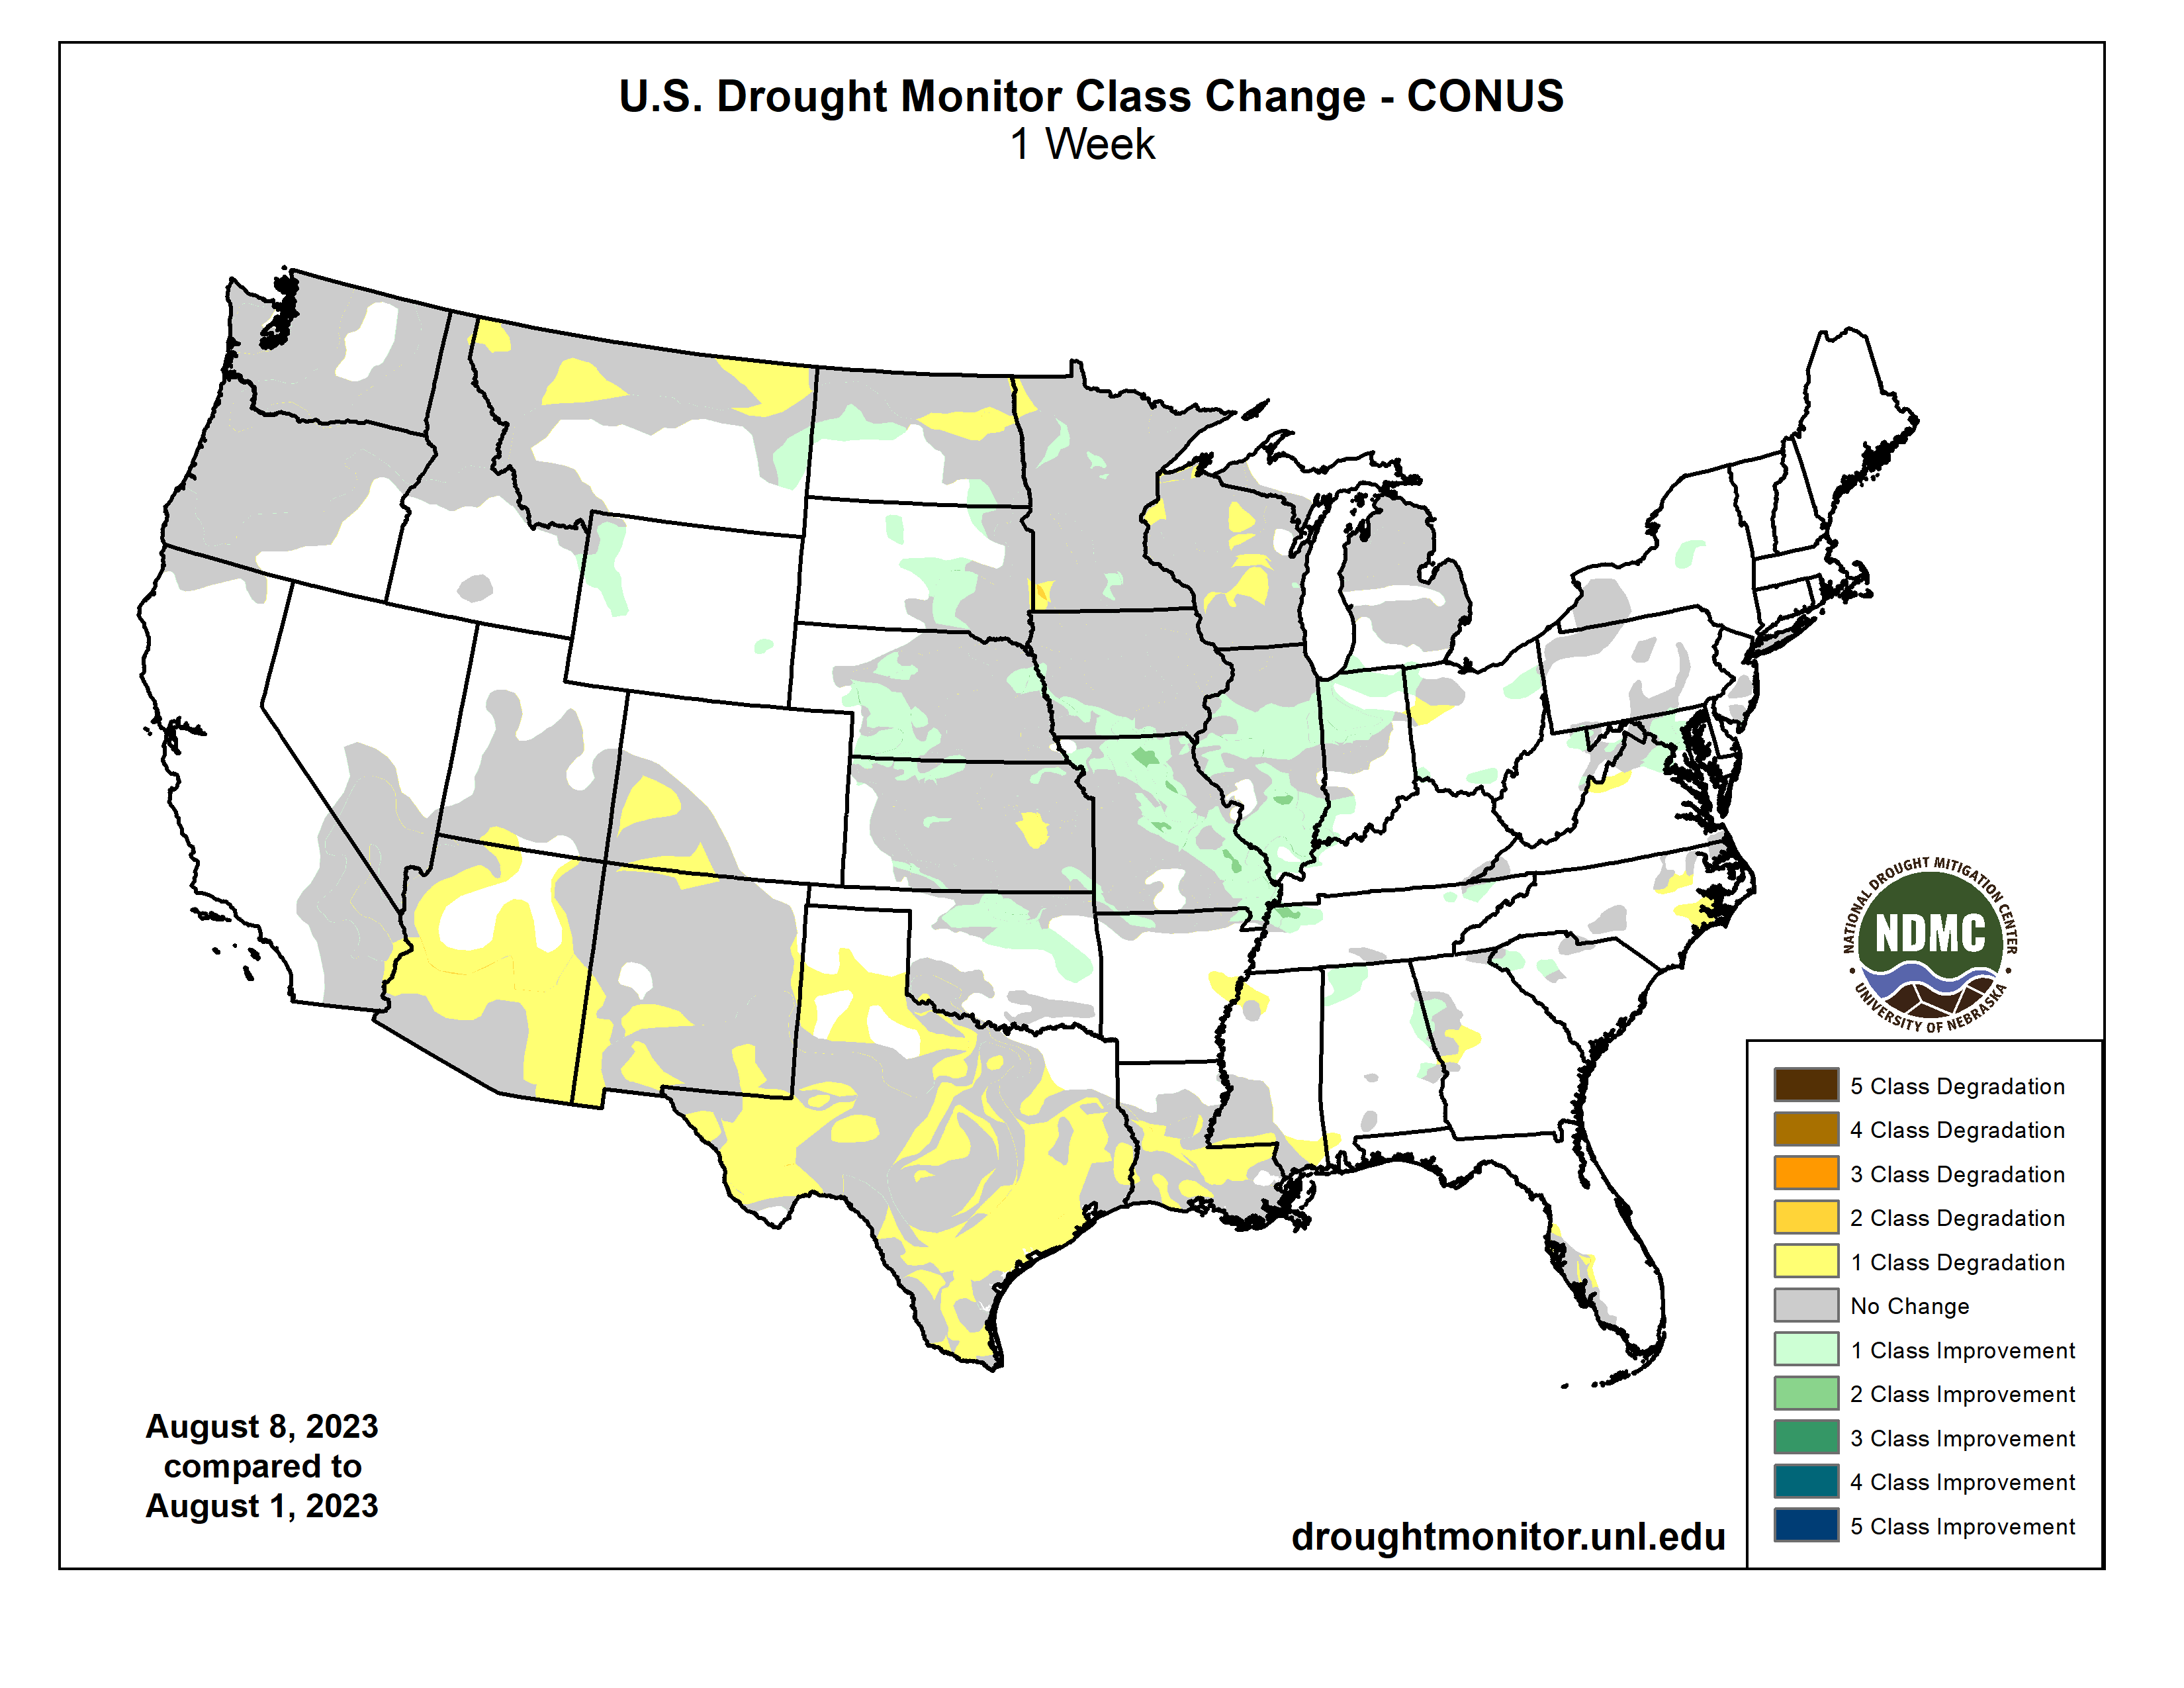
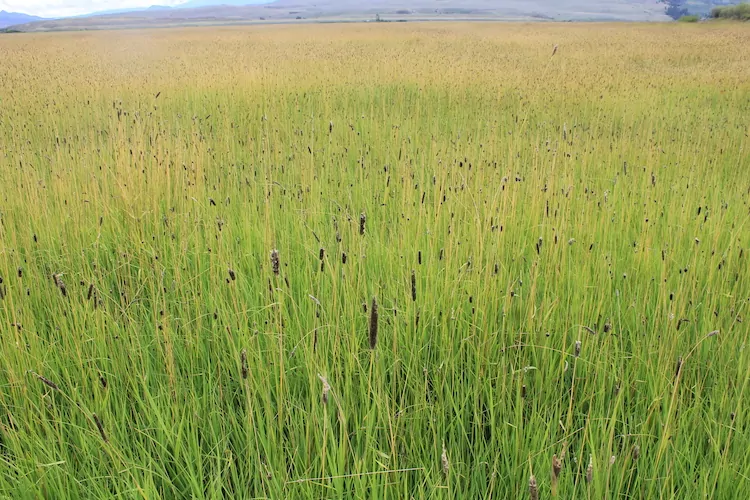
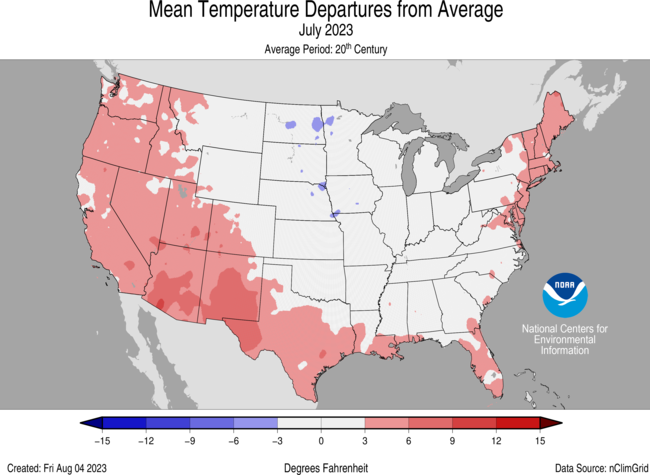


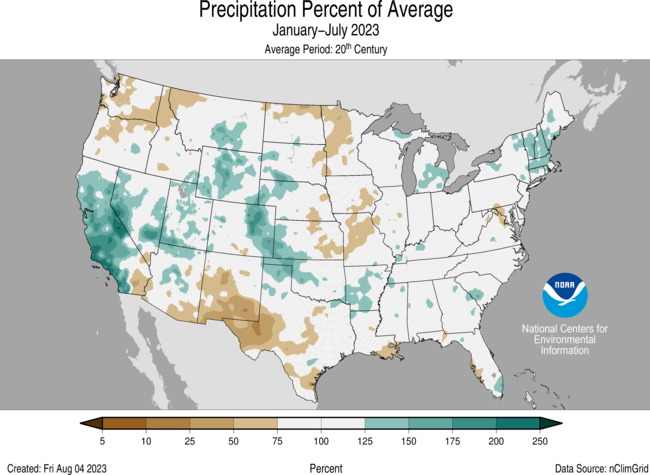
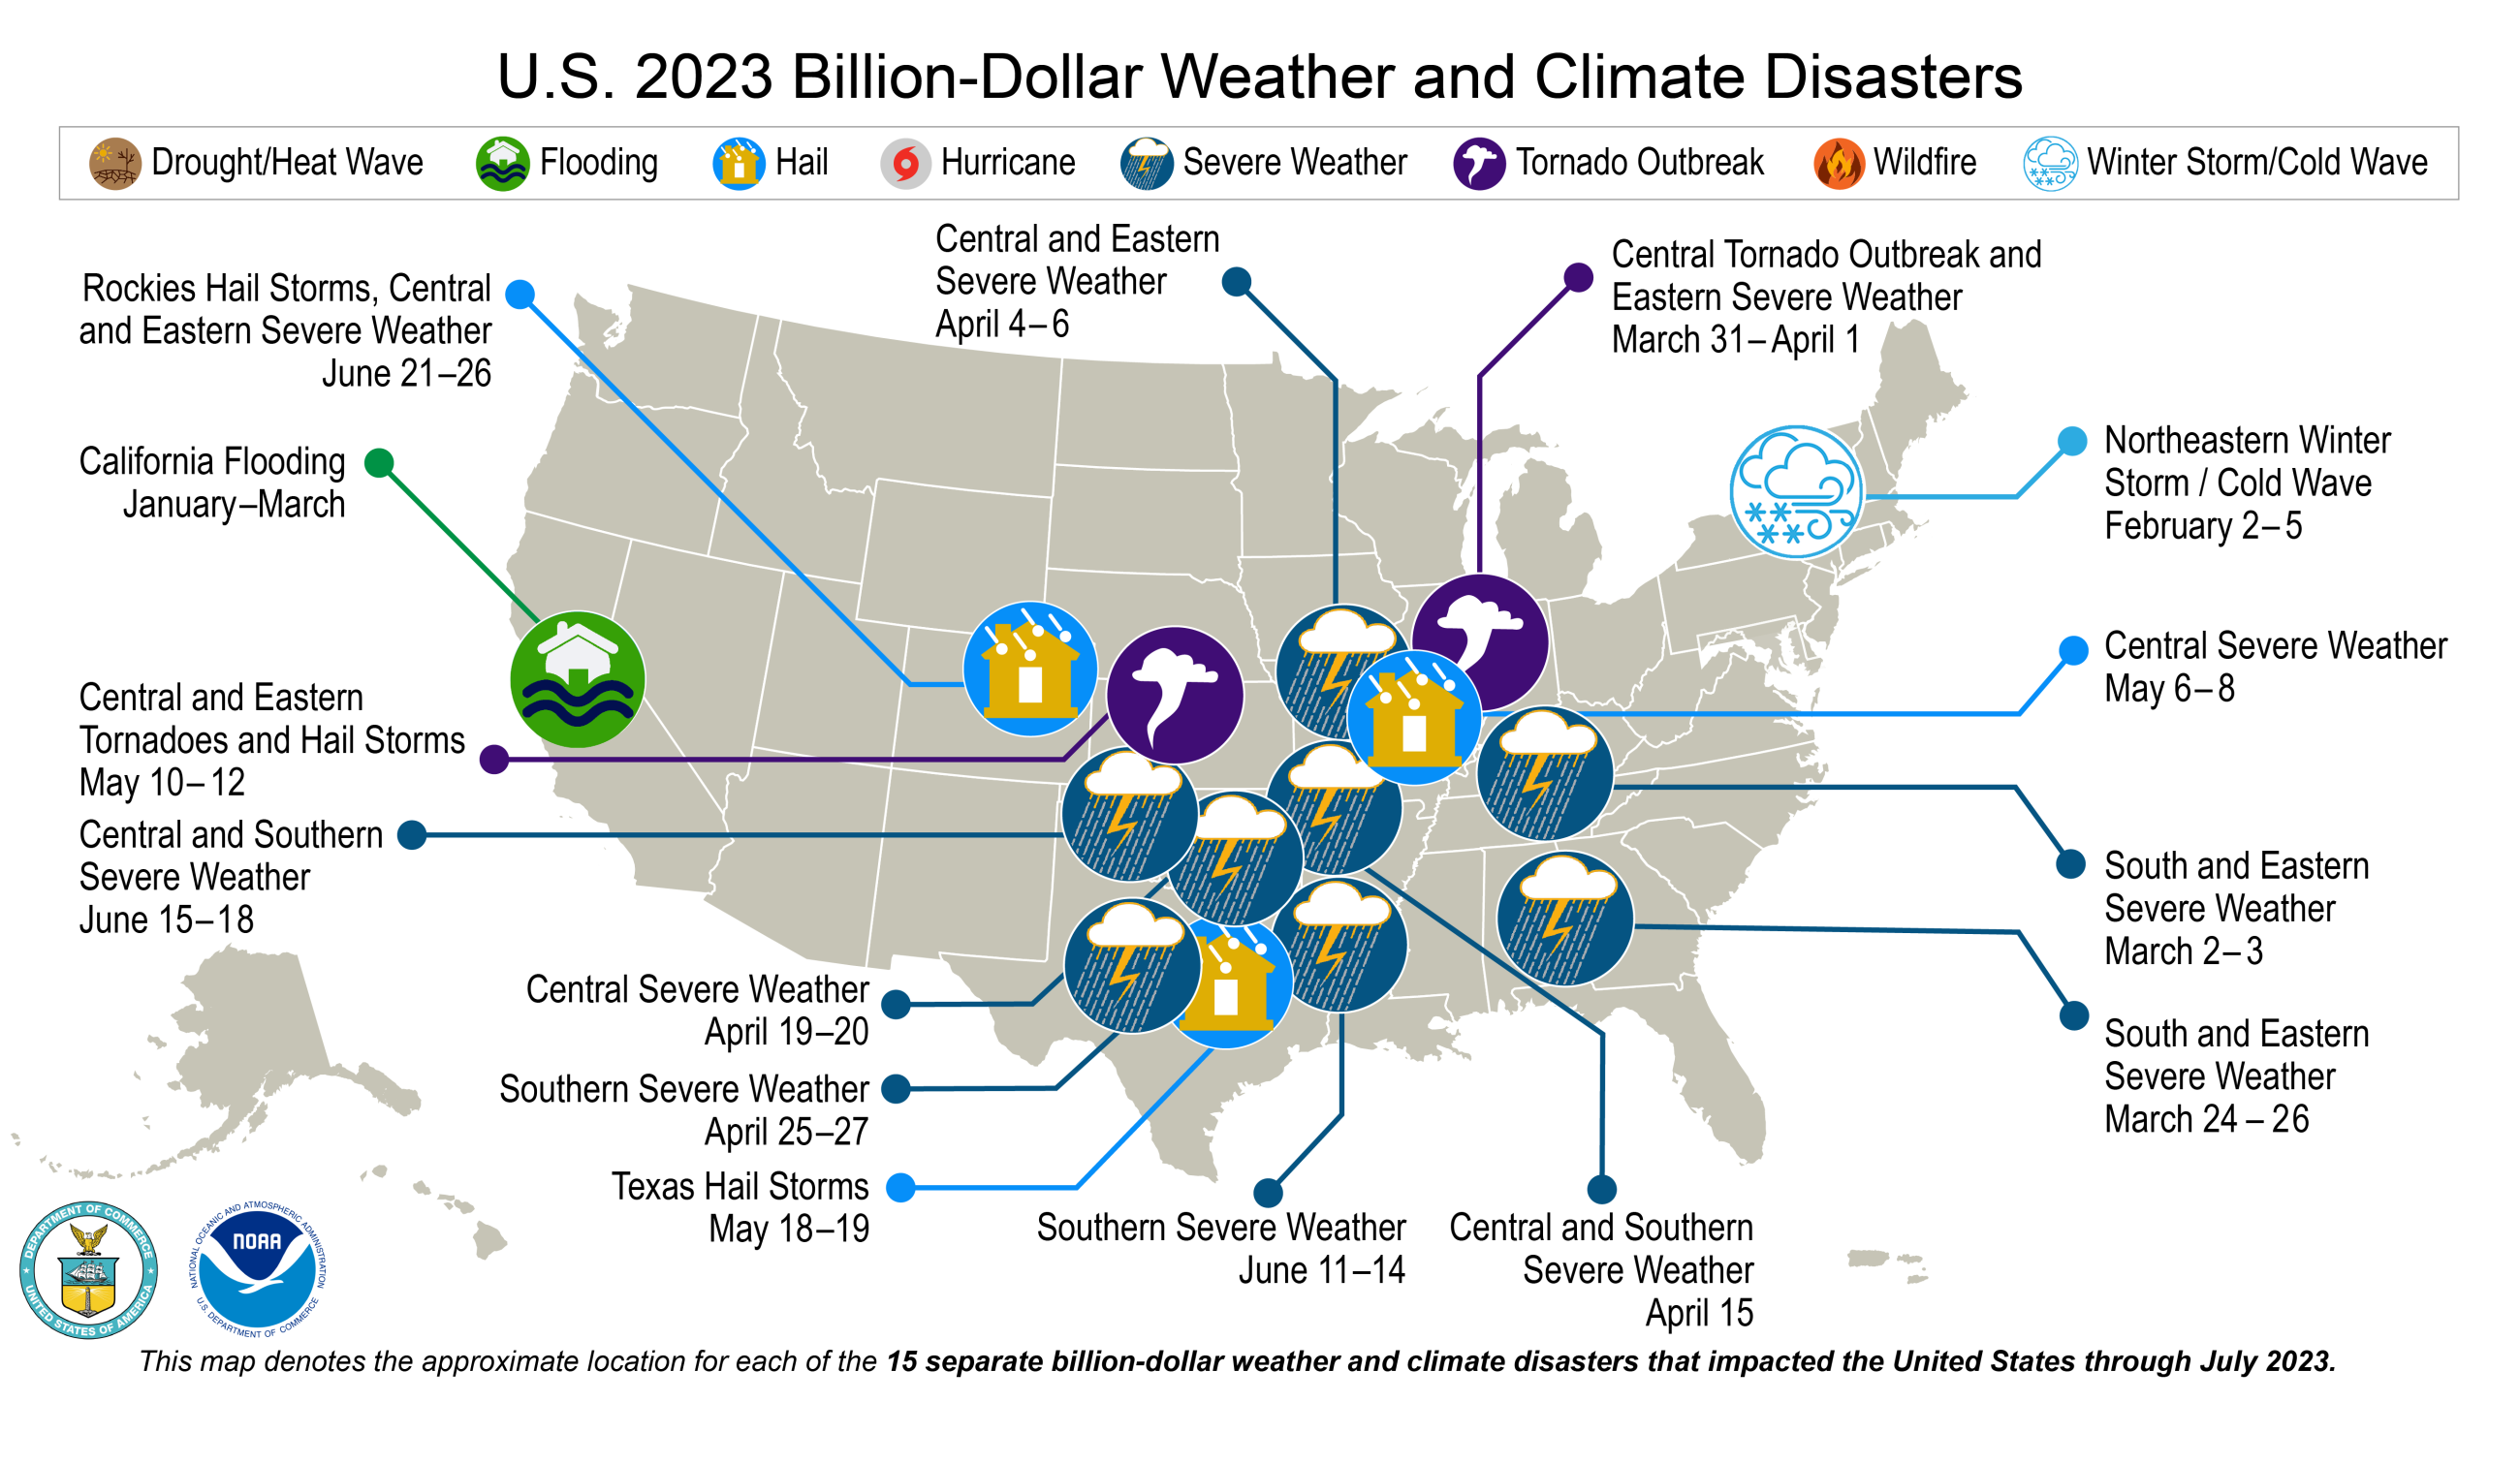


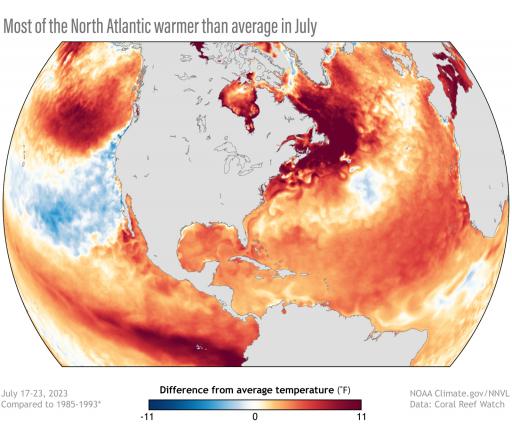


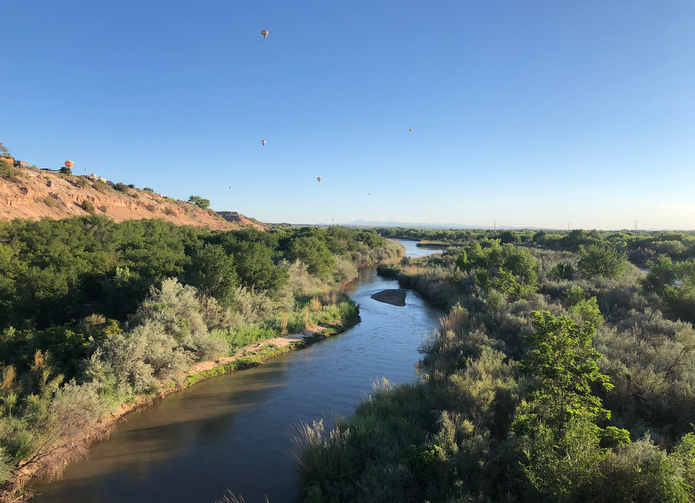
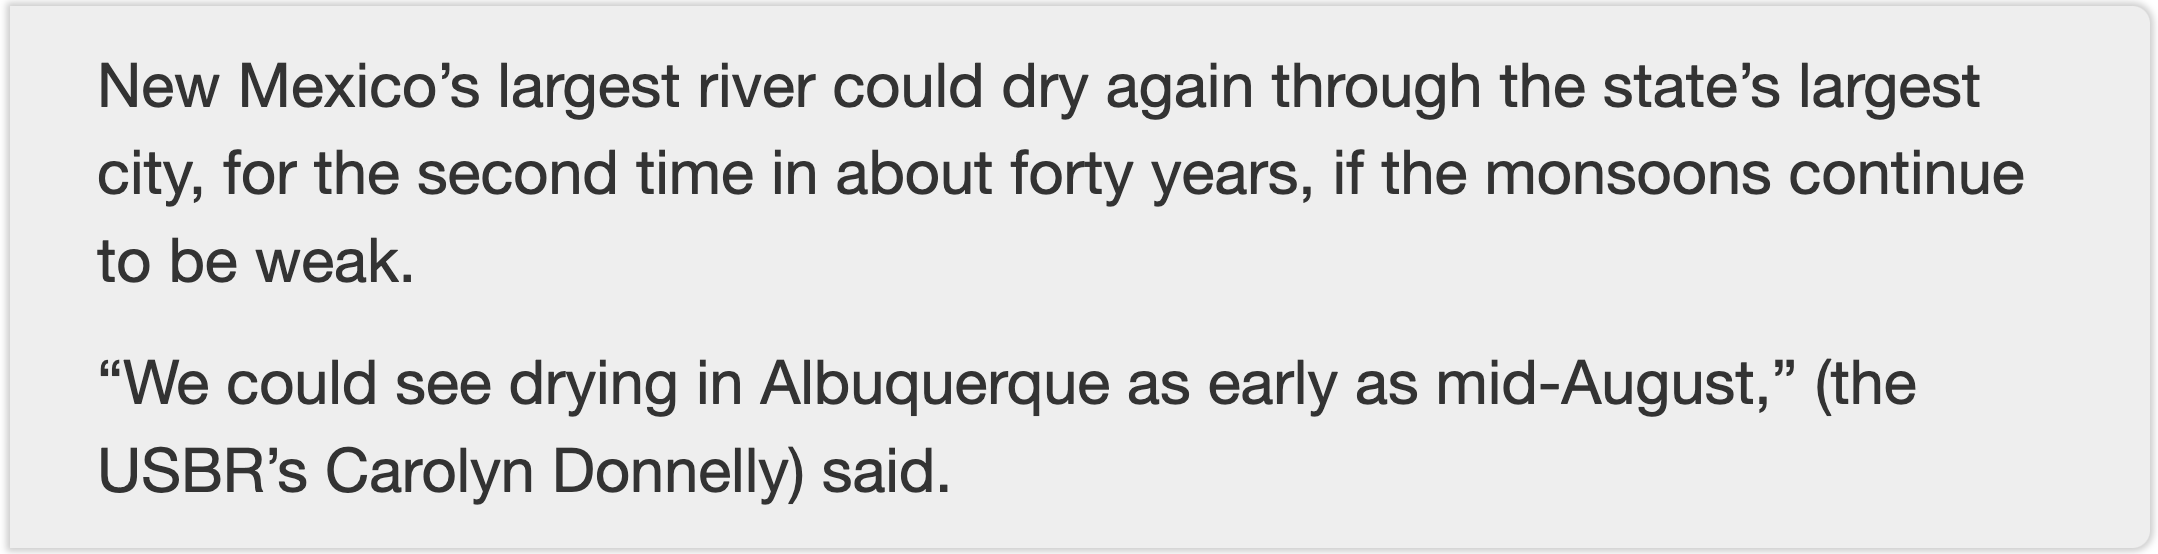
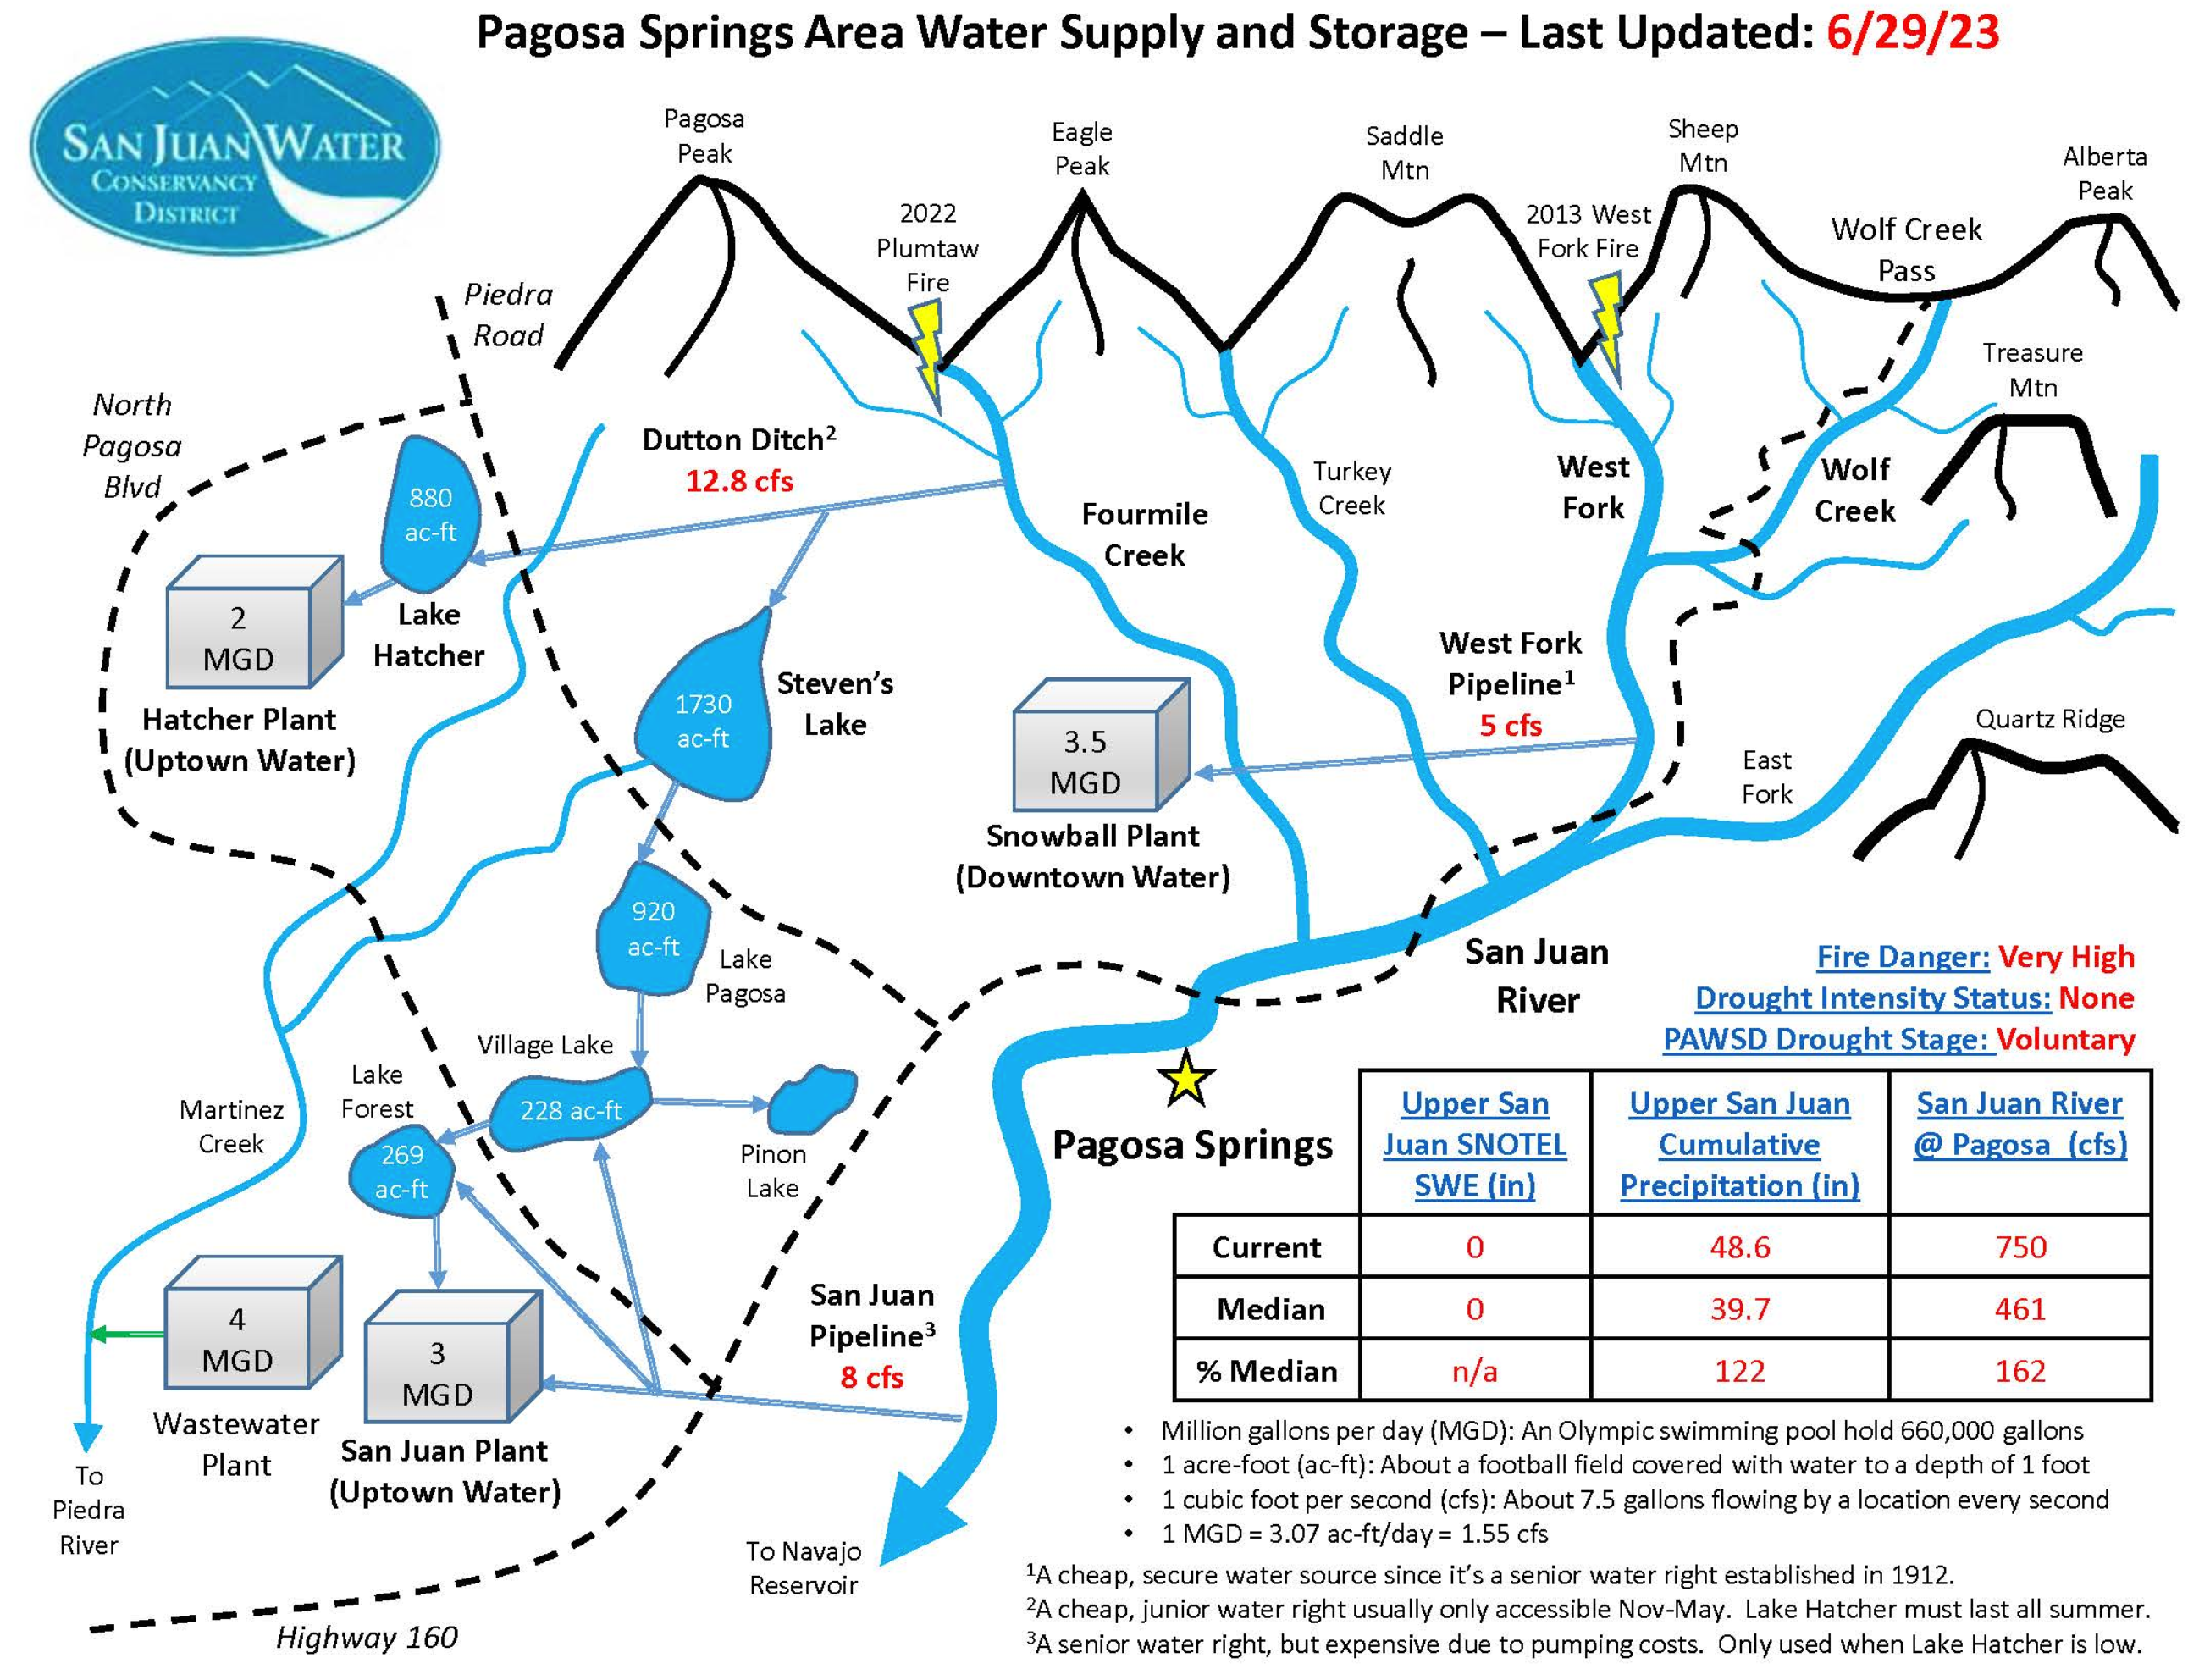


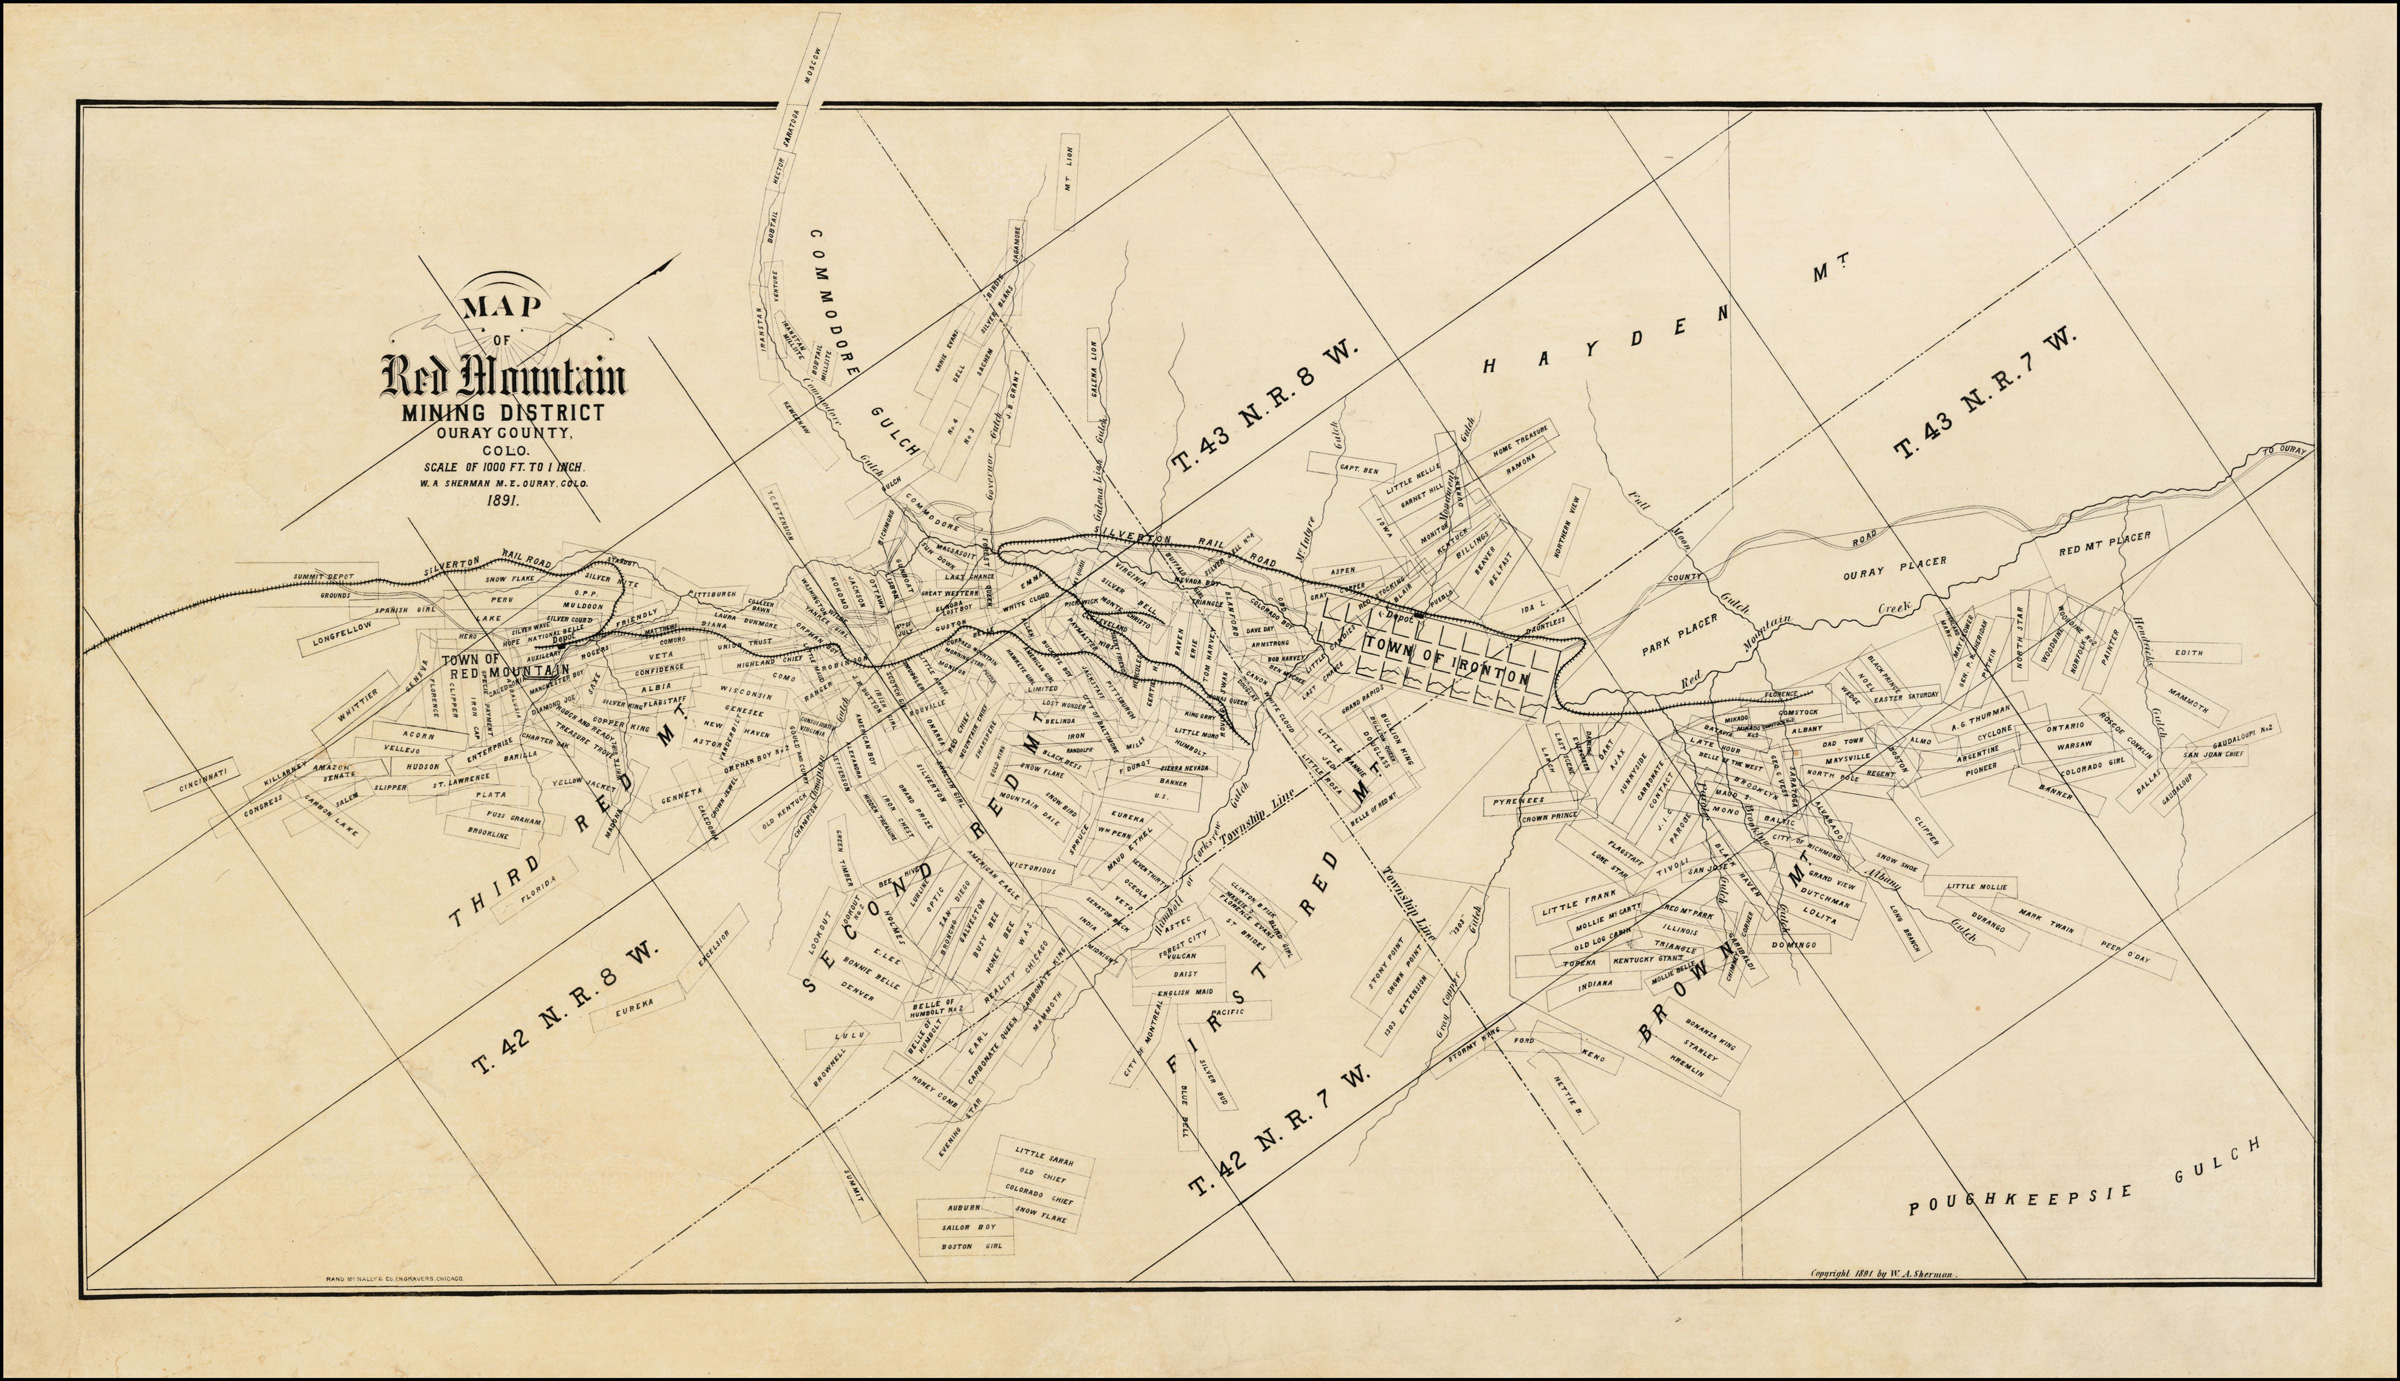


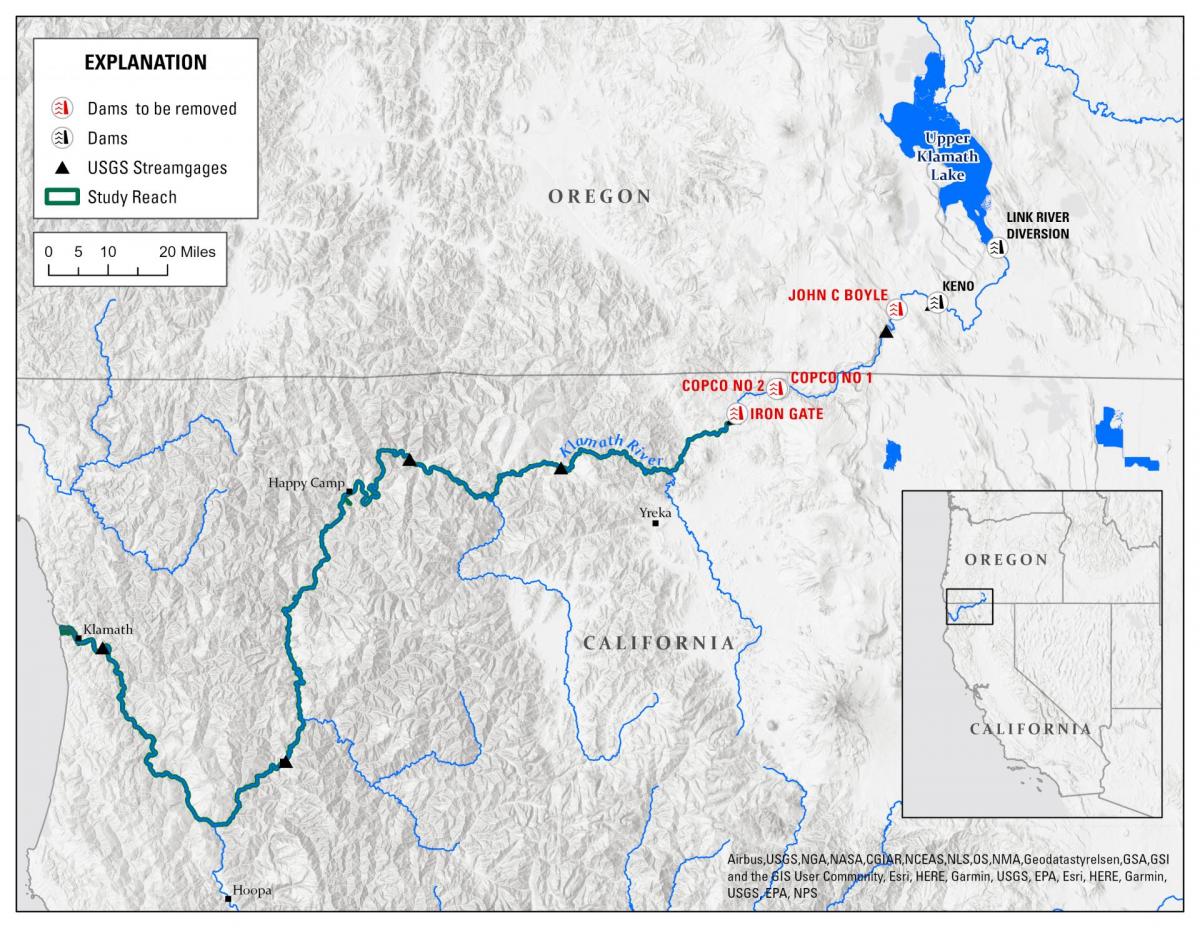

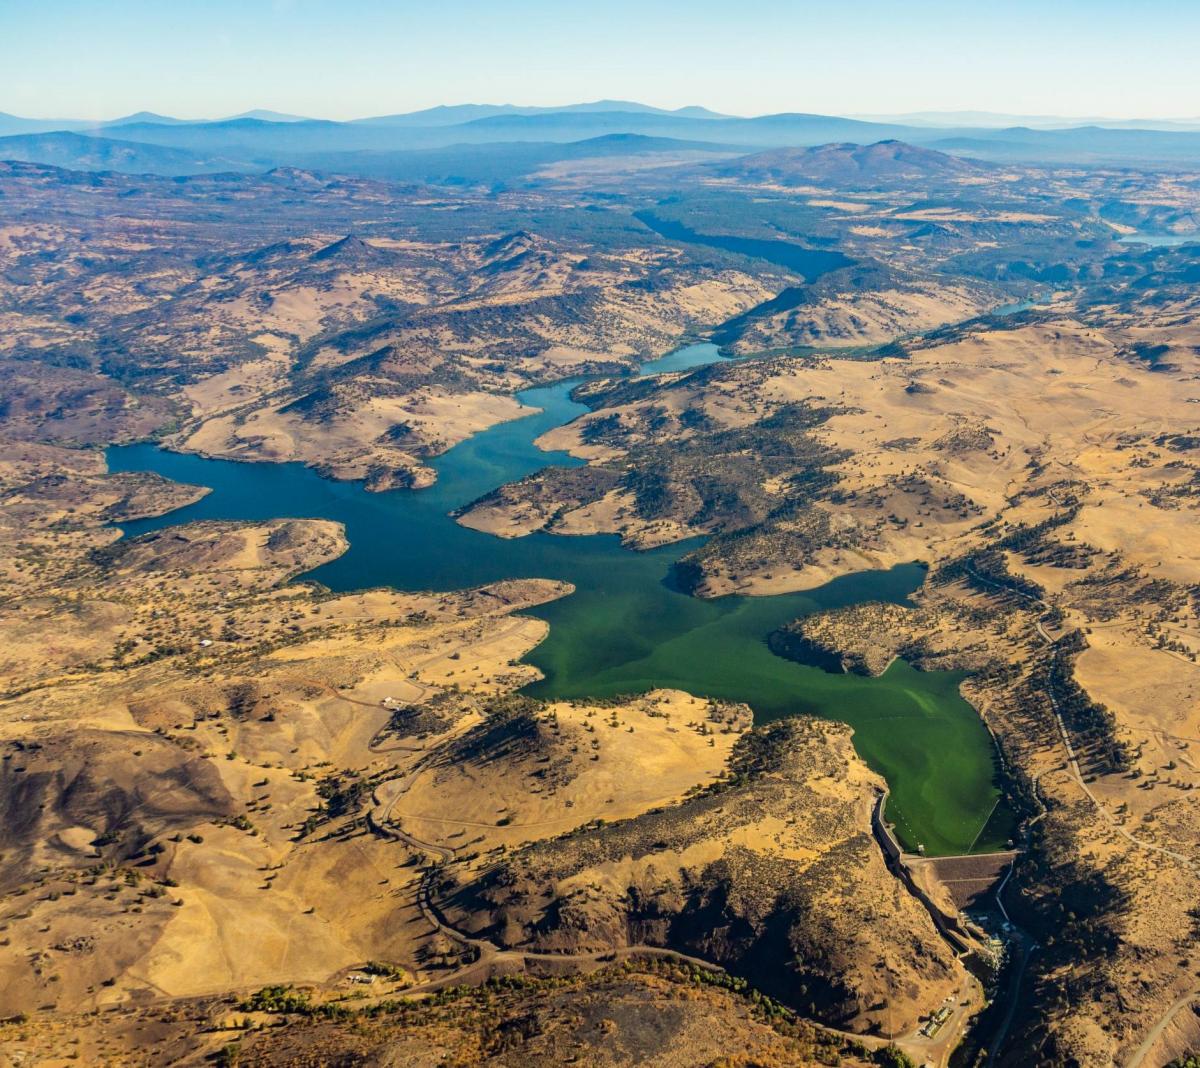
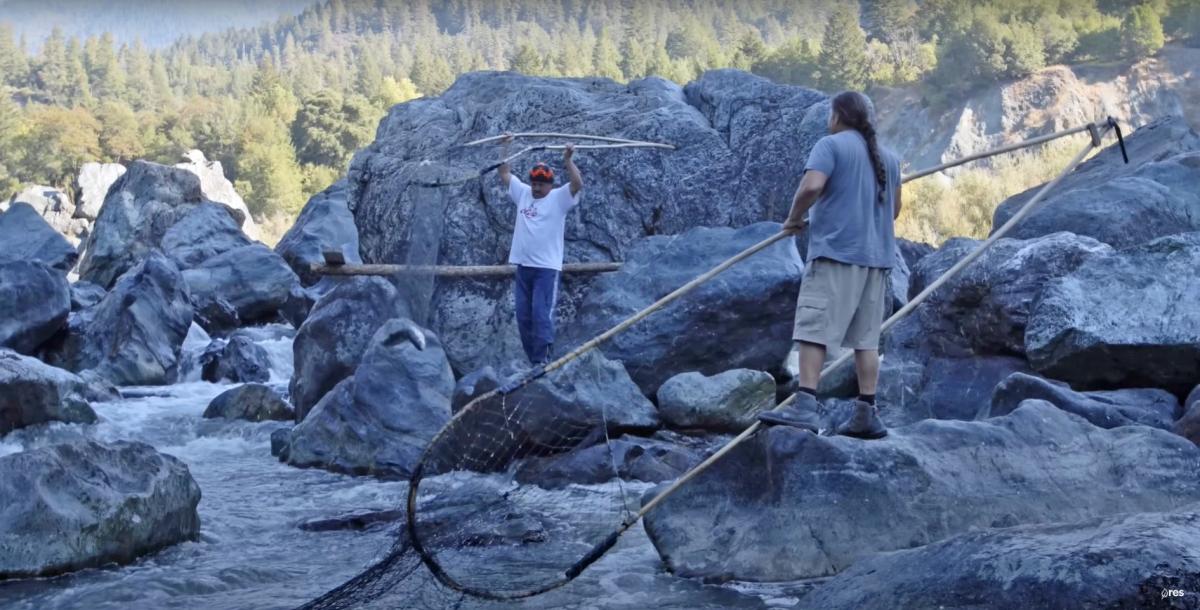
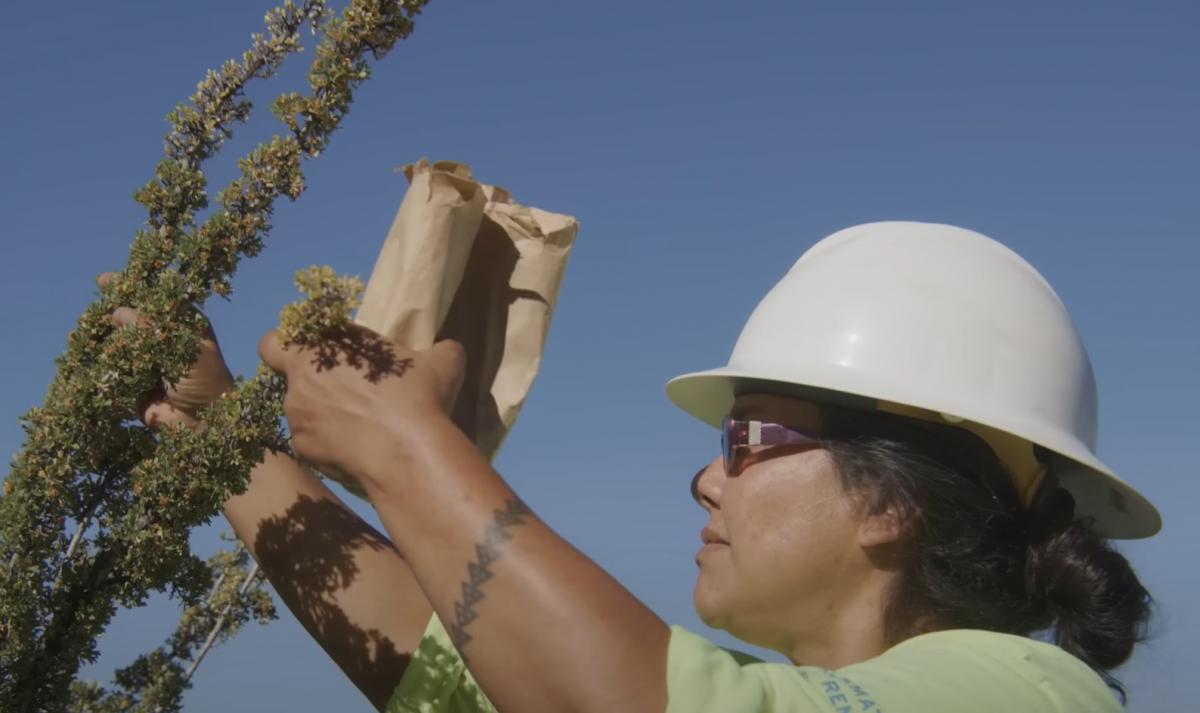
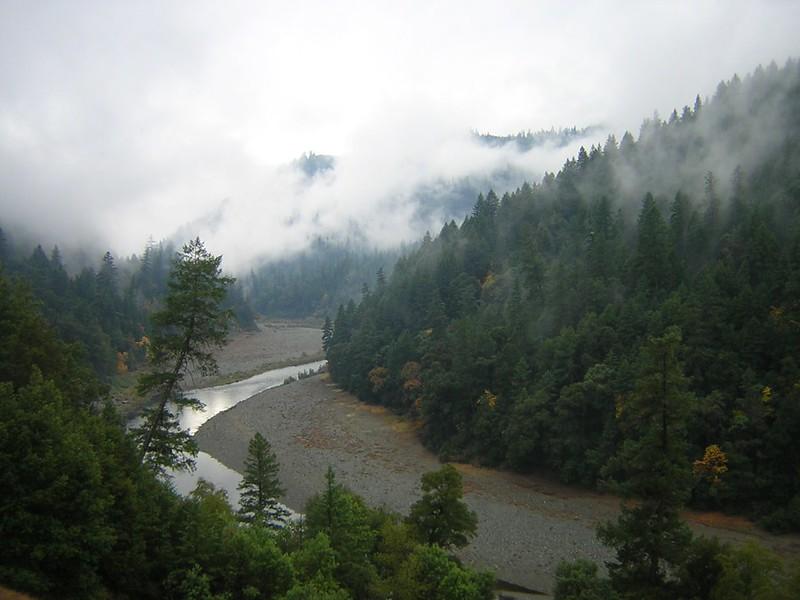
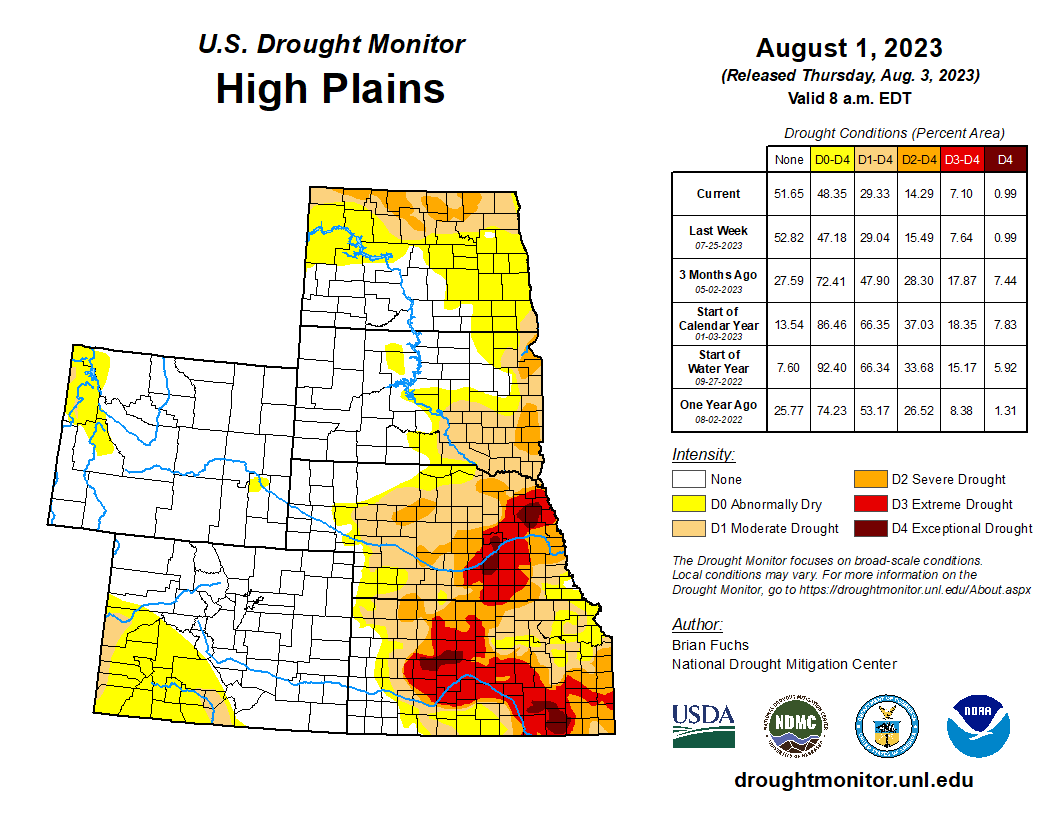
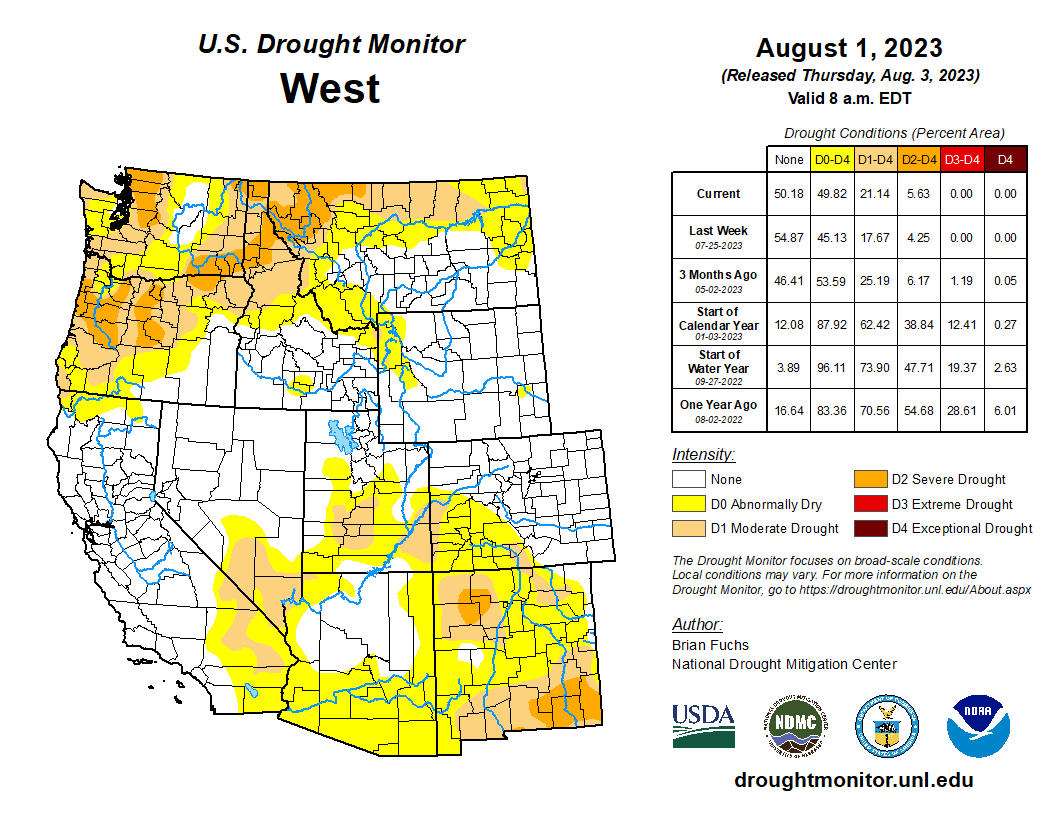
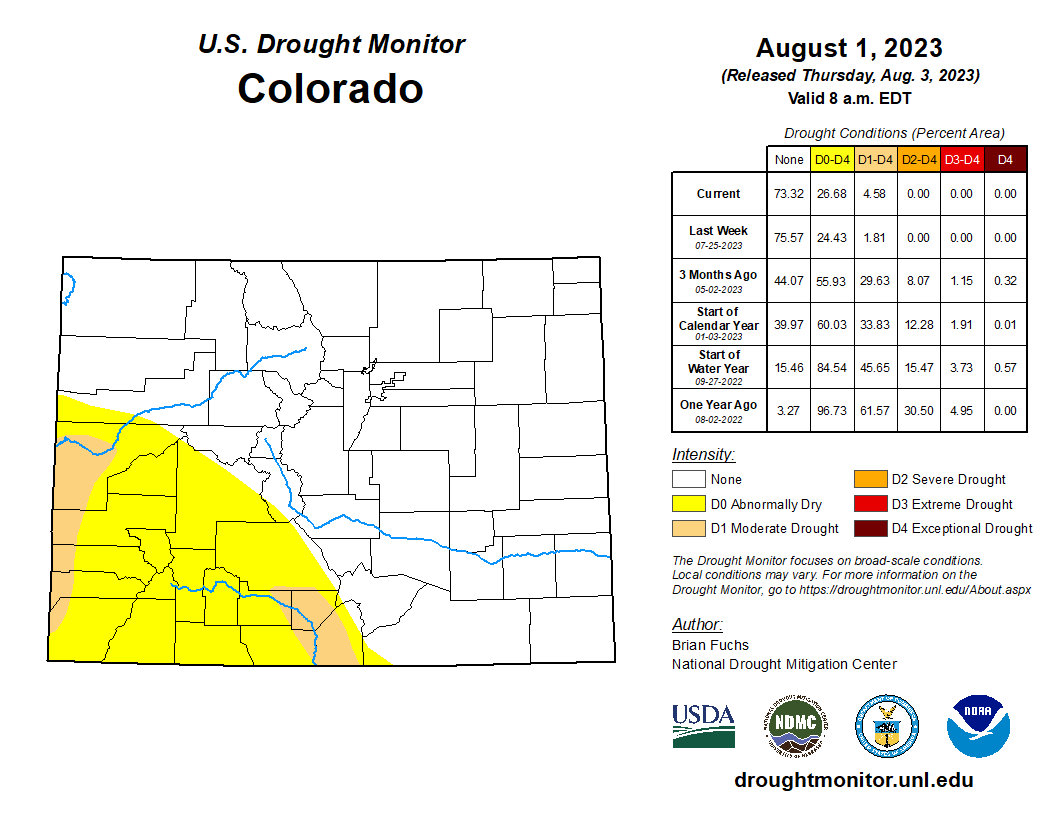
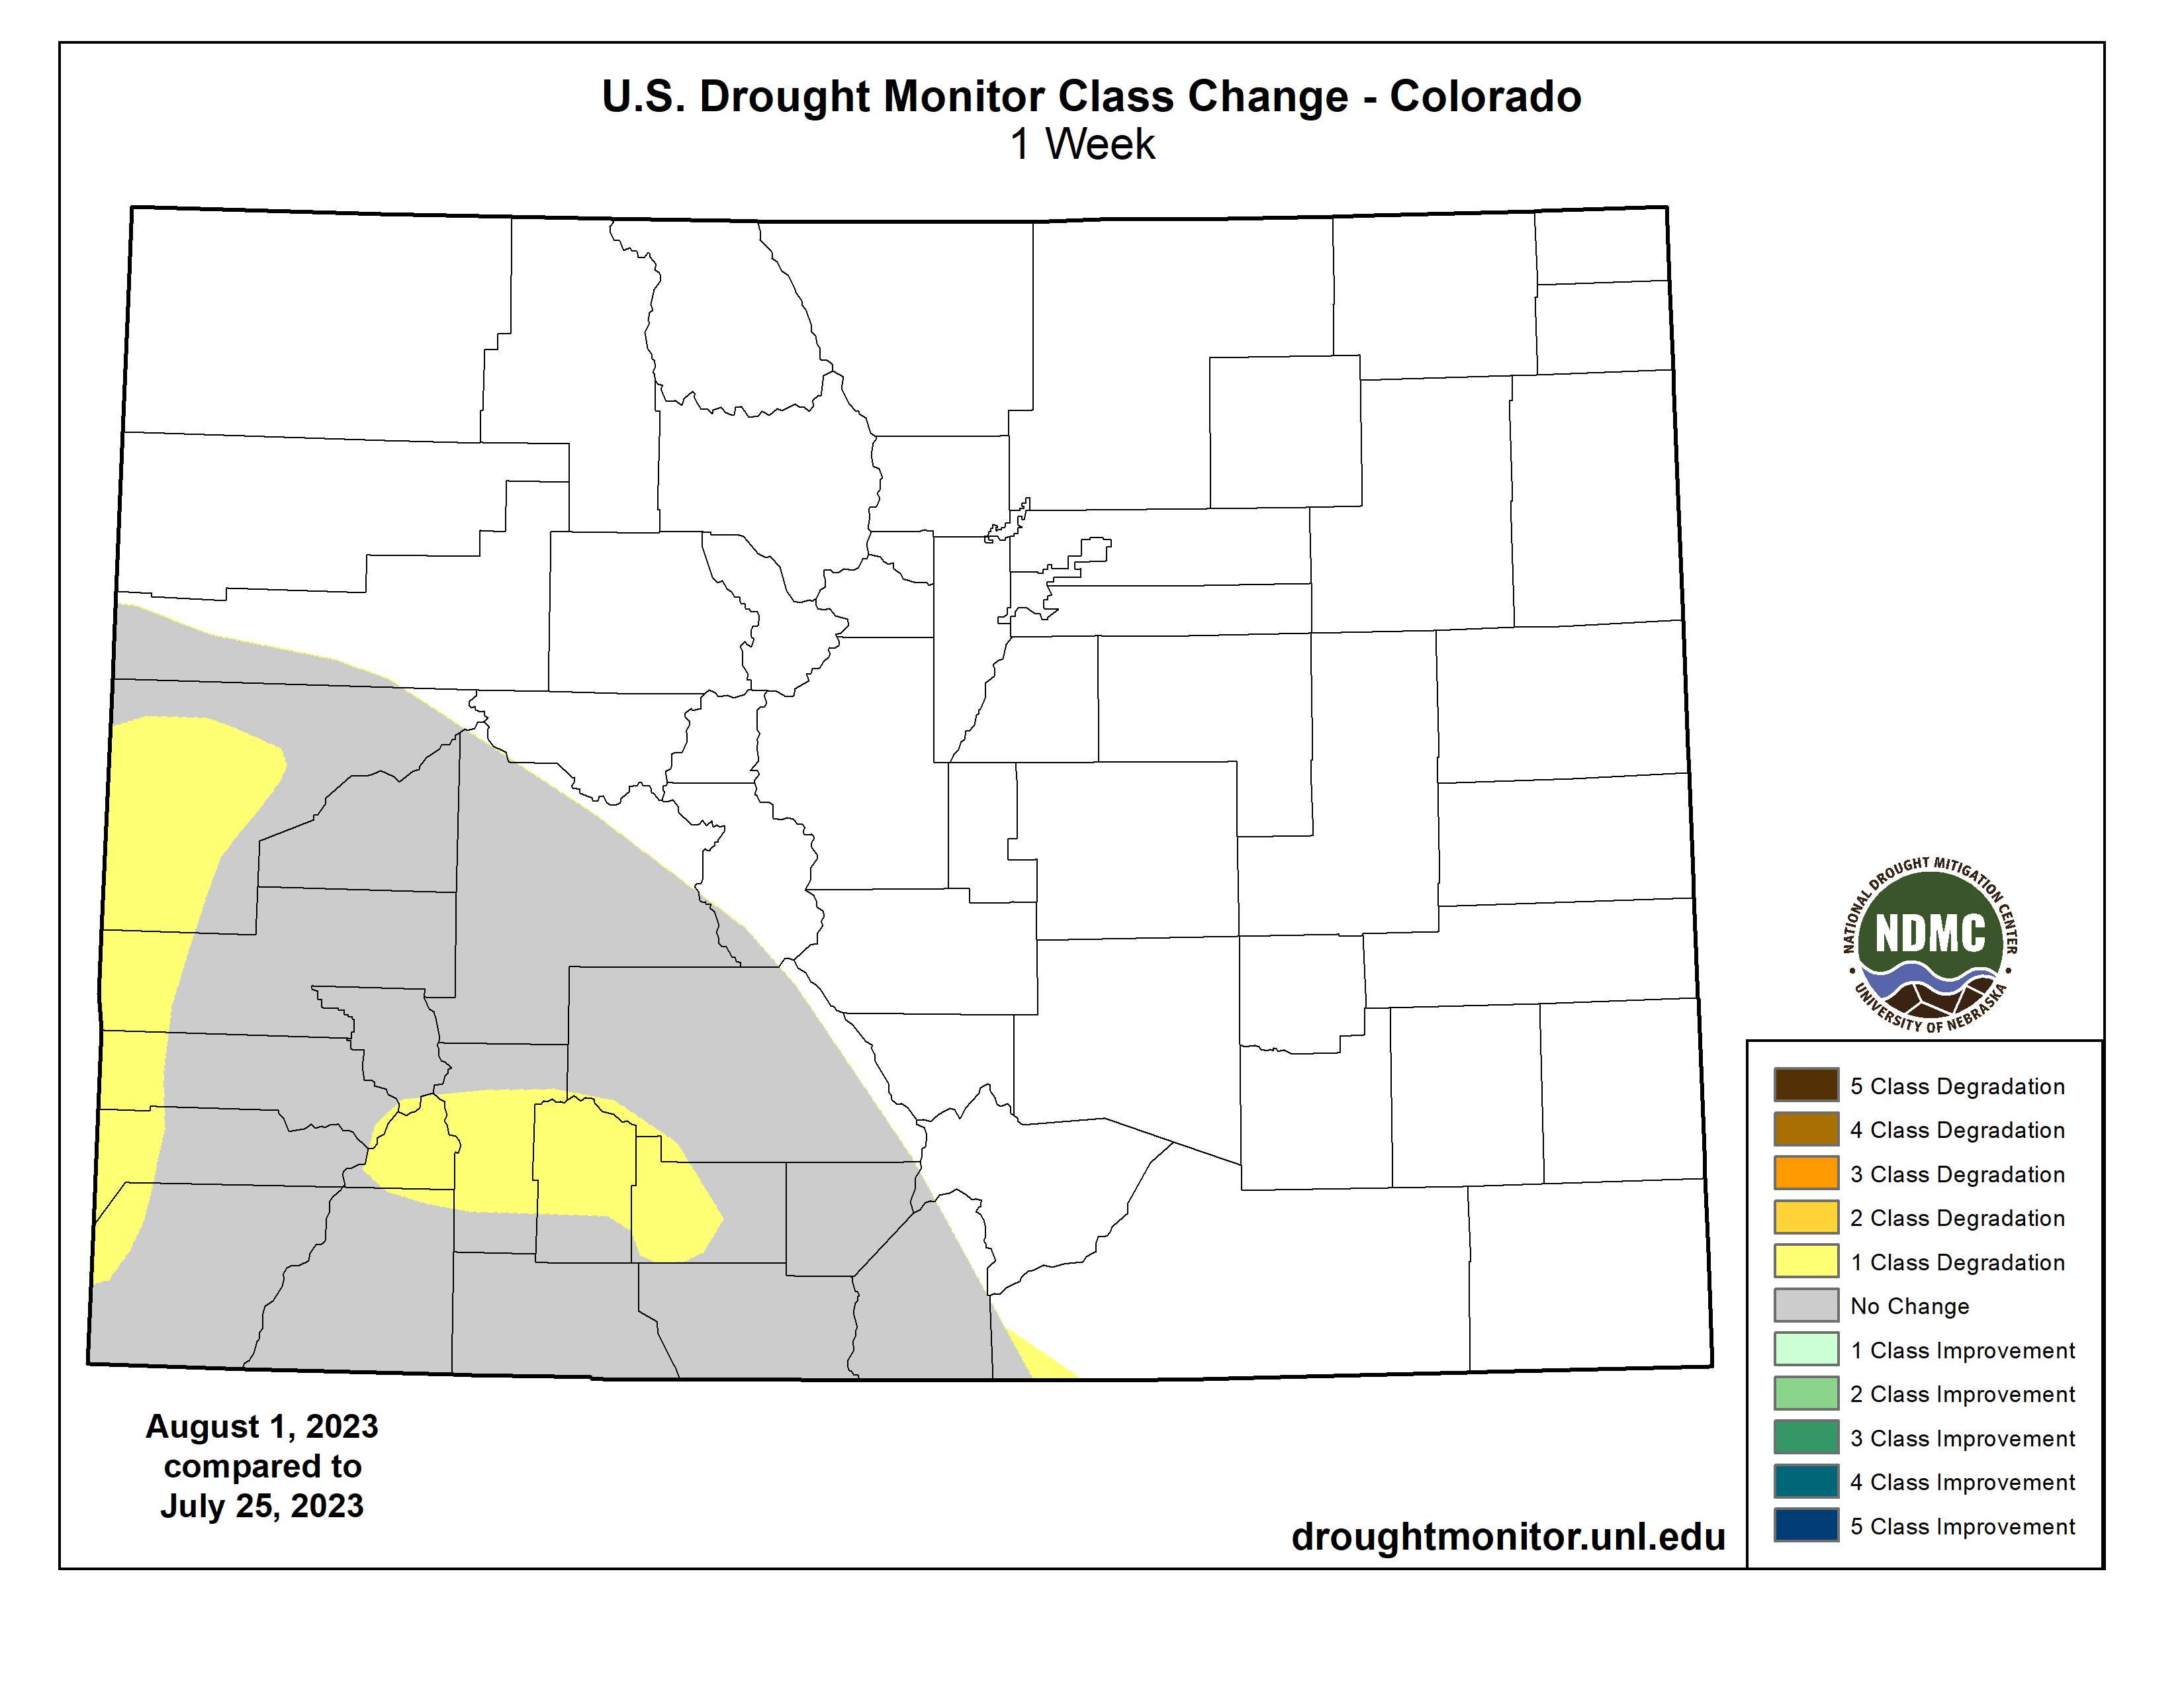
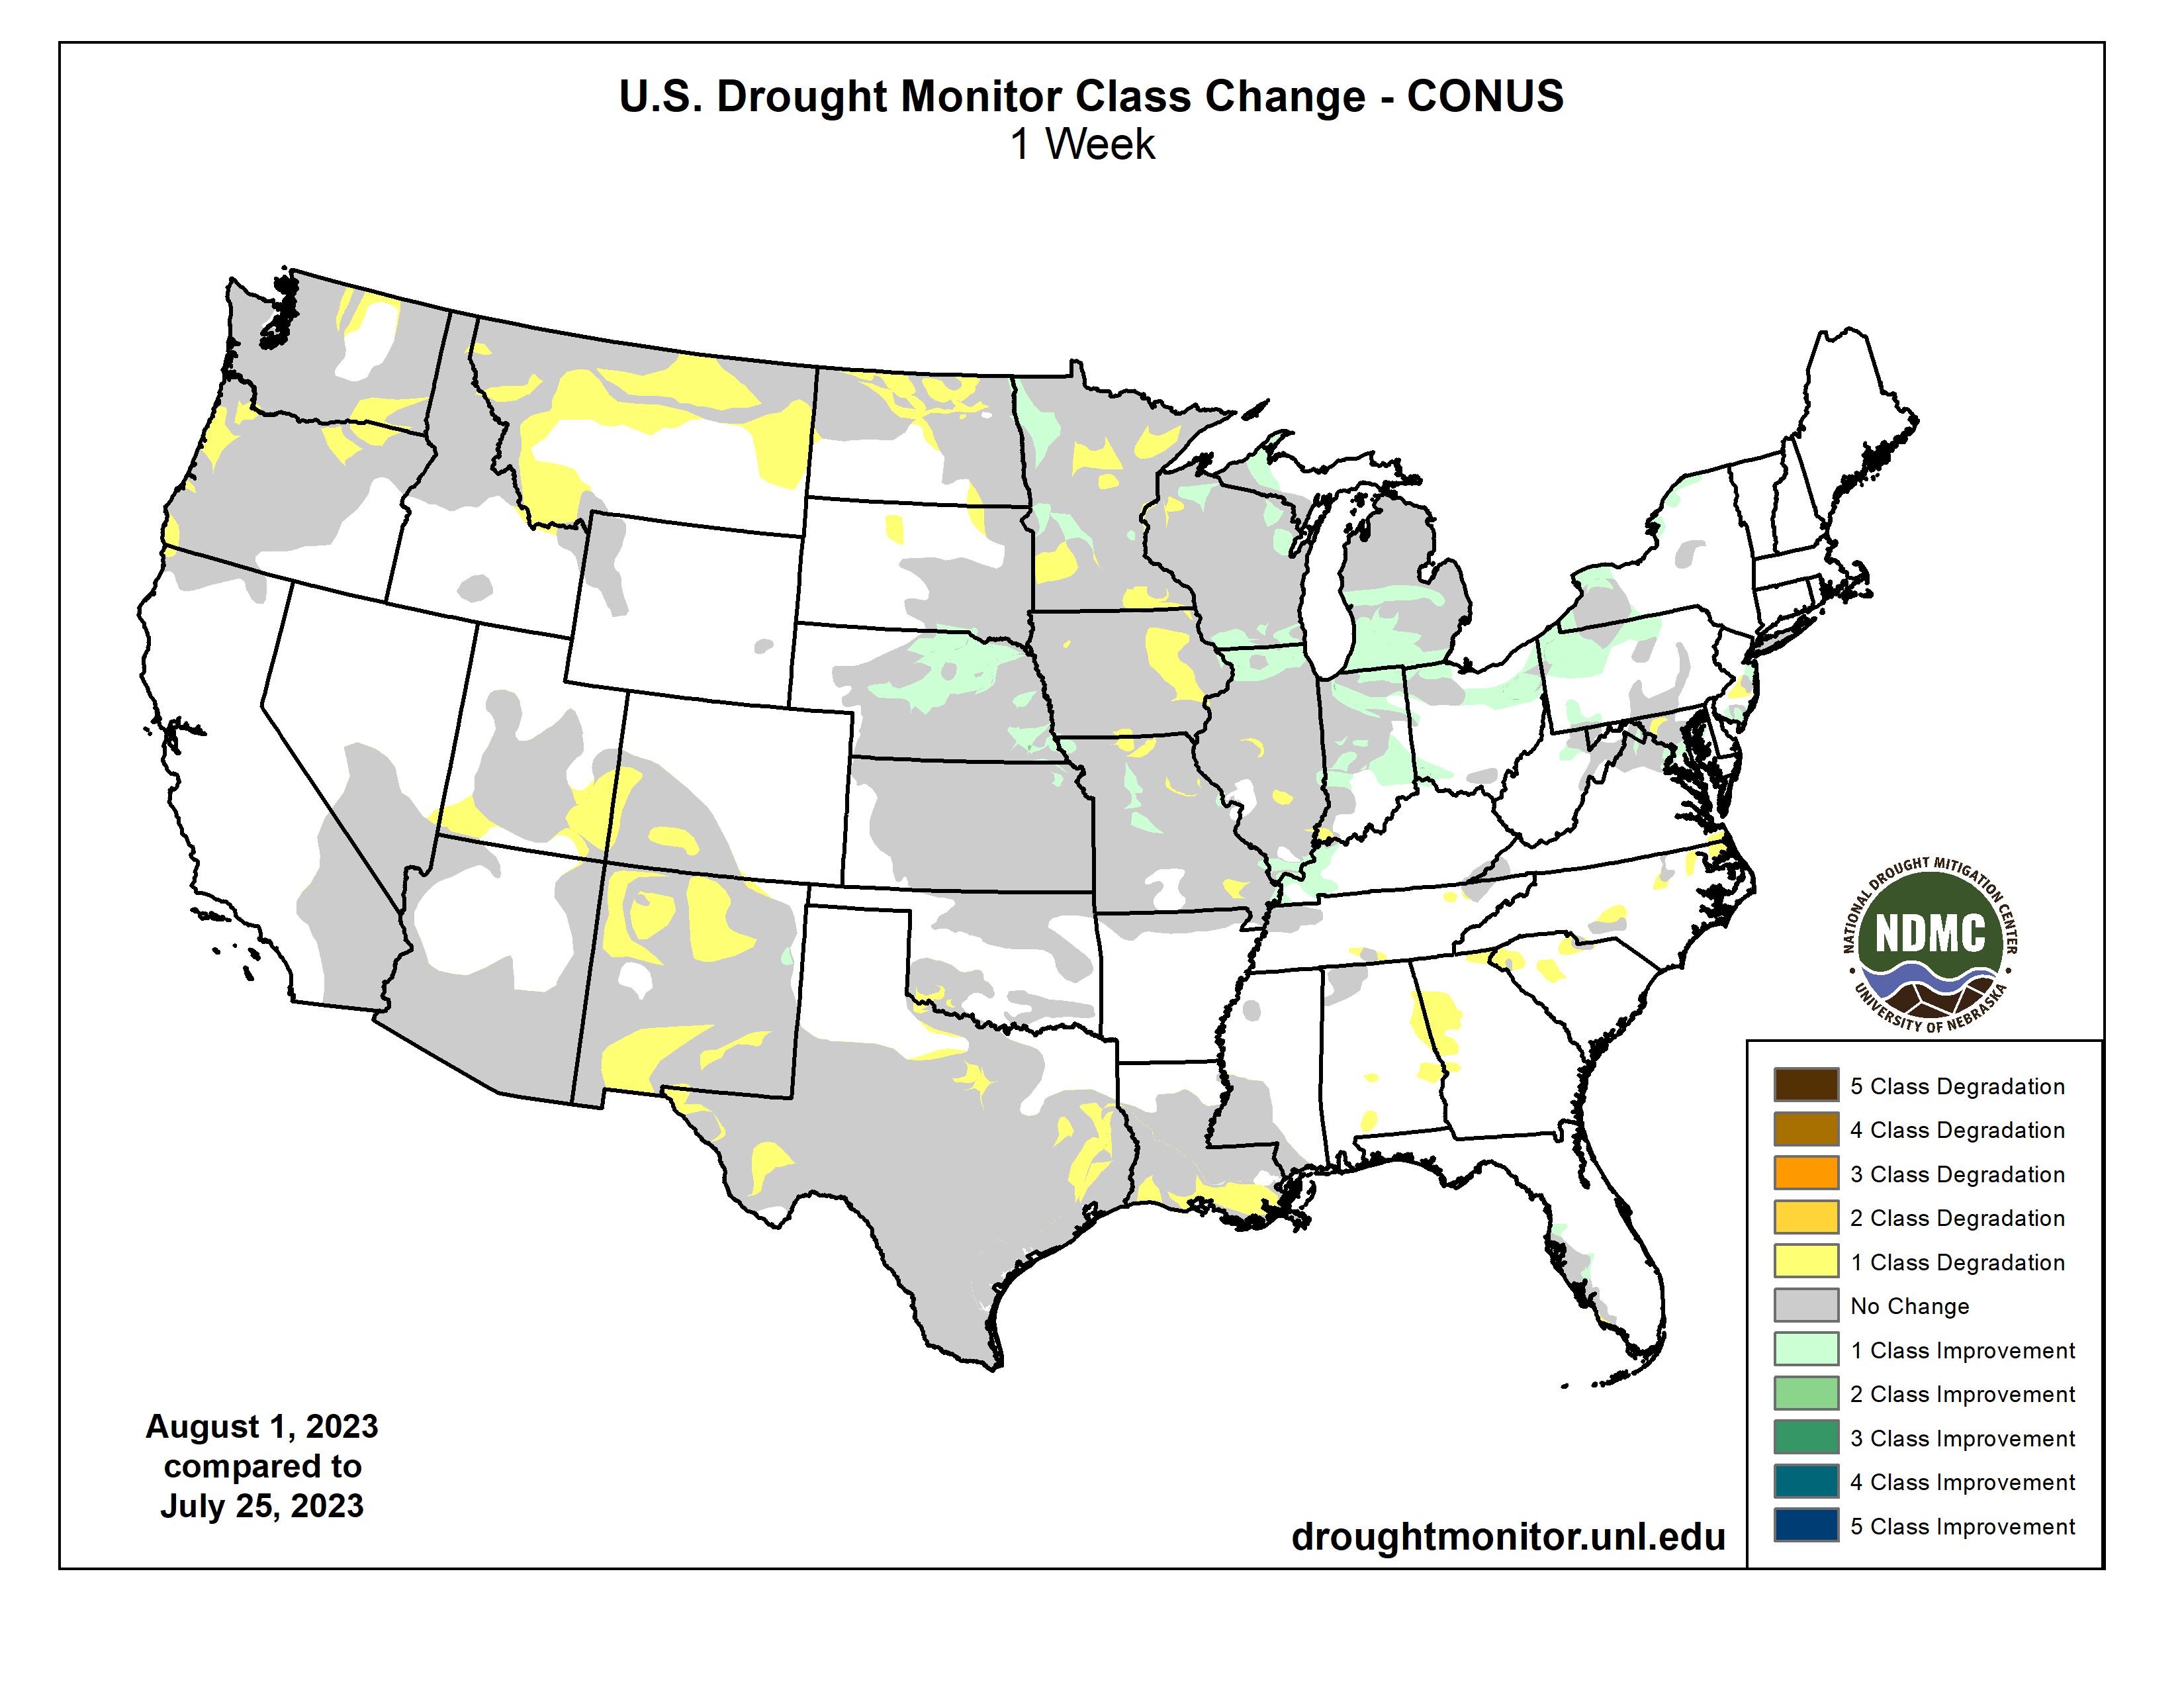
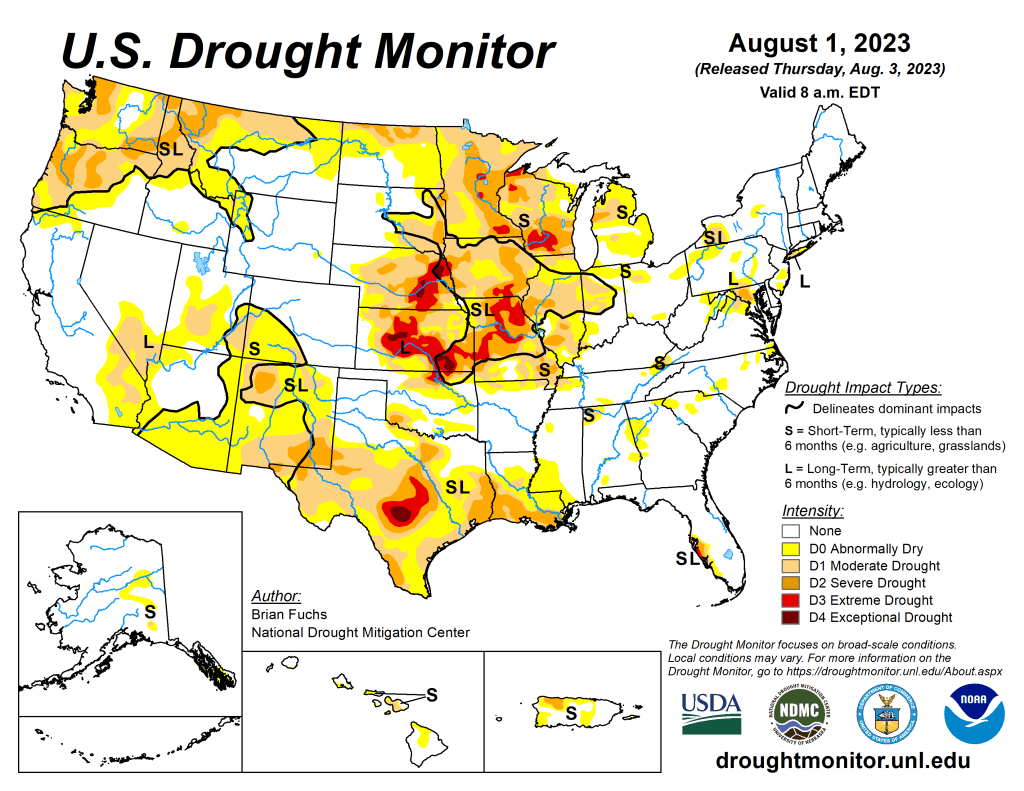
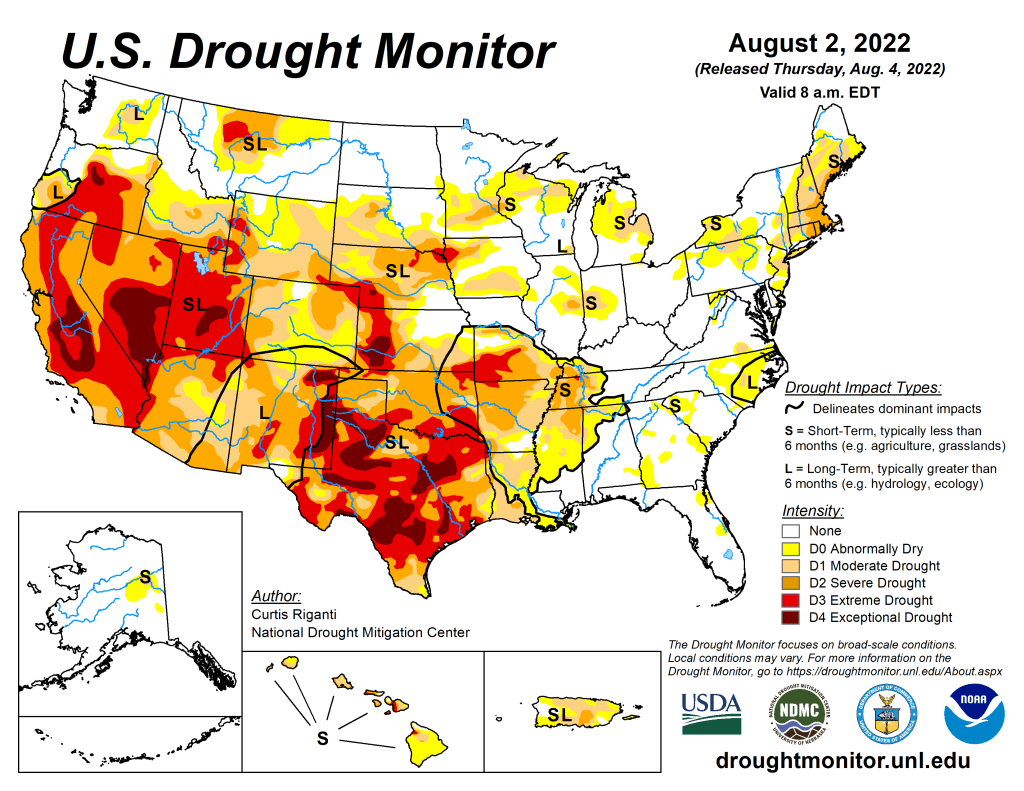
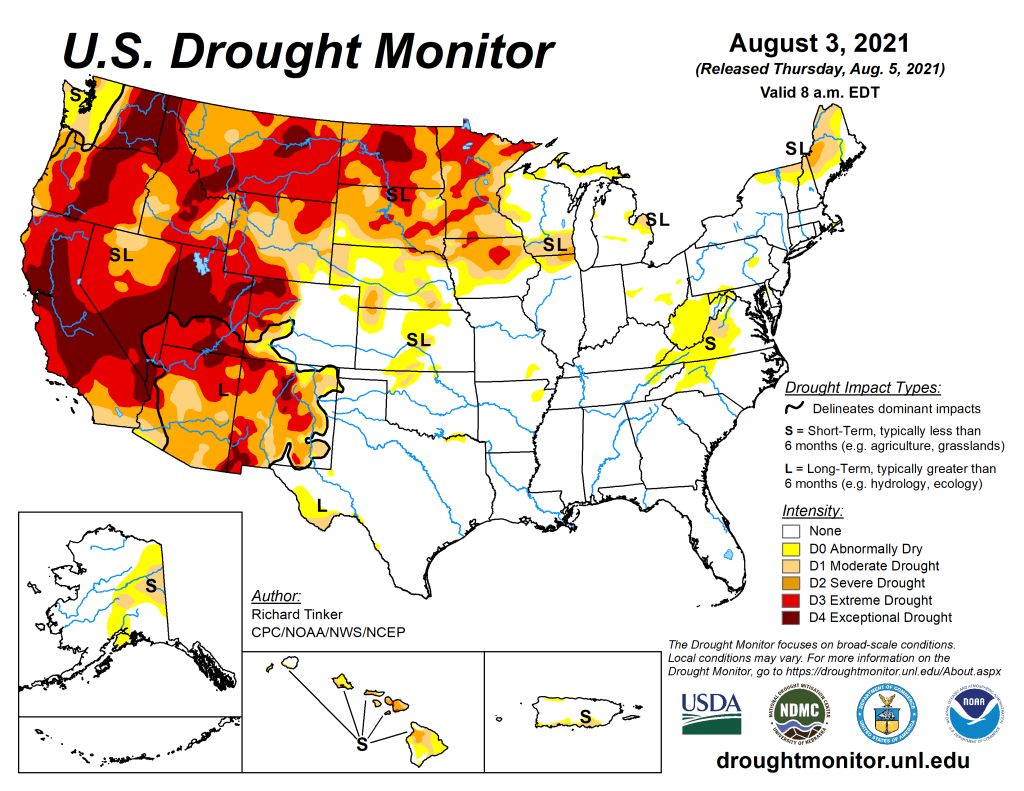
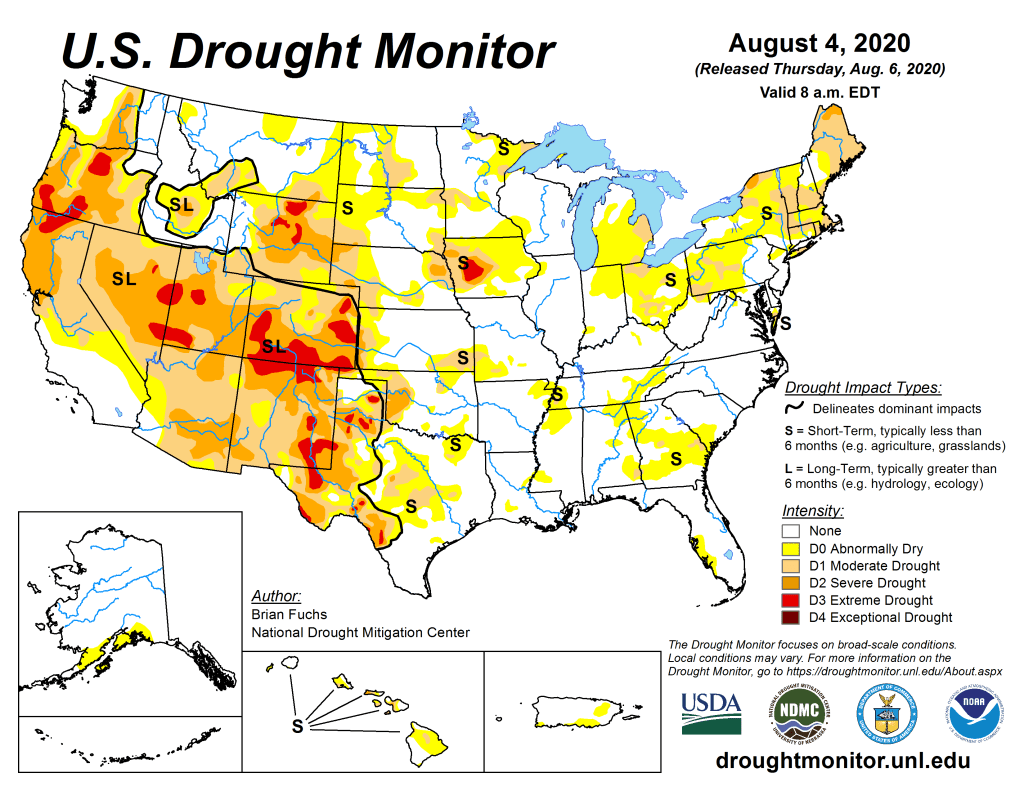
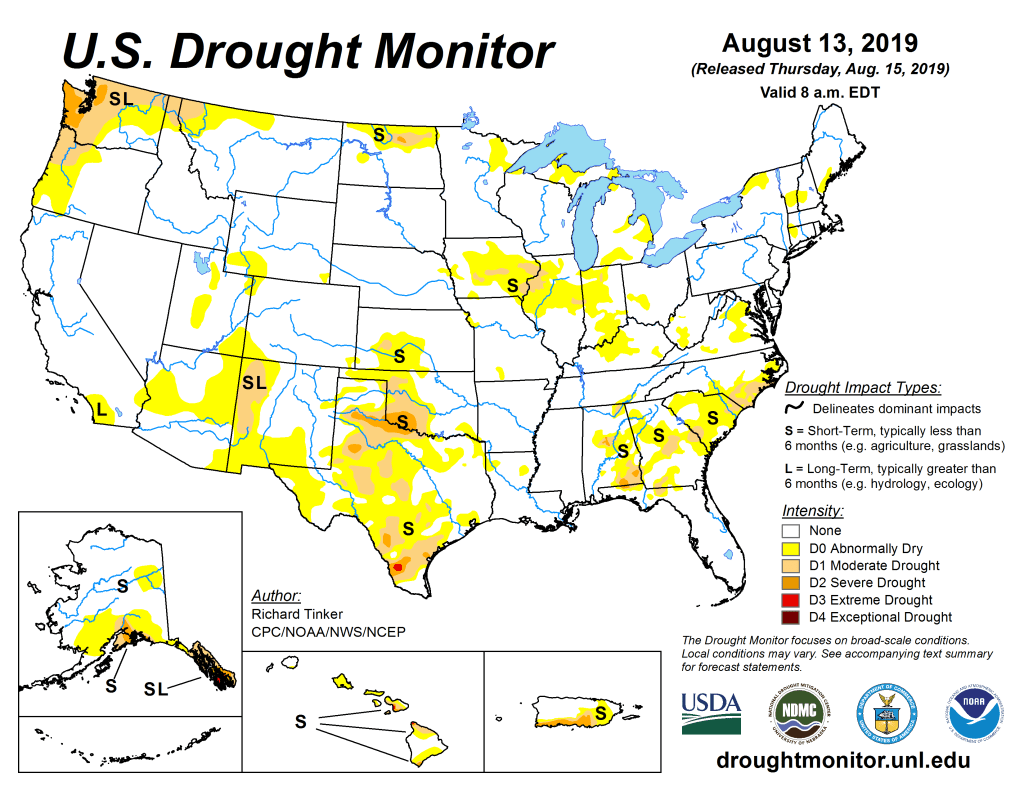
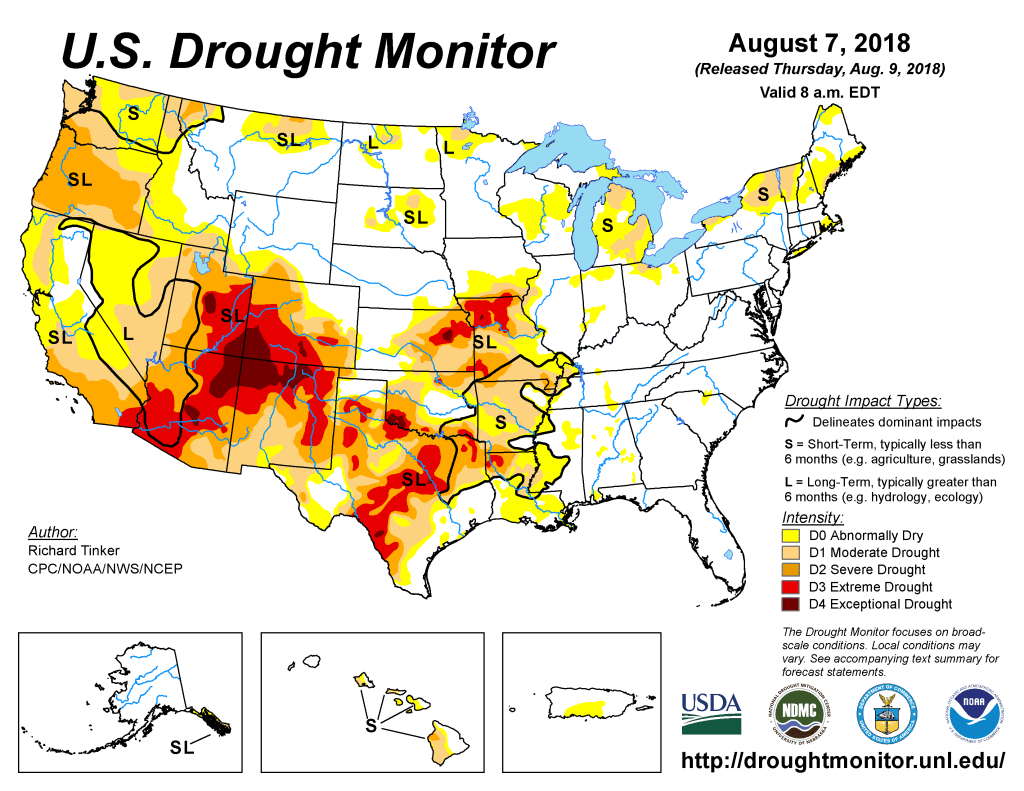
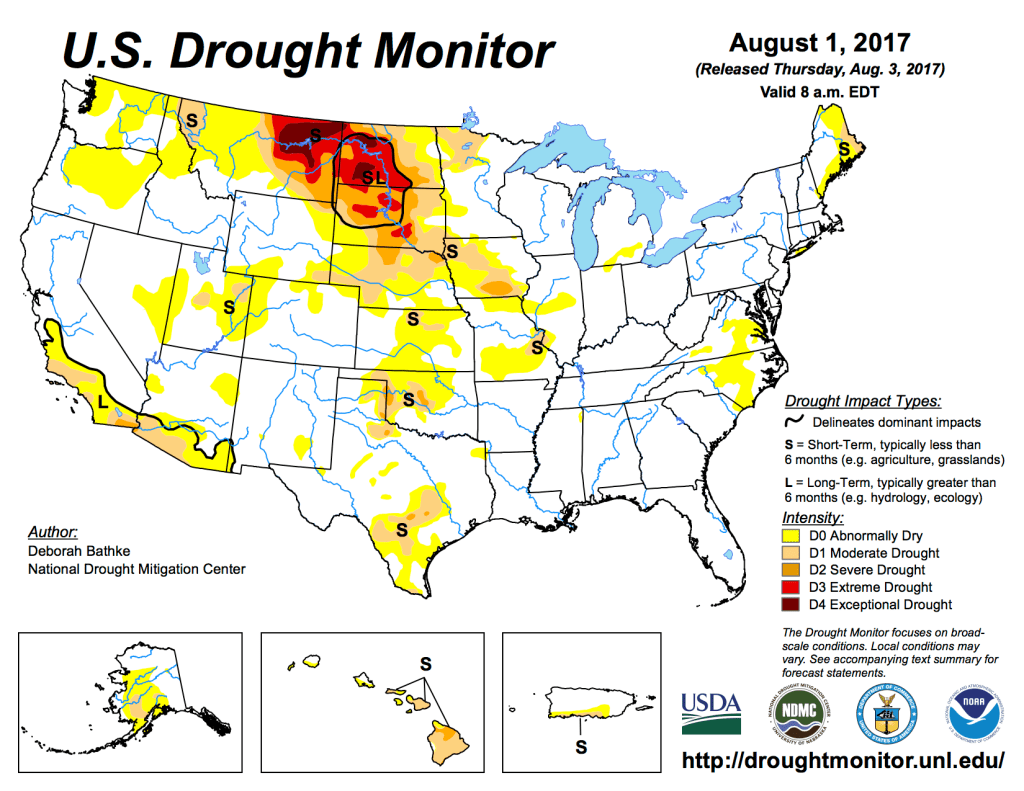
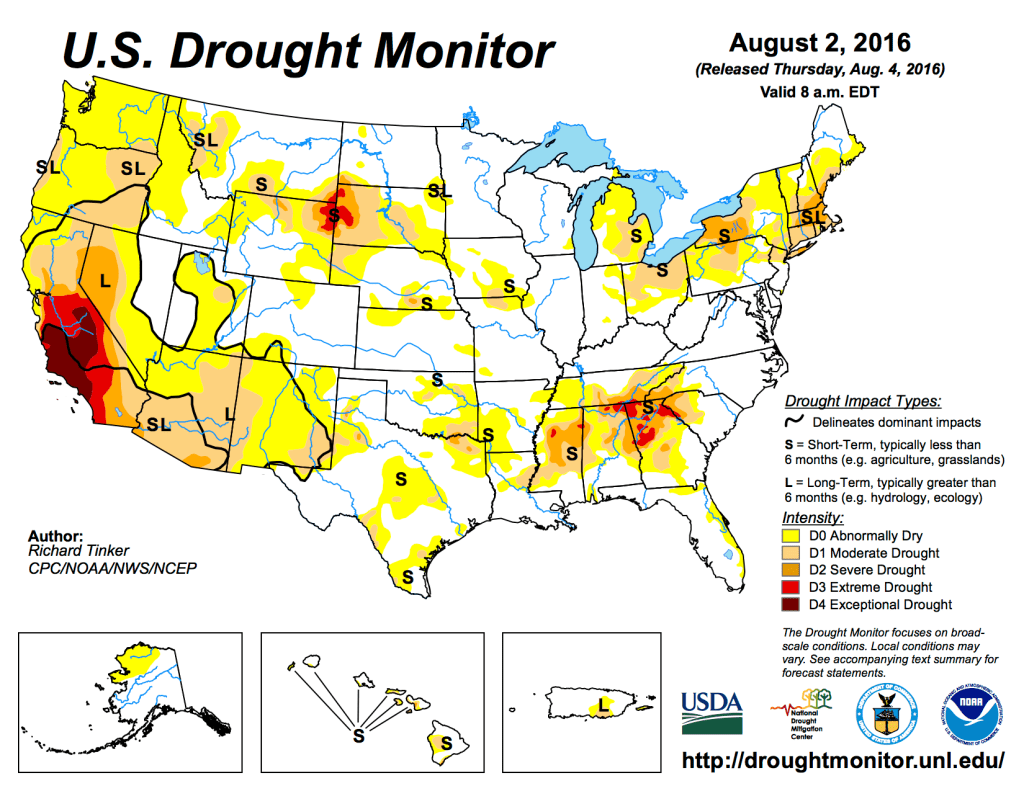
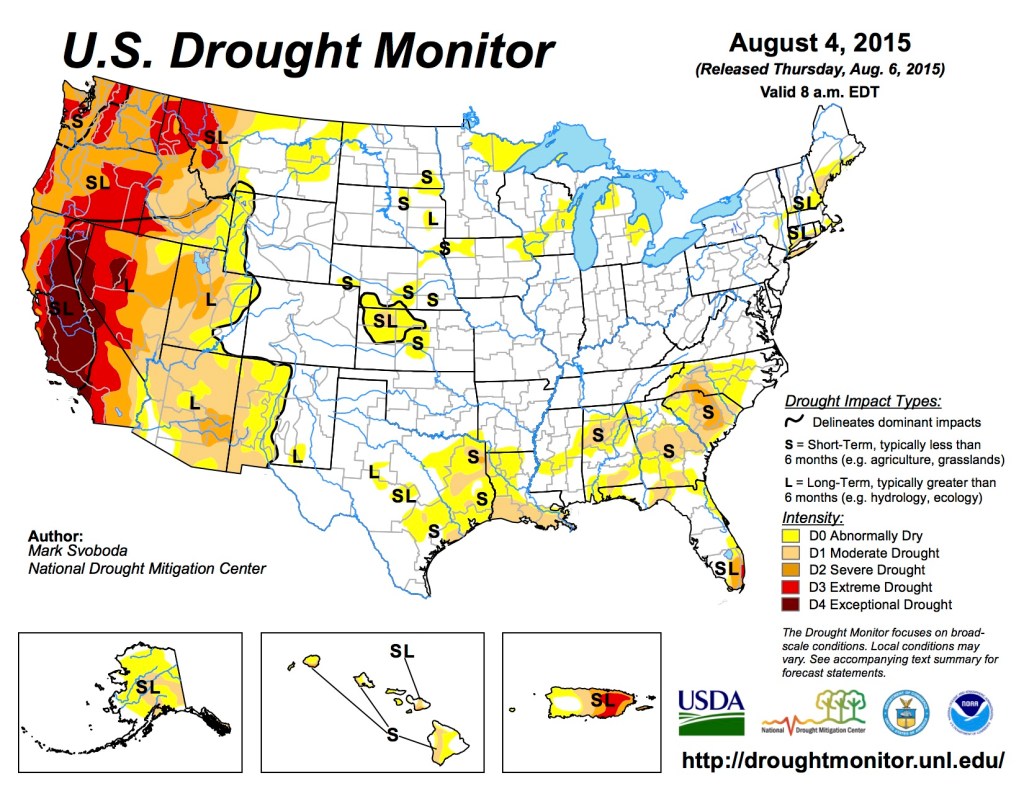
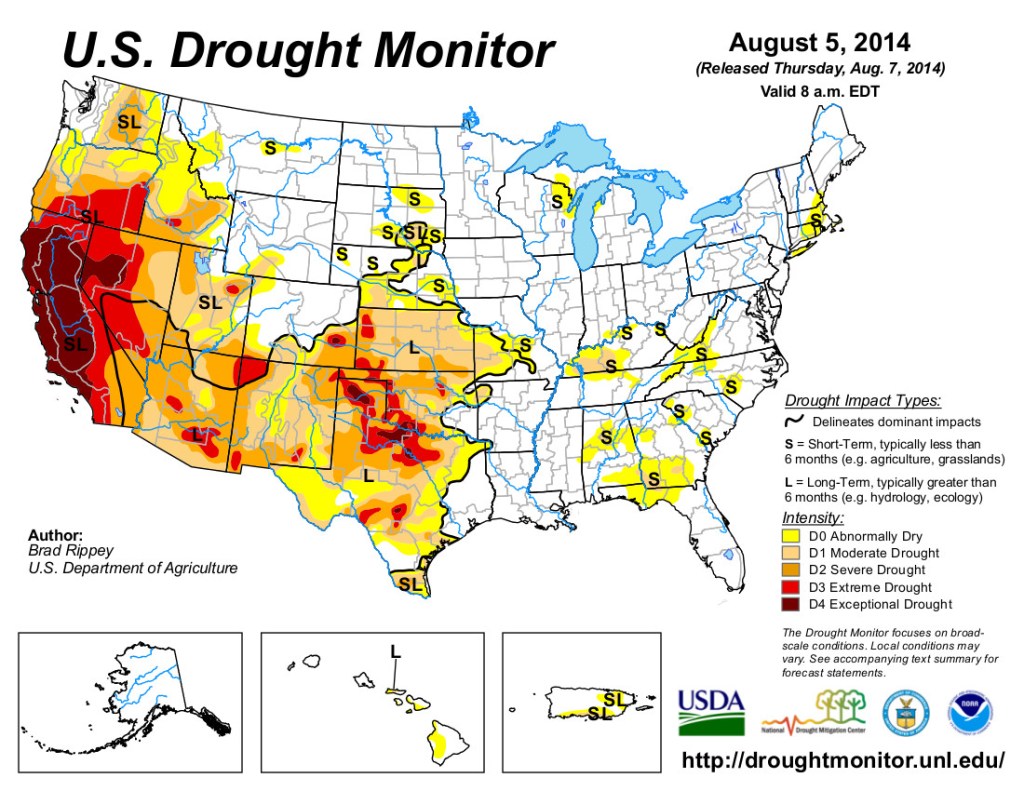
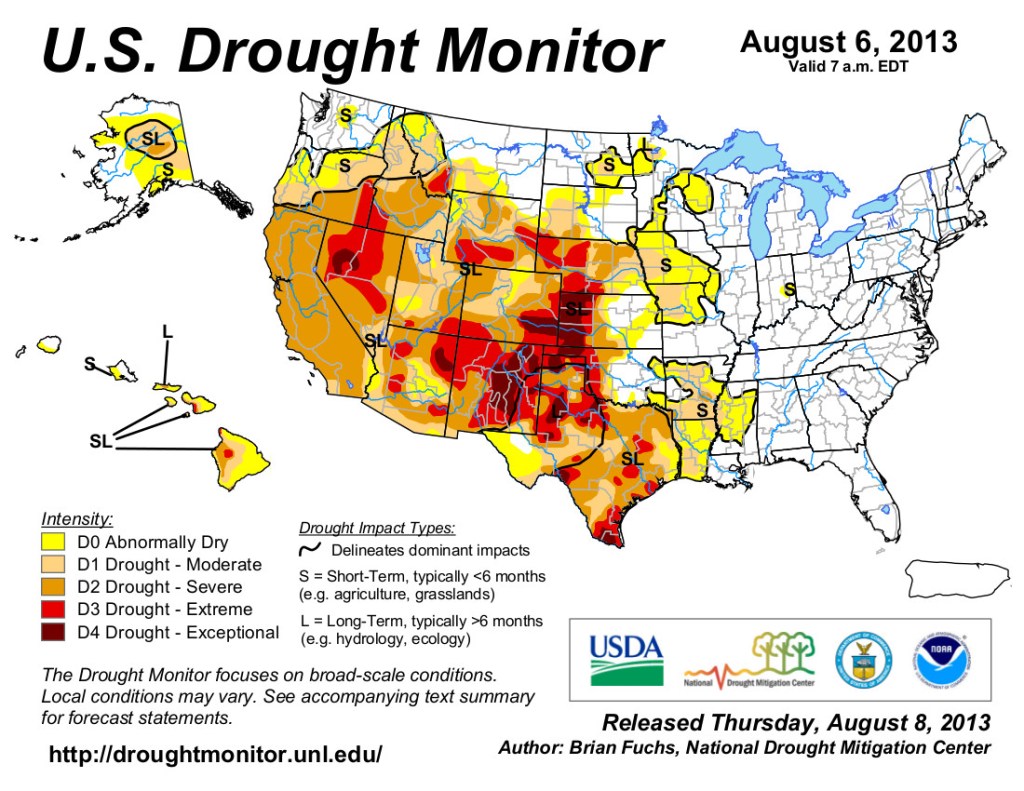
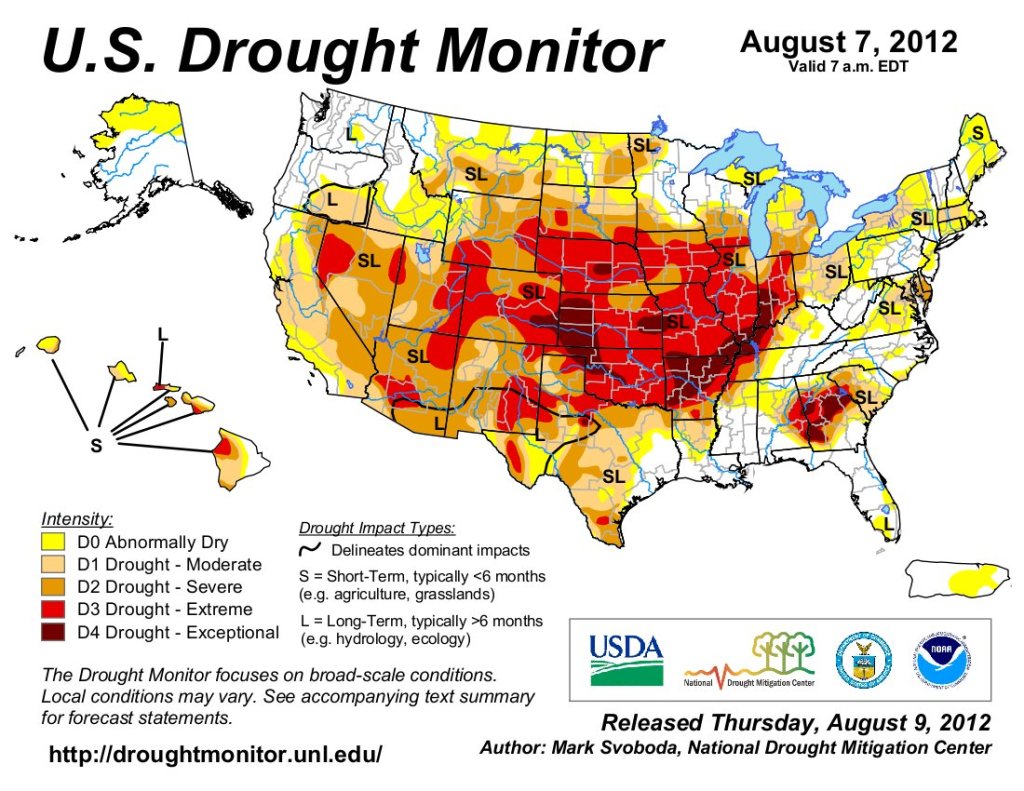
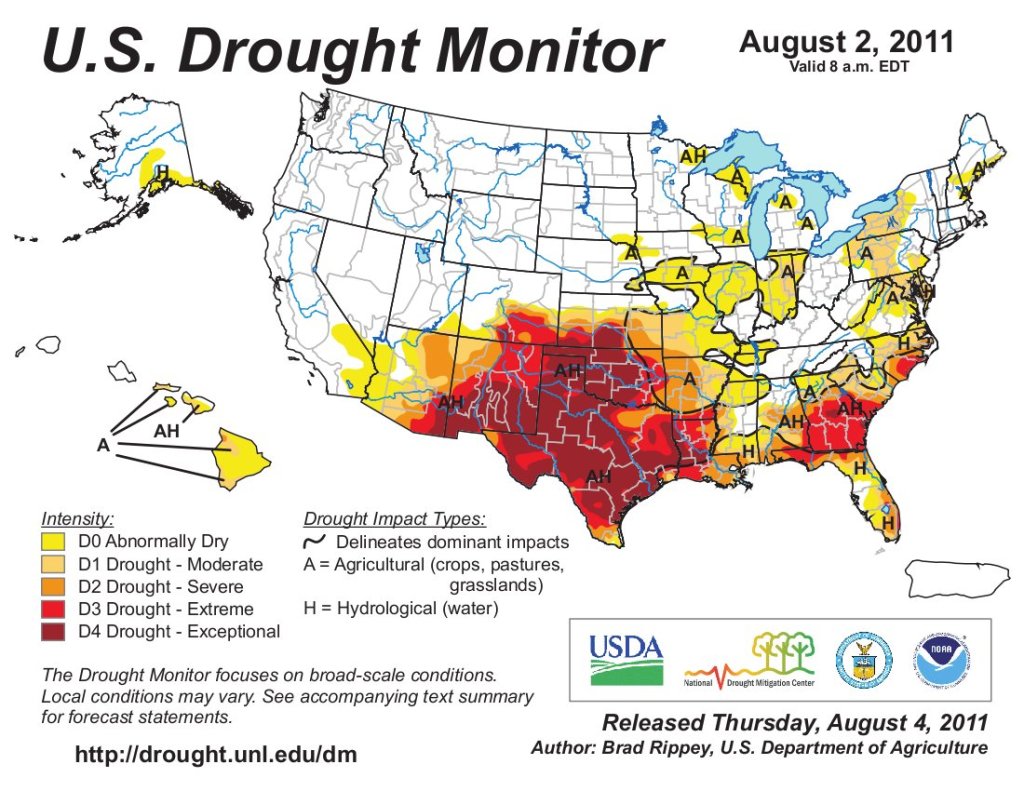
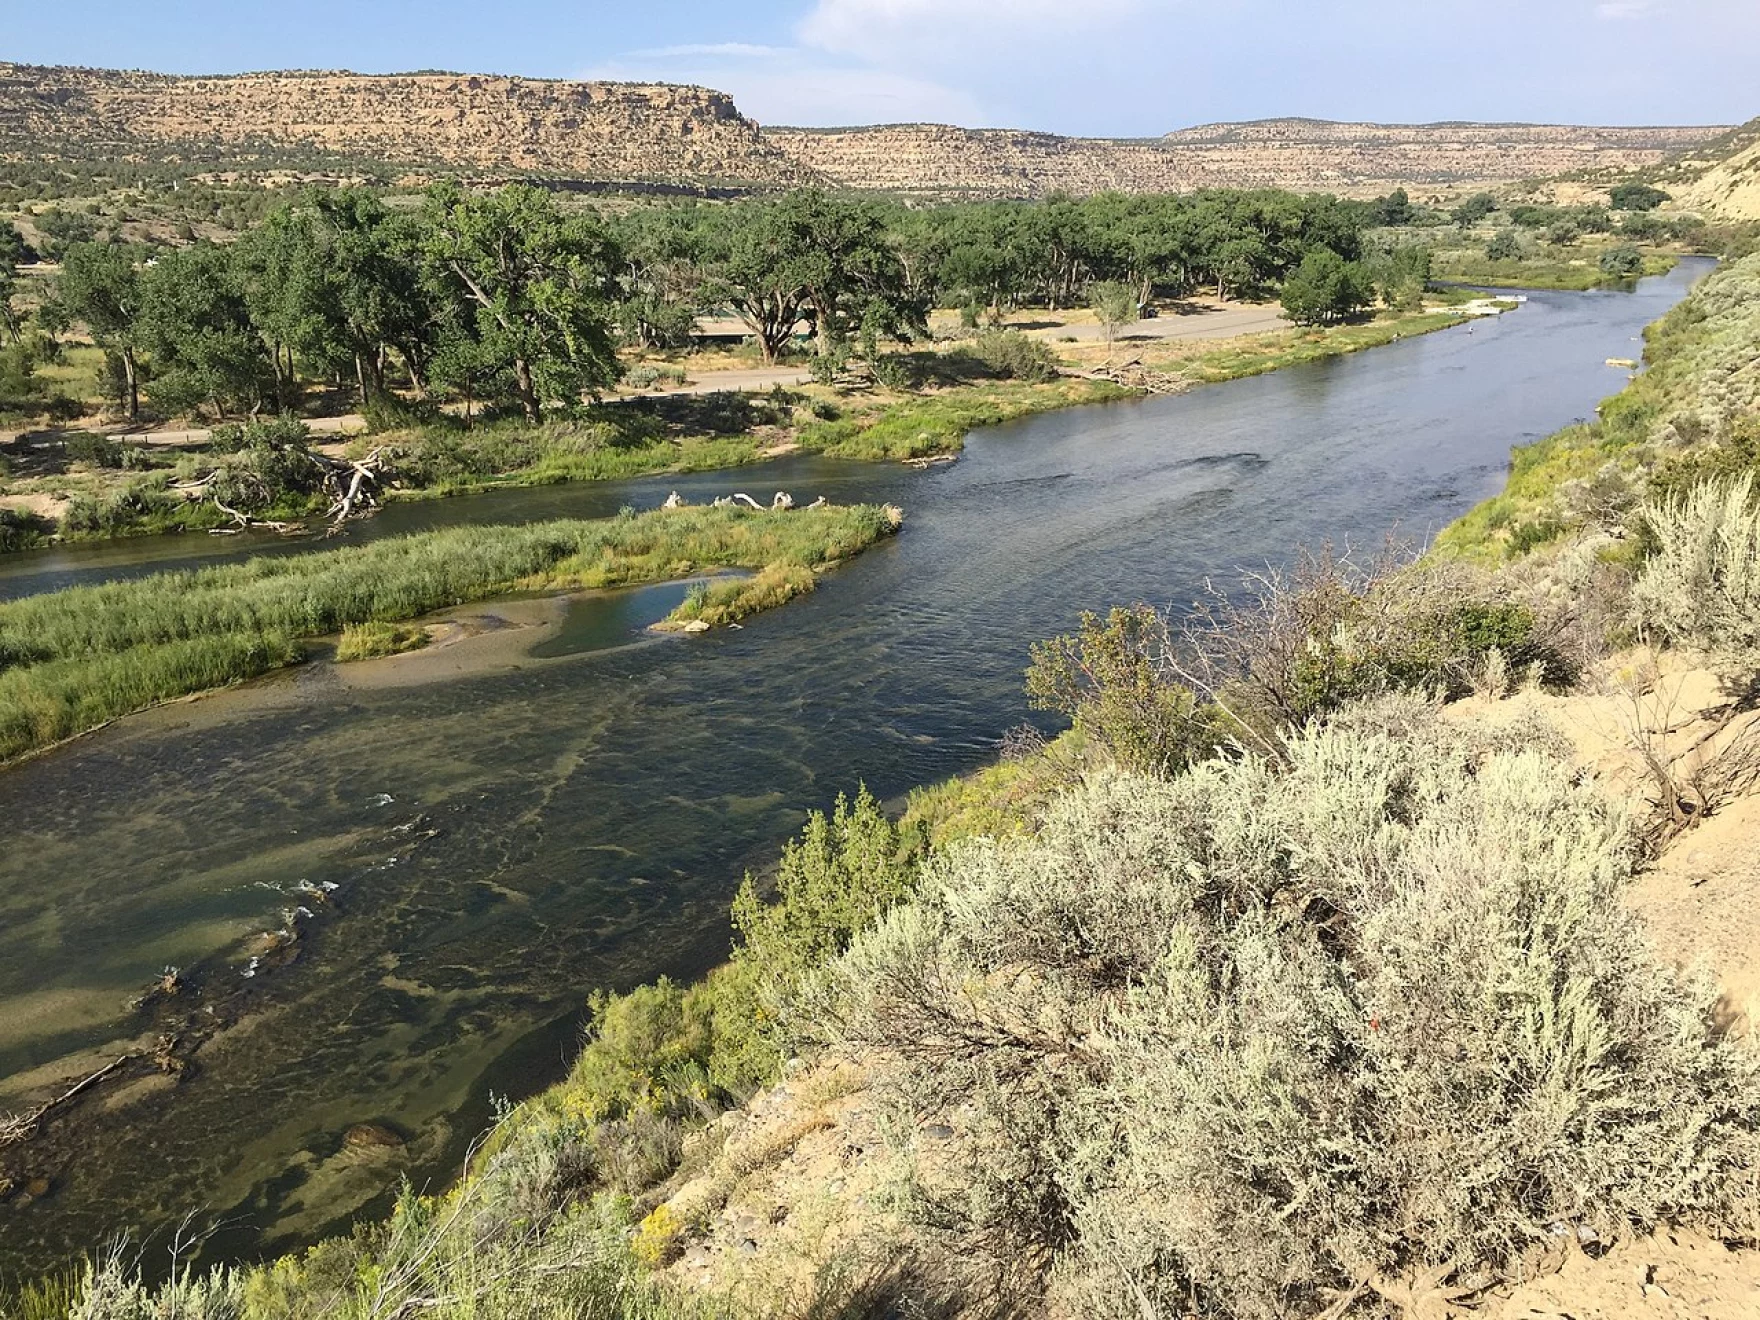

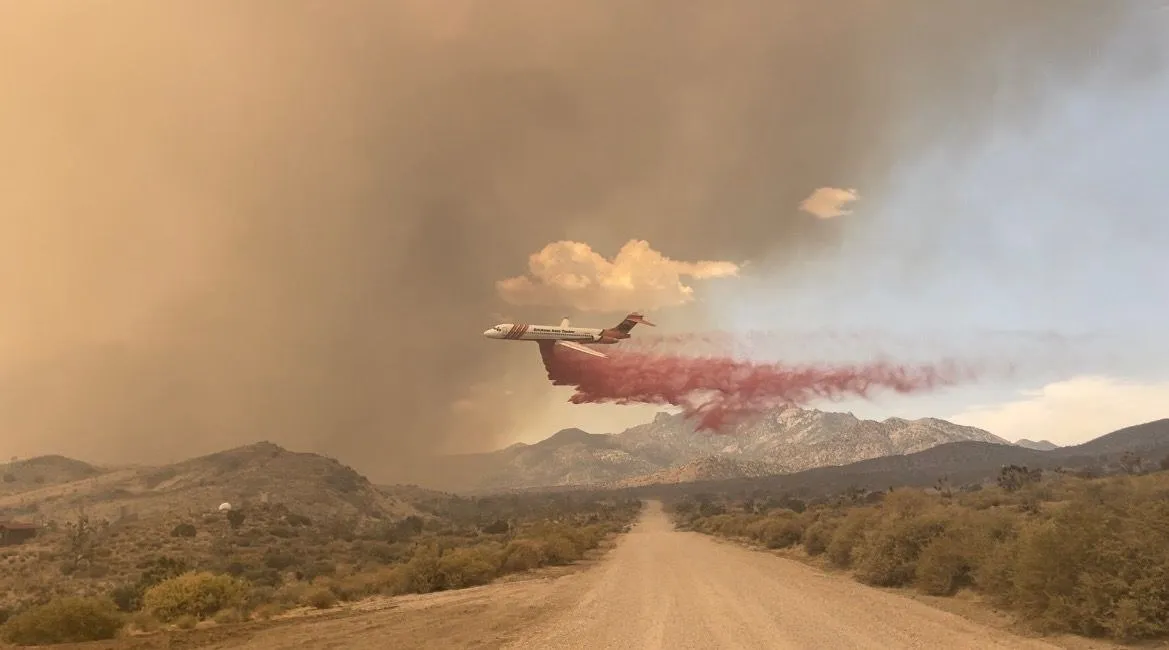
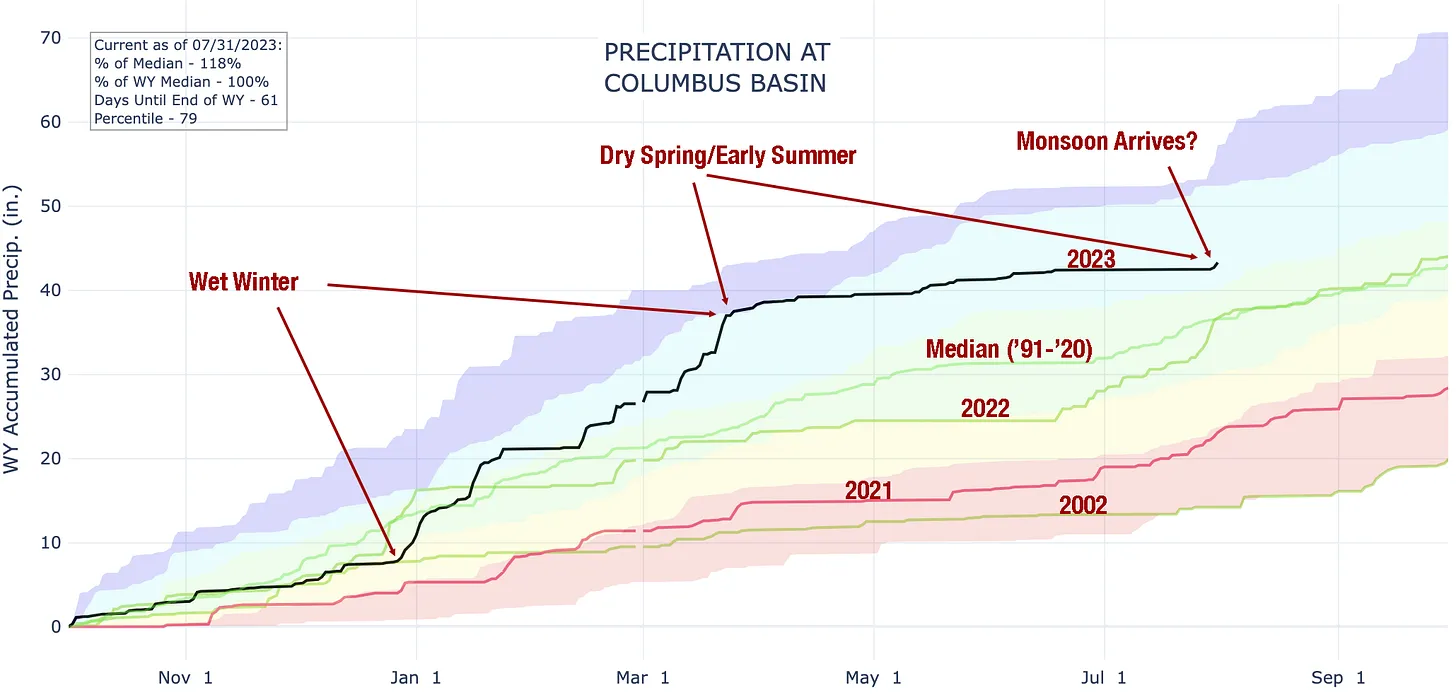
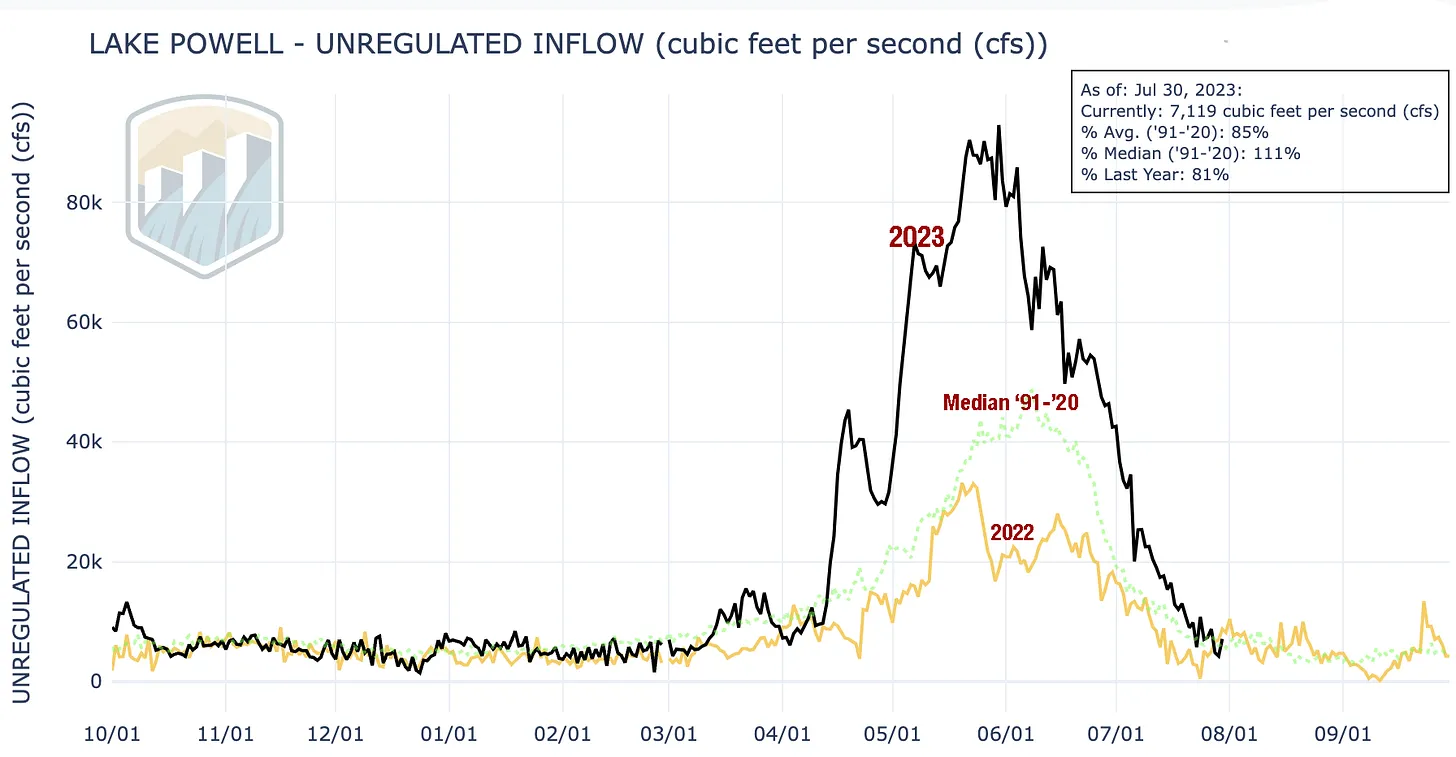
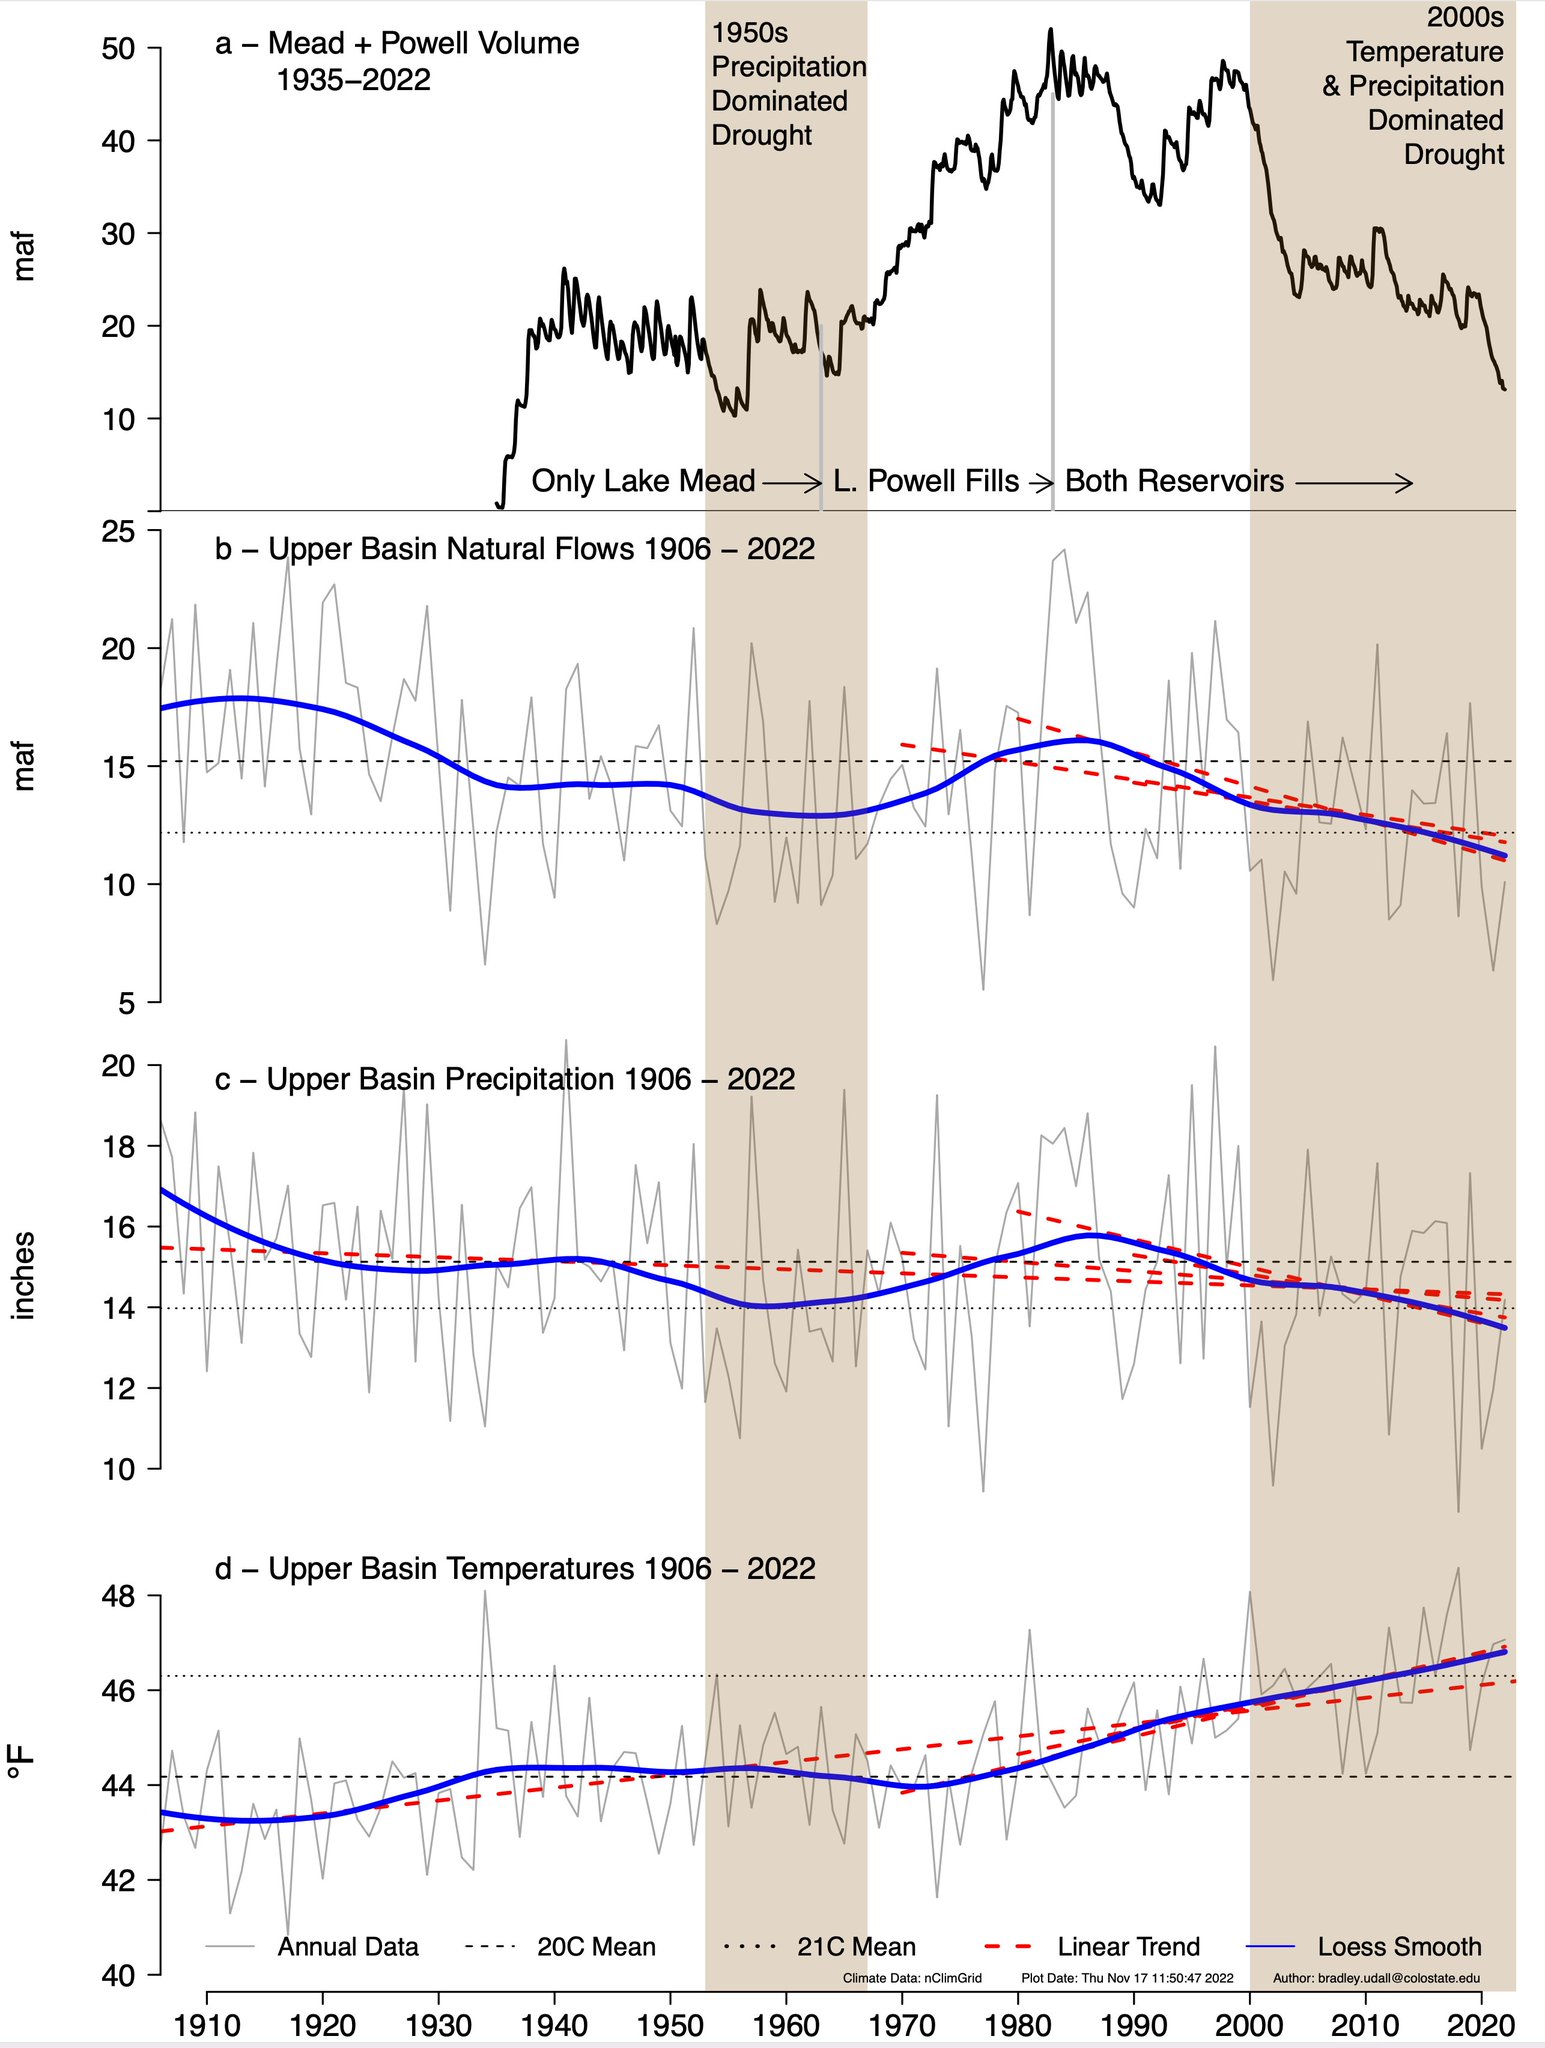
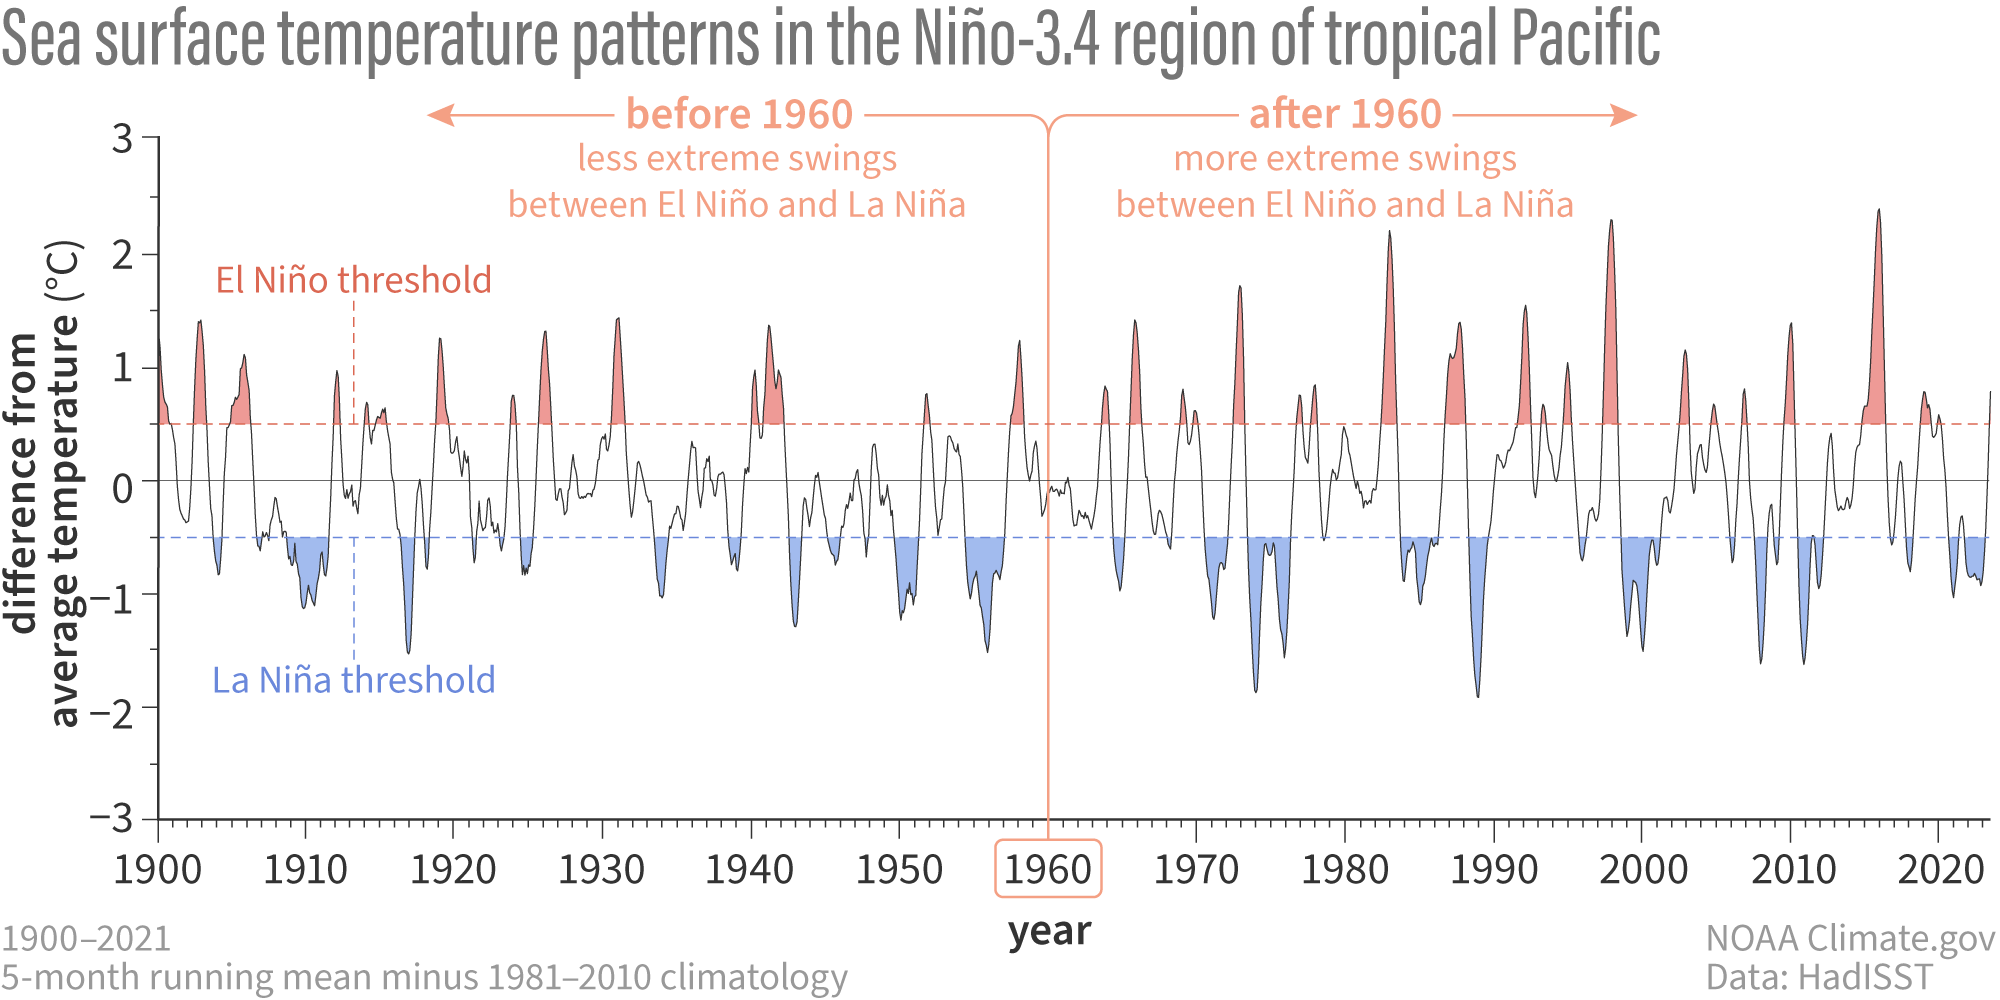
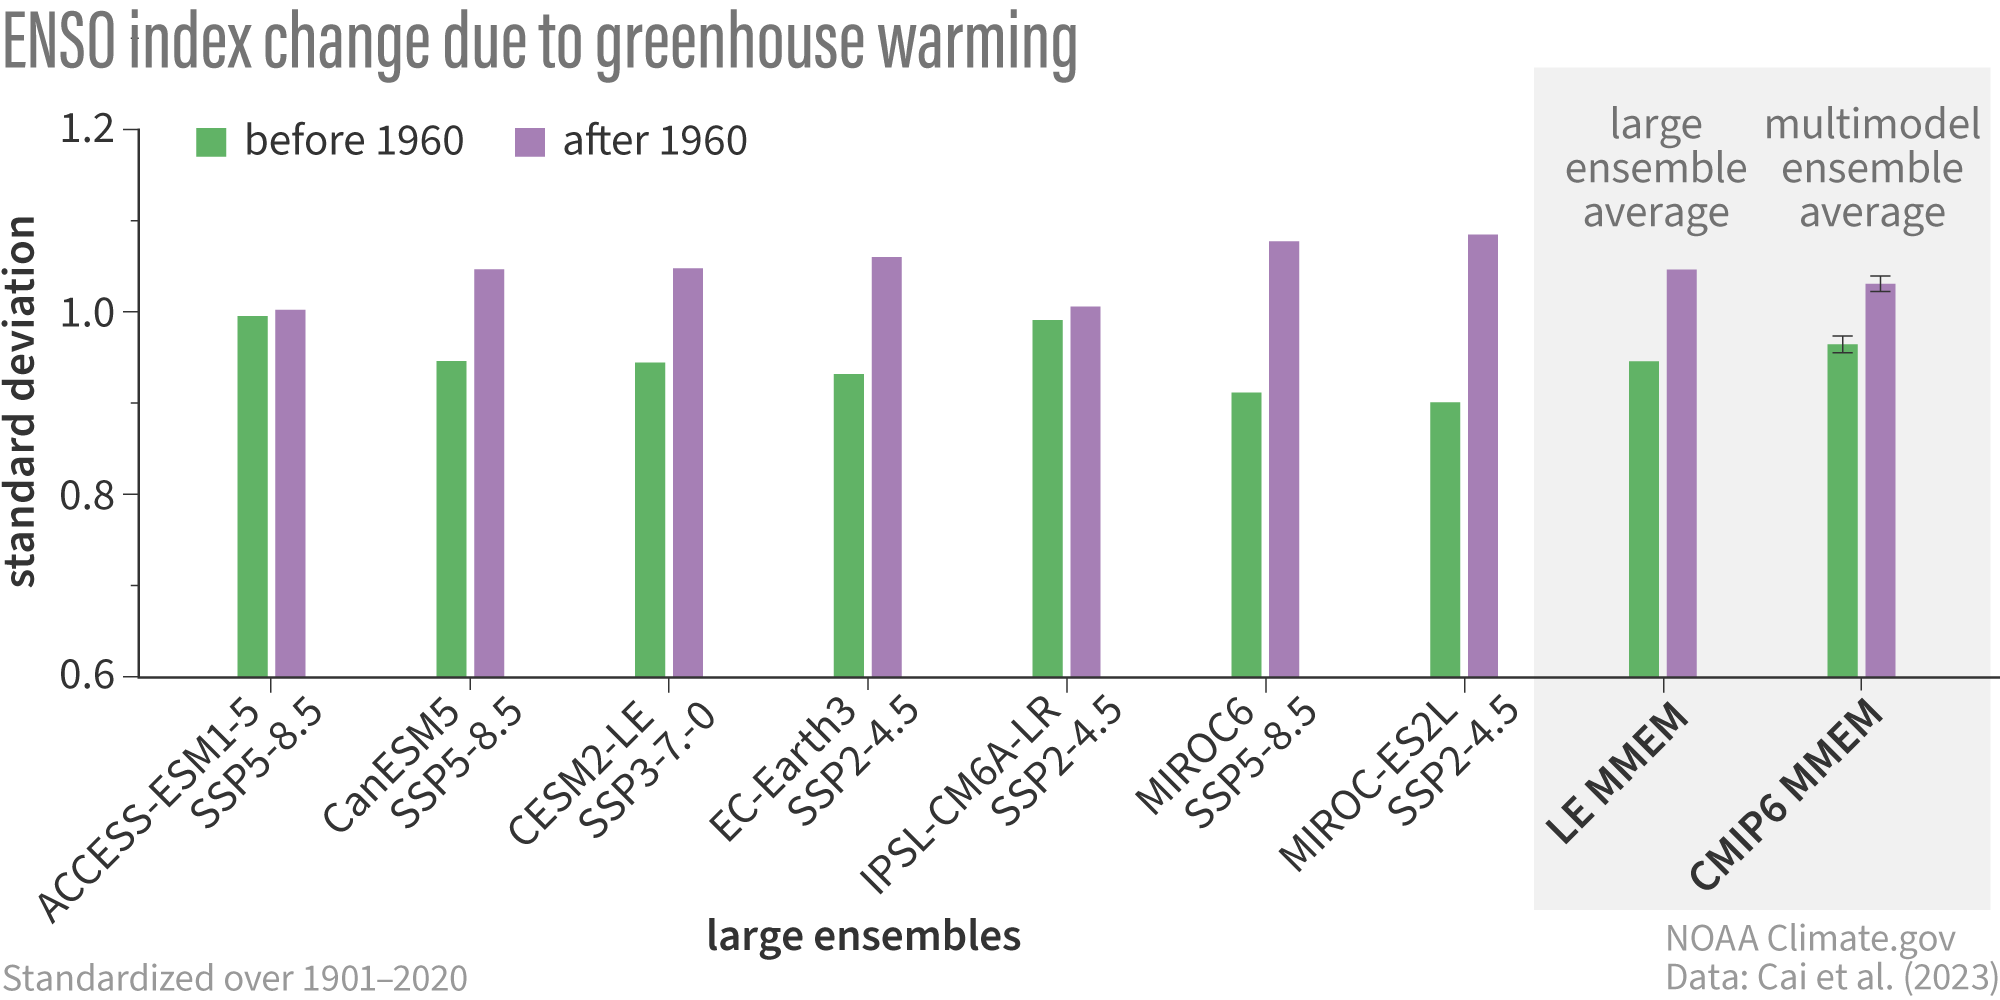
