#LakePowell and #LakeMead are moving in opposite directions – What gives? — Jack Schmidt, Eric Kuhn, Anne Castle, Kathryn Sorensen, Katherine Tara (Center for #ColoradoRiver Studies)

Click the link to read the article on the Center for Colorado River Studies website (Jack Schmidt[1], Eric Kuhn[2], Anne Castle[3], Kathryn Sorensen[4], Katherine Tara[5]):

February 9, 2026

Key Points

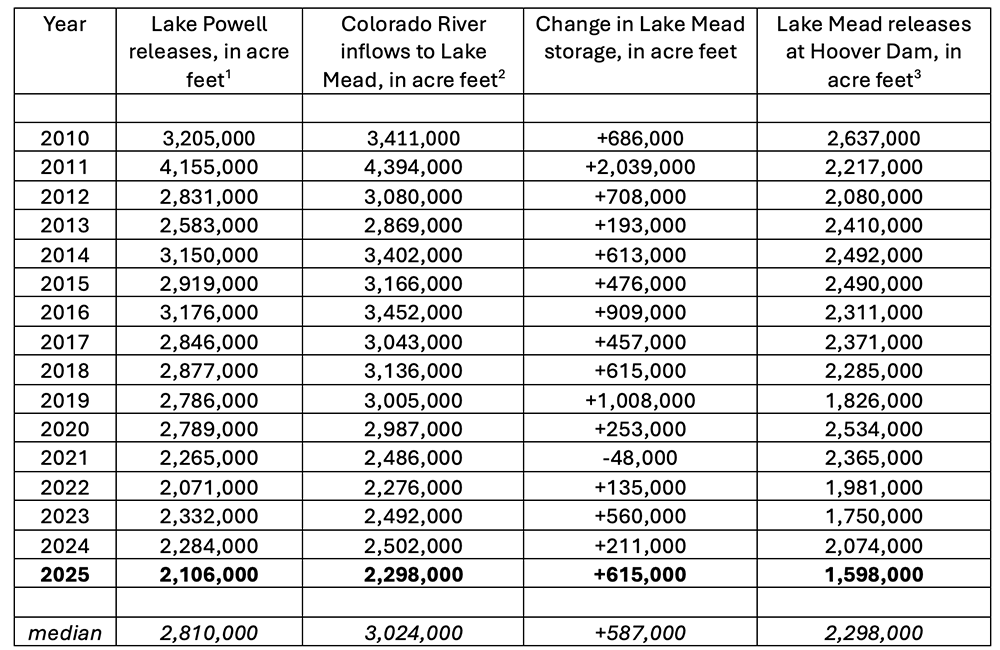
  • The rules that control releases from Lake Powell and Lake Mead are very different. Lake Powell’s releases are determined by an Annual Operating Plan that has little flexibility during the year. Lake Mead’s releases change each month in response to changing delivery requirements to Lower Basin users. The impact of these different release rules on each reservoir’s storage was illustrated this autumn and early winter when Lake Powell steadily declined and Lake Mead steadily increased. The magnitude of Powell’s decline and Mead’s increase compensated for one another, and the total combined storage in Lake Powell and Lake Mead did not change.
  • During the four months between October 1 and February 1, Lake Mead’s releases were reduced in response to decreasing Lower Basin demands, but Lake Powell’s releases were not similarly reduced. Lake Powell lost 615,000 af during the four-month study period, and Lake Mead gained the same amount.
  • On February 1, Lake Mead had 2,714,000 af more water than Lake Powell, the largest difference between the two reservoirs since April 2022.
  • Modest flood inflows in early October delayed drawdown of Lake Powell by six weeks. Releases during the four-month study period were the second smallest since at least 2010[1]. Releases from Lake Mead were the smallest since at least 2010. Despite the small inflows to Lake Mead, the increase in storage in Lake Mead during the study period was the largest since 2019.
  • The four-month delay in depletion of the combined storage in Lake Powell and Lake Mead saved between 400,000 to 900,000 af.
  • Forecasts for spring snowmelt inflow to Lake Powell are not encouraging and have been declining all winter, because Rocky Mountain snowpack remains meager.

[1]We compared the inflows, outflows, changes in storage, and Lower Basin consumptive uses between 2010 and 2026.

Briefly

In mid-September 2025, we noted that if the 2026 snowmelt was as little as in 2025, the total realistically accessible combined storage in Lake Mead and Lake Powell reservoirs (hereafter referred to as Powell+Mead) would likely fall to less than 4 million acre-feet (af) by early autumn 2026, less than the 21st century minimum of March 2023. At the mid-point of winter 2025-2026, where do we stand?

Despite the bad news associated with this winter’s meager Rocky Mountain snowpack and the prospect of insignificant spring inflow to Lake Powell, unusually large autumn rainfall, alongside involuntary shortages and compensated system conservation efforts, reduced the need for deliveries to Lower Basin users, resulting in a significant increase in storage in Lake Mead that matched the drawdown of Lake Powell. As a result, total combined storage In Powell+Mead did not change in October, November, December, and January[1]. This is a helpful and important outcome.

Total inflow to Lake Powell and from sources between Glen Canyon Dam and Lake Mead totaled 1.72 million af during the four-month study period (Table 1). Outflows from Lake Mead, including consumptive use by Nevada and estimated evaporation losses from Lake Powell and Lake Mead, were 1.75 million af. Because the combined storage of Powell+Mead did not change, the Inflows and the outflows, including losses must have been equal. The small discrepancy between inflows and outflows from this two-reservoir system (last two rows of Table 1) remind us of the inherent uncertainty and imprecision of some measurements. In this case, the sources of uncertainty include unmeasured inflows, unmeasured gains and losses of bank storage, and uncertainty in measurements, especially of evaporation.

Table 1. Inflows, outflows, and evaporation losses in Powell+ Mead between October 1, 2025, and February 1, 2026. Blue colors highlight terms used to calculate inflows to the Powell+Mead system. Red colors highlight terms used to calculate outflows and losses from Powell+Mead.

1 sum of daily evaporation reported in Reclamation Hydrodata base. https://www.usbr.gov/uc/water/hydrodata/reservoir_data/site_map.html
2 sum of daily evaporation reported by Lower Colorado Region, Reclamation. https://www.usbr.gov/lc/region/g4000/levels_archive.html.

Even though the total amount of water in Powel+Mead did not change, Lake Powell dropped and Lake Mead rose during the study period resulting in transfer of water from Lake Powell to Lake Mead. Lake Powell lost 615,000 af during the four-month study period, and Lake Mead gained the same amount. Autumn rains modestly augmented inflows to Lake Powell, and Reclamation significantly reduced releases at Hoover Dam, such that inflows and outflows to Powell+Mead approximately balanced each other.

On February 1, Lake Mead had 2,714,000 af more water than Lake Powell, the largest difference between the two reservoirs since April 2022[2] (Fig. 1). Divergence in the amount stored in each reservoir resulted from different operating rules. Releases from Lake Powell in the Upper Basin are established in an Annual Operating Plan intended to meet the Upper Basin’s delivery obligation to the Lower Basin. This plan has little flexibility to adjust releases in response to unexpected changes in inflow. In contrast, releases from Lake Mead are adjusted to the changing delivery requirements to Lower Basin users. As demand in the Lower Basin decreased in autumn and early winter, releases from Lake Mead were significantly reduced.

Figure 1. Graph showing active storage in Lake Mead and Lake Powell since January 1, 2022.

Details

Although October flood inflows to Lake Powell were modest, this short period of augmented inflow delayed the long-term decline in storage by six weeks, an important respite for the reservoir. Inflow to Lake Powell from the Colorado River, the largest source of inflow, was only 75% of average in November, December, and January but exceeded the three-year average between October 12 and 19[3]. Inflow from the San Juan River, the second largest inflow source, exceeded the long-term daily average between October 11 and 22 and between November 15 and 24[4]. As a result, storage in Lake Powell increased by 105,000 af between October 9 and 20, the period when inflow exceeded reservoir release (Fig. 2). The rate of subsequent reservoir decline was much slower than the initial rise, and it was not until late November that Lake Powell returned to the elevation it had been just before the onset of the October floods.

Figure 2. Graph showing Lake Powell inflows and releases. Inflows were calculated as the sum of stream flow measured at USGS gages on the Colorado River above Gypsum Canyon, the Dirty Devil River above Poison Springs Wash, the Escalante River near Escalante, and the San Juan River near Bluff. Releases measured at Lees Ferry represent the sum of actual releases and ground-water seepage from Lake Powell.

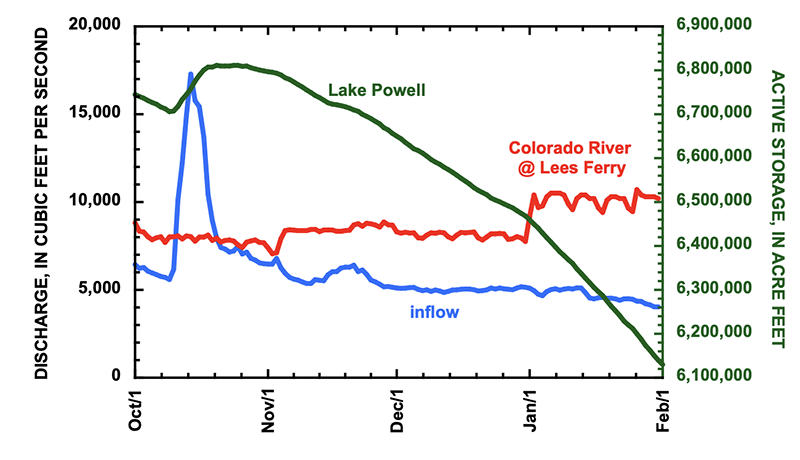
The drop in Lake Powell that began in late October occurred despite Reclamation’s decision to delay release of approximately 600,000 af until summer 2026.[5] Total release from Lake Powell during the study period was 2.106 million af, the second smallest fall and early winter release since 2010 (Table 2).

Table 2. Releases from Lake Powell and inflow, change in storage, and releases from Lake Mead in October, November, December, and January.

1Colorado River at Lees Ferry
2Colorado River above Diamond Creek near Peach Springs
3Reclamation, Lower Basin Accounting Reports. Hydrodata for 2025-26.

Reclamation reduced releases from Lake Mead beginning in mid-November. In response, storage increased, because inflows exceeded releases (Fig. 3). Recovery of Lake Mead during these months was the largest since 2019 and was 5% greater than the median autumn and early winter recovery since 2010 (Table 2). Releases from Lake Mead were the smallest since at least 2010 and were 30% less than the median total release for those years. The increase in Lake Mead occurred despite the small releases from Lake Powell.

Figure 3. Graph showing Lake Mead inflows and releases since October 1, 2025. Inflows were calculated as the sum of stream flow measured at USGS gages of the Colorado River upstream from Diamond Creek, Diamond Creek, and the Virgin River downstream from Muddy Creek.

The small demand for water from Lake Mead was due to a combination of significantly reduced agricultural demand caused by abundant autumn precipitation in California’s Imperial and Coachella Valleys, the Yuma area, and elsewhere in Arizona and southeastern California as well as ongoing Lower Basin programs including involuntary shortage cuts (mostly) to Arizona, Drought Contingency Plan (DCP) contributions, and reductions in water use from compensated system conservation. Although agricultural consumptive use in Arizona and the Imperial Valley is always smallest between November and February, demand in fall 2025, especially in November, was unusually small (Table 3). Withdrawal of water by the Central Arizona Water Conservation District (CAWCD) into the Central Arizona Project (CAP) canal and consumptive use by the Imperial Irrigation District (IID) in November 2025 was less than in any previous November since at least 2010 and was 26% and 54% of the median November use[6], respectively, by those districts. Consumption in October and November by other Arizona users of mainstem Colorado River water was the second smallest since at least 1979 and CAWCD use in October was the second smallest since 1995. Only in 2024 was use less. Use by the Metropolitan Water District in January was the second smallest of the study period.

Table 3. Monthly consumptive use in parts of the Lower Basin in October, November, December, and January.

1Lowest monthly use since at least 2010
2 Second lowest monthly use since at least 2010
3Median monthly use computed for 2010-2026

A Bit of a Silver Lining

What was the significance of the four-month delay in depletion of Powell+Mead? Combined Powell+Mead storage increased between October 1 and February 1 twice since 2010, in the large runoff years of 2011 and 2019 (Table 4). In all other years, storage declined during these four months, and this year’s decrease of 200 af was the smallest decline among those 12 recent years of decline. The median drawdown of the 12 years of decline was 660,000 af and ranged between this year’s tiny drawdown and drawdown of more than 1 million af in 2012 and 2020. It is beyond the scope of this paper to estimate what the drawdown of Powell+Mead would have otherwise been, but a reasonable estimate of the water savings caused by the delayed drawdown of Powell+Mead this year is between 400,000 to 900,000 af[7]. To this small degree, the autumn rains and programs and policies to reduce Lower Basin demand allowed the Basin’s water managers to take one small step back from the edge of the cliff.

Table 4. Change in the combined storage in Lake Powell and Lake Mead between October 1 and February 1 in indicated years.

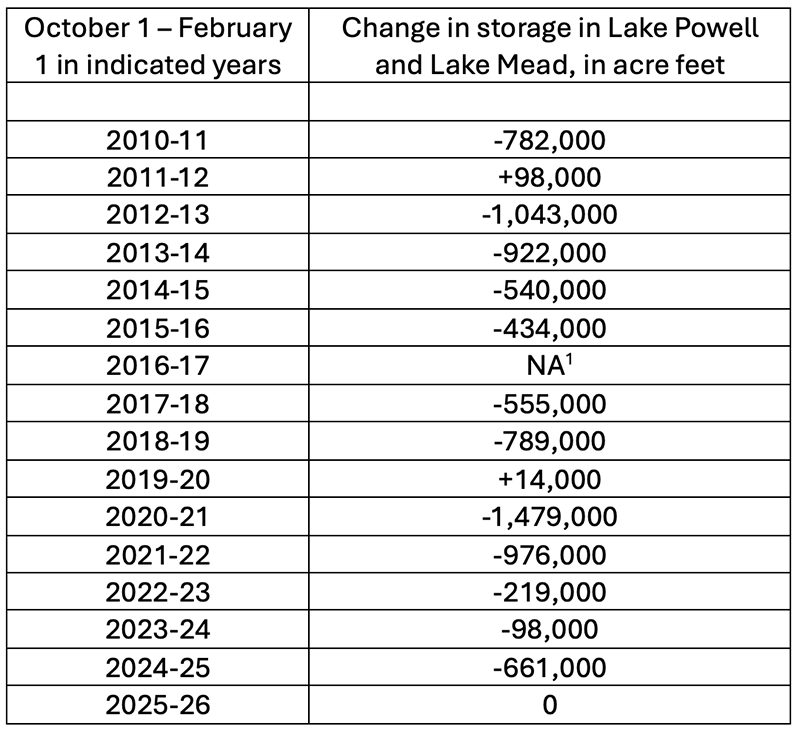
1The combined contents of Lake Powell and Lake Mead began to increase on January 13, 2016. Between October 1 and January 13, the two reservoirs lost 655,000 af.

But, the Bad News

Bad news looms in the future, especially for Lake Powell. The January 2026 24-Month Study’s most probable forecast predicts that in March 2027, storage in Lake Powell will drop to 4,382,000 af of active storage, of which only 150,000 af is realistically accessible (3 ft above reservoir elevation 3500 ft).[8] When Lake Powell is at or below elevation 3500 ft, reservoir releases are complicated by the risk of cavitation in the Glen Canyon Dam turbines and the inability to constantly use the river outlet works. Under the minimum probable inflow forecast, the predicted elevation of Lake Powell is 3476 ft in March 2027, an elevation in which no water could be released through the penstocks and no hydropower would be produced.

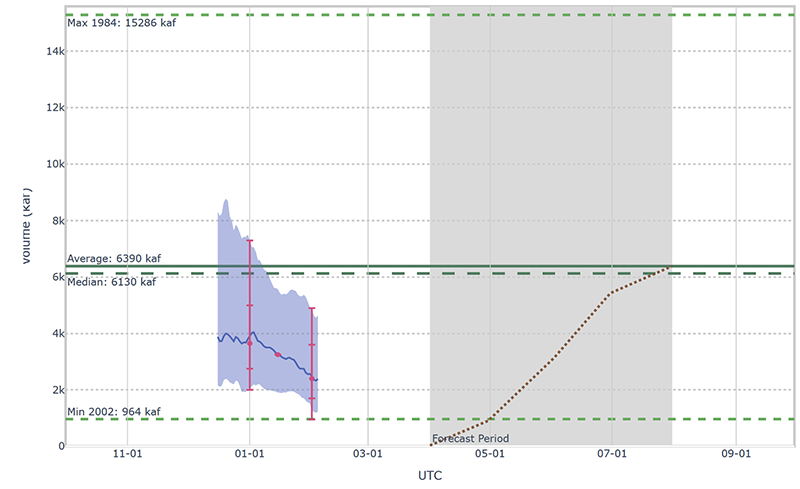
Even the minimum probable forecast may be overly optimistic, because the forecast for April – July unregulated inflow to Lake Powell has been progressively decreasing, because the winter’s snowpack remains meager. The Colorado River Basin Forecast Center’s official February 1 forecast is that the 50th percentile prediction (considered the most probable forecast) is 2.4 million af, significantly less than the January forecast of 3.65 million af (Fig. 4). The 90th percentile prediction (considered the minimum probable forecast) has dropped from 2.1 million af to 950,000 af. If the actual unregulated inflow were to be that of the minimum probable forecast, 2026 would replace 2002 as the lowest April to July inflow on record. Reclamation’s February 24-Month Study will be released in mid-February, and those results will certainly draw considerable attention.

Figure 4. Graph showing forecast of unregulated inflow to Lake Powell made by NOAA’s Colorado Basin River Forecast Center. The dark blue line is the median forecast. The downward trend of the forecast means that more recent forecasts are predicting smaller inflows to Lake Powell. The redlines are the official CBRFC forecasts that the USBR uses as input for the 24- Month Studies.

Unless the snowpack significantly improves between now and early April, Reclamation will have difficult choices to make. Ideally, the agency could use a combination of a large release from Flaming Gorge Reservoir coupled with an additional reduction in releases from Lake Powell to keep the elevation of Lake Powell above 3500 ft. Unless Flaming Gorge Reservoir releases are implemented using the Secretary of the Interior’s emergency authority, however, consultation and agreement with the Upper Basin states will be required. This was the strategy used in 2022, and Reclamation has indicated that even with a release of water from upstream reservoirs, there may still be a need for reductions in Lake Powell releases.[9] However, if the annual release from Lake Powell is reduced to 7 million af or less, the 10-year delivery of water from the Upper Basin to the Lower Basin will be less than what some states consider the delivery obligation of the Upper Basin (i.e., the Compact tripwire). In such a circumstance, interstate litigation might ensue. 

Until basin-wide uses are reduced to meet the available supply, there are no good choices!

[1] Combined active storage in Lake Mead and Lake Powell was 14,974,197 on October 1, 2025. Combined storage on February 1, 2026, was 14,973,991af.
[2] The disparity between storage in the two reservoirs has continued to increase. On February 8, Lake Mead had 2,810,000 af more water in storage than Lake Powell.
[3] Average flow of the Colorado River at Gypsum Canyon near Hite was calculated between June 30, 2023, and January 31, 2026. https://waterdata.usgs.gov/monitoring-location/USGS-09328960/statistics/.
[4] Average flow of the San Juan River near Bluff was calculated between October 30, 1914, and January 31, 2026. https://waterdata.usgs.gov/monitoring-location/USGS-09379500/statistics/.
[5] The goal of delayed release was to protect a target elevation at Lake Powell of 3525 feet. Adjustments to Glen Canyon Dam monthly releases were adjusted to hold back 598,000 af in Lake Powell between December 2025 and April 2026 (Reclamation, January 2026 24-Month Study). https://www.usbr.gov/lc/region/g4000/24mo.pdf.
[6] 2010-2025
[7] This is the interquartile range of the 12 years when Powell+Mead declined in storage.
[8] For an explanation of “realistically accessible storage” see Schmidt et al., Analysis of Colorado River Basin Storage Suggests Need For Immediate Action, Sep. 11, 2025,  https://www.inkstain.net/2025/09/analysis-of-colorado-river-basin-storage-suggests-need-for-immediate-action/.
[9] Reclamation, 2024 SEIS ROD: Section 6(E) Monthly Meeting, Jan. 22, 2026.

Authors:

[1] Director, Center for Colorado River Studies, Utah State University, former Chief, Grand Canyon Monitoring and Research Center.
[2] Retired General Manager, Colorado River Water Conservation District.
[3] Getches-Wilkinson Center, University of Colorado Law School, former US Commissioner, Upper Colorado River Commission, former Assistant Secretary for Water and Science, US Dept. of the Interior.
[4] Kyl Center for Water Policy, Arizona State University, former Director, Phoenix Water Services.
[5] Staff Attorney, Utton Transboundary Resources Center, University of New Mexico.

Warming winters are disrupting the hidden world of fungi – the result can shift mountain grasslands to scrub

Warmer winters in normally snowy places can interfere with the important activities of microbes in the soil. Seogi/500px via Getty Images

Stephanie Kivlin, University of Tennessee; Aimee Classen, University of Michigan, and Lara A. Souza, University of Oklahoma

When you look out across a snowy winter landscape, it might seem like nature is fast asleep. Yet, under the surface, tiny organisms are hard at work, consuming the previous year’s dead plant material and other organic matter.

These soil microorganisms – Earth’s recyclers – liberate nutrients that will act as fertilizer once grasses and other plants wake up with the spring snowmelt.

Key among them are arbuscular mycorrhizal fungi, found in over 75% of plant species around the planet. These threadlike fungi grow like webs inside plant roots, where they provide up to 50% of the plant’s nutrient and water supply in exchange for plant carbon, which the fungi use to grow and reproduce.

A magnified image shows dots and thin filaments weaving through the outer cells of a root.
A magnified view shows filaments and vesicles of arbuscular mycorrhizal fungi weaving through the outer cells of a plant root. Outside the root, the filaments of hyphae gather nutrients from the soil. Edouard Evangelisti, et al., New Phytologist, 2021, CC BY

In winter, the snowpack insulates mycorrhizal fungi and other microorganisms like a blanket, allowing them to continue to decompose soil organic matter, even when air temperatures above the snow are well below freezing. However, when rain washes out the snowpack or a healthy snowpack doesn’t form, water in the soil can later freeze – as can mycorrhizal fungi.

In a new study in the Rocky Mountain grasslands, we dug into plots of land that for three decades scientists led by ecologist John Harte had warmed by 2 degrees Celsius (3.6 Fahrenheit) using suspended heaters that mimicked the air temperature the area is likely to see by the end of this century.

Above ground, the plots shifted over that time from predominantly grassland to more desertlike shrublands. Under the surface, we found something else: There were noticeably fewer beneficial mycorrhizal fungi, which left plants less able to acquire nutrients or buffer themselves from environmental stressors like freezing temperatures and drought.

These changes represent a major shift in the ecosystem, one that, on a wide scale, could reverberate through the food web as the grasses and forbs, such as wildflowers, that cattle and wildlife rely on decline and are replaced by a more desertlike environment.

When plants and fungi get out of sync

Warmer winters and a changing snowpack can affect the growth of plants and fungi in a few important ways.

One of the first signs of changing winters is when the timing of plant, fungal and animal activities that rely on one another get out of sync. For example, a mountain of evidence from around the world has documented how early snowmelt can lead to flowers blooming before pollinators arrive.

Timing also matters for plants that rely on mycorrhizal fungi – their growth must overlap.

Since plants are cued to light in addition to temperature, whereas underground microorganisms are cued to temperature and nutrient availability, warmer winters may cause microorganisms to be active well before their plant counterparts.

A mountain with a meadow filled with grasses and wildflowers in the foreground.
A view across the subalpine grasslands outside the experimental plots. Stephanie Kivlin

At our research site, in a subalpine meadow in Colorado, we also initiated an early snowmelt experiment in April 2023 that advanced snowmelt in five large plots by about two weeks.

We found that the early snowmelt advanced mycorrhizal fungal growth by one week, but we didn’t find a corresponding change in the growth of plant roots. When mycorrhizal fungi are active before plants, the plants don’t benefit from the nutrients that mycorrhizal fungi are taking up from the soil.

Disappearing nutrients

Early snowmelt can also lead to a loss of nutrients from the soil.

When microorganisms decompose organic matter in warmer soils, nutrients accumulate in the air and water pockets between soil particles. These nutrients are then available for mycorrhizal fungi to transfer to plants. While mycorrhizal fungi transfer nutrients to the plant, other fungi are primarily decomposers that keep the nutrients for themselves.

However, if rain falls on the snow or the snow melts early, before plants are active, the nutrients can leach from the soil into lakes and streams. The effect is similar to fertilizer runoff from farm fields – the nutrients fuel algae growth, which can create low-oxygen dead zones. At the same time, plants in the field have fewer nutrients available.

This kind of nutrient leaching has happened in a variety of ecosystems with warming winters and rain-on-snow events, ranging from mountain grasslands in Colorado to temperate forests in New England and the Midwest.

Without a thick snowpack, soils can also freeze for longer periods in the winter, leading to lower microbial activity and scarce resources at the onset of spring.

The future of changing winters

Under all of these scenarios – a timing mismatch, more rain causing nutrients to leach out or frozen soil – warmer winters are leading to less spring growth.

Ecosystems are often resilient, however. Organisms could acclimate to lower nutrient concentrations or shift their ranges to more favorable conditions. How plants and mycorrhizal fungi both adapt will determine how this hidden world adjusts to changing winters.

So, the next time rain on snow or a snow drought delays your outdoor winter plans, remember that it’s more than a hassle for humans – it’s affecting that hidden world below, with potentially long-term effects.

Stephanie Kivlin, Associate Professor of Ecology, University of Tennessee; Aimee Classen, Professor of Ecology and Evolutionary Biology, University of Michigan, and Lara A. Souza, Associate Professor of Plant Biology, University of Oklahoma

This article is republished from The Conversation under a Creative Commons license. Read the original article.

Report: Colorado Climate Damages & Adaptation Costs — Pegah Jalali (ColoradoFiscalInstitute.org)

Click the link to download the report from the Colorado Fiscal Institute website (Pegah Jalali):

January 30, 2026

Introduction

Between 2025 and 2050, our analysis finds that climate change could impose roughly $33 billion to $37 billion in additional costs and resilience needs across Colorado’s health, infrastructure, wildfire, flooding, and winter recreation impacts. The largest quantified drivers are extreme heat, which could lead to about 1,800 to 1,900 additional heat-related deaths, or about $24 billion to $25 billion in losses, and infrastructure pressures totaling about $8.3 billion to $8.7 billion in added costs and upgrades as roads, bridges, stormwater systems, and building cooling demand are pushed beyond historical design conditions. Wildfire smoke and property impacts add another $1.3 billion, with additional resilience needs on the order of $2.3 billion. These figures do not capture every hazard or indirect loss, but they make one point clear: Planning and investment now can save lives and avoid much larger costs later.

Executive Summary (2025 TO 2050)

Colorado is already experiencing the effects of a warming climate: hotter summers, longer wildfire seasons, more smoke exposure, and mounting pressure on critical infrastructure and water-dependent industries. These changes are not abstract. They influence public health, household costs, and the reliability of roads, bridges, and stormwater systems, while increasing the risk of disruptive, high-loss events.

Across the impacts we quantify, total projected costs from 2025 to 2050 are on the order of $50 billion to $54 billion, of which $36 billion to $37 billion represents additional costs directly attributable to climate change, plus defined resilience investments.

This executive summary highlights projected climate-related damages and resilience needs from 2025 to 2050. It is intended for policymakers, community leaders, and reporters who need a clear, comparable set of numbers to understand the scale of the challenge. Results are shown under two global emissions pathways that bracket plausible futures: a medium-high pathway (SSP3-7.0) and a high-end emissions pathway (SSP5-8.5).

Among Colorado’s health, infrastructure, wildfire, flooding, and winter recreation impacts, the largest quantified drivers are extreme heat, which could lead to about 1,800 to 1,900 additional heat-related deaths, or about $24 billion to $25 billion in losses, and infrastructure pressures totaling about $8.3 billion to $8.7 billion in added costs and upgrades as roads, bridges, stormwater systems, and building cooling demand are pushed beyond historical design conditions. Wildfire smoke and property impacts add another $1.3 billion, with additional resilience needs on the order of $2.3 billion. These figures do not capture every hazard or indirect loss, but they make one point clear: Planning and investment now can save lives and avoid much larger costs later.

How we estimated impacts: For each sector, we combine Colorado-specific historical records with downscaled climate projections to quantify how key hazards change over time. We then estimate climate-attributable impacts by comparing projected outcomes to a counterfactual that holds climate hazards at 1995 to 2014 baseline levels while allowing underlying trends to continue. Where relevant, we also estimate defined resilience investments, such as bridge upgrades, stormwater improvements, wildfire mitigation, and snowmaking, that can reduce future losses. All monetary values are reported in 2024 dollars.

Because not every climate impact can be modeled with available data, these estimates should be viewed as conservative. They cover major, quantifiable pathways but do not include every hazard, indirect economic spillover, or nonfatal health effect.

Wild Horse Reservoir to shift locations in preparation for NEPA process — The Flume

Click the link to read the article on The Flume website (Meryl Phair). Here’s an excerpt:

February 18, 2026

Plans for the Wild Horse Reservoir have recently updated the location of the proposed water reserve in Hartsel based on Aurora Water’s evaluation of several alternative locations in preparation for the Bureau of Land Management (BLM)’s National Environmental Policy Act (NEPA) process. Located southwest of Spinney Mountain Reservoir, the site will be shifting to the Wild Horse South Reservoir, a move that representatives of Aurora Water describe as having significant advantages for construction. Aurora Water Assistant General Manager Sarah Young stated in a media briefing on the recent planning change that the NEPA process Aurora Water has been working through with the BLM, in collaboration with Park County government, aims to both clarify the need for the project and understand all available alternatives for meeting that need.

“We evaluated twenty different options,” Young said. “As we were evaluating these alternatives, what we found out is that the Wild Horse South Reservoir has a number of significant advantages.” 

In addition to the initially proposed Wild Horse Reservoir Project, some of the alternatives included the Small Wild Horse Reservoir and Denver Basin Aquifer Storage and Recovery (ASR) Alternative, expanding existing capacities in Spinney Mountain Reservoir, a no-action alternative and the Wild Horse South Reservoir Alternative. Regarding the project’s need, the proposed reservoir undertaking aims to enhance the City of Aurora’s water management of supplies from the Arkansas and Colorado River basins. As the third-largest city in Colorado, Aurora serves over 400,000 residents, yet lacks access to an immediate water source. Projections in the statewide Colorado Water Plan indicate that a significant statewide water supply gap is anticipated by 2050 and the Wild Horse Reservoir was identified in Aurora’s 2017 Integrated Water Master Plan as a crucial step in meeting the growing need. The shift in plans comes during a record low snow pack year for Colorado, the lowest since 1987, which is projected to affect state water resources down the line.

“When we’re having a year like we’re having right now, [Wild Horse] will help us bridge these types of droughts by storing water that comes from times when the snowpack is much better,” Young said.