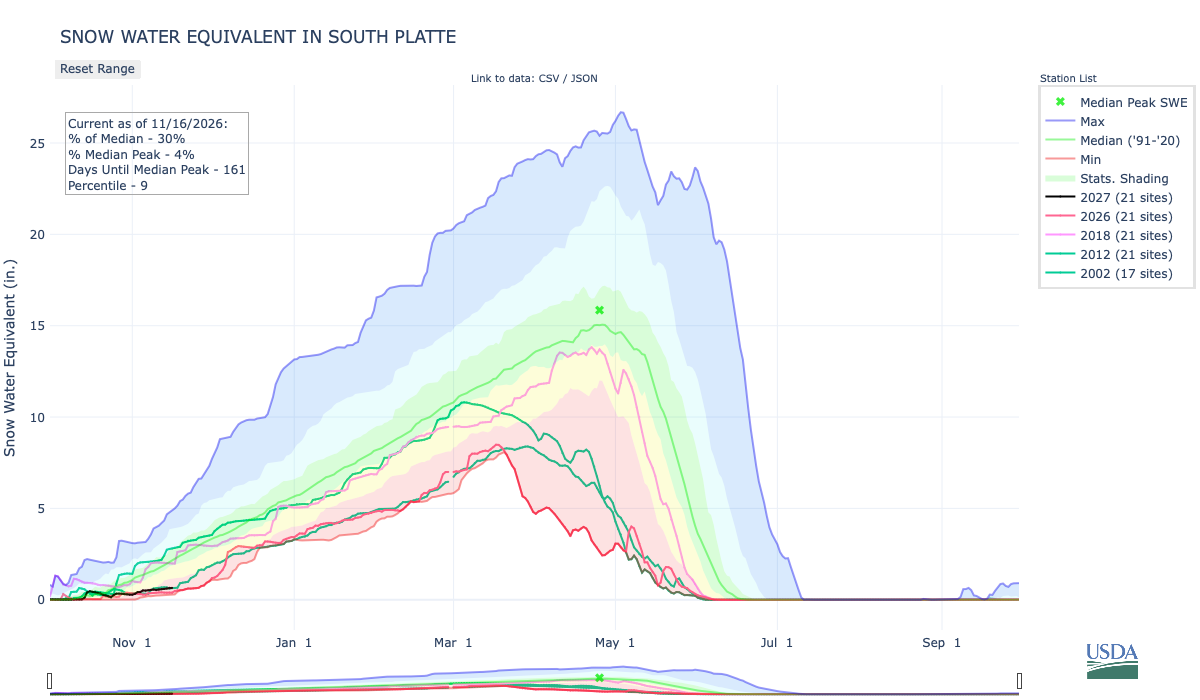
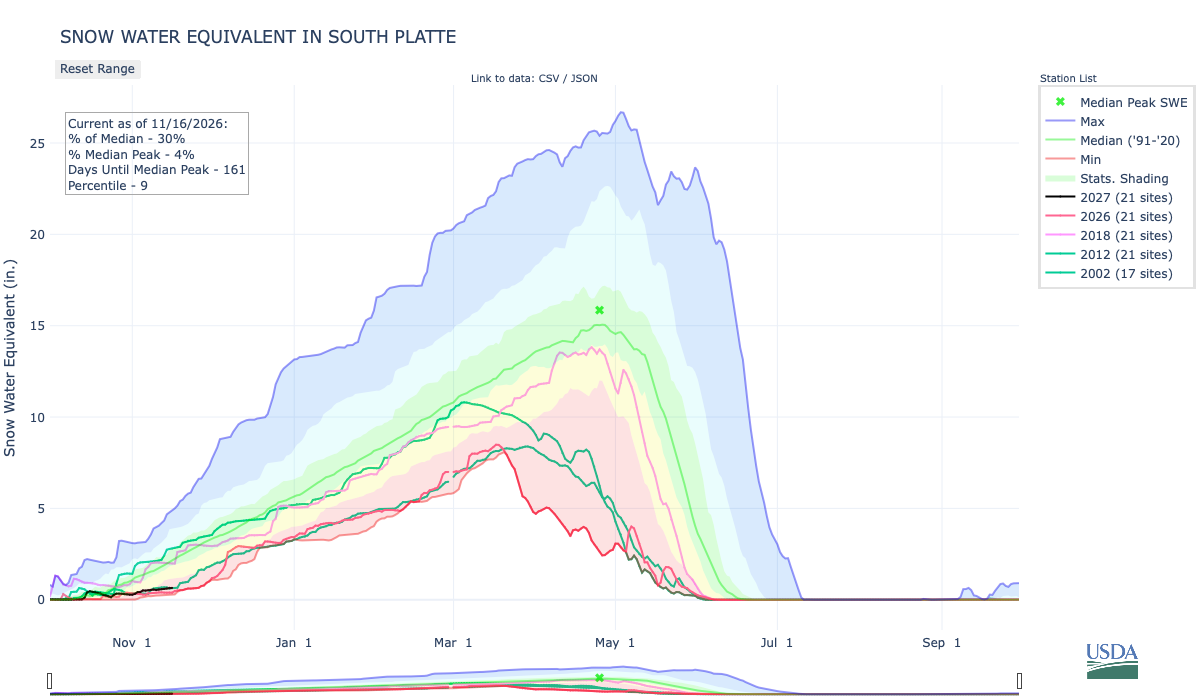
Below is the Snow Water Equivalent in South Platte graph from the NRCS for November 16, 2026. Snowpack is 30% of the median (down 6% one week, wild swings this time of the accumulation season) and 4% of the median peak (no change one week). There are 161 days until the median peak. I’ve added the lines for 2026, 2018, 2012, and 2002, since drought in the South Platte River Basin is still very pronounced.
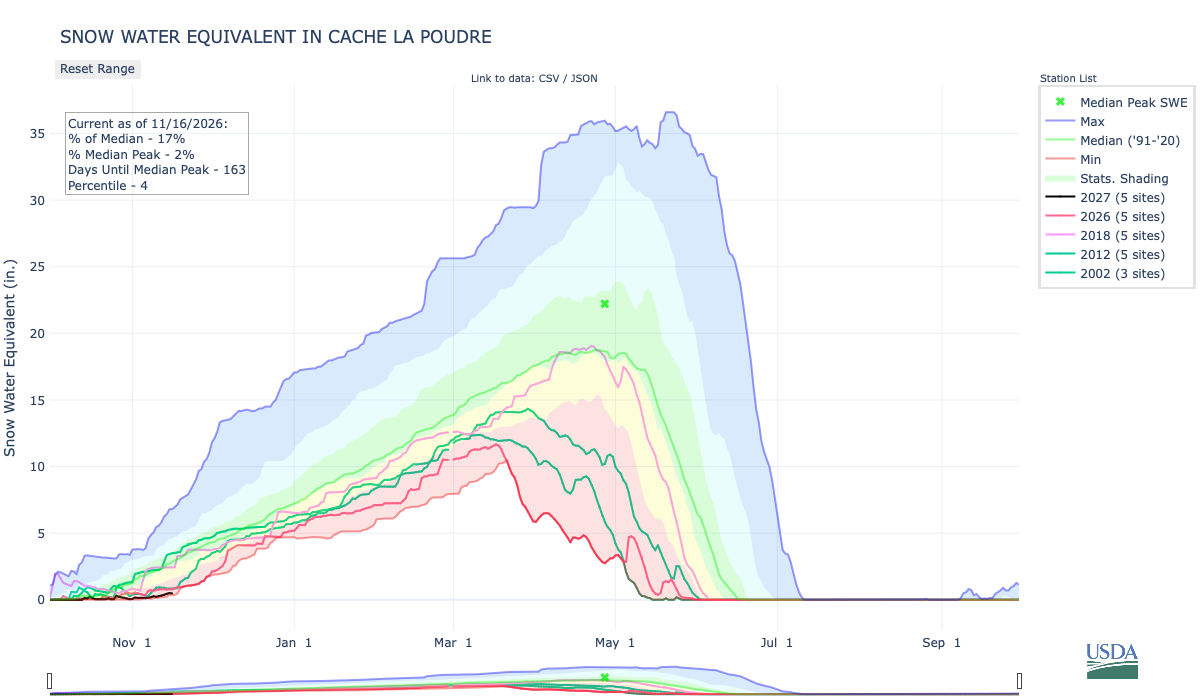
There is a gradient from south to north in the South Platte River Basin. Check out the graphs for the Upper South Platte (57% of the median) and the Cache la Poudre (17% of the median, up 5% one week).
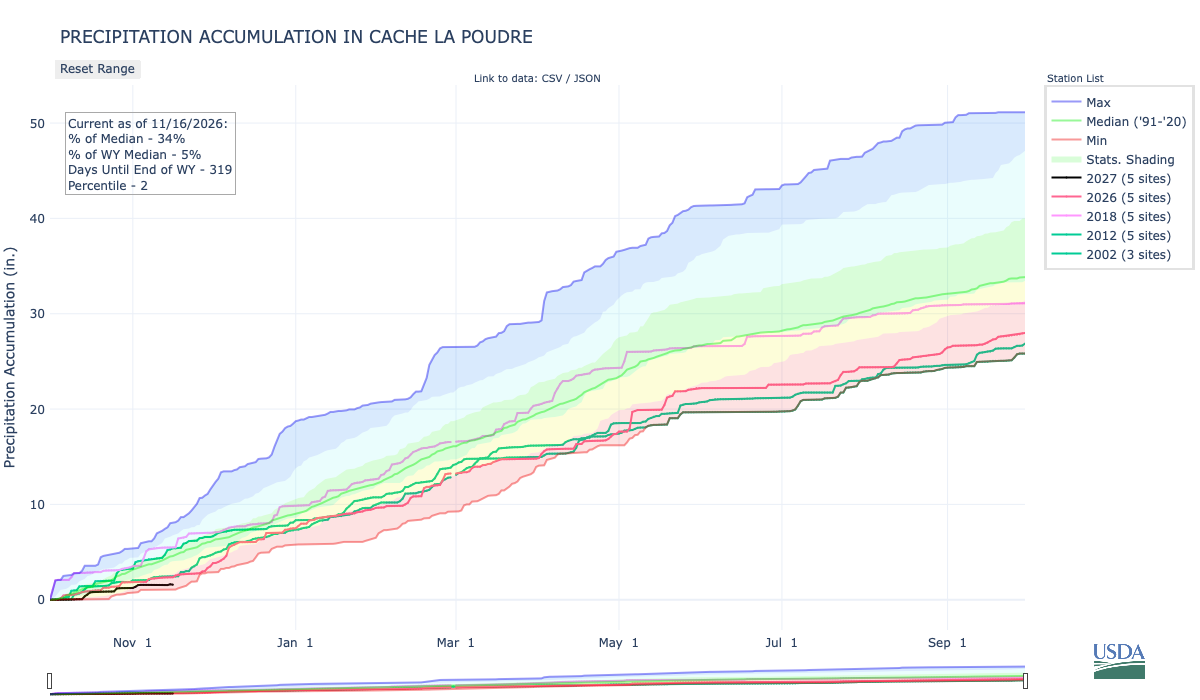
Below is the Precipitation Accumulation in South Platte graph from the NRCS for November 16, 2026. This morning precipitation, at the SNOTEL stations, is at 57% of the median (down 11% one week), and 7% of the water year median (no change one week), There are 319 days left in the water year. I’ve added the lines for 2026, 2018, 2012, and 2002 since drought in the South Platte River Basin is still very pronounced.

The gradient from south to north is even more pronounced in accumulated precipitation.

There is a chance for snow showers Tuesday, a slight chance for snow showers Thursday, with snow showers likely Friday, in the central mountains. There is a chance for snow showers Friday in the northern mountains. It looks like it will be sunny and warm down here, about 65 miles from the Colorado Climate Center, where friend of Coyote Gulch, Nolan Doesken, rode herd on operations, and established the citizen science project CoCoRaHS, in his role as State Climatologist. Current State Climatologist, Russ Schumacher, published this yesterday on BlueSky:
We knew this day was approaching, but that doesn’t make it hurt any less. There will never be another like Nolan, but we’ll do our best to keep his memory alive by continuing to collect and carefully analyze data, and by telling stories about weather and climate with joy and humor.

From the CoCoRaHS website:
ABOUT COCORAHS
The saying “Rain doesn’t fall the same on all” really proves to be true. How often have you seen it rain in your neighborhood, and a few blocks away, not a drop has fallen? CoCoRaHS (pronounced KO-ko-rozz) is a grassroots volunteer network of backyard weather observers of all ages and backgrounds working together to measure and map precipitation (rain, hail, and snow) in their local communities. By using low-cost measurement tools, emphasizing training and education, and utilizing an interactive Website and Mobile App, we aim to provide the highest-quality data for natural resource, education, and research applications. The only requirements to join are an enthusiasm for watching and reporting weather conditions and a desire to learn more about how weather can affect our lives. CoCoRaHS is currently the largest source of daily precipitation observations in North America. It is composed of more than 28,000 active observers in the United States, Canada, Puerto Rico, the U.S. Virgin Islands, Guam, and the Bahamas. Our website lets observers see their observations mapped in “real time” and provides a wealth of information for data users. Observers’ measurements continue to give scientists an ever clearer picture of where and how much precipitation falls throughout our communities. For more information, please click here: Information about CoCoRaHS It’s easy to join, takes only five minutes a day, and is a fun way to learn about this wonderful natural resource that falls from the sky. If you would like to sign up as a volunteer observer and join our expanding network, please click here: Join the CoCoRaHS Network.
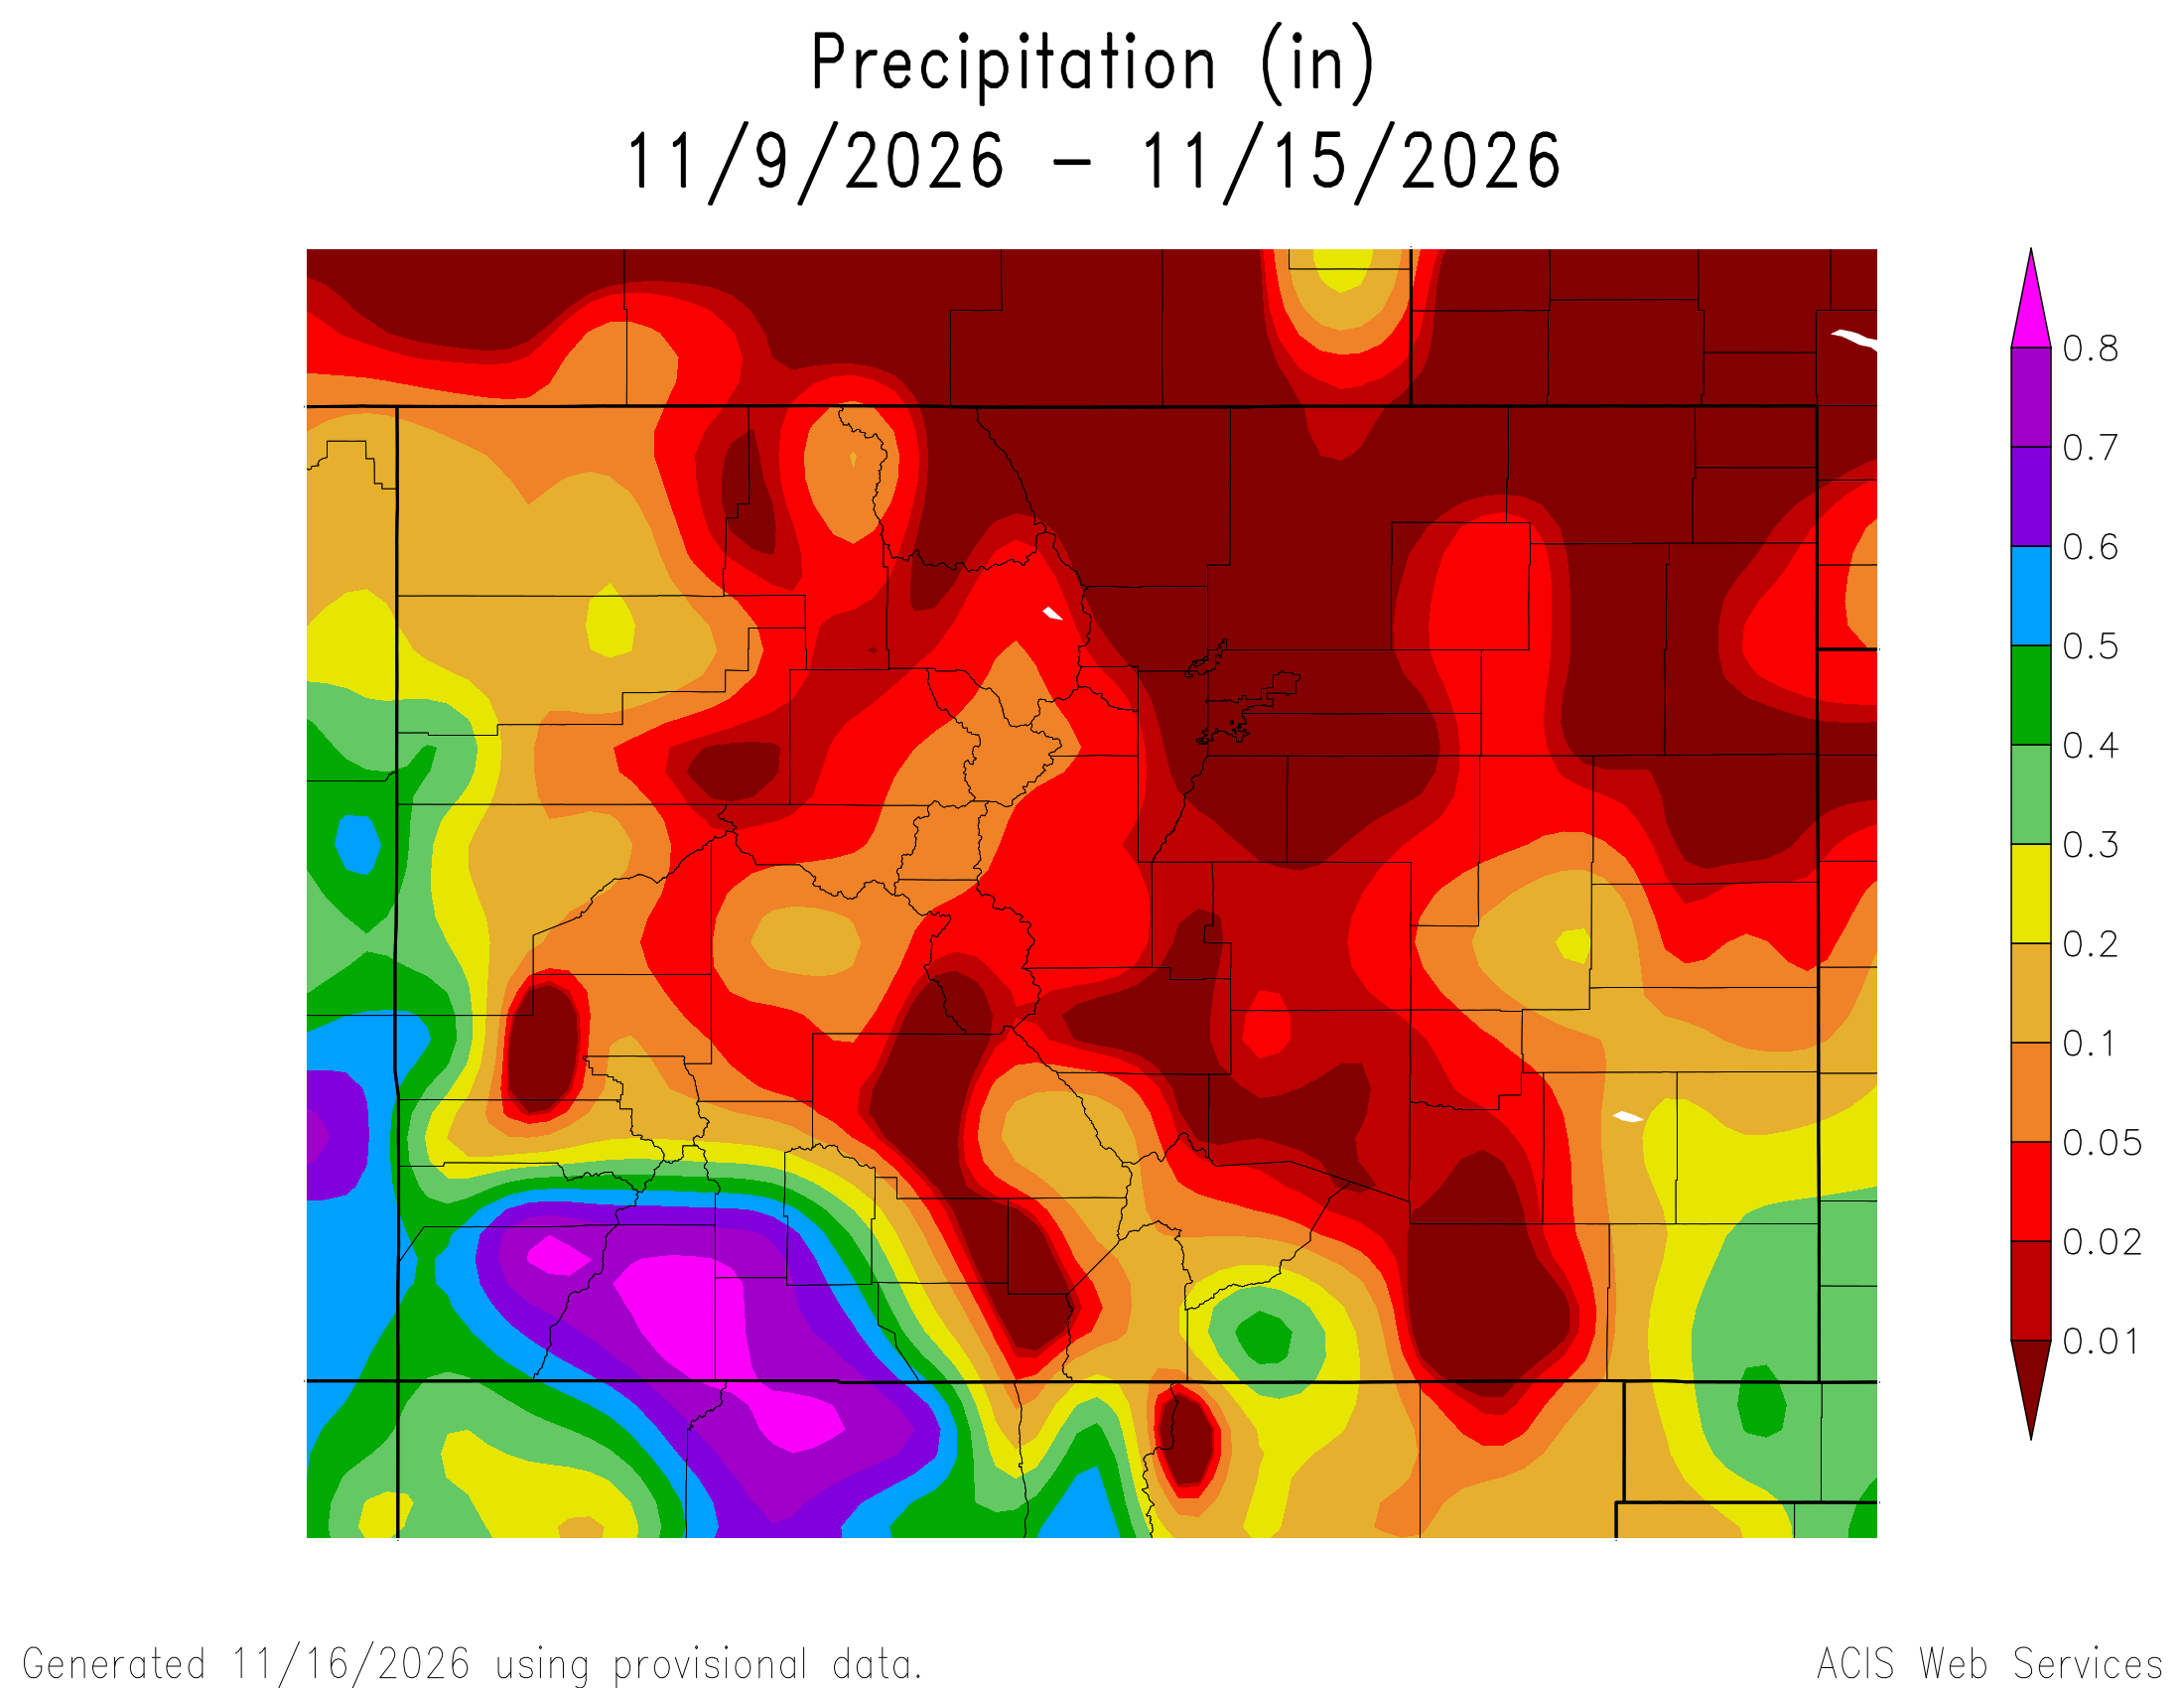
Here’s a look at the Colorado 7-Day precipitation map through November 15, 2026 from the High Plains Regional Climate Center. Precipitation in the South Platte Basin along the Continental Divide of the Americas ranged from 0.00” to 0.10″.
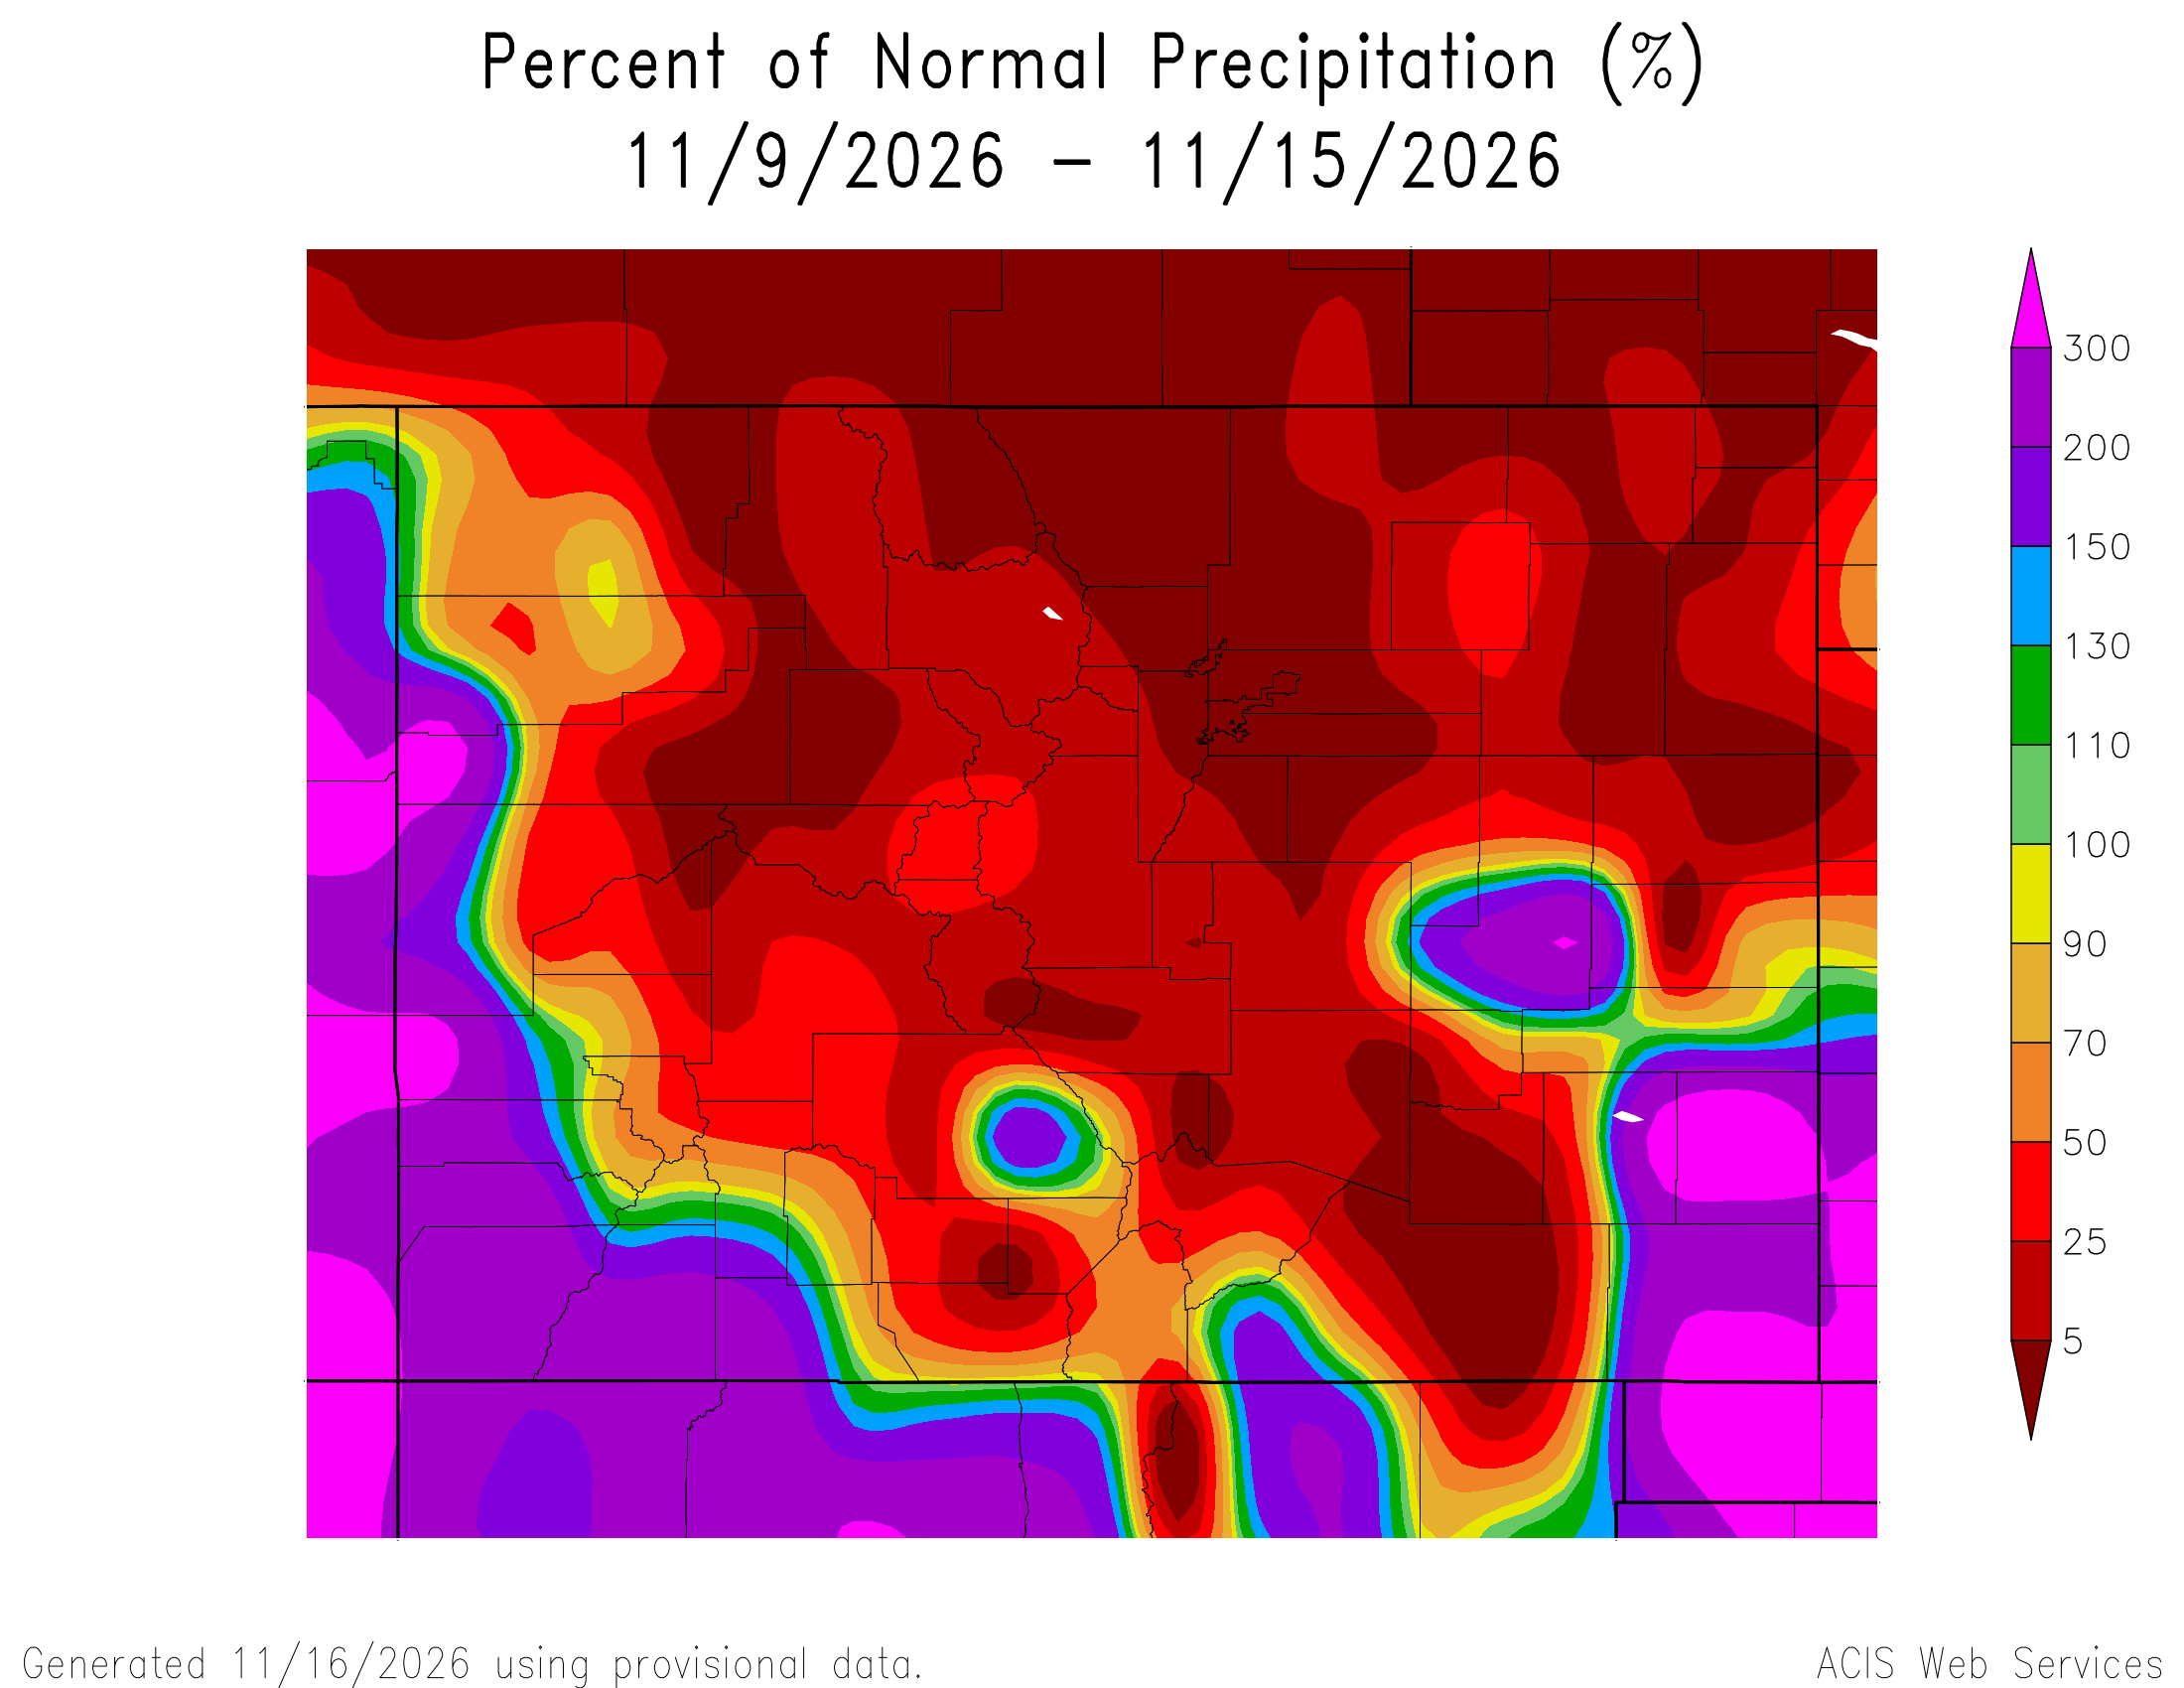
Here’s the Colorado 7-Day percent of normal precipitation map through November 15, 2026 from the High Plains Regional Climate Center. Precipitation in the South Platte River Basin along the Continental Divide of the Americas ranged from 0% to 50% of normal.
Here’s the most recent 7-Day Departure from Normal Temperature (F) for Colorado through November 15, 2026 from the High Plains Regional Climate Center.

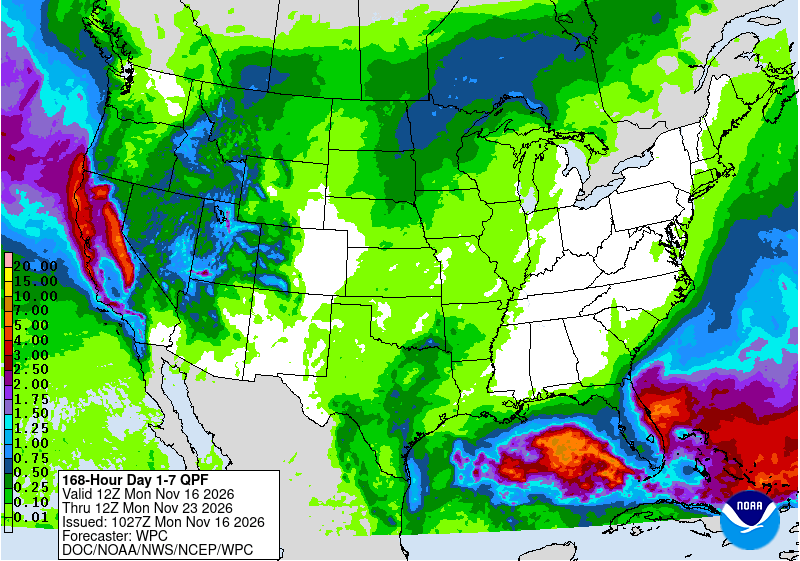
Below is the 7-day Quantitative Precipitation Forecast for the week of November 16, 2026. Precipitation is anticipated for the mountains of the South Platte River Basin and may total 0.10″.
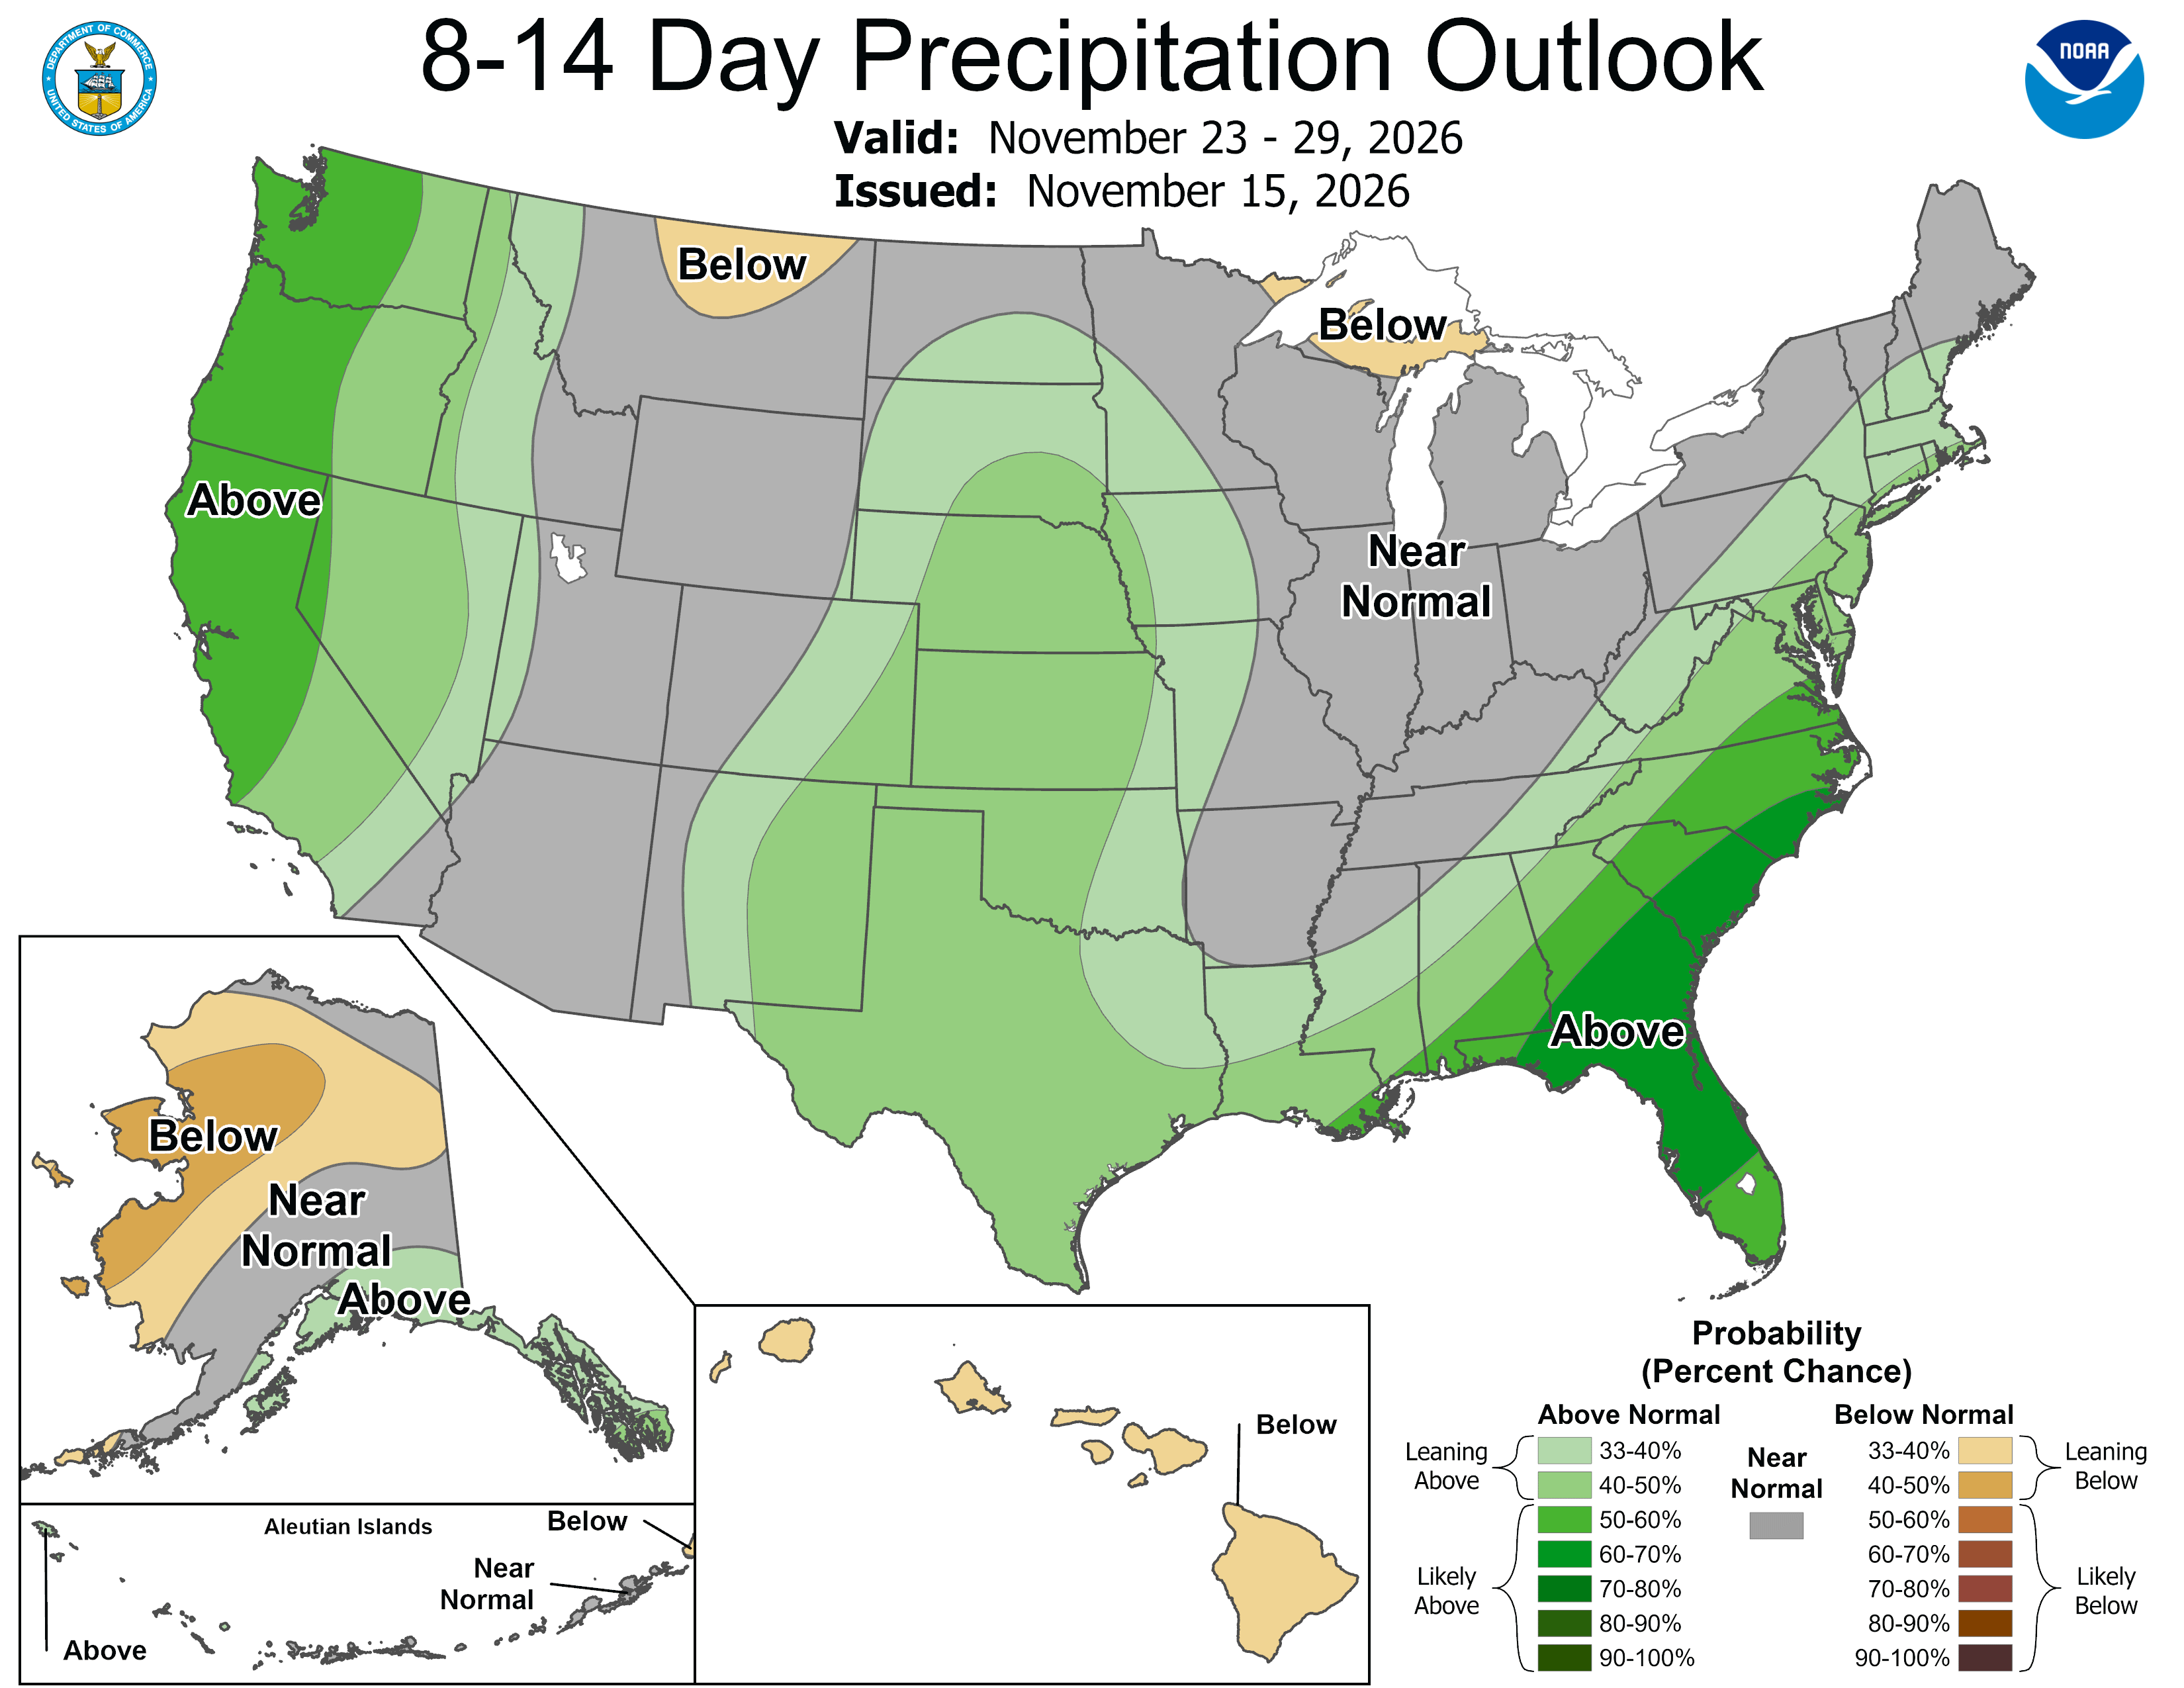
Below are the 8-14 day outlooks from the Climate Prediction Center, issued November 15, 2026, for temperature and precipitation, for the week starting November 23, 2026. The CPC expects above normal temperatures and above normal precipitation for the mountains of the South Platte River Basin.

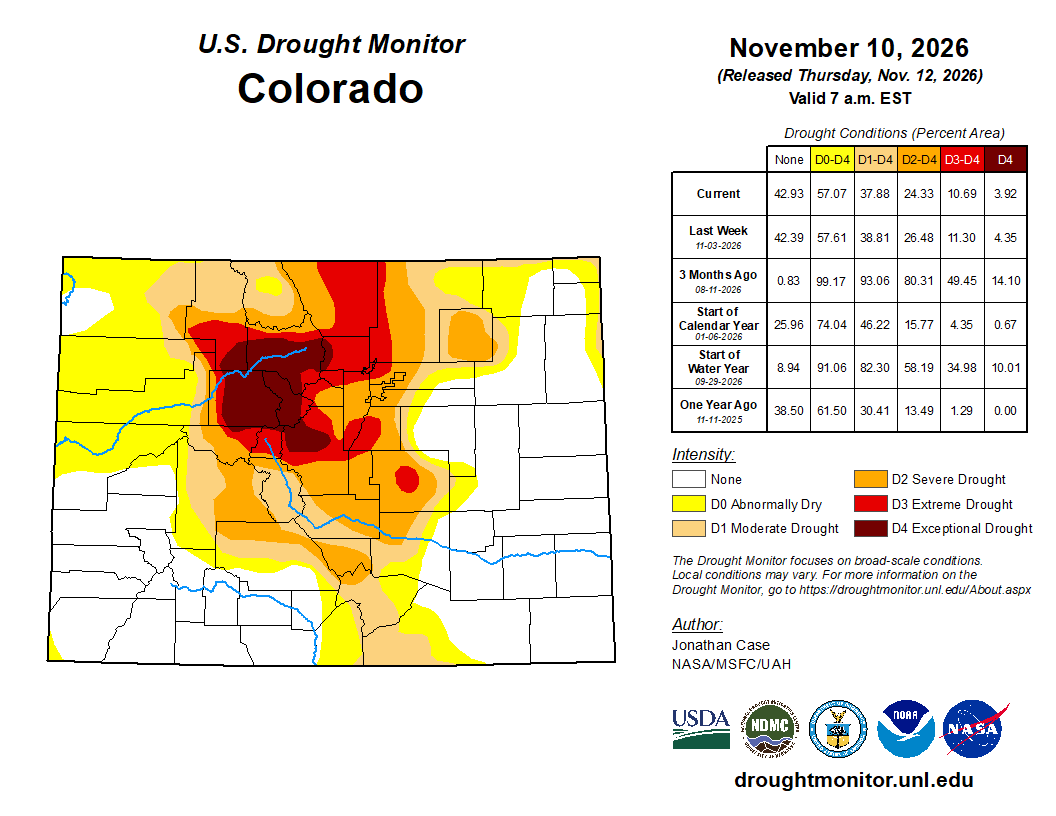
Below is the Colorado Drought Monitor map from November 10, 2026. There were one category degradations in Boulder, Gilpin, and Clear Creek counties. There were one category improvements in Jefferson and Park counties. Drought and abnormal dryness covers 57.07% of Colorado. The South Platte Basin is experiencing Abnormally Dry, Moderate, Severe, Extreme, and Exceptional drought conditions.
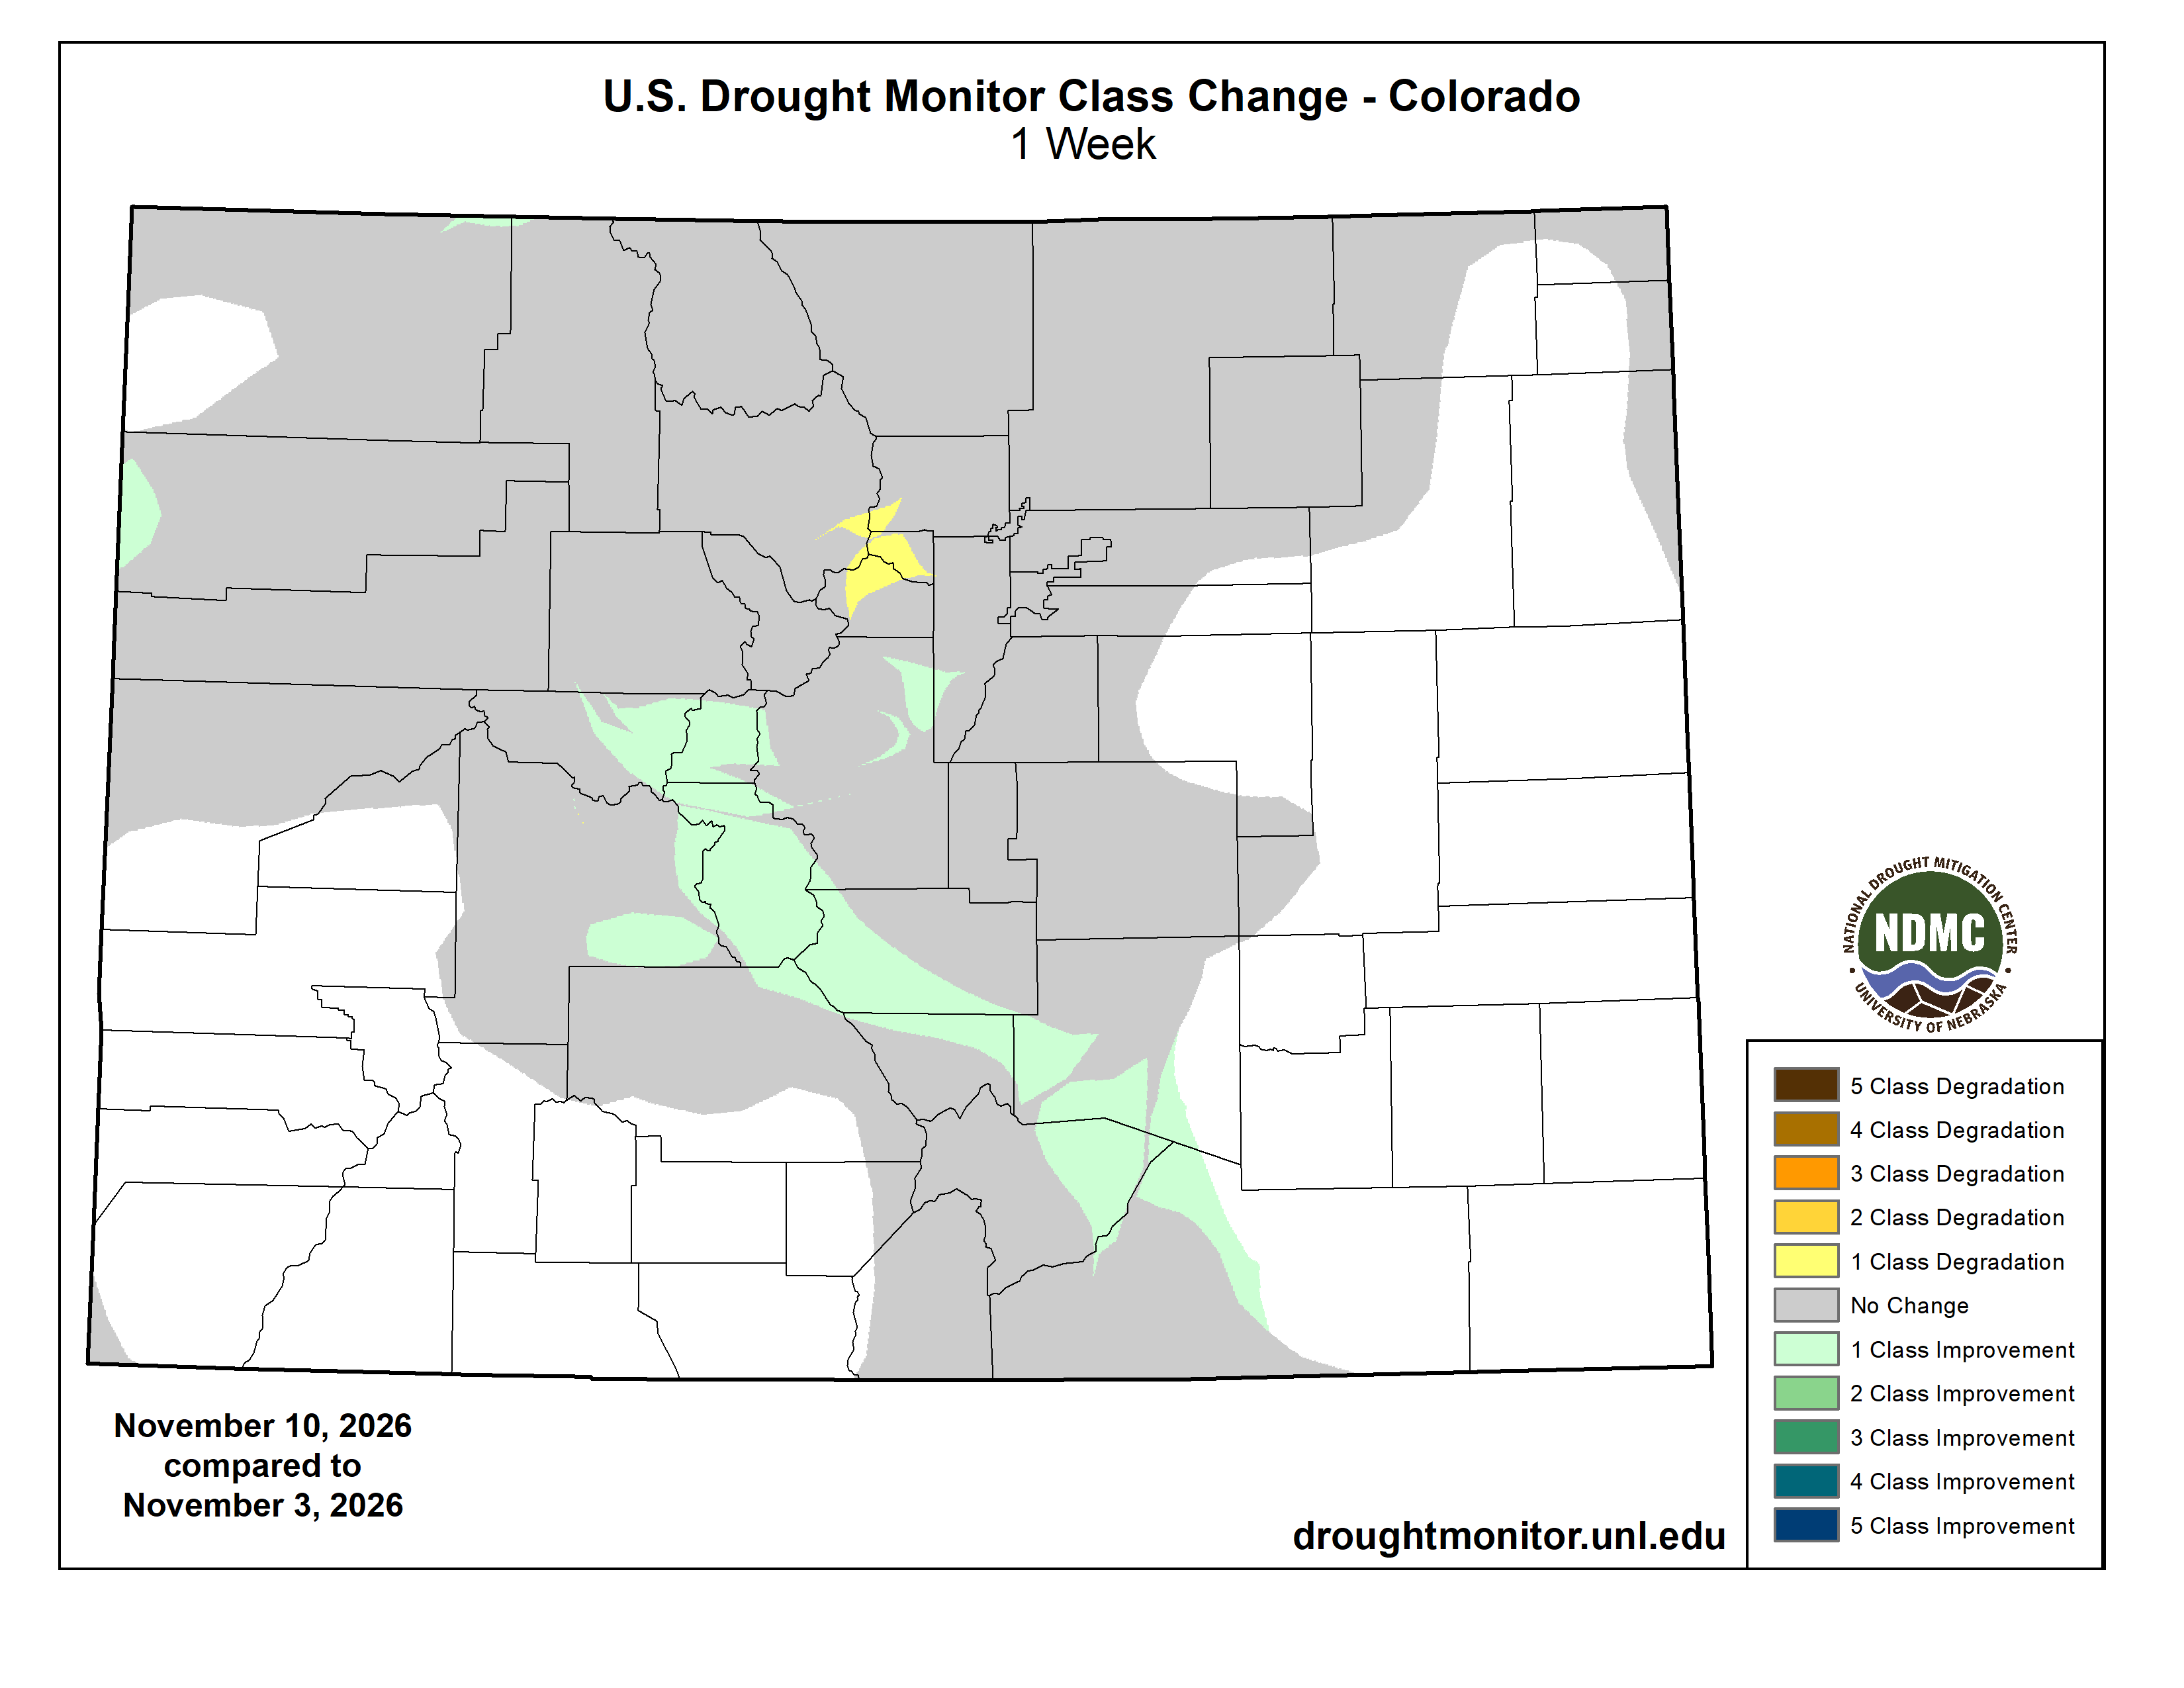
Below is the Colorado Drought Monitor one week change map ending November 10, 2026.
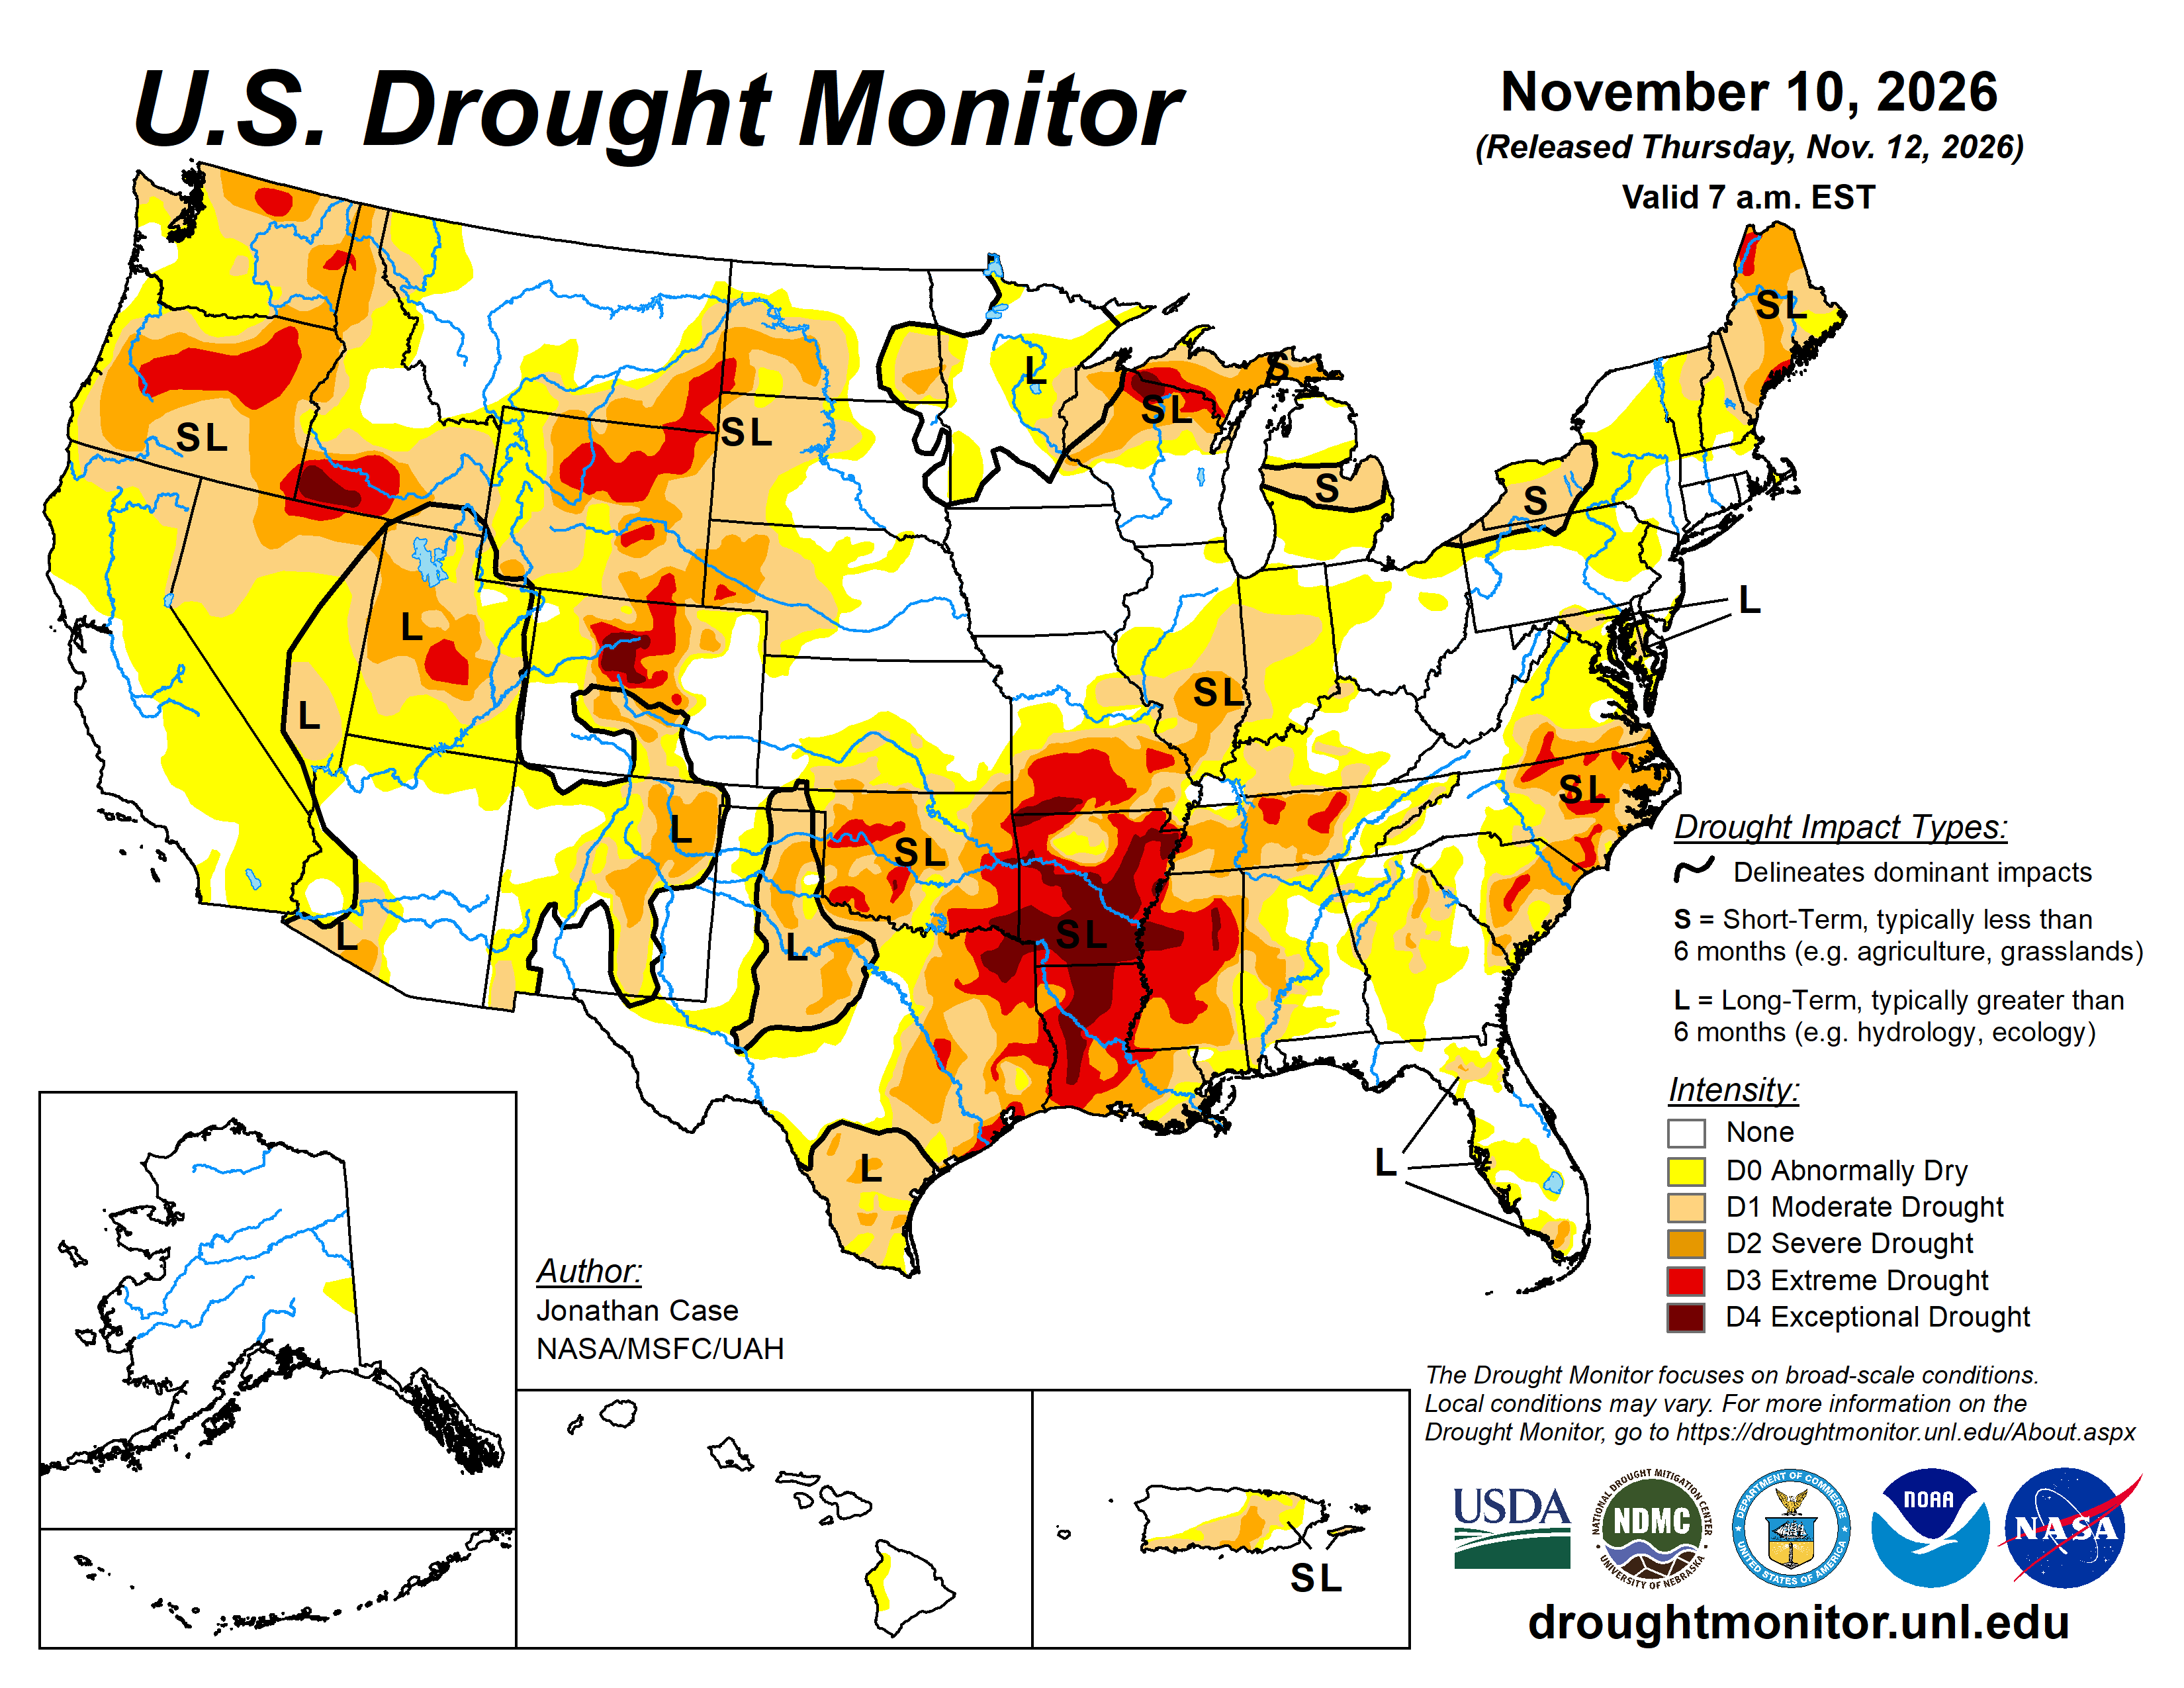
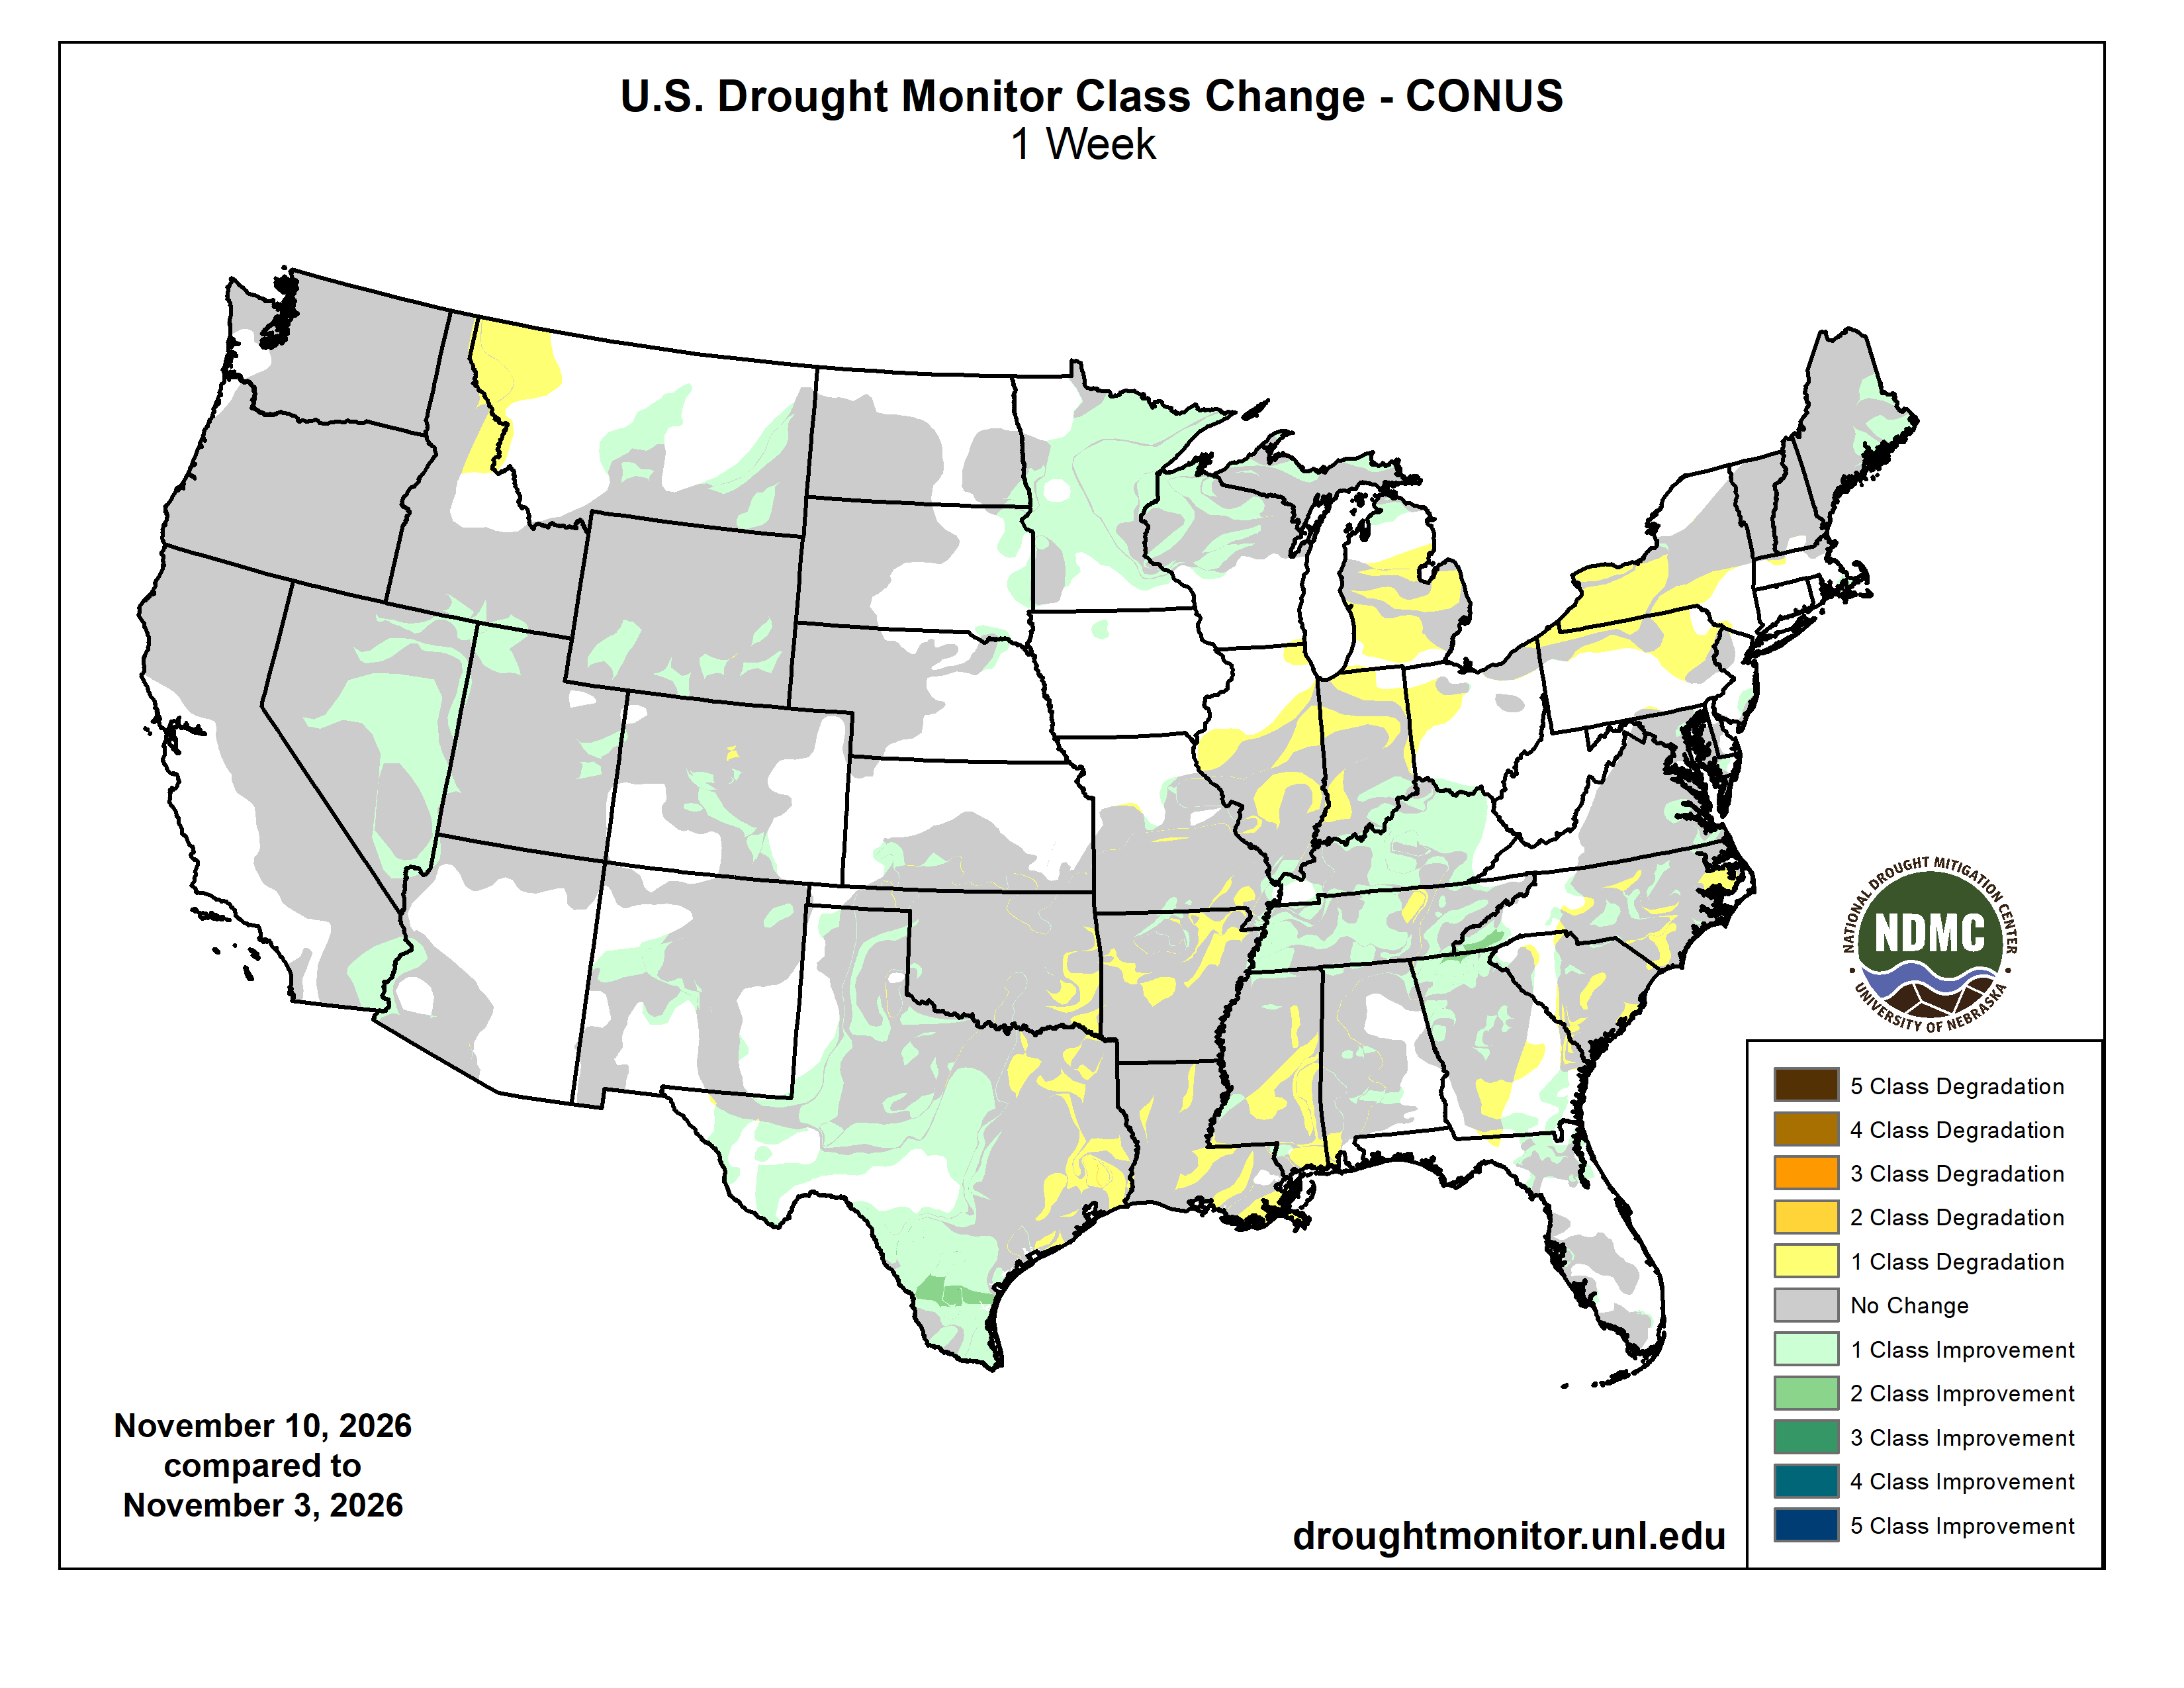
Here’s the US Drought Monitor Map from last week along with the one week U.S. change map.
Finally Western Water Assessment released their latest Intermountain West Briefing last week:
November 10, 2026 – CO, UT, WY
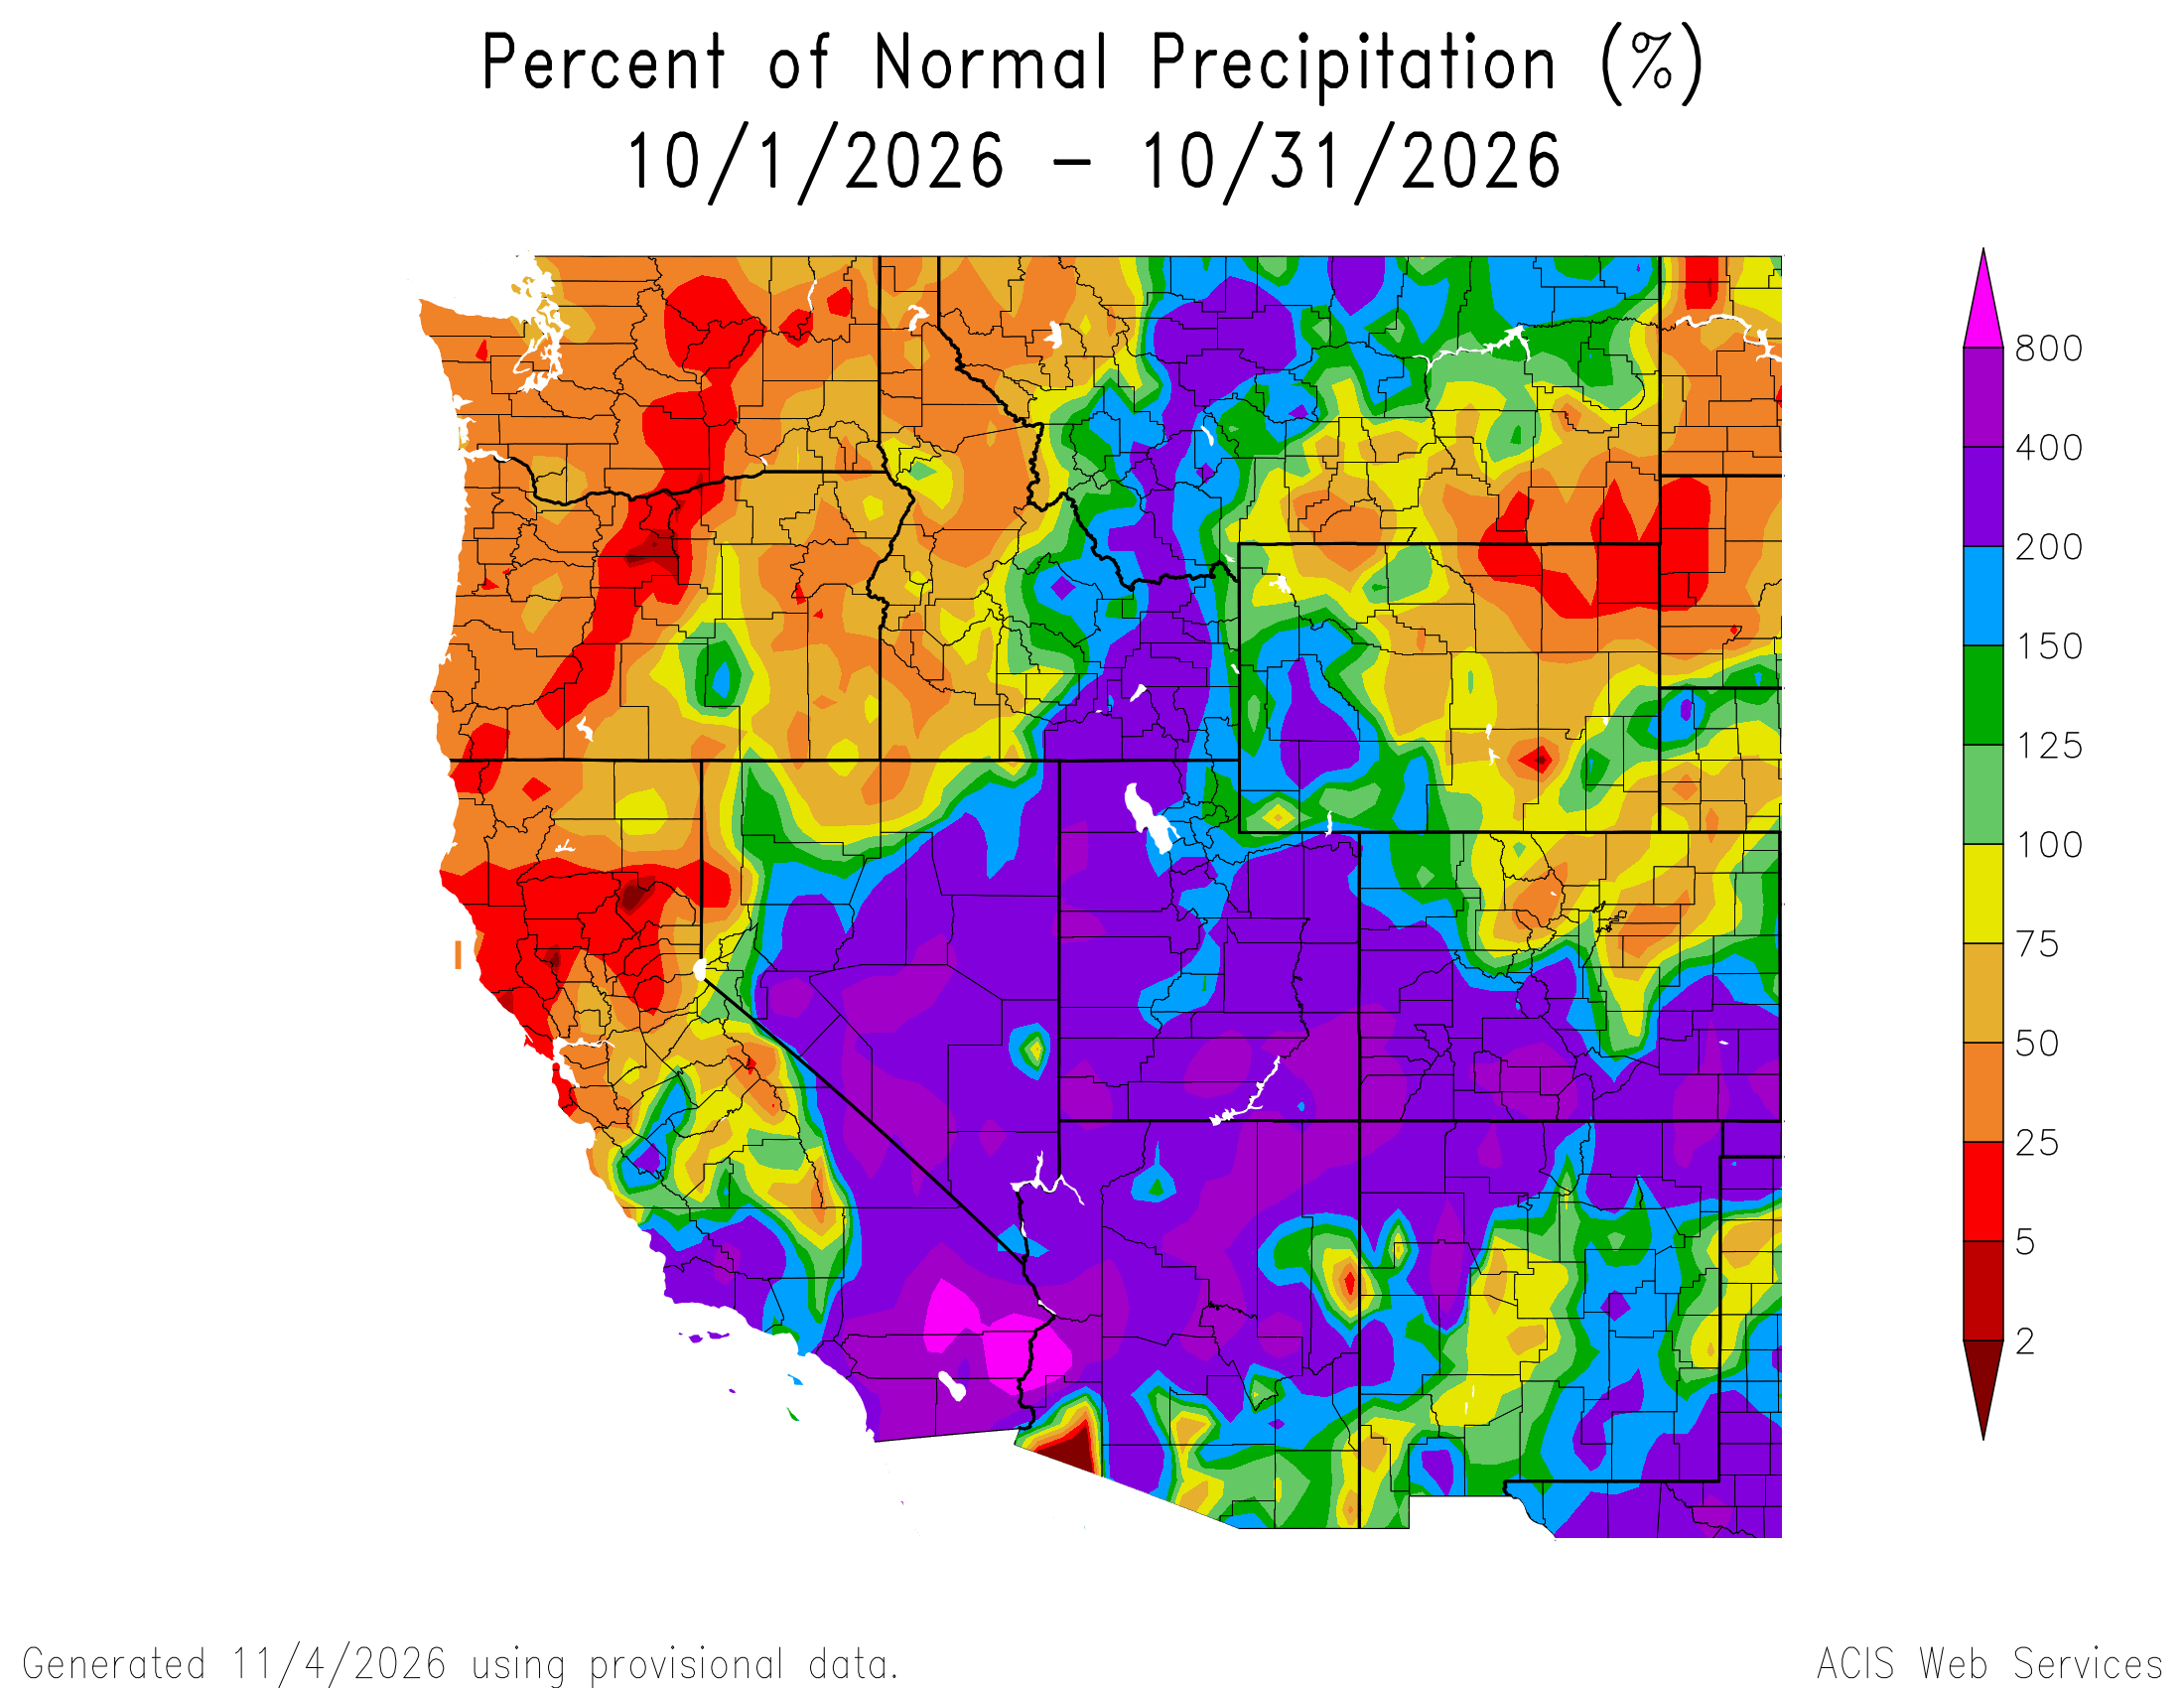
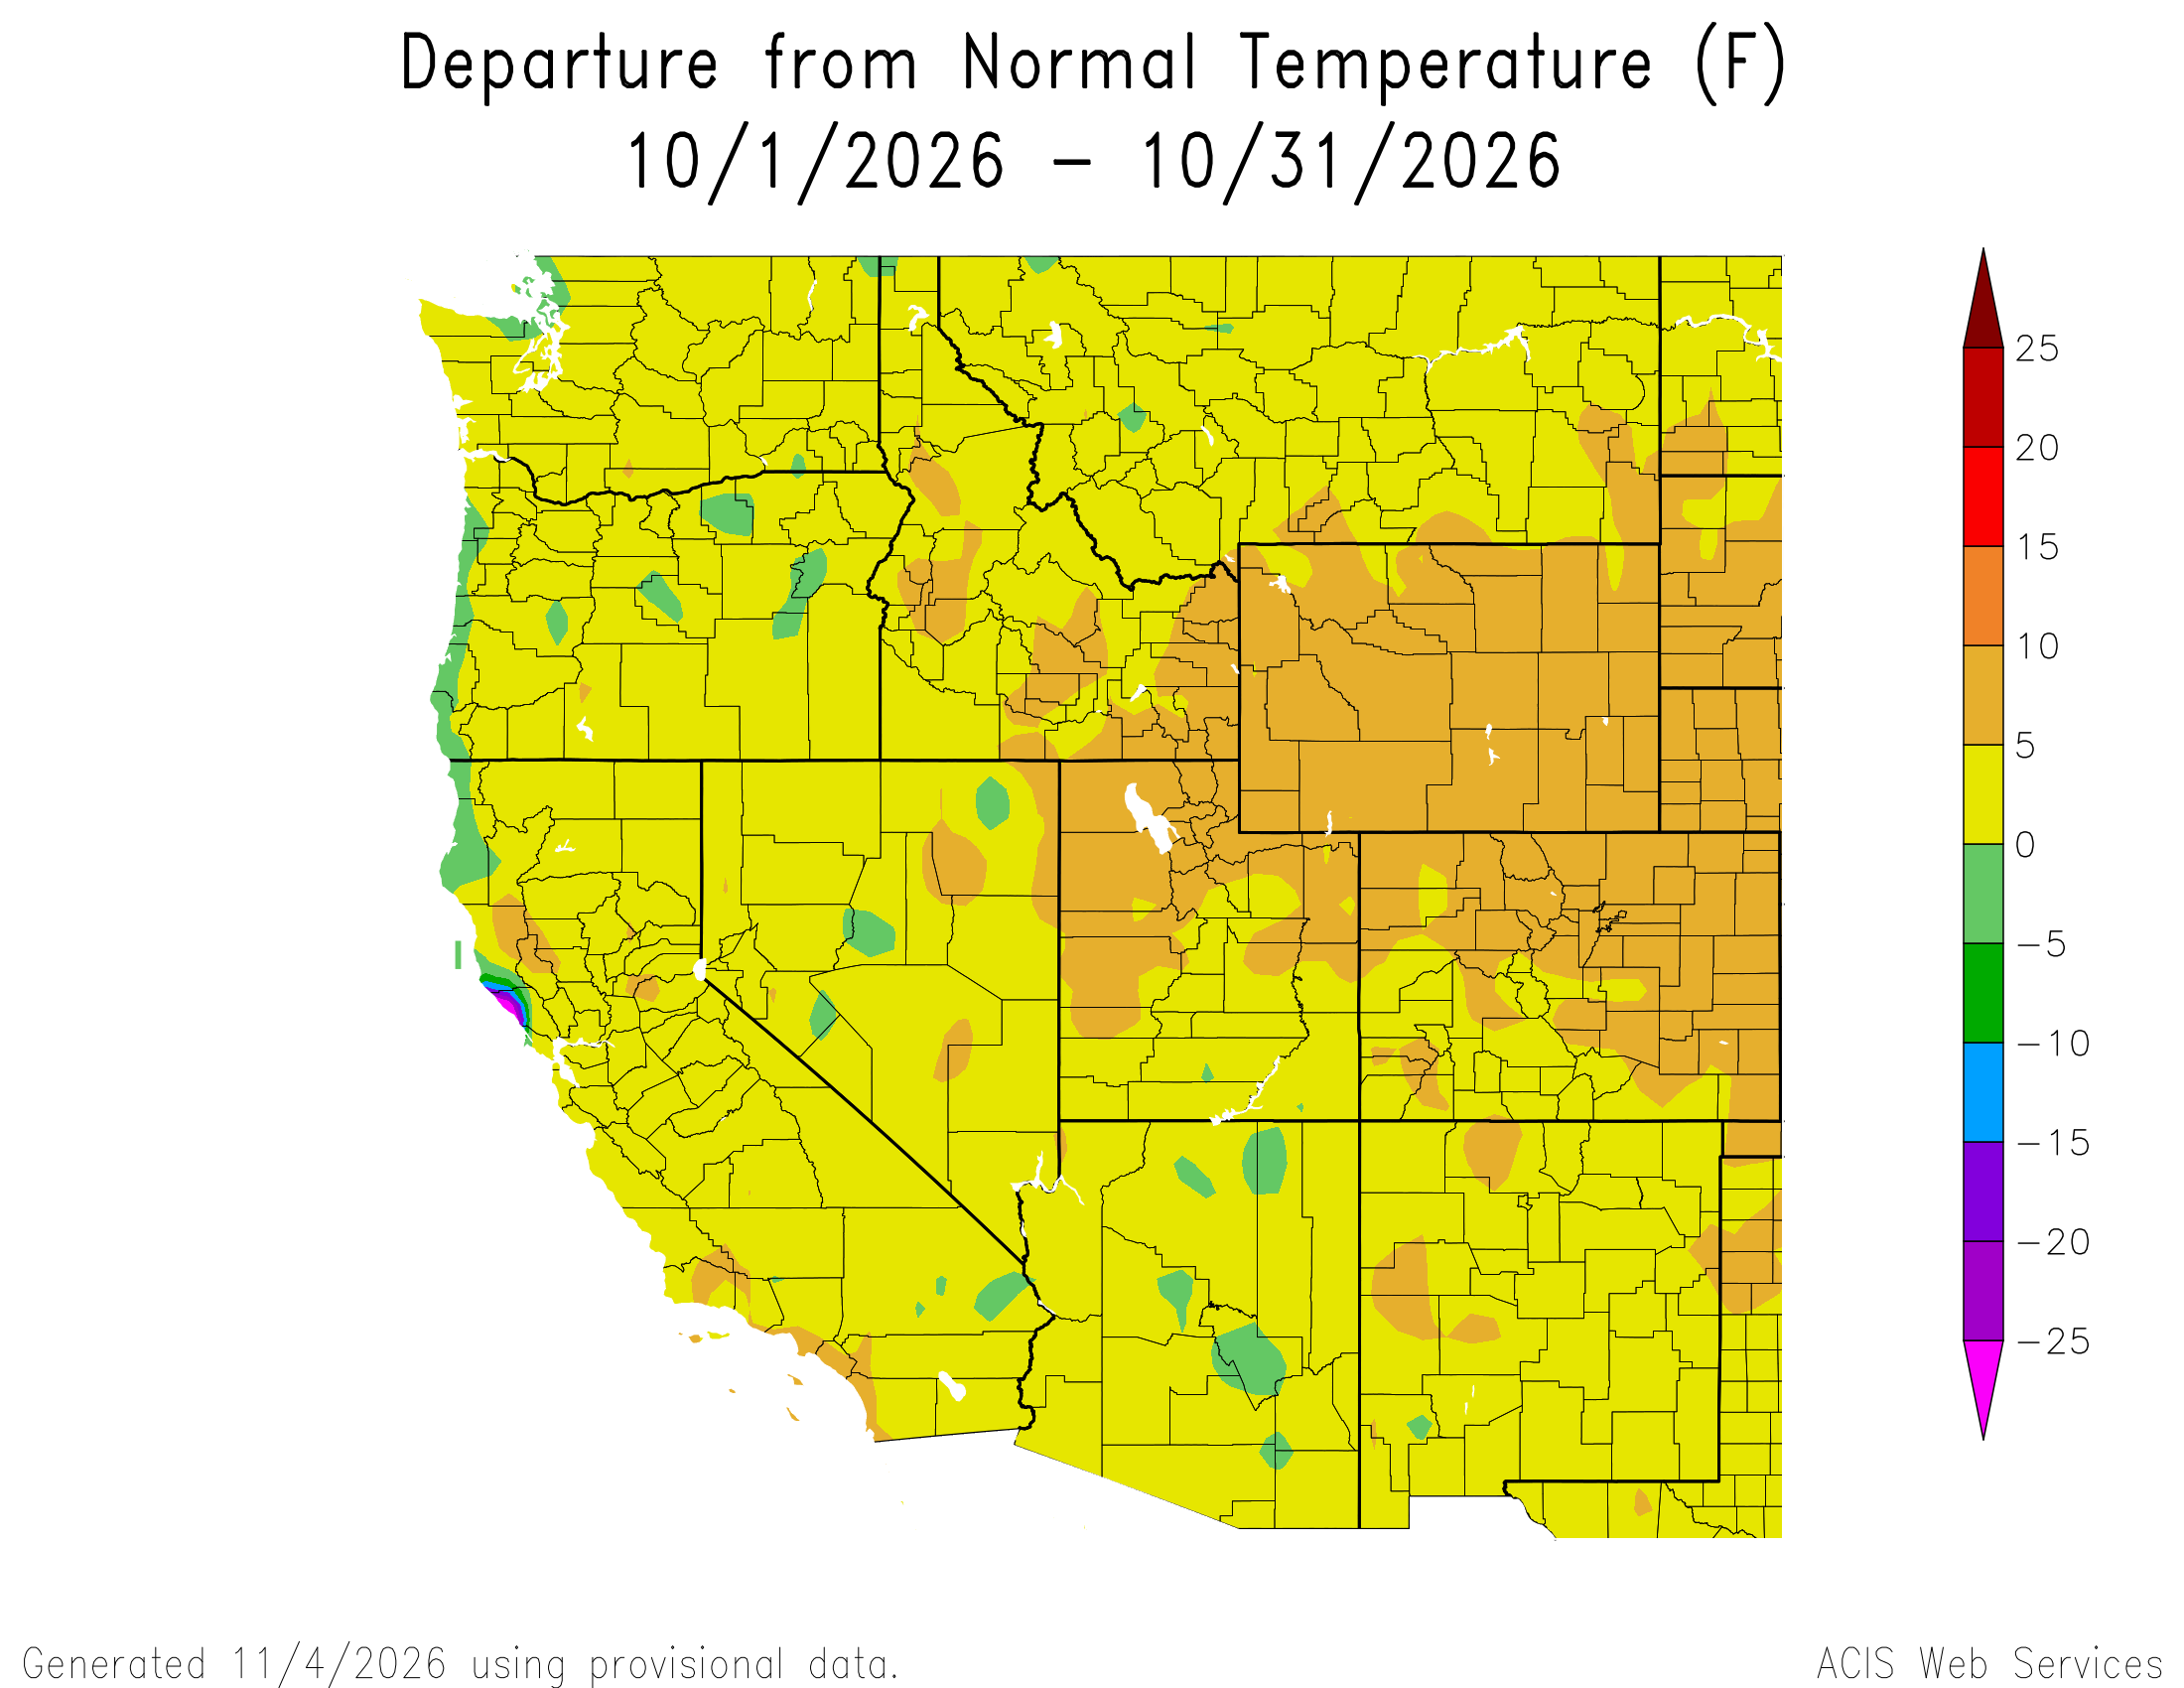
Above average precipitation continued during October, with large areas in southern Utah and southern Colorado receiving 400-800% of average precipitation. October temperatures were at least 5°F above average across the region, with up to 10°F above average temperatures in Wyoming, northern Utah, and northern and eastern Colorado. November 1 snow-water equivalent (SWE) was much above normal in much of Utah and southwestern Colorado, and much below normal in Wyoming and northern Colorado. Regional drought extent decreased from 90% coverage of Colorado, Utah, and Wyoming at the end of September to 60% coverage by November 3. Very strong El Niño conditions persist in the eastern Pacific Ocean, with weekly sea surface temperature anomalies running 3.4ºC above average in the Niño-3.4 index during the week of October 28. NOAA seasonal forecasts for precipitation suggest an increased probability of above average precipitation from November–January for southern and eastern Colorado, and below average precipitation for northwestern Wyoming.