High Line Canal #stormwater study 2022 Final Report

Highline Canal

Click the link to read the article on the High Line Canal website:

The final report from the Stormwater Study is available here. The draft report was presented to City Council at the Study Session on Sept. 20th for review, and the final report was accepted by City Council at their meeting on Dec. 14th, 2022. 

For a summary of the study, please visit the project’s StoryMap here

Background

In fall 2021, City Council  directed staff to seek further analysis of the High Line Canal Stormwater Master Plan (Master Plan) as it pertains directly to the three-mile segment of the Canal within the Village, as well as craft short and long-term strategies for capital improvements and annual maintenance of this segment of the High Line Canal. The Master Plan explores the analysis associated with utilizing the Canal for stormwater purposes but cannot be construed as acceptance or approval of the drainages analyzed or improvements recommended. The City desires to know what additional considerations are necessary to transition the Cityโ€™s segment of the irrigation Canal to a stormwater channel and how to address certain considerations to accomplish that goal. 

Stormwater Capital Improvement and Operations Analysis

Icon Engineering, Inc. has been hired to complete the study in 2022 for a total cost of $59,000. The analysis will include modeling of High Line Canal areas beyond what was completed in the Master Plan to ensure safety, constructability, and ease of maintenance. Additionally, the City will receive a detailed cost model verifying the costs outlined in the Master Plan for the construction and maintenance of: (1) the proposed improvements; and (2) the entire High Line Canal conveyance channel, including the ditch and bank vegetation, within the municipal boundaries, as the City will become responsible for these costs if the stormwater improvements are constructed. Further, the analysis will give the City guidance on possible phasing and timing plans for the capital projects, based on prioritization determined during the analysis process.

Governor Polis Signs First Bill of the Legislative Session to Support #Coloradoโ€™s Water Quality and Clean Drinking #Water Infrastructure

Click the link to read the release on Governor Polis’ website:

Bipartisan Bill to Support Water Projects

DENVER – Today, Governor Jared Polis signed into law administratively the bipartisan HJR23-1007 Water Projects Eligibility Lists sponsored by Representatives Karen McCormick and Marc Catlin and Senators Dylan Roberts and Cleave Simpson to support water projects across the state that design and construct safe drinking water, wastewater, and stormwater infrastructure projects. 

โ€œWe are here to serve the people of Colorado, and must continue working together to solve pressing problems and help improve the lives of Coloradans. I appreciate the legislature sending this bipartisan bill to my desk, sponsored by the vast majority of Coloradoโ€™s General Assembly with the goal of providing clean and safe water to the people of our state,โ€ said Governor Polis.  

In his State of the State address to the General Assembly in January, Governor Polis outlined his vision for Colorado at 150, including making sure Colorado has the water resources necessary for farms, communities, and industries to thrive. The Polis administration has dedicated significant resources toward protecting Coloradoโ€™s water resources and the Governorโ€™s budget proposal includes new, ongoing resources for climate action and preparedness for water quality, defending Coloradoโ€™s water rights.

Restoring the #ColoradoRiver Delta with a Diverse Environmental Team — Daughters for Earth #COriver #aridification

L to R: Alma Merendรณn, Rosa Gonzรกlez, Cristal Galindo, and Celedonia Alvarado leaders in native vegetation production restoration and monitoring activities at Laguna Grande site. Image credit Rabi Hernandez Sonoran Institute

Click the link to read the article on the Daughters for Earth website

The Colorado River has not connected to the sea for a generation, and its Delta is dying out. This once lush region of 3,000 square miles teeming with plant, bird, and marine life lived only in the memory of older community members.

Most had abandoned hope that nature would ever return. No water means no life. However, the inverse is also true.

Funding for this project will help the Sonoran Institute (SI) revive, enhance, and maintain 751 acres of this area and reconnect the Colorado River to the sea. By reintroducing water, landscapes, wildlife, and communities thrive together.

A women-led restoration team

Led by Edith Santiago, who has 22 years of experience in the restoration of wetlands, this project comprises a diverse team of biologists, ecologists, hydrologists, community planners, environmental educators, and economists. Women hold over 50% of these positions.

Monitoring and growing native species

Support will allow this team to monitor the water and surrounding wildlife and conduct restoration activities that include irrigation, weeding, fire prevention, vigilance, and signage to prevent vandalism.

It will also help grow native species at the SI nursery near the Delta. Producing vegetation closer to restoration activities prevents plant damage and reduces transportation time.

As the restored area has increased and water presence has been permanent in the last two years, beaver (Castor canadensis) sightings are more common. Beavers feed on cottonwoods (Populus sp.) at Laguna Grande restoration site. Image credit: Guadalupe Fonseca, Sonoran Institute

Local outreach and education

Environmental education and outreach activities are essential to inspire the local community to help restore and conserve the Colorado River Delta. SI will achieve this through an online course about wildlife and vegetation, guided visits to restored areas, talks, presentations, and workshops. Building a training and multiple-use site will serve as a gathering and educational spot for the community.

SI has already engaged people through the visitor center at Laguna Grande, guided tours, and โ€œFamily Saturdays.โ€ Through these programs, nearly 26,000 people have reconnected with the river.

The importance of centering on community

The recovery and stewardship of the Delta ultimately depend on the commitment of people who live in the region. Having local community groups, leaders, and government agencies participate in the restoration work, operate plant nurseries, manage restoration sites, and welcome guests is a significant part of this project.

With a flowing river and a steady stream of visitors, the conservation site will become the heart of an economy based on working with nature, and a living, learning laboratory for the one million residents of Mexicali.

A group of Environmental Laboratory Technician (high school) students at Laguna Grande restoration site. Learning about native vegetation, wildlife and connecting with the Colorado river. Image credit: Rabi Hernandez, Sonoran Institute

Long-term goals to protect more land and reach more people

By 2024, the projectโ€™s main objective is to enhance and maintain 751 acres. The long-term plan is to restore and protect 30,000 acres of habitat. Another prime goal is to connect the river and sea for an average of 146 days a year.

Through education and social media, it aims to reach more than 400,000 people who will get to know the endangered beaver and many of the 380 bird species in the Delta. It will continue implementing virtual and in-person activities with students from kindergarten through college, families, national and international media, and donors.

Collaborating governments mean successful conservation

As a leader in restoration, SI and its partners have been working in this region for over 20 years. Their work extends along the main channel of the Colorado River, from the US and Mexico border to the upper estuary of the Gulf of California, and includes a key tributary, the Rio Hardy.

Rio Hardy, Baja California. Photo credit: Zona Turรญstica

SIโ€™s work has been crucial to adopting agreements between the United States and Mexico that have become a global example of collaboration. The Minute 319 and 323 accords between the two governments support the complete restoration of the Colorado River Delta.

By advancing agreements governing the river, restoration can succeed in the Delta as people connect with their natural resources. SIโ€™s team is optimistic that bringing the river back to life will make the local communities flourish harmoniously as one with nature.

It snowed โ€“ is the #ColoradoRiver saved? — @AmericanRivers #COriver #aridification

2015 DEC 14: Paul Bruchez feeds calves and fly fishes on his ranch the Reeder Creek Ranch outside of Kremlin, CO. Photo courtesy of Joshua Duplechian

Click the link to read the article on the American Rivers website (Sinjin Eberle):

With the substantial amount of snow that has fallen across the Colorado River basin over the past couple of months, I have been asked many questions about the state of the drought, and whether all this precipitation will reverse the severe declines in both Lake Powell and Lake Mead. Will all this snow โ€œsaveโ€ the Colorado River basin from further declines and cutbacks? Can we all just go back to normal now and not worry about conservation so much?

Spoiler alert โ€“ Not likely.

Certainly, all this snow will help quench the basinโ€™s immediate thirst.  It may also serve to have much of the basin delay confronting what has been shaping up to be a real emergency, with real consequences for everyone who relies on the Colorado River โ€“ but not for long. If we experience another low snowpack year which has been predicted, the situation from the top of the basin to Mexico will be pretty dire โ€“ and if this recent snow funnel turns off, it still could be. But for now, it appears that, while the current snow conditions will certainly not save the day, they might help side-step having to immediately endure worst-case scenarios beginning as early as this spring, which hopefully can provide the states and Federal government some space to come together and bring the rest of the Colorado River community along in support of workable solutions for the basin by the end of the summer.

Through my role with American Rivers, I am honored to be one of the two Environmental Representatives on the GLEN CANYON DAM ADAPTIVE MANAGEMENT PROGRAM (GCD-AMP) TECHNICAL WORK GROUP (TWG) which is intimately involved with much of the science conducted in the Grand Canyon and Lake Powell. As part of that role, how Glen Canyon Dam operates and is managed is of central consideration, and the impacts of decisions around how water flows through the dam are of critical importance to the ecological, recreational, and cultural values of the Grand Canyon and the overall natural heritage it provides.

Last week, at a meeting in Phoenix, we got detailed readouts around the hydrologic conditions in the Upper Basin of the Colorado River (Colorado, Wyoming, Utah, and New Mexico make up the Upper Basin) and so far, the data looks positive for this current water year.

West snowpack basin-filled map February 23, 2023 via the NRCS.

All those purple and blue blobs are great news and something to cheer about. These numbers all play into how the Bureau of Reclamation (BOR), the Federal agency that oversees and manages the federal infrastructure for the Colorado River system, forecasts likely water supply scenarios in different areas of the basin. But for the time being, letโ€™s stick with Glen Canyon Dam and Lake Powell.

Most recent 24-month study projects that Lake Powell will stay above Minimum Power Pool according to current conditions. Graphic credit US Bureau of Reclamation

The chart above may look confusing but bear with me. The vertical axis is the elevation of the water stored behind Glen Canyon Dam in Lake Powell. The horizontal axis is time, looking ahead across the next two years. Modeling experts at BOR run dozens of simulations based on 30-year average hydrology, current snowpack conditions, soil moisture, projected meteorology, and water use estimates to identify potential probabilities around how much water may be coming through the system, including how much water may reasonably be expected to flow into Lake Powell in a given year. Then, understanding these โ€œinflowsโ€ projections in combination with other resource considerations, the BOR projects the volume and timing of water to be released out of Lake Powell, through the Grand Canyon, and into Lake Mead on an annual basis.

If you look carefully at the chart above, you will see three dotted lines undulating from left to right. Those three lines are the โ€œMinimum, Maximum, and Mostโ€ probable storage scenarios for Lake Powell based on different inflow and other inputs (Maximum being the top, a blue line which reflects where 90% of the scenarios will land at or below in storage elevation, meaning the maximum probable amount of water to be stored at Lake Powell for the relevant year; Minimum being the bottom, red line which reflects where 10% of the scenarios will land or fall below in storage elevation, meaning the minimum probable amount of water to be stored at Lake Powell for the relevant year; and, Most being the middle, green line, which reflects that 50% of the scenarios are likely to be at or below in Lake Powell storage elevations for the year.  Each of these projections is based on CURRENT conditions and is subject to change as we learn more about actual, as opposed to modeled, conditions in the basin.

As you can see, the line trends down from now until about mid-April 2023, then makes a sharp curve upwards. This represents spring runoff โ€“ it is current, frozen snow (very low runoff in the rivers) transitioning into spring (lots of snowpack melting and the rivers flowing vigorously.) Then as we get into summer and fall, things more or less flatten out as the snowpack depletes and levels in Lake Powell stabilize.

The most important line on the chart above (at least for this blog) is the bottom line (Minimum Probable,) and, in particular, the April 2024 timeframe, the lowest point on the chart. Below that lowest point is a grey dashed line marked โ€œMinimum Power Pool โ€“ 3,490ft.โ€ This represents the elevation where Lake Powell can no longer produce any hydropower electricity because the water has fallen too low to turn the turbines.

As recently as last December, there was a real probability that Lake Powell could fall below Minimum Power Pool (the elevation where hydropower could no longer be generated) as early as December 2023. Graphic credit US Bureau of Reclamation

Just a couple of months ago, it looked like Lake Powell may fall below that Minimum Power Pool elevation sometime around the April 2024 timeframe, and if this winterโ€™s snowpack was dismal, the threat to the minimum power pool could be much higher much sooner. Last fall, BOR Commissioner Touton instructed that the Basin must come up with an additional 2- and 4-million-acre feet of Colorado River water to avoid critical threats to infrastructure and the system between now and the time new long-term operating criteria can be finalized (est. 2026). This directive, along with several other factors, also inspired BOR to consider partially modifying the current operating criteria through a process called a Supplemental Environmental Impact Statement (SEIS).

A SEIS is, in essence, a comprehensive study around some options that could guide operations at the Glen Canyon Dam and other facilities to forestall threats to the health, safety, and continuing functionality of the system until more comprehensive management plans can be assessed and considered.  Short-term adjustments to system operations will likely consider, among other things, the release of less water (and potentially MUCH less water) from Lake Powell in the current and next years with the assumption that storage at Lake Powell could continue to decline. That study is in process, but we all need to continue to press the urgency of this situation and find every way possible to reduce the consumption of Colorado River water, from every user across the entire basin. Just because the snowpack looks good today, doesnโ€™t reduce the immediate need to find a way to live within the means that the river can provide starting now.

Now, some caveats to all this optimism. First, it could stop snowing, like it did last year, and this trend of piles of happy snow could go away. Second, the basin overall is in a serious water deficit across nearly all reservoirs in the Upper Basin.  BOR has had to release a lot of water over the past two years under emergency and drought contingency actions, including the implementation of a Drought Response Operations Agreement to try to keep Lake Powell from falling even farther and even faster. Lastly, runoff matters, and the combination of how soon spring arrives and how warm it gets, combined with how moist the soil is as that snow begins to melt will dictate how much water makes its journey down the river. With the solid monsoon seasons over the past two summers, the soil moisture is much better than it was a couple of years ago.  But dry soils absorb water as the snow melts, and if the soils are too dry, runoff water never makes it to the rivers in the first place. In fact, many believe that relying on the 30-year average hydrology conditions in the basin as part of the modeling foundation leads to potentially overly optimistic results in storage conditions. 

So, there is cause for optimism, and cause for skepticism, but at least at this point in early 2023, things are looking as good as they likely could to provide a little room to keep working toward collaborative solutions than in years past. Keep those snow dances coming!

Barefoot Dance In The Snow New York, New York March 8, 1916. Girls of the Marion Morgan School of Dance in Los Angeles perform barefoot in the snow in Central Park. Underwood Archives by Underwood Archives

#Drought news February 23, 2023: Weekly precipitation totals were half an inch to over an inch in parts of #Wyoming and #Colorado, abnormal dryness and severe drought were trimmed in southern Colorado

Click on a thumbnail graphic to view a gallery of drought data from the US Drought Monitor website. Here’s an excerpt:

Click the link to go to the US Drought Monitor website. Here’s an excerpt:

This Week’s Drought Summary

An upper-level ridge over the northeastern North Pacific Ocean deflected Pacific storm systems away from the West Coast of the contiguous U.S. (CONUS) during this U.S. Drought Monitor (USDM) week (February 15-21). This resulted in a generally drier-than-normal week over much of the West. An upper-level trough developed over the western CONUS downstream from the ridge, and the trough was responsible for a cooler-than-normal week over the West. Strong high pressure over the Gulf of Mexico extended into a ridge across the East Coast. A southerly flow between the trough and eastern ridge spread warm, moist air from the Gulf of Mexico across the eastern CONUS and directed weather systems northeastward from the southern Plains to Great Lakes. Two weather systems early in the week generated above-normal precipitation across parts of the central to eastern CONUS. As the week ended, weather systems moved across the northern tier states, bringing areas of snow. The week was wetter than normal across parts of the northern Rockies, from the Four Corners states to western Great Lakes, and from the central Gulf Coast states to Ohio Valley and Mid-Atlantic states. It was a drier-than-normal week across much of the West, southern Plains, coastal Southeast, and southern Great Lakes to New England, and parts of the northern to central Plains. Drought or abnormal dryness expanded where it continued dry in parts of the Pacific Northwest, southern Plains, and Florida. Drought or abnormal dryness contracted or reduced in intensity where it was wet over parts of the Four Corners area, southern and central Plains to Upper Mississippi Valley, and the Big Island in Hawaii…

High Plains

A storm system tracked across southern parts of the High Plains region early in the week, with another late in the week tracking across northern Wyoming. Weekly precipitation totals were half an inch to over an inch in parts of Wyoming, Colorado, northern and eastern Kansas, southern and eastern Nebraska, and southeast South Dakota. The rest of the region received little to no precipitation. Moderate to exceptional drought was trimmed in a few areas of northwestern and eastern Kansas, and adjacent parts of Nebraska, while abnormal dryness and severe drought were trimmed in southern Colorado. No change was made to the drought areas in the rest of the region…

Colorado Drought Monitor one week change map ending February 21, 2023.

West

Half an inch of precipitation fell over a few areas in the Four Corners states and in western Oregon, while 2 inches or more of precipitation occurred over parts of the Washington Cascades and northern Rockies. But for the most part, little to no precipitation fell across large parts of the West region. Abnormal dryness and moderate to severe drought were trimmed in northwest New Mexico where this week was wet and moist conditions were evident in soil moisture, snowpack, and Standardized Precipitation Index (SPI) indicators. But low streamflow, snowpack, soil moisture, and SPI values prompted expansion of abnormal dryness and moderate drought along coastal Oregon and southwest Washington, as well as in the Idaho panhandle. While many reservoirs in California have recovered from the recent atmospheric river events that have struck that state, reservoirs in Oregon continue at drastically low levels and some reservoirs in Utah remain at low levels. As of February 21, 2023, the water level in Lake Powell was 3521.53 feet above sea level, which is the lowest level recorded since the lake was filled in the 1960s. As noted by the media, Lake Powell is a man-made reservoir that sits along the Colorado River on the Arizona-Utah border. It generates electricity for about 4.5 million people and is a key part of the Colorado River Basin system, which supplies water to more than 40 million people. Further north, an extension agent in Blaine County, Montana, reported the drought is causing reduced water for irrigation, later emergence of spring grasses, and grazing must be supplemented and water hauled for livestock…

South

Two inches or more of precipitation fell across eastern portions of the South region, specifically parts of Mississippi and much of Tennessee. Half an inch or more occurred from there to eastern Oklahoma and northeast Texas. For the rest of Oklahoma and Texas, the week continued a dry pattern. Abnormal dryness and moderate to extreme drought contracted in eastern Oklahoma, due to wet conditions this week and previous weeks and improved soil moisture and streamflow conditions, and abnormal dryness contracted in northeast Texas. But extreme to exceptional drought expanded in western Oklahoma and the Texas panhandle, while abnormal dryness and moderate to severe drought expanded in parts of southern Texas along the coast and along the Rio Grande River where streamflow and soil moisture conditions deteriorated and precipitation deficits continued to grow. According to media reports, 80-mph winds created a dust storm in the Oklahoma panhandle that caused a multiple car pileup, killing a driver…

Looking Ahead

A strong Pacific weather system moved across the West on February 22, with a low pressure and frontal system spreading rain and snow from the Plains to Mississippi Valley and across northern states. A series of weather systems will follow during February 23-28, spreading an inch or more of precipitation from Oklahoma to the Great Lakes, from the Tennessee to Ohio Valleys, and across much of the Northeast, as well as along the West Coast and into the interior West. Some precipitation totals will exceed 2 inches in the Upper Mississippi Valley and western Great Lakes, and exceed 4 inches along coastal Washington and California and into the Sierra Nevada range. The Gulf of Mexico Coast, western parts of the Great Plains, and parts of the Mid-Atlantic Coast will see little to no precipitation. High pressure over the Gulf of Mexico will keep temperatures warmer than normal from the southern Plains to Ohio Valley and Gulf Coast to Mid-Atlantic Coast, while temperatures will be cooler than normal across the Far West to northern Plains. For February 28-March 8, the outlook favors colder-than-normal weather across the West and Alaska, with warmer-than-normal weather from the southern Plains to Atlantic Coast and Great Lakes. Above-normal precipitation is likely across Alaska, the western CONUS, and much of the CONUS east of the Rockies except along the Gulf Coast where below-normal precipitation is favored.

US Drought Monitor one week change map ending February 21, 2023.

Romancing the River: Caliphobia and the #ColoradoRiver — Sibley’s Rivers #COriver #aridification

All American Canal Construction circa. 1938 via the Imperial Irrigation District. The All-American Canal in far southern California under construction, to carry water to the Imperial Valley – so called because it lies entirely with the United States, unlike an earlier canal that was mostly in Mexico.

โ€˜Caliphobiaโ€™ is a cultural germ that infects many Americans everywhere. โ€˜Caliphobiaโ€™ is fear and loathing of the State of California, the state that always seems to be ahead of everyone else in everything, bringing us everything from new entertainments and toys, to new laws on cultural frontiers the rest of us know we ought to be brave enough to embrace ourselves. Iโ€™m thinking of things like auto emission standards where the size of the California market brought the automobile industry to heel, with the nation eventually falling in line too. We hate them when theyโ€™re right.

Californians also occasionally take a big step backward in a deliberate way, and the nation eventually falls in step there too โ€“ remember โ€˜Proposition 13,โ€™ Californiaโ€™s 1978 property tax revolution to protect existing homeowners at the expense of community health, a battle which ultimately generated the national โ€˜Tea Partyโ€™ and the Trumpian โ€˜Iโ€™ve got mine Jackโ€™ culture. We hate them when theyโ€™re successfully wrong.

California always seems to be first with the worst as well as the best. For this they are generally disliked, even hated, in a subrational way that is often tinged with envy โ€“ Caliphobia. This leads to things like bumper stickers saying โ€˜Donโ€™t Californicate us!โ€™ and the perception of Californians as emigrants from the gridlock of their success, spreading through the West with fistfuls of money to drive up our housing prices.

Californiaโ€™s impact nationally has to do mostly with its size and population. Close to one of every eight Americans lives in California โ€“ approaching 40 million. One-eighth of our Congresspeople are part of the 53-person California delegation.

But where California โ€“ and Caliphobia โ€“ has had its largest and most ingrained impact may be in the Colorado River Region โ€“ the seven states through or between which the Colorado River meanders. California has close to twice as many people and Congressmen as the other six states combined.

We see Caliphobia rearing its head today on the Colorado, as six of the seven Basin states have put forward a plan for major cuts in water use in the Basin โ€“ cuts the Interior Department says are essential if their system of storage and distribution structures are going to remain functional. But California refuses to sign onto that plan, in which they would take a big hit; instead, they have put forward their own plan in which they would take a moderate hit, but only after Arizona and Nevada have taken big hits, demanding that their large senior priority rights be honored. This is engendering media headlines like โ€˜California Isnโ€™t Playing Nice on the Colorado Riverโ€™ or โ€˜Unlike California, Vegas isnโ€™t gambling with its future by squandering water.โ€™

Upper Basin States vs. Lower Basin circa 1925 via CSU Water Resources Archives

Caliphobia is nothing new along the Colorado River, however. It goes back to the early 20th century. All seven states in the Region โ€“ Arizona, California, Colorado, Nevada, New Mexico, Utah, and Wyoming โ€“ had adopted the first come, first served appropriation doctrine for the distribution of the use of water. Appropriation law โ€“ free water for free land, permanently if you get there early โ€“ became a powerful growth engine that contributed to growth in all seven states in the early 20thcentury, but Californiaโ€™s population quintupled in that time.

This gaveย the six โ€˜slowerโ€™ states reason to fear that, in an unchecked seven-state horse race to appropriate use of the Colorado Riverโ€™s water, California had the pole position and a fast start, and might put most of the riverโ€™s water to use while they were still getting started. The fact that the developers of the Salton Sink, aka the Imperial Valley, down at the end of the river, had a 1901 appropriation filing for more than two million acre-feet of river water lent substance to their fear. Caliphobia spread along the river.

Herbert Hoover presides over the signing of the Colorado River Compact in November 1922. Members of the Colorado River Commission stood together at the signing of the Colorado River Compact on November 24, 1922. The signing took place at the Palace of the Governors in Santa Fe, New Mexico, with Secretary of Commerce Herbert Hoover presiding (seated). (Courtesy U.S. Department of Interior, Bureau of Reclamation)

Their Caliphobia led to the convening, in 1922, of the Colorado River Compact commission, with the original intention to make an equitable seven-way division of the use of the river that would override the appropriation doctrine at the interstate level, assuring each state of a share of the river to develop in its own good time. But a seven-way split proved impossible to attain; they lacked necessary information about how much water was even in the river, and the only information they had about their own futures came from their own overheated imaginations. So in something close to desperation, with time running out, they came up with a big sloppy broad stroke: dividing the river in two, an Upper Basin with the four states above the unsettled canyon region (Colorado, New Mexico, Utah, and Wyoming), and a Lower Basin with the three states below the canyons (Arizona, California, and Nevada). Basically, each Basin would get the consumptive use of 7.5 million acre-feet (maf), to further divide among themselves as their futures unfolded.

It is hard to see the Compact as a real success โ€“ certainly not an achievement deserving the reverence most water mavens hold it in today. It gave the four Upper Basin states relief from having to compete for water with California, but it left Arizona and Nevada in the cage with California, and Arizona refused to ratify the Compact as a result. California officials said their state would not ratify the Compact until there was solid assurance that the storage dam would be built. All the Compact really achieved was a minimum show of agreement by six out of the seven states, which Congress found acceptable enough, and proceeded with the Boulder Canyon Project Act that finally passed in 1929.

The Act itself relieved the Lower Basin states of the stress of dividing up their 7.5 maf โ€“ difficult given Arizonaโ€™s bad case of Caliphobia โ€“ by doing the division for them: 4.4 maf for California, 2.8 maf for Arizona, and 300,000 af for Nevada. Why so little for Nevada? All the action in Nevada then was in the western part of the state, in the relatively well-watered mining and ranching area just east of the Sierra Nevada Mountains, four hundred miles from the Colorado River. The only town in southeastern Nevada was Las Vegas, a little flag-stop collection of ranchers and prospectors.

Caliphobia was enough of a presence in Congress so that, before the representatives would vote on the Boulder Canyon Project Act, California was required to pass a state law that the state would limit its use of Colorado River water to the 4.4 maf specified in the Act. California passed that law docilely enough in 1929; the Act contained not just the big dam to control the river, but the weir dam and All-American Canal for getting water to their Imperial Valley, so they had a lot to gain by complying.

But then, once the Act was passed and construction had begun, the seven largest California users got together in 1931 to divvy up their 4.4 maf โ€“ and an additional 962,000 acre-feet that they said the Upper Basin wouldnโ€™t be using for decades, so why shouldnโ€™t they use it in the meantime?

They were, in other words, going to use the Upper Basinโ€™s unused share of the river to grow on, in hopes that there would prove to still be excess undivided water in the Basin when the Upper Basin needed its water โ€“ or that the engineers would have figured out how to bring new water in from some other river with water to spare. Early Anthropocene thinking: something would come along to keep them from being limited to their 4.4 maf. The intrastate Seven-party Agreement became part of the โ€˜Law of the River,โ€™ along with the 1929 California Limitation Law.

The Metropolitan Water District, created to serve the Los Angeles-San Diego metropolitan area with Colorado River water, bet on the permanence of that surplus water in a big way: they built the 250-mile Colorado River Aqueduct to carry twice their share of the 4.4 legal allotment โ€“ a concrete conviction that they would not be limited.

The Bureau went along with this, given Californiaโ€™s assurance that it would only use โ€˜surplus waterโ€™ so long as it existed; it was consistent with the Bureauโ€™s optimistic outlook for the future of the riverโ€™s flow โ€“ even though in 1931, the riverโ€™s flow dropped to half of the allotted 15 maf, the beginning of a droughty decade. The myth of a surplus flow, above and beyond the Compact allotments, was born, and would persist on paper too โ€“ well, to the present: it has been the increasingly fictitious surplus that supposedly โ€˜paidโ€™ the 1.5 maf of evaporation and other system losses on the lower river.

The surplus was also supposed to take care of most of the Mexican allotment too, once that was negotiated in 1944. Anticipating an eventual allotment to Mexico, the Compact had said that โ€˜such waters shall be supplied first from the waters which are surplus over and above the aggregateโ€™ allotted to the states, and โ€˜if such surplus shall prove insufficient for this purpose, then, the burden of such deficiency shall be equally borneโ€™ by the two basins. More about that in a moment.

Caliphobia in the Upper Basin states increased as it became increasingly obvious after the 1930s drought that there was probably never going to be enough water in the river consistently for them to get a full 7.5 maf share. Yet the Compact committed them to โ€˜not cause the flow at Lee Ferry (the division point) to be depletedโ€™ below 75 maf in any 10-year period. So even though there was not enough for their full allotment, they had to let the Lower Basinโ€™s full allotment go downriver, or else โ€“ well, the Compact said nothing about what would or should happen if the flow at Lee Ferry fell below the Compact minimum, but that only enabled the Caliphobic imagination to run wild on what California would do to Upper Basin users in such an instance.

September 21, 1923, 9:00 a.m. — Colorado River at Lees Ferry. From right bank on line with Klohr’s house and gage house. Old “Dugway” or inclined gage shows to left of gage house. Gage height 11.05′, discharge 27,000 cfs. Lens 16, time =1/25, camera supported. Photo by G.C. Stevens of the USGS. Source: 1921-1937 Surface Water Records File, Colorado R. @ Lees Ferry, Laguna Niguel Federal Records Center, Accession No. 57-78-0006, Box 2 of 2 , Location No. MB053635.

That clause could have been interpreted as a mere caution to make sure the Upper Basin users themselves were not responsible for a seriously diminished flow of the erratic river past Lee Ferry. But it could also be interpreted as a delivery commitment even if the diminished flows were caused by something other than human uses, like a two decade drought โ€“ which would already have seriously impacted the Upper Basin. Would the Lower Basin โ€“ California โ€“ add insult to injury by placing a call on them to further diminish their own uses to meet the 7.5 maf โ€˜obligationโ€™? Letting the Lower Basin escape sharing any of the pain from the erratic river?

I find no evidence that California and Arizona ever officially threatenedthat, but the Caliphobic imagination believed it would happen, so the 1948 Upper Colorado River Compact in a sense codified it as a delivery obligation no matter what, and even included punishment in a โ€˜callโ€™ situation, for Upper Basin states who might have had gone above their percentage of the riverโ€™s highly variable flows.

Why did the Upper Basin not take advantage instead of the Compactโ€™s Article VI invitation, โ€˜should any claim or controversy arise between any two or more of the signatory States,โ€™ to work out a more equitable modification to the Compact? Caliphobia: fear that California was so big and powerful that it would just roll right over the four states. The six Davids were basically too timid to take on their Goliath.

Lake Powell, a key reservoir on the Colorado River, has seen water levels drop precipitously as a result of two decades of drought. (Source: The Water Desk and Lighthawk Conservation Flying)

Another insult was added to the cumulative inequity to the Upper Basin in 1970 when, with Powell Reservoir filling behind Glen Canyon Dam, โ€˜Operating Criteria for Colorado System Reservoirsโ€™ were developed that set a desired minimum release from Powell for the Lower Basin, not the 7.5 maf Compact allotment, but 8.23 maf, the Compact allotment plus half of the Mexican obligation, to be shared among the four states. But was the Lower Basin subtracting their half of the Mexican obligation from their allotments? No, they were still relying on โ€˜surplusโ€™ flows, even though with ever increasing Upper Basin use, and the Central Arizona Project under construction, that surplus was steadily diminishing.

It wasnโ€™t until 2003 that the Interior Department โ€“ perhaps also a little fearful of California โ€“ cleared its throat and told California that it was time to give up the use of a no longer existing surplus. To everyoneโ€™s surprise, California agreed that, yes, it probably was time, and the terms of the โ€˜California Quantification Settlement Agreementโ€™ were worked out, and California is now back to 4.4 maf, sometimes even a little less.

Does this mean that the basic mythic story of the past century is no longer Goliath and the six Caliphobic Davids, but is more Gulliver getting tied down by the Caliphobic Lilliputians? How the current situation among the seven states shakes out will tell us more on that.

On the one hand, there are probably thousands of farmers on spreads of all sizes throughout the Basin quietly hoping that Californiaโ€™s stand for the primacy of appropriation law succeeds. The future of that body of law may hang in the balance. Too many people are asking questions like, how can we resolve anything with an appropriation law when everything is already appropriated? The farmers are probably happy to have one of the really big dogs making their case.

On the other hand, the six-state plan is not really an appropriation issue; it is primarily an effort to clean up an error left standing too long: the Lower Basin has no surplus left in the water bank to cover its system losses โ€“ or its Mexican obligation, for that matter. (Why has that not been mentioned yet?) The resulting โ€˜structural deficitโ€™ is why Mead Reservoir outflow is exceeding available inflow, and the logical thing to do is the โ€˜Nevada solutionโ€™ of simply parceling out that deficit in some equitable way among the three states, reducing their allotments accordingly. There is not really a priority issue involved in the six-state plan.

However it all shakes out in the next several months, we might hope that theย irrationalย aspects of Caliphobia might phase out, and no question about equity in the Basin be left unasked out of fear. There is not enough love for California anywhere, even on the national level, for it to get away with throwing its weight around.

#Colorado Establishes Urban Landscape #Water #Conservation Task Force — Colorado Department of Natural Resources

A Garden In A Box kit planted in southeast Denverโ€™s Hampden neighborhood. Photo credit: Denver Water

Click the link to read the release on the Colorado Department of Natural Resources website (Chris Arend):

The Colorado Department of Natural Resources and the Colorado Water Conservation Board (CWCB)  announced the creation and appointment of members to a water conservation focused Urban Landscape Conservation Task Force. Over the next year, the Task Force will work to identify practical ways to advance outdoor water conservation through state policy and local initiatives, to meet the pressing challenges of urban water conservation in Colorado.

The Task Force arose out of the Governorโ€™s initiatives announced during his 2023 State of the State highlighting the need to prioritize the intersections of climate change, water and housing. The Task Force is also informed by the newly finalized Colorado Water Plan calls for โ€œTransformative Landscape Changeโ€โ€”understanding the need to start building the landscapes of tomorrow, today and more closely aligning land use plans, water use, and water conservation.

โ€œRather than just pointing to other statesโ€™ methods, the Urban Landscape Conservation Task Force will strive to find solutions that work in our stateโ€™s unique environment,โ€ said Dan Gibbs, Executive Director of the Colorado Department of Natural Resources. โ€œThe Task Force will focus on actionable recommendations like setting standards for turf-alternative โ€˜Colorado Scaping,โ€™ gallons-per-square-foot water budgets, as well as evaluating land use development, water affordability, and much more.โ€ 

Sustained outdoor water savings are often difficult to realize. These goals require water providers and other groups working together in ways that extend beyond turf removal and work to advance landscape transformation in ways that provide lasting water savings.

โ€œThereโ€™s not one single solution to urban water conservation success in Colorado,โ€ said Becky Mitchell, CWCB Director. โ€œIt will require a cumulative effort, everyone doing a little bitโ€”so Iโ€™m happy to have such a robust team of experts on this Task Force including water providers, urban planning experts, land use experts, developers and more, from all across the state.โ€ 

The 21-member task force is now set, consisting of 8 water utilities, 2 water conservation districts, 2 environmental non-governmental organization representatives, and several single seats. Additional Task Force consultation may also include coordination with specialists like: affordable housing professionals, water rate experts, arborists, transportation specialists or other groups as determined by the Task Force. The team will aim to meet 4 times over the next year, wrapping up in January 2024.

Members of the Task Force include:

SEATNAMEAFFILIATION
1.Water Provider (Front Range)Greg FisherDenver Water
2.Water Provider (Front Range)Catherine MoravecColorado Springs Utilities
3.Water Provider (Front Range)Tim YorkAurora Water
4.Water Provider (Front Range)Rick SchultzCastle Rock
5.Water Provider (Front Range)Mariel MillerFort Collins
6.Water Provider (Front Range)Drew BeckwithCity of Westminster
7.Water Provider (West Slope)Andrea LopezUte Water – Grand Junction 
8.Water Provider (West Slope)Jarrod BiggsDurango Water
9. Resort Community RepresentativeTorie JarvisNWCCOG
10.Water Authority Lisa DarlingSouth Metro Water Supply Authority
11.Conservation District (West Slope)Amy MoyerColorado River District
12.Conservation District (East Slope)Frank KinderNorthern Water
13.Special District Paige McFarlandCentennial Water & Sanitation District
14.Nonprofit OrganizationLaura BelangerWestern Resource Advocates
15.Nonprofit OrganizationKate LarsonResource Central
16.Stormwater & Flood OrganizationBao ChongtouaMile High Flood District
17. Land Use Planning ExpertWaverly KlawSonoran Institute
18.Urban Planning ExpertAustin TroyUC Denver
19. DeveloperPatrick McMeekinHartford Homes
20. Community ExpertCincerรฉ EadesDenver Parks & Rec
21. Landscape Industry ProfessionalJohn McMahonALCC

Paper: High Resolution SnowModel Simulations Reveal Future Elevation-Dependent Snow Loss and Earlier, Flashier Surface Water Input for the Upper Colorado River Basin — AGU

We are seeing the best start to our snowpack in over a decade. But it is only a start โ€“ most of the winter season has yet to unfold, major reservoirs hold below-average storage, and last years’ experience demonstrates that powerful #storms can punctuate but not end a #drought. Photo credit: California DWR

Click the link to access the paper on the AGU website (John C. Hammond,ย Graham A. Sexstone,ย Annie L. Putman,ย Theodore B. Barnhart,ย David M. Rey,ย Jessica M. Driscoll,ย Glen E. Liston,ย Kristen L. Rasmussen,ย Daniel McGrath,ย Steven R. Fassnacht,ย Stephanie K. Kampf). Here’s the abstract and plain language summery:

Continued climate warming is reducing seasonal snowpacks in the western United States, where >50% of historical water supplies were snowmelt-derived. In the Upper Colorado River Basin, declining snow water equivalent (SWE) and altered surface water input (SWI, rainfall and snowmelt available to enter the soil) timing and magnitude affect streamflow generation and water availability. To adapt effectively to future conditions, we need to understand current spatiotemporal distributions of SWE and SWI and how they may change in future decades. We developed 100-m SnowModel simulations for water years 2001โ€“2013 and two scenarios: control (CTL) and pseudo-global-warming (PGW). The PGW fraction of precipitation falling as snow was lower relative to CTL, except for Novemberโ€“April at high elevations. PGW peak SWE was lower for low (โˆ’45%) and mid elevations (โˆ’14%), while the date of peak SWE was uniformly earlier in the year for all elevations (17โ€“23 days). Currently unmonitored high elevation snow represented a greater fraction of total PGW SWE. PGW peak daily SWI was higher for all elevations (30%โ€“42%), while the dates of SWI peaks and centroids were earlier in the year for all elevations under PGW. PGW displayed elevated winter SWI, lower summer SWI, and changes in spring SWI timing were elevation-dependent. Although PGW peak SWI was elevated and earlier compared to CTL, SWI was more evenly distributed throughout the year for PGW. These simulated shifts in the timing and magnitude of SWE and SWI have broad implications for water management in dry, snow-dominated regions.

Key Points

  • Projections show lower peak snow water equivalent (SWE) below 3,000 m and earlier peak SWE, peak surface water input (SWI) at all elevations
  • Greater future peak SWI and reduced annual snow-derived SWI for all elevations, with a more even SWI distribution throughout the year
  • A greater fraction of future SWE will be in high elevations that are currently unmonitored

Plain Language Summary

Snowpack water storage has historically functioned as a reliable extension of manmade reservoir storage. Loss of this storage has consequences for water resource management, ecological communities, and natural hazards including wildfire. We modeled snow accumulation and melt at high spatial resolution in the Upper Colorado River Basin to assess patterns in the timing and magnitude of snow storage and snowmelt for historical and future scenarios. We analyze these patterns in relation to existing snow monitoring station coverage, and ask how this coverage may need to change in future decades to better represent water availability. Our results indicate widespread future snow storage losses at lower elevations, but limited change at higher elevations that will likely remain conducive to seasonal snow accumulation and melt for decades to come. Peak snow storage and peak snowmelt occurred earlier for all elevations in future years, with increased peak surface water input noted at all elevations. A greater fraction of future snow storage will be in currently unmonitored high elevations. Projected elevation dependent changes from this study have implications for other dry, snow dominated regions, and additional work is needed to evaluate combined effects of widespread snow loss and earlier, flashier input on coordinated water management.

As #ClimateChange and overuse shrink #LakePowell, the emergent landscape is coming back to life โ€“ and posing newย challenges — The Conversation

The white โ€˜bathtub ringโ€™ around Lake Powell, which is roughly 110 feet high, shows the former high water mark. AP Photo/Rick Bowmer

Daniel Craig McCool, University of Utah

As Western states haggle over reducing water use because of declining flows in the Colorado River Basin, a more hopeful drama is playing out in Glen Canyon.

Lake Powell, the second-largest U.S. reservoir, extends from northern Arizona into southern Utah. A critical water source for seven Colorado River Basin states, it has shrunk dramatically over the past 40 years.

An ongoing 22-year megadrought has lowered the water level to just 22.6% of โ€œfull pool,โ€ and that trend is expected to continue. Federal officials assert that there are no plans to drain Lake Powell, but overuse and climate change are draining it anyway.

As the water drops, Glen Canyon โ€“ one of the most scenic areas in the U.S. West โ€“ is reappearing.

This landscape, which includes the Colorado Riverโ€™s main channel and about 100 side canyons, was flooded starting in the mid-1960s with the completion of Glen Canyon Dam in northern Arizona. The areaโ€™s stunning beauty and unique features have led observers to call it โ€œAmericaโ€™s lost national park.โ€

Lake Powellโ€™s decline offers an unprecedented opportunity to recover the unique landscape at Glen Canyon. But managing this emergent landscape also presents serious political and environmental challenges. In my view, government agencies should start planning for them now.

A tarnished jewel

Glen Canyon Dam, which towers 710 feet high, was designed to create a water โ€œbank accountโ€ for the Colorado River Basin. The U.S. Bureau of Reclamation touted Lake Powell as the โ€œJewel of the Coloradoโ€ and promised that it would be a motorboaterโ€™s paradise and an endless source of water and hydropower.

Lake Powell was so big that it took 17 years to fill to capacity. At full pool, it contained 27 million acre-feet of water โ€“ enough to cover 27 million acres of land to a depth of one foot โ€“ and Glen Canyon Damโ€™s turbines could generate 1,300 megawatts of power when the reservoir was high.

Soon the reservoir was drawing millions of boaters and water skiers every year. But starting in the late 1980s, its volume declined sharply as states drew more water from the Colorado River while climate change-induced drought reduced the riverโ€™s flow. Today the reservoirโ€™s average volume is less than 6 million acre-feet.

Nearly every boat ramp is closed, and many of them sit far from the retreating reservoir. Hydropower production may cease as early as 2024 if the lake falls to โ€œminimum power pool,โ€ the lowest point at which the turbines can draw water. And water supplies to 40 million people are gravely endangered under current management scenarios.

These water supply issues have created a serious crisis in the basin, but there is also an opportunity to recover an amazing landscape. Over 100,000 acres of formerly flooded land have emerged, including world-class scenery that rivals some of the crown jewels of the U.S. national park system. https://www.youtube.com/embed/y7jm08U38c0?wmode=transparent&start=0 As Lake Powell recedes, it is uncovering formerly flooded land and things that past visitors left behind.

Bargained away

Glen Canyon made a deep impression on explorer John Wesley Powell when he surveyed the Colorado River starting in 1867. When Powellโ€™s expedition floated through Glen Canyon in 1869, he wrote:

โ€œOn the walls, and back many miles into the country, numbers of monument-shaped buttes are observed. So we have a curious ensemble of wonderful features โ€“ carved walls, royal arches, glens, alcove gulches, mounds, and monuments โ€ฆ past these towering monuments, past these oak-set glens, past these fern-decked alcoves, past these mural curves, we glide hour after hour.โ€

A red rock cliff towers above trees and a small pool of water.
This side canyon emerged in recent years as Lake Powell shrank. The white โ€˜bathtub ringโ€™ on the rock wall shows past water levels. Daniel Craig McCool, CC BY-ND

Glen Canyon remained relatively unknown until the late 1940s, when the Bureau of Reclamation proposed several large dams on the upper Colorado River for irrigation and hydropower. Environmentalists fiercely objected to one at Echo Park in Dinosaur National Monument on the Colorado-Utah border, alarmed by the prospect of building a dam in a national monument. Their campaign to block it succeeded โ€“ but in return they accepted a dam in Glen Canyon, a decision that former Sierra Club President David Brower later called his greatest regret.

New challenges

The first goal of managing the emergent landscape in Glen Canyon should be the inclusion of tribes in a co-management role. The Colorado River and its tributaries are managed through a complex maze of laws, court cases and regulations known as the โ€œLaw of the River.โ€ In an act of stupendous injustice, the Law of the River ignored the water rights of Native Americans until courts stepped in and required western water users to consider their rights.

Tribes received no water allocation in the 1922 Colorado River Compact and were ignored or trivialized in subsequent legislation. Even though modern concepts of water management emphasize including all major stakeholders, tribes were excluded from the policymaking process.

There are 30 tribes in the Colorado River Basin, at least 19 of which have an association with Glen Canyon. They have rights to a substantial portion of the riverโ€™s flow, and there are thousands of Indigenous cultural sites in the canyon.

Another management challenge is the massive amounts of sediment that have accumulated in the canyon. โ€œColoradoโ€ means โ€œcolored redโ€ in Spanish, a recognition of the silt-laden water. This silt used to build beaches in the Grand Canyon, just downstream, and created the Colorado River delta in Mexico.

But for the past 63 years, it has been accumulating in Lake Powell, where it now clogs some sections of the main channel and will eventually accumulate below the dam. Some of it is laced with toxic materials from mining decades ago. As more of the canyon is exposed, it may become necessary to create an active sediment management plan, including possible mechanical removal of some materials to protect public health.

The creation of Lake Powell also resulted in biological invasives, including nonnative fish and quagga mussels. Some of these problems will abate as the reservoir declines and a free-flowing river replaces stagnant still water.

On a more positive note, native plants are recolonizing side canyons as they become exposed, creating verdant canyon bottoms. Restoring natural ecosystems in the canyon will require innovative biological management strategies as the habitat changes back to a more natural landscape.

Finally, as the emergent landscape expands and side canyons recover their natural scenery, Glen Canyon will become a unique tourist magnet. As the main channel reverts to a flowing river, users will no longer need an expensive boat; anyone with a kayak, canoe or raft will be able to enjoy the beauty of the canyons.

Glen Canyon National Recreation Area, which includes over 1.25 million acres around Lake Powell, was created to cater to people in motorized boats on a flat-water surface. Its staff will need to develop new capabilities and an active visitor management plan to protect the canyon and prevent the kind of crowding that is overrunning other popular national parks.

Other landscapes are likely to emerge across the West as climate change reshapes the region and numerous reservoirs decline. With proper planning, Glen Canyon can provide a lesson in how to manage them.

Daniel Craig McCool, Professor Emeritus of Political Science, University of Utah

This article is republished from The Conversation under a Creative Commons license. Read the original article.

John Wesley Powell. By Painter: Edmund Clarence Messer (1842 - 1919) - Flickr, Public Domain, https://commons.wikimedia.org/w/index.php?curid=7299882

USDA Forest Service Releases Action Plan to Advance Nation-to-Nation Relations

The Powell-Ingalls Special Commission meeting with Southern Paiutes. Photo credit: USGS

Click the link to read the article on the USDA website:

Washington,ย February 3, 2023ย –ย The U.S. Department of Agricultureโ€™s Forest Service today published an action plan that outlines steps the agency will take to advance tribal consultation and strengthen Nation-to-Nation relationships with federally recognized Tribes.

โ€œStrengthening Tribal Consultations and Nation-to-Nation Relationships: A USDA Forest Service Action Planโ€ recognizes the role tribal governments play in decision-making about Forest Service-managed lands and waters through co-stewardship, consultation, capacity-building, and by other means.

โ€œThis is more than a document. This action plan solidifies a pivotal moment in our agencyโ€™s history. The Forest Service manages millions of acres of lands, including ancestral homelands of American Indian and Alaska Native Tribal Nations. We acknowledge the tragic history involving the forced displacement of Indigenous People and recognize that upholding our federal trust and treaty responsibilities to Tribal Nations is a responsibility and an ongoing journey for our agency.โ€ said Forest Service Chief Randy Moore. โ€œWhen we acknowledge this history and work to ensure our actions and investments are reflective of our commitment to a better future, we can build trust and repair relationships with Tribes.

โ€œNational forests and grasslands often include ancestral homelands that Tribes have stewarded for centuries. Indigenous Nations are a key partner in how we value, co-manage, and steward our Nationโ€™s grasslands and forests. Understanding the perspective and wisdom of Indigenous people gives us an opportunity to reflect on our policies, programs and practices, the real-life implications they have on Indigenous peoples and what role we can play in rectifying historical or ongoing issues. With this plan as a guide, Forest Service employees will begin to implement a new way of working that will build trust and create innovative opportunities with Tribal Nations.โ€

The plan also emphasizes the agencyโ€™s unique, shared responsibility to ensure that decisions relating to federal stewardship of lands, waters and wildlife include consideration of how to safeguard the treaty rights and spiritual, subsistence and cultural interests of any federally recognized Tribe.

As part of this work, the Forest Service has renamed the State & Private Forestry deputy chief area to State, Private & Tribal Forestry to emphasize our commitment.

The action plan provides a framework for advancing existing laws, regulations and policies and is not intended to amend or establish new Forest Service policy or direction. Rather, the plan provides steps that can be implemented through existing programs and processes based on four focus areas:

  • Strengthen Relationships Between Indian Tribes and the USDA Forest Service.
  • Fulfill Trust and Treaty Obligations.
  • Enhance Co-Stewardship of the Nationโ€™s Forests and Grasslands.
  • Advance Tribal Relations Within the USDA Forest Service.

On our commitment to โ€œEnhance Co-Stewardship of the Nationโ€™s Forests and Grasslands,โ€ during the 2022 White House Tribal Nations Summit, Secretary of Agriculture Tom Vilsack and Under Secretary for Natural Resources and Environment Dr. Homer Wilkes underscored the progress the Forest Service is making in the implementation of the Joint Secretarial Order on Fulfilling the Trust Responsibility to Indian Tribes in the Stewardship of Federal Lands and Waters (Order No. 3403), a policy framework to facilitate agreements with Tribes in the co-stewardship of federal lands and waters.

To date, the agency has signed 11 new agreements with 13 Tribes, involving eight National Forests, agreements that include a collective investment of approximately $4.1 million in FY22. These co-stewardship agreements, along with 60 others involving 45 tribes in various stages of review, represent a Forest Service FY22 investment of approximately $19.8 million in our shared commitment to advancing co-stewardship with tribes. The agreements also reflect an agency commitment to include consideration of how to safeguard the treaty, spiritual, subsistence, and cultural interests of any Indian Tribe by ensuring tribal governments play an integral role in decision-making related to the management of federal lands and waters through consultation, capacity-building, and other means consistent with applicable authority.

โ€œThe U.S. and Tribal Nations are working together to create more realistic and progressive relationships that honor and respect tribal sovereignty,โ€ said Reed Robinson, director of the Forest Service Office of Tribal Relations. 

โ€œWe are witnessing significant growth of American Indian & Alaska Native populations, cultural expression and ownership, and economic development. This moment is critical for Forest Service employees to lead from where they are, to acknowledge, plan, take consequential actions, and step through the aperture of opportunity that, right now, is wider than any other time in history.โ€

North American Indian regional losses 1850 thru 1890.

Falling #LakePowell #Water Levels Put #Wyoming Hydro Power at Risk — Public News Service

Glen Canyon Dam, January 2022. Jonathan P. Thompson photo.

Click the link to read the article on the Public News Service website (Eric Galatas):

Part of the deal Wyoming struck for sending its water down the Colorado River was that state residents would be able to tap electricity generated at Glen Canyon Dam. But that arrangement is becoming less tenable as water levels at Lake Powell required for hydro-power production continue to drop. 

Sinjin Eberle, southwest communications director with the group American Rivers, explained in order to be able to generate electricity, Lake Powell can drop no lower than 3,490 feet.

“Figuring out how we’re going to manage this system in the face of a much smaller river is what everybody in the Colorado River Basin, whether you are in Wyoming or California, need to be concerned about,” Eberle said. 

Glen Canyon Dam currently generates energy for nearly 6-million households in Wyoming, Arizona, Colorado, Nebraska, Nevada, New Mexico and Utah. Lake Powell water levels dropped to their lowest point since 1967 last summer, reaching 3,533 feet, and some warn the lake could dip below levels necessary for power generation as early as this spring, and have proposed demolishing the dam to help restore the Colorado River’s health and long-term viability.

If Lake Powell drops below Dead Power to Dead Pool status at 3,370 feet, water would no longer be able to flow through the dam to lower basin states. This year’s higher-than-average snow pack may provide short-term relief, but Eberle said it could take years of above-average precipitation to reverse decades of drought across the region, and added the challenges facing Lake Powell and Glen Canyon Dam are multi-faceted.

“Water-supply issues from a lingering 23-year drought, with impacts from climate change continuing to exacerbate those drought conditions,” Eberle said. “And then (we have) some of the fastest growing areas of the country demanding more water.”

When the Colorado River Compact was first negotiated in 1922, there were just 475,000 people living in the seven-state basin. Then-Commerce Secretary Herbert Hoover projected that population could swell to two million people over time. But there are now at least 40-million people across the basin that depend on water from the river, Eberle said. 

“This framework that was built in 1922 has lasted 100 years, but is also trying to support a system that is many, many times larger than the wildest imaginations of the framers when they built this compact,” he said. 

Disclosure: American Rivers contributes to our fund for reporting on Environment, Public Lands/Wilderness, Salmon Recovery, Water. If you would like to help support news in the public interest, click here.

February 2023 #ENSO update: the ENSO Blog investigates, part 3 — NOAA

Click the link to read the post on the NOAA website (Emily Becker):

La Niรฑaโ€”the cool phase of the El Niรฑo-Southern Oscillation climate patternโ€”weakened over the past month, and forecasters expect a transition to neutral conditions in the next couple of months. Weโ€™ll check in with the tropical Pacific to see how things are going before continuing the journey into understanding winter daily temperature variability that I started in Decemberโ€™s post.

Current events

The sea surface temperature in theย Niรฑo-3.4 regionย in the tropical Pacific came in at 0.75 ยฐC (1.4 หšF) cooler than the long-term average in January according toย ERSSTv5, our most consistent historical dataset.

Three-year history of sea surface temperatures in the Niรฑo-3.4 region of the tropical Pacific for the 8 existing multi-year La Niรฑa events (gray lines) and the current event (purple line). Of all the previous 7 events, 2 went on to La Niรฑa in their third year (below the blue dashed line), 2 went on to be at or near El Niรฑo levels (above the red dashed line) and three were neutral. Graph by Emily Becker based on monthly Niรฑo-3.4 index data from CPC using ERSSTv5.

This is the second month in a row with that the Niรฑo-3.4 anomaly (anomaly = โ€difference from the long-term averageโ€) has weakened, but it still exceeds the La Niรฑa threshold of -0.5 ยฐC. The most recent weekly Niรฑo-3.4 anomaly, which comes from the OISST dataset, was just at that threshold, measuring -0.5 ยฐC. (Take a look at Tomโ€™s post for more details on the various datasets we use to track temperatures in the Pacific.)

Weekly measurements tend to bounce around (weather!), while ENSO is a seasonal pattern (climate!). Therefore, we wonโ€™t declare La Niรฑa is over the moment the weekly value crosses the thresholdโ€”weโ€™ll wait to be sure that the monthly average anomaly is in the neutral range (between -0.5 ยฐC and 0.5 ยฐC). The last time neutral conditions were present was summer 2021.

The atmospheric response to La Niรฑaโ€™s cooler-than-average ocean surface is an amped-up Walker circulation: stronger trade winds, stronger westerly (west-to-east) winds high up in the atmosphere, more rain and clouds than average over the far western Pacific, and drier conditions over the east/central Pacific. All of these characteristics were evident through January, indicating that the atmosphere is still reflecting La Niรฑa.

Whatโ€™s next??

Okay, okay, so La Niรฑa is still here. But forecasters expect that a change is imminent, with an 85% chance that the Februaryโ€“April period will be neutral. This is based on the consensus of our computer models and bolstered by some physical observations, including the weakening oceanic anomalies at the surface and subsurface.

Water temperatures in the top 300 meters (1,000 feet) of the tropical Pacific Ocean compared to the 1991โ€“2020 average in Decemberโ€“January 2022โ€“23. NOAA Climate.gov animation, based on data from NOAA’s Climate Prediction Center.

The subsurface provides a source for the surface. If there were still a lot of cooler water under the surface, we might be more hesitant to conclude that the transition to neutral conditions would happen soon. But as the animation above shows, the cold pool is getting smaller.

But will the neutral conditions we expect for spring precede an El Niรฑo?? Tell us what we really want to know! Currently, El Niรฑo has odds of about 60% for next fallโ€”and after three La Niรฑa winters in a row, it might seem inevitableโ€”but there are some factors that provide uncertainty. Thereโ€™s our old friend, the spring predictability barrier. Forecasts made in the spring tend to have lower accuracy, at least in part because spring is a time of transition for ENSO (other possible factors are still being explored), making it harder for models to get a grip on what direction things are going.

Also, the wide range of potential outcomes from the models (shown below) tells us that there is still a lot of uncertainty.

February 2023 climate model forecasts for the Niรฑo-3.4 temperature anomaly in 2023 from the North American Multi-Model Ensemble (NMME). Each gray line shows an individual potential outcome. Purple line shows the observed Oceanic Niรฑo Index. Graph by Emily Becker.

Each line in that graph shows a possible scenario for next fall and winter. The scenarios begin to diverge for two main reasons: the differences in how each model simulates certain small-scale physical processes and, for a given model, the very-slightly-different starting input that accounts for the fact that we can never observe the current state of the climate system perfectly. The predictions span from strong El Niรฑo to (gasp!) a 4th-year La Niรฑa. These extreme scenarios are unlikely, though, and the majority of the forecasts are in the neutral to moderate-El Niรฑo range. More on climate models in this post.

In summary: La Niรฑa is waning, and confidence is high that neutral conditions will be in place soon and will last through the spring and early summer. Chances for El Niรฑo next fall are increasing, but weโ€™ll have a better picture as we progress through and past the spring predictability barrier.

Daily temperature variability or bust!

To recap: over the last couple of posts, Iโ€™ve been looking into how ENSO affects the range of daily temperatures within a season. When it comes to ENSO impacts, we usually talk about the seasonal average temperature, butโ€”as vividly illustrated by the two extreme cold-air outbreaks in the U.S. this winterโ€”daily temperature is how we experience weather. So I examined the variability or range of daily temperature each winter over 1950โ€“2020 and then checked if the range of variability was different in El Niรฑo winters or La Niรฑa winters compared to neutral winters. Details of my analysis are in the footnotes.

In December, I showed that the range of daily average temperature is wider during La Niรฑa winters than during El Niรฑo winters in nearly all of North America. The only geographic exceptions are the north-central region of the continent, Florida, and southern Mexico, all of which have lower variability during La Niรฑa and higher variability during El Niรฑo winters. 

Then, inย January, I checked out the average range of dailyย minimumย andย maximumtemperatures. It turned out that there is a very wide range of daily minimum temperatures (usually the overnight low temperature) in the center of the continent, with less variability toward the coasts, especially the Southwest. Looking at daily maximums (usually the daytime high), we found that there was less variability overall than with the minimum, except for the subtropical regions.

The average variability of daily low temperatures (left) and high temperatures (right) within winter. Yellow regions show where the range of daily temperatures in winter is greatest, while blue shows regions with the narrowest range. The range is assessed using the standard deviation of daily low or high temperature averaged over all winters (Decemberโ€“February), 1950โ€“2020. Daily temperature data source is Berkeley Earth. Map by climate.gov based on analysis by Emily Becker.

Breaking down the patterns into ENSO phase, the first thing we can say is that El Niรฑo and La Niรฑa have approximately opposite effects on both daily maximum and daily minimum, much as they did on the average temperature variability I showed in December. Where El Niรฑo reduces variability, La Niรฑa increases it, and vice-versa.

The difference in the range of daily minimum and maximum temperature in El Niรฑo winters (upper row) and La Niรฑa winters (lower row), compared to the long-term average. Purple shows where the variability of daily highs or lows is greater, while orange shows where the range is reduced. For example, during El Niรฑo winters, the range of daily low temperatures is lower than average in Alaska, while it is increased during La Niรฑa winters. Long-term average is 1950โ€“2020. Temperature data from Berkeley Earth. Map by climate.gov based on analysis by Emily Becker.

However, things are a little noisier than those average daily patterns were. This is expected; any time you get into more granular dataโ€”whether youโ€™re talking about area or time spanโ€”your results get noisier. (Another example of this is the weekly vs. monthly sea surface temperature I talked about above.) Iโ€™ll make a few quick observations about these maps but leave you to compare them for your hometown or other areas of interest.

Looking first at the maps for La Niรฑa winters, we find that much of the U.S. and Alaska experience an increased range of daily lows. The pattern of La Niรฑaโ€™s impact on the daily high temperature range is somewhat different, with variability decreasing in the northern half of the U.S. and increasing in the Southeast. However, there are some regions where both daily highs and daily lows change the same way during La Niรฑa winters (increased range in the Southeast and in Alaska).

During El Niรฑo, the range of daily low temperature is substantially reduced across most of the U.S. and Alaska. The range of daily highs, however, is slightly expanded or only slightly reduced over the U.S.

Thatโ€™s all thereโ€™s space for this month. What ideas do you have for why these patterns vary the way they do? Let us know in the comments! Then next month, Iโ€™ll wrap things up with some explanations and thoughts about ENSOโ€™s impact on daily temperature. Until then, stay cozy!

Footnote

Details on the analysis:

  • The maps show the standard deviation of daily maximum or minimum temperature for each winter averaged over all winters 1950โ€“2020 and the averages for La Niรฑa and El Niรฑo winters, as determined by the Oceanic Niรฑo Index.
  • Daily temperature data: I used Berkeley Earth daily average temperature dataset. Itโ€™s also available here.
  • Years included: 1950โ€“2020. Berkeley Earth is available through near-present, but the data I downloaded ended in 2020. Iโ€™ll update with 2021โ€“2022, but I donโ€™t expect the overall results to change.
  • Programming language: I used Python. Jupyter notebooks available upon request.

#ColoradoRiver states seek solution for shrinking #water supply The #Gunnison Country Times #COriver #aridification

Updated Colorado River 4-Panel plot thru Water Year 2022 showing reservoirs, flows, temperatures and precipitation. All trends are in the wrong direction. Since original 2017 plot, conditions have deteriorated significantly. Brad Udall via Twitter: https://twitter.com/bradudall/status/1593316262041436160

Click the link to read the article on The Gunnison Country Times website (Bella Biondini). Here’s an excerpt:

โ€œWe can only save the Colorado River system if we act together,โ€ Upper Colorado River Commissioner Becky Mitchell said in a press release. โ€œThe CBMA (Consensus-Based Modeling Alternative) approach appropriately distributes the burden across the Basin and provides safeguards for the Tribes, water users, and environmental values in the Upper Basin.โ€ 

โ€˜Whoโ€™s using all the water?โ€™

Water use by basin has been historically uneven, but dry conditions along the Colorado River have continued to reduce the amount of water available for all users. While each basin is entitled to 7.5 million acre-feet per year under the 1922 compact, only the Lower receives that much. And its use has been steadily increasing.ย  At the same time, approximately 1.5 million acre-feet is lost to evaporation or in transit as it travels to large desert cities like Phoenix and Las Vegas. The Lower Basin gets to keep this bonus, and its total allocation is not charged with the losses.ย  Although Lower Basin users can pull more from large buckets of water upstream like Lake Powell in times of drought, those located at the headwaters of the Colorado River take their shortages directly from Mother Nature. Since 2019, use in the Upper Basin has declined by 22.5%, according to data from the Colorado Water Conservation Board.ย  The Upper Basin states have consistently argued that the source of the problem is overconsumption downstream, said John McClow, general counsel for the Upper Gunnison River Water Conservancy District. During the same time period that use in the Upper Basin declined, use in the Lower Basin increased by 7% โ€”ย ย equivalent to approximately 638,000 acre-feet or twice the current content of Blue Mesa Reservoir.ย 

โ€œWhoโ€™s using all the water? It isnโ€™t us,โ€ McClow said. โ€œBut we have no choice. We canโ€™t decide how much weโ€™re consuming. We can only consume what melts into the rivers.โ€

[…]

Reclamation has committed $125 million to a voluntary consumption reduction program in the Upper Basin through a partnership with the Upper Colorado River Commission. The Commission will select projects for implementation beginning in 2023 โ€” reimbursing selected water users per acre-foot of water saved for the greater system. Exactly how many users will participate is unknown.ย  Thereโ€™s agreement that the Upper and Lower Basin states must work collectively to address the risk in the Colorado River system, said Executive Director Chuck Cullom.

โ€œThereโ€™s also recognition that the Upper Basin activities are only effective if thereโ€™s companion action in the lower basin,โ€ Cullom said. 

Re-engineering #GlenCanyonDam — The Land Desk

Glen Canyon Dam during high flow experimental release about a decade ago. These occasional releases are just about the only time the river outlet works (where water is gushing out above) operate. Photo credit: Jonathan P. Thompson/The Land Desk

Click the link to read the article on The Land Desk website (Jonathan P. Thompson):

For the last two years or so, federal Bureau of Reclamation officials have been fretting publicly about what might happen to Glen Canyon Dam as water levels continue to drop.ย Currently the surface of Lake Powell is perilously close to the penstocks, or the water intakes that lead to the hydroelectricity turbines. Once those are rendered inoperable, the only way to get water through the dam is via the river outlet works, or ROW.

The back of Glen Canyon Dam circa 1964, not long after the reservoir had begun filling up. Here the water level is above dead pool, meaning water can be released via the river outlets, but it is below minimum power pool, so water cannot yet enter the penstocks to generate electricity. Bureau of Reclamation photo.

That could be a problem. First off, there are no turbines on the ROWs, so there would be no hydropower generation. And as Tanya Trujillo, the Interior Departmentโ€™s assistant secretary for water and science, noted last year, the dam was not built โ€œto operate solely through the outworks for an extended period of time.โ€ Bad things could happen, like cavitation of the ROWs, which could then threaten the very integrity of the dam. Something needs to be done.

Last week, the Bureau for the first time made public six alternatives the agency is considering:

  • Construct new, low- (3,245 feet) or mid-level (3,445 feet) power intakes through the dam that would utilize existing turbines, essentially lowering the โ€œminimum power poolโ€ level as much as 200 feet.
  • Connect the current ROWs โ€” at 3,374 feet โ€” to the current turbines or install new turbines so hydropower generation could continue until the lake reached โ€œdead pool,โ€ or falls below the ROWs (at which point no water can be released and the Grand Canyon will dry up).
  • Build a low-level bypass tunnel through the sandstone around the dam and install new turbines/power plant to allow for low-water releases with hydropower generation. (Simply reopening the original river diversion tunnels, built to allow for the construction of Glen Canyon Dam, was dismissed due to the fact that the openings are completely buried in silt. This bypass would be above the siltation level.)
  • Adjust Colorado River operations (e.g. release less water from Glen Canyon Dam, get people to stop using so much water, etc.)
  • Retrofit dam to allow it to generate hydropower through existing penstocks at slightly lower levels.
  • Invest in other power sources to offset hydropower losses.
Proposed powerplant addition Glen Canyon Dam. Credit: The Land Desk

Any of the first three options would be a major and expensive undertaking. And any of them would also allow Glen Canyon Dam to be operated at much lower lake levels, which would have consequences for Lake Powell, too. Already the reservoir looks radically different than it does at โ€œnormalโ€ levels; try to imagine it 130 feet lower?

Currently, the surface of Lake Powell is sitting at 3,522 feet. Minimum power pool is 3,490. Dead pool is 3,370. The alternatives being considered would allow the minimum power pool level to drop to 3,390, according to the chart below (although, theoretically, a 3,285 foot intake would allow the level to drop another 100 feet before hitting dead pool).

Operations at or below reservoir elevation of 3,490′ (MPP). Credit: The Land Desk

That would not only reveal more hidden wonders, but would also cause the big slug of silt that is concentrated in the upper reaches of the reservoir to migrate further downstream. And it would wreak more havoc on recreation. Iโ€™ll leave you with a good Twitter thread from Zak Podmore mapping out Lake Powell at 3,285 feet.

Changes needed to save second-largest U.S. reservoir, experts say — The Washington Post #LakePowell #ColoradoRiver #COriver #aridification #snowpack

Updated Colorado River 4-Panel plot thru Water Year 2022 showing reservoirs, flows, temperatures and precipitation. All trends are in the wrong direction. Since original 2017 plot, conditions have deteriorated significantly. Brad Udall via Twitter: https://twitter.com/bradudall/status/1593316262041436160

Click the link to read the article on The Washington Post website (Anumita Kaur). Here’s an excerpt:

โ€œThereโ€™s too little supply and too much demand,โ€ said Brad Udall, a water and climate scientist at Colorado State University. โ€œUltimately, I think what weโ€™re going to see here is some major rewriting of Western water law.โ€

โ€œWeโ€™re seeing a collision right now between 19th century water law, 20th century infrastructure and 21st century population and climate change,โ€ Udall added. โ€œAnd how this works out is anybodyโ€™s guess.โ€

[…]

West snowpack basin-filled map February 20, 2023 via the NRCS.

The snow and rain seen in the west this year isnโ€™t enough to stabilize Lake Powell either, Andrechak said. โ€œNow, the reality is, theyโ€™re all going to get a cut. Everybody should give,โ€ he said.

โ€œThereโ€™s no time left. The crisis is here. They donโ€™t necessarily have to give it up forever. It might be temporary for several years until thereโ€™s improvements,โ€ he said. But even if water levels do improve in the future, states cannot expect to return to former water usage entirely.

โ€œClimate change is making sure that itโ€™ll never get back to those levels,โ€ Andrechak said.

At the heart of #ColoradoRiver crisis, the mighty โ€˜Law of the Riverโ€™ holds sway — The Los Angeles Times #COriver #aridification

Colorado River from Lee’s Ferry. Photo credit. Gonzo fan2007 – Own work, CC BY-SA 4.0, https://commons.wikimedia.org/w/index.php?curid=3631180

Click the link to read the article on The Los Angeles Times website (Hayley Smith and Ian James). Here’s an excerpt:

At the heart of the feud is the โ€œLaw of the River,โ€ a body of agreements, court decisions, contracts and decrees that govern the riverโ€™s use and date back to 1922, whenย the Colorado River Compactย first divided river flows among the states. [ed. note: George Sibley argues the “Prior Appropriation” is the base of the Law of the River.]ย 

But as California argues most strongly for strict adherence to this system of water apportionment, the other states say it makes little sense when the riverโ€™s largest reservoir, Lake Mead, continues to decline toward โ€œdead poolโ€ level, which would effectively cut off the Southwest from its water lifeline. The Law of the River, they say, is getting in the way of a solution.

โ€œWe can argue about whether interpretations of the Law of the River match the physical reality,โ€ said Tom Buschatzke, director of the Arizona Department of Water Resources. โ€œBut if you end up in a courtroom arguing these points and something isnโ€™t done, the Colorado River system is going to crash.โ€

[…]

Californiaโ€™s legal position is based on several factors, said James Salzman, a professor of environmental law at UCLA and UC Santa Barbara. First, the authors of the original Colorado Compact made the โ€œfateful decisionโ€ to divvy up water for the riverโ€™s lower-basin states of California, Arizona and Nevada in absolute quantities instead of percentages.ย That means upper-basin states are obligated to deliver 7.5 million acre-feet per year to the lower states, no matter what, which โ€œturned out to be a tragically bad design,โ€ Salzman said. Additionally, the massive Imperial Irrigation District in California established senior rights to the water before the Colorado River Compact โ€” meaning it holds high-priority rights to deliver theย single largest shareย of the riverโ€™s water to Imperial Valley farmlands.ย 

Arizona, by contrast, agreed to junior rights to the river in 1968 in exchange for building the Central Arizona Project, the system that transports river water through the state. 

In other words, according to the Law of the River, if thereโ€™s not enough water to go around, states like Arizona are supposed to be cut off before California.

The Salton Sea (pictured above ) straddles the Imperial and Coachella valleys and has long been a sticking point in Colorado River deals. But the federal government recently committed up to $250 million for restoration efforts at the sea. (Source: Water Education Foundation)

Living on the knifeโ€™s edge, even at the source of the #RioGrande: With less snowpack to feed the river and aquifers, #Colorado state government may shut off farmersโ€™ wells in the near future — Source #NewMexico

Farmer Kyler Brown in front of a small dam on the Rio Grande at a farm outside of Monte Vista, Colorado. โ€œIโ€™ve ranched. Iโ€™ve cowboyed. Now Iโ€™m farming and ranching,โ€ Brown said. โ€œYou quickly learn in the West how important water is.โ€ (Photo By Diana Cervantes for Source NM).

Click the link to read the article on the Source New Mexico website:

by Danielle Prokop, Source New Mexico
January 30, 2023

RIO GRANDE RESERVOIR, Colo โ€” After 15 miles of pockmarked dirt road, the Rio Grande spreads wide in the shadows of the San Juan Mountains. It glitters, aqua, whitecaps whipped up by the wind. But even in the birthplace of the river lay the stark stains of climate change. 

Deep, bald scars pucker the mountaintops, shorn of trees. In older burn scars, grass grows, flowing in the first summer breezes. In the newer scars, the thin rows of trees list, blackened and cracked, only a skirt of green growth at their base to mark the passage of time.

Crisis on the Rio Grandeย is a multi-part series that travels along the river from Colorado through New Mexico and into Texas. Read more:ย A river wounded

The Rio Grande meanders south and east through Coloradoโ€™s San Luis Valley, a region of about 8,000 square miles spanning six counties, tucked between two mountain ranges. Agriculture drives the economy. More than 46,000 residents rely on $370 million generated by alfalfa, barley, potatoes, wheat, beef cattle and sheep. 

โ€œNow you just really feel that thatโ€™s all on a collision course with climate, and that may have some severe ramifications,โ€ said valley farmer and rancher Kyler Brown as he passed over the low Rio Grande that cuts across his father-in-lawโ€™s farm in Monte Vista, Colorado. The valleyโ€™s way of agricultural life is imperiled. 

The San Luis Valley depends on water, for the herds, the crops, for next yearโ€™s planting. And for mortgages, farm insurance, sometimes for the shareholders, sometimes for keeping the business in the family. 

Average rainfall is only 7 inches to 9 inches annually.

Three-fourths of the water in the Rio Grande instead starts as snow, folded into the crevices of the mountains, slowly seeping through soil or streaming down to the riverbed.

The river pools into the Rio Grande Reservoir at the base of the San Juan Mountains, fed mostly by snowmelt. (Photo by Diana Cervantes for Source NM)

The snowpack acts like a bank, a savings โ€” water frozen for the future. In past decades, that meant cold snowmelt would start filling the rivers in April, peaking in June, eventually slowing through the autumn.

But warmer temperatures, less tree cover due to wildfires, more dust and thirsty soils from years of compounded drought prevent the just-melted snow from ever reaching the riverbed. Over the years, the smaller snowpack is becoming liquid earlier and changing the rhythm of the river.

In scarcity, relationships change

Though the San Juans had all of the snow they usually would in early spring 2022, it didnโ€™t translate to a full river. Brutal May winds stripped away snowpack. 

โ€œThere was a tension in my gut,โ€ said Heather Dutton, manager of the San Luis Valley Water Conservancy District. โ€œBecause as the winds were howling, we knew we were losing snowpack. Every day, we were losing our opportunity to have flows in the river and put water in our aquifers.โ€

Threats are present. Farmers pump groundwater to make up for the riverโ€™s shortfalls, but that means falling groundwater levels. Populations swell on the Front Range around Denver, and downriver, too. And thereโ€™s always potential for devastating wildfire. 

โ€œWeโ€™re living on the knifeโ€™s edge with water,โ€ Dutton said.ย 

An old train depot captured June 22, 2022 outside of La Jara, Colorado. (Photo by Diana Cervantes for Source NM)

Water managers talk of new efforts to curb water use. Theyโ€™re trying to change relationships between conservation groups, environmental nonprofits, farmers and the quasi-governmental irrigation districts. 

Nathan Coombs, who manages the Conejos River District, said years of trust-building with groups typically at odds means thereโ€™s a greater willingness to face issues. 

โ€œOnce we took down barriers of communication between project partners, we could start clearly seeing problems,โ€ Coombs said. โ€œIf you want to solve those problems, youโ€™ve got to talk to people you have never wanted to talk to before.โ€

Itโ€™s not perfect.

โ€œLook, thereโ€™s always going to be a skunk at the picnic. Iโ€™m not saying everything is always totally kumbaya, but the biggest players for the vast majority are engaged.โ€

San Luis Valley Groundwater

Hidden waters

SAN LUIS VALLEY, Colo โ€” Groundwater made the valley green, but climate change and over-pumping across time has depleted those water sources.

There are two aquifers underlying the valley. One is called the โ€œconfined aquifer,โ€ trapped under an impermeable clay layer deep down, concentrated centrally. The other is a shallow โ€œunconfined aquiferโ€ generally found between 15 feet to 100 feet underground across most of the valley.

Artesian well Dutton Ranch, Alamosa 1909 via the Crestone Eagle

In certain spots in the valley, water used to gush out in artesian wells from the unconfined aquifer. But in recent decades, levels declined steeply after years of too many wells and too little recharge from the river or precipitation.

And the aquifers, explained Colorado State Engineer Mark Rein, take a double hit.

โ€œThereโ€™s less water flowing naturally into aquifers that the wells rely on. At the same time,โ€ he explained, โ€œdue to the lack of surface water, the wells are going to be more reliant on the aquifers.โ€

Farmers in the San Luis Valley have just eight years to stop the freefall of groundwater levels, or face the state shutting off wells.

In the valleyโ€™s most affluent district stretching between Alamosa and Saguache Counties, the aquifer declined 1.3 million acre feet by 1976, most of that over just 20 years. District officials submitted a plan to replenish the aquifer.

Rein acknowledged the efforts of Valley residents to reduce pumping, saying in June that it was too soon to tell if they could succeed in replenishing the aquifer before the 2031 deadline.

A sprinkler waters barley in a farm at Monte Vista. (Photo by Diana Cervantes for Source NM)

Thereโ€™s a nexus Subdistrict 1 is dealing with, Rein said.

โ€œWe have this very rich culture in the San Luis Valley of irrigation, crops โ€” and the economy is so dependent on it,โ€ Rein said. โ€œAnd at the same time, theyโ€™re facing a reality of less water.โ€ One push to curb use might not go far enough. Another may go too far and erode culture and economy. โ€œThatโ€™s what makes success more or less possible.โ€

All across Colorado, farmers have to offset any groundwater they pump either by submitting plans to water court for individual wells or joining a conservancy district in any of Coloradoโ€™s river basins. 

Self-governance

People in the Rio Grande basin went further, carving up the basin into seven hyper-local subdistricts with a role in restoring the โ€œbalance between available water supplies and current levels of water use.โ€

Dutton, 36, brims with verve when she speaks about the river. Growing up on a potato farm, both her father and grandfather took on water leadership positions.

She said decisions at the local level were how changes were made to water policy.

The entities, the districts, the boards, theyโ€™re all made up of people that have a dog in the fight, she said. โ€œThey live and work in the community. Theyโ€™re water users.โ€

Farmers in the valley taxed themselves, paying an additional fee for every acre-foot of groundwater they pumped to fund conservation measures.

Rio Grande and River Conejos conservation districts use the money to pay farmers to stay off their wells, to retire them, to retire fields, to purchase farmland. Or the funds go to creating a system of โ€œwater credits,โ€ allowing farmers who need more water to buy from farmers who returned excess flows to the aquifer.

In 2022, the Colorado Legislature chipped in another $30 million out of federal coronavirus relief funds to buy land and retire irrigation wells along the Rio Grande.

The efforts are unique. Hundreds of wells were shuttered by the state in northeast Colorado in 2011. 

โ€œThere were large-scale wells shut-offs, and those wells are still shut off,โ€ Dutton said. โ€œBut here, we took the initiative as a community, and we said, โ€˜We want to regulate ourselves. We want to work together to make this work.โ€™โ€

Even as the valley had record-breaking monsoon rainfall in 2022, it isnโ€™t enough to recharge the aquifers, which face decades of pumping more water than is sinking in. (Photo by Diana Cervantes for Source NM)

Recent cycles have not been kind, either. After a few frugal years of farmers cutting pumping recharged the aquifer some, bad drought struck again. Without much replenishment from the struggling river, the past three years nearly erased those gains for groundwater.

Even when, in 2021, the districtโ€™s farmers pumped the least they had in a decade โ€” the aquifer still dropped to a new historic low.

โ€œIt was incredibly disheartening,โ€ Dutton said.

When a near-record monsoon season doused the valley in the summer of 2022, with some places receiving double the annual average rainfall, the river still ran at only 67% of its long-term average.

โ€œIt really wasnโ€™t a great year as far as streamflow goes,โ€ Dutton said. โ€œHopefully enough people saw what was happening in May and made some choices to change their farming plan for the year.โ€

Time is running out. Subdistrict 1 has to replenish the unconfined aquifer by more than 900,000 acre feet, or face the state capping wells.

Despite all their efforts and sacrifices, Dutton said, โ€œweโ€™re anticipating seeing a significant drop in the aquifer.โ€

Monte Vista Crane Festival to premiere โ€œWhere the Cranes Meet the Mountainsโ€ — @AlamosaCitizen

Sandhill Cranes Dancing. Photo by: Arrow Myers photo courtesy Monte Vista Crane Festival

Click the link to read the article on the Alamosa Citizen website:

THE San Luis Valley premiere of โ€œWhere the Cranes Meet the Mountains,โ€ a short documentary to commemorate the 40th Annual Monte Vista Crane Festival, is slated for Saturday, March 11 at the Ski Hi Events Complex.

Filmmaker Christie Bode-Skeie and Crane Festival volunteer Jenny Nehring joined The Valley Pod for a conversation on the making of the film and all events scheduled for the 2023 Crane Festival.

Listen to the full podcast episode with Christie Bode-Skei and Jenny Nehring: HERE

โ€œWe wanted to tell the story of how it feels to see the cranes at the Monte Vista Crane Festival and the impact of that to someone new to the Valley,โ€ explained Nehring.

The film features South Fork artistย Amanda Charlton Hurley,ย who is a new arrival to the Valley experiencing for the first time the sights and sounds of Sandhill Cranes. For Bode-Skeie, it was a perfect way to recreate her own initial experience with the Sandhill Cranes and bring that to life through the documentary.

โ€œI really wanted to strike a deep emotional chord,โ€ Bode-Skeie said, โ€œand I think I had to put myself back in the place when I first saw the cranes in the Valley 10 years ago and what that experience was like and looking at it with fresh eyes. Itโ€™s so easy to take things for granted when itโ€™s right in your own backyard.โ€

The documentary also gives a subtle nod to other attributes of the Valley for residents and tourists alike to appreciate and provides a sense of the small town vibe of Monte Vista and surrounding communities.

In addition to the โ€œWhere the Cranes Meet the Mountainsโ€ documentary, the 40th Monte Vista Crane Festival will feature a keynote address by George Archibald, co-founder of the International Crane Foundation. The International Crane Foundation is celebrating its 50th year and bringing Archibald in to speak was a natural fit for Monte Vistaโ€™s 40th Crane Festival, said Nehring.

Tickets to the documentary premiere and to Archibaldโ€™s keynote address are available at mvcranefest.org.

New study finds humans cause more destructive wildfires in the west — University of #Montana

In August 2021, the human-caused Boulder 2700 Fire near Flathead Lake burned 2,230 acres and destroyed 31 structures, leaving debris along Highway 35 and threatening power lines and traffic.

Click the link to read the release on the University of Montana website:

MISSOULA โ€“ More than three times as many houses and other structures burned in Western wildfires from 2010 to 2020 than in the previous decade, and that wasnโ€™t only because more acreage burned, according to a new analysis from the University of Montana and its partners.

Human ignitions started 76% of the wildfires that destroyed structures, and those fires tended to be in flammable areas where homes, commercial structures and outbuildings are increasingly common.

โ€œHumans are driving the negative impacts from wildfire,โ€ said lead author Philip Higuera, a UM fire ecologist and professor, who wrote the assessment during a sabbatical at the Cooperative Institute for Research in Environmental Sciences (CIRES) at the University of Colorado Boulder. โ€œHuman fingerprints are all over this. We influence the when, the where and the why.โ€

Most measures of wildfireโ€™s impact โ€“ for example, expansion of wildfire season into new months and the number of structures in flammable vegetation โ€“ are going in the wrong direction, Higuera said. But the new finding, published Feb. 1 in the Proceedings of the National Academy of Sciences-Nexus, also means that human action can lessen the risks of wildfire damage.

โ€œWe have levers,โ€ he said. โ€œAs climate change makes vegetation more flammable, we advise carefully considering if and how we build in flammable vegetation, for example.โ€

During Higueraโ€™s visiting fellowship at CIRES, he worked with several researchers to dig into the details of 15,001 Western wildfires between 1999 and 2020.

Burned area increased 30% across the West, the team found, but structure loss increased much more, by nearly 250%. Many factors contributed, including climate change, our tendency to build more homes in flammable ecosystems and a history of suppressing wildfire.

Ph.D. student Maxwell Cook, a co-author from CIRES/CU Boulder, said the forcible removal of Indigenous people from landscapes played a role by all-but-eliminating intentional burning, which can lessen the risk of more destructive fires.

โ€œPrescribed fire is an incredibly important tool, and we have a lot to learn about how people have been using fire for centuries,โ€ Cook said.

In the new assessment, the team found some horrible years for wildfires. Sixty-two percent of all structures lost in those two decades were lost in just three years: 2017, 2018 and 2020, Cook said.

And some states had it much worse than others. California, for example, accounted for more than 77% of all 85,014 structures destroyed during 1999-2020.

Across the West, 1.3 structures were destroyed for every 1,000 hectares of land scorched by wildfire between 1999 and 2009. Between 2010 and 2020, that ratio increased to 3.4.

Importantly, Higuera and his colleagues also found variability among states in how much burning occurred and how many structures were lost in wildfires. Montana sees less structure loss relative to the West as a whole, and most burning is from lightning ignitions. California, on the other hand, sees high losses from wildfires and burns much more overall.

The paper concluded that all states could benefit from policies that address human-related ignitions, especially during late summer and fall and near developments, as well as policies that address fire-resistant building materials and consideration of nearby vegetation.

Finally, the authors said climate change mitigation is also essential. Longer fire seasons โ€“ a result of climate change โ€“ mean that human-related ignitions are more consequential, leading to more destructive wildfires in the fall and early winter when they were once rare.

The article, โ€œShifting social-ecological fire regimes explain increasing structure loss from Western wildfires,โ€ was co-authored by Higuera, Cook, Jennifer Balch, Natasha Stavros and Lise St. Dennis from CIRES Earth Lab, as well as Adam Mahood, now an ecologist with the Agricultural Research Service of the U.S. Department of Agriculture in Fort Collins.

###

Note: Higuera and co-authors published a companion article in the Conversation on Feb. 1 titled โ€œWestern wildfires destroyed 246% more homes and buildings over past decade โ€“ fire scientists explain whatโ€™s changing.โ€

Contact: Philip Higuera, UM professor of fire ecology, philip.higuera@umontana.edu; Maxwell Cook, CU Boulder doctoral student, maxwell.cook@colorado.edu.

Read the CU Bolder news release about this topic.

#ColoradoRiver District poll highlights voters’ #water concerns — The #GrandJunction Daily Sentinel #COriver #aridification

A lateral brings water from the Grand Valley Irrigation Company canal to this parcel of land, which is owned by private equity firm Water Asset Management, a company that has been accused of water speculation. A state work group has released its report on investment water speculation, but failed to come to a consensus and did not make recommendations to lawmakers. CREDIT: BETHANY BLITZ/ASPEN JOURNALISM

Click the link to read the article on the Grand Junction Daily Sentinel website (Dennis Webb). Here’s an excerpt:

About three-quarters or more of those polled identified as extreme or serious problems issues such as the levels of water in Colorado rivers, lower snowpack, availability of water for farming and ranching, wildfire conditions, and more frequent drought…Eight-four percent of respondents said they viewed out-of-state investment firms and hedge funds buying Colorado water rights, as has happened in Mesa County, as being very threatening to water availability on the Western Slope, and the same percentage consider out-of-state water interests like California to be very threatening. Seventy-eight percent said they consider foreign governments buying Colorado water rights to be very threatening, and 62% view water users from other parts of the state such as Denver and the Front Range as being very threatening…Four out of every five respondents said they would support a small tax increase dedicated to the river district to use easements to protect water, by employing land conservation agreements to pay willing agricultural producers to preserve their water right and keep that water in western Colorado…

Weigel said 53% of respondents in the eastern part of the district said water users from other parts of the state are very much a threat, even though it didnโ€™t rank among their top-five perceived threats.

โ€œLetโ€™s cut the crapโ€: #ColoradoRiver plan still isnโ€™t enough, experts say, and #California isnโ€™t on board — The #DenverPost #COriver #aridification

Updated Colorado River 4-Panel plot thru Water Year 2022 showing reservoirs, flows, temperatures and precipitation. All trends are in the wrong direction. Since original 2017 plot, conditions have deteriorated significantly. Brad Udall via Twitter: https://twitter.com/bradudall/status/1593316262041436160

Click the link to read the article on The Denver Post website (Conrad Swanson). Here’s an excerpt:

Evaporation and transfer loss is a meaningful starting point, Brad Udall, a water and climate scientist at Colorado State University, said. But the countryโ€™s two largest reservoirs, lakes Powell and Mead, are already at historic lows and waiting until they sink further to make cuts doesnโ€™t make sense.

โ€œLetโ€™s cut the crap,โ€ Udall said. โ€œWe donโ€™t have elevation to give away right now.โ€

All told, the six-state plan doesnโ€™t save the smallest amount of water required by the federal government. Evaporation, transfer loss and the tiered water cuts to the lower basin combine to save as much as 1.95 million acre-feet…At a minimum, the states must save 2 million acre-feet a year,ย federal officials announced last summer, but now water experts are wondering whether the basin must saveย three times that much, more than Colorado, New Mexico, Utah and Wyoming combined use in a single year…The existing proposal isnโ€™t enough to qualify as a long-term plan, but it might be enough for the basin to survive until it can agree on one, Udall said.

Federal officialsโ€™ reaction to the plan remains unclear. After the states published it Monday, a representative for U.S. Bureau of Reclamation Commissioner Camille Touton canceled a Tuesday morning interview with The Denver Post and directed questions to the U.S. Department of Interior, which offered no additional insight.

Two pumped #water storage projects move forward in #Colorado — @WaterEdCO

Shoshone Falls hydroelectric generation station via USGenWeb. Shoshone hydropower plant has the most senior, large-volume water right on the Colorado mainstem. The bonus for other users is that the water returns to the river after producing electricity.

Click the link to read the article on the Water Education Colorado website (Allen Best):

Two proposed pumped water storage projects that could expand Coloradoโ€™s ability to store renewable energy โ€“ one in Fremont County and another between Hayden and Craig in the Yampa River Valley โ€“ are moving forward.

Colorado will need green energy storage of some type if it is to attain its mid-century goals of 100% renewable energy. Solar and wind power are highly variable and cannot be turned off and on, like coal and natural gas plants are.

So the search is on for ways to build large-scale storage projects to hold the energy wind and solar generate. Lithium-ion batteries are part of the answer and are being rapidly added to supplement wind and solar. But they typically have a short life span, while pumped water storage hydropower projects can operate for decades.

Pumped storage hydro electric.

Pumped water storage has been refined in recent decades but the basic principles remain unchanged. Water is released from a higher reservoir to generate power when electricity is most in demand and expensive. When electricity is plentiful and less expensive, the water is pumped back up to the higher reservoir and stored until it is needed again.

This technology even today is responsible for 93% of energy storage in the United States, according to the U.S. Department of Energy. That includes Cabin Creek, Xcel Energyโ€™s 324-megawatt pumped storage unit near Georgetown. It was installed in 1967.

โ€œThese pumped-storage projects are anathema to the modern way of thinking,โ€ says Peter Gish, a principal in Ortus Climate Mitigation, the developer of the Fremont County pumped water storage project.

โ€œBut once built and operating, the maintenance costs are very, very low, and the system will last, if properly maintained, a century or longer. The capital investment up front is quite high, but when you run the financial models over 30, 50 or 60 years, this technology is, hands down, the cheapest technology on the market for [energy] storage.โ€

Ortus Climate Mitigation wants to build a 500-megawatt pumped water storage facility on the South Slope of Pikes Peak above the town of Penrose in Fremont County. This facility โ€“ essentially a giant battery for energy storage โ€“ would require two reservoirs.

Gish hopes to have a permit from the Federal Energy Regulatory Commission in 2026. Construction would take up to five years after the permit is approved.

In the Yampa Valley, another developer continues to plug away at a potential application for a site somewhere between Hayden and Craig. Still another idea is said to be in formulation in southwestern Colorado, but no details could be gleaned about that project.

Phantom Canyon, as Ortus calls its project in Fremont County, would require 17,000 acre-feet of water for the initial fill of the two reservoirs to be augmented by about 1,500 acre-feet annually due to losses from evaporation.

The company says it has accumulated water rights.

Gish, a co-founder of Ortus, says his company is โ€œkeenly awareโ€ of water scarcity issues in Colorado and looks into ways to reduce the evaporative loss and hence shave water needs. One option is to place solar panels over the reservoirs, producing energy while shading the water. On a vastly smaller scale, that has been done at the Walden municipal water treatment plant in north-central Colorado.

Unlike an unsuccessful attempt by Xcel in 2021 to build a pumped water storage project in Unaweep Canyon on federal land in Western Colorado, the Ortus project near Pikes Peak would involve only private land. The company has exclusive purchase options for 4,900 acres. It also has secured 12 easements for pipeline access from the lower reservoir to the Arkansas River.

Proximity to water sources matters, and so does the location relative to transmission. Penrose is about 30 miles from both Colorado Springs and Pueblo and major transmission lines.

The company last year laid out the preliminary plans with Fremont County planners and hosted a meeting in Canon City to which environmental groups and others were invited. By then, FERC had issued a preliminary permit which is the start of the permitting process. Gish, who has worked in renewable energy for 25 years, says no potential red flags were noted.

โ€œI have found that the local stakeholders are the first people you need to talk to about a project like this,โ€ Gish says, โ€œIf you are able to get local support, the rest of the pieces will tend to fall into place. If not, the rest of the process is a much more difficult proposition.โ€

In Western Colorado, Xcel faced local opposition but also the more daunting process of permitting for a project on federal land. In the Craig-Hayden area, Matthew Shapiro, a principal in green energy company Gridflex Energy, had been examining sites that are on private land. Work continues on geological assessments and other elements, but he says that a โ€œlot of other pieces need to come together before there is real progress.โ€

In addition to having water, that portion of the Yampa Valley also has the advantage of transmission lines erected to dispatch power from the five coal-burning units that are now scheduled to close between 2025 and 2030.

Shapiro hopes to also use Colorado-sourced water to generate electricity in a pumped-storage project on the North Platte River in Wyoming. Gridflex Energy filed for a license application with FERC last week for the project on Seminoe Reservoir.

โ€œVery few projects have made it that far since the turn of the millennium. Itโ€™s a pretty big deal,โ€ Shapiro said.

Long-time Colorado journalist Allen Best produces an e-journal called Big Pivots and is a frequent contributor to Fresh Water News.

Unaweep Canyon

As the #ColoradoRiver shrinks, federal officials consider overhauling #GlenCanyonDam — The Los Angeles Times #COriver #aridification

The back of Glen Canyon Dam circa 1964, not long after the reservoir had begun filling up. Here the water level is above dead pool, meaning water can be released via the river outlets, but it is below minimum power pool, so water cannot yet enter the penstocks to generate electricity. Bureau of Reclamation photo.

Click the link to read the article on The Los Angeles Times website (Ian James). Here’s an excerpt:

A preliminary analysis of potential modifications to the dam emerged during a virtual meeting held by the federal Bureau of Reclamation, which is also reviewing options for averting a collapse of the water supply along the river. These new discussions about retooling the dam reflect growing concerns among federal officials about how climate change is contributing to the Colorado Riverโ€™s reduced flows, and how declining reservoirs could force major changes in dam management for years to come…

Roerink and two other people who listened to the webinar told The Times that cost estimates for several alternatives ranged from $500 million to $3 billion. The agency will need congressional approval and will have to conduct an environmental review to analyze options. The Bureau of Reclamationโ€™sย presentation, given by regional power manager Nick Williams, included some additional alternatives that wouldnโ€™t require major structural modifications of the dam. Those options included adjusting operations to maximize power generation at low reservoir levels, studying ways of using the existing intakes at lower water levels, and making up for the loss of hydroelectric power by investing in solar or wind energy…

Low-Level Power Intake with New Low Head Runners (Alternative 1a. via USBR)

According to a slide presentation shown at the meeting, officials see potential hazards in some of the six alternatives. Piercing the damโ€™s concrete to create new low-level or mid-level intakes, for example, would entail โ€œincreased risk from penetration through dam,โ€ the presentation says. They also describe risks due to possible โ€œvortex formation,โ€ or the creation of whirlpools above horizontal intakes as the water level declines. Their formation could cause damage if air is pulled into the system. The presentation says one alternative would involve lowering the minimum power pool limit and possibly installing structures on the intakes to suppress whirlpools, but it said this still would not allow for the water level to go much lower.

A high desert thunderstorm lights up the sky behind Glen Canyon Dam — Photo USBR

Heavy snow comes to #PagosaSprings area — The Pagosa Springs Sun #SanJuanRiver #ColoradoRiver #COriver #aridification #snowpack

West snowpack basin-filled map February 18, 2023 via the NRCS

Click the link to read the article on the Pagosa Springs Sun website (Josh Pike). Here’s an excerpt:

Heavy snows have come again to Pagosa Country, with sites in Archuleta County receiving be- tween 6.1 and 13.1 inches of snow in the storms between Tuesday, Feb. 14, and 11 a.m. on Feb. 15, according to the Community Col- laborative Rain Hail and Snow Network website. Higher snowfall totals were concentrated in the northern and southern portions of the county, with the highest reported precipitation amount reported north of Pagosa Springs near Piedra Road.

A 6 a.m. Feb. 15 report from Wolf Creek Ski Area indicates that Wolf Creek had received 22 inches of snow in the previous 24 hours and 25 inches in the last week, bringing the midway snow depth to 101 inches and the year-to-date snow- fall total to 275 inches. According to the U.S. Department of Agriculture National Water and Climate Centerโ€™s snowpack report, the Wolf Creek summit, at 11,000 feet of elevation, had 26.3 inches of snow water equivalent as of 11 a.m. on Wednesday, Feb. 15. The Wolf Creek summit was at 121 percent of the Feb. 15 snow- pack median.

The San Miguel, Dolores, Animas and San Juan River basins were at 134 percent of the Feb. 15 median in terms of snowpack.

River Report

Stream flow for the San Juan River at approximately 11 a.m. on Feb. 15 was 66.3 cubic feet per second (cfs), according to the U.S. Geological Service National Water Dashboard. This reading is up slightly from last weekโ€™s reading of 55.9 cfs at 11 a.m. on Feb. 8. According to a Feb. 13 press release from Pagosa Area Water and Sanitation District (PAWSD) Manager Justin Ramsey, Lake For- est and Village Lake are full.

Pagosa Area Water & Sanitation District Vista Wastewater Treatment Plant upgrades could cost $15 million — The #PagosaSprings Sun #SanJuanRiver

Piedra River valley from Chimney Rock National Monument. By Dicklyon – Own work, CC BY-SA 4.0, https://commons.wikimedia.org/w/index.php?curid=82546701

Click the link to read the article on the Pagosa Springs Sun website (Josh Pike). Here’s an excerpt:

At its Jan. 30 meeting, the Pagosa Area Water and Sanitation Dis- trict (PAWSD) Board of Directors discussed state-mandated modi- fications to the Vista Wastewater Treatment Plant that come with a potential cost of $15 million during a public hearing on a potential State Revolving Fund (SRF) loan for the project. The modifications are intended to improve nutrient removal and allow the plant to comply with new state nutrient standards. Nutrient removal involves the removal of nutrients such as phosphorus or nitrogen, which can be damaging to drinking water and aquatic environments in high quan- tities, from wastewater.

According to the Colorado De- partment of Public Health and Environment (CDPHE), such nutrients from the Vista plant could impact both nearby drinking water wells and the Piedra River, claims disputed by PAWSD.

The hearing opened with PAWSD District Manager Justin Ramsey ex- plaining, in response to a question from board member Gene Tautges, that PAWSD is currently pursuing a โ€œpolitical routeโ€ in its efforts to delay the modifications and that it had some initial communication with Colorado Sen. Cleave Simpson.

If you are a beginning farmer, the Colorado Fruit & Vegetable Growers Annual Conference on Feb. 21-22 is a great place to network and get in the know! — #Colorado Department of Agriculture

Here’s the schedule, speakers, and sessions links.

Big Cities Are Downsizing Their Water Footprints — Sustainable Waters #conservation

Forty percent or more of all water use in western US cities goes to outdoor watering of lawns, gardens, pools, and golf courses. One of the most effective urban water conservation strategies is to reduce the area of irrigated landscaping, or switching to less water-intensive vegetation. Photo credit: Brian Richter

Click the link to read the article on the Sustainable Waters website (Brian Richter):

My research group spent three years collecting water data and other information from 28 water utilities that serve a total of 23 million people in the American Southwest. The task wasnโ€™t easy: 39 researchers were involved in collecting data from 45 different utility employees. Each of these utilities we surveyed is dependent on the Colorado River for some portion or all of their water supplies. You can find our full results in this paper from the Journal of Water Resources Management & Planning.*

Overall, cities dependent on the Colorado River have done a fantastic job of managing their total water use under very high rates of growth. Theyโ€™ve cut their water use by 18% while their populations grew by a whopping 24% during 2000-2020.

Big cities are doing a much better job with water conservation than smaller cities. Cities with more than 1 million residents cut their water use by an impressive 24% but water use in small cities actually grew by 3%. This is due to two factors: smaller cities are growing very fast, yet they donโ€™t have the financial capabilities to invest in water conservation programs.

Key to big water savings is being able to get your customers to substantially reduce their average daily use of water, known as โ€œGallons Per Capita per Dayโ€ (GPCD). On average, big cities (>1 million pop.) were able to lower their Total GPCD by 35%. Medium cities (100,000-1 million pop.) lowered their GPCD by 30%, and smaller cities (less than 100,000 pop) lowered it by 25%.

But even with impressively lower per-capita needs, smaller cities simply grew too fast (median=42% growth) to keep their overall water demands in check.

Some of the primary water conservation strategies being applied in these 28 cities include offering rebates for replacing old water-guzzling toilets and other plumbing fixtures, and paying homeowners and businesses to rip out lush green lawns and replace them with drought-tolerant and often native shrubs, flowers, and grasses. Many cities also used water rate structures to control water use, such as by increasing the cost per gallon as water use rises.

Not Much Help for the Colorado River, thoughโ€ฆ.

Unfortunately, those impressive water conservation efforts didnโ€™t do much for the Colorado River, because total use of the river by the 28 cities we surveyed actually increased slightly during 2000-2020. That means that cities are taking less water from other water sources โ€” such as their local rivers or from groundwater, or from desalination or water reuse โ€” but not reducing their pressure on the Colorado River.

Water Conservation is Still Largely Untapped

Based on the fact that per-capita water use varied greatly among our 28 cities (low of 80 to a high of 286 in Total GPCD), thereโ€™s clearly room for the under-performing cities to tighten up their water belts. In larger cities, there is still great potential for reducing outdoor water use, or tapping into โ€˜alternativeโ€™ water supplies, such as reusing water more thoroughly, capturing stormwater, or encouraging homeowners and businesses toย harvest rainwater.

The Southern Nevada Water Authority โ€” which supplies water to nearly 1.4 million residents in Las Vegas, Nevada โ€” is a great example of water conservationโ€™s potential. During 2000-2020, the city reduced its total water use by 10% and lowered its Total GPCD by 47%, even while its service population grew by a staggering 69%! Yet the water authority has set an admirable goal of lowering its GPCD by another 23% by 2035.

*Note: If you are unable to access our paper using the link in the first paragraph above, please drop me a note at brian@sustainablewaters.org and Iโ€™ll send you a copy.

Deadpool Diaries: The chance of deadpool declines — John Fleck @jfleck #GreenRiver #ColoradoRiver #COriver #aridification

the Lower Basin โ€œstructural deficitโ€, reified. Photo credit: John Fleck

Click the link to read the article on the InkStain website (John Fleck):

First the bad news from the Colorado Basin River Forecast Centerโ€™s mid-February forecast โ€“ this yearโ€™s runoff into Flaming Gorge, which is at record low thanks to Drought Response Operations Agreement releases to prop up Lake Powell, is forecast to be below average this year, at 86 percent of average. At some point weโ€™ve gotta refill this hole.

But the Lake Powell forecast continues to hover well above the โ€œaverageโ€ line, currently sitting at 117 percent.

Reclamationโ€™s latest 24-month study โ€œmost probableโ€ shows Powell bouncing back to above elevation 3,550. In the โ€œolden daysโ€ (like, last year?) 3,550 would have been awful, but in the midst of our current crisis management fire drill it looks pretty good.

Mead stays awful in the current โ€œmost probableโ€, ending the water year at elevation1,034, another 10 feet below current levels, which should be enough for photojournalists to find some fresh wrecked pleasure boats, or possibly mob hits.

Under the โ€œmin probableโ€, Powell ends the water year at 3,544 and Mead ends at 1,021.

To help frame the current discussions, hereโ€™s the hypothetical Lower Basin cuts under the six-state and California SEIS proposals under elevations in the min probable forecast:

cuts, by state, at Mead elevation 1,020-1,0256-state proposalCalifornia proposal
California1,424,000750,000
Arizona1,252,0001,568,000
Nevada67,00082,000
total2,743,0002,400,000

Solid start to 2022-23 snow season in Colorado: Water planners optimistic for a strong finish, but cautious — @DenverWater #snowpack

Click the link to read the article on the Denver Water website (Jay Adams):

The winter of 2022-23 is off to a cold and snowy start across most of Colorado, which is good news for the stateโ€™s water supply.

So far, water watchers say weโ€™ve had the best start for the statewide snowpack season since 2017. 

However, while some parts of the state, like Steamboat Springs, are seeing the highest snowpack levels in over a decade, numbers in some parts of the state are lagging.

Snowpack is a measurement of the amount of water packed into the snow.

Colorado Snowpack basin-filled map February 17, 2023 via the NRCS.

โ€œColorado is a big state and itโ€™s not uncommon to see a wide range of snow totals across various regions,โ€ said Nathan Elder, Denver Waterโ€™s manager of water supply.

For example, the snowpack in the northwest corner of Colorado sat at 151% of normal as of Jan. 31, but the southeastern corner was just at 83% of normal.


Sign up for our free, weekly TAP email to stay on top of this season’s snowpack. (Scroll down to put your email in the light blue sign-up bar.)


The amount of snow that falls in the mountains is critical in Colorado because thatโ€™s where most of the stateโ€™s water comes from each year.

Skiers enjoy a powder day at Winter Park Ski Resort in December 2022. The resort saw 85 inches of snow in January and reported receiving 226 inches of snow so far this season as of Jan. 31. Photo credit: Denver Water.

Denver Water provides water to 1.5 million people in Denver and several surrounding suburbs, and 90% of the utilityโ€™s water supply comes from snow. The utility collects water from roughly 4,000 square miles of terrain in the mountains and foothills west of Denver in the Upper Colorado and Upper South Platte river basins.

Denver Water collects roughly half of its water from the Colorado River Basin and half from the South Platte.

Denver Water collects water from across 4,000 square miles of forest that spans the Upper Colorado and the South Platte river basins. Image credit: Denver Water.

In the areas where Denver Water collects water, as of Jan. 31, the snowpack in the Upper Colorado River Basin stood at 111% of normal, while the Upper South Platte River Basin stood at 82% of normal.

Denver Water’s entire collection system. Image credit: Denver Water.
Seven SNOTEL stations in the area of the South Platte River Basin where Denver Water collects water are tracking below normal (the blue line) so far this season. Image credit: Denver Water.

โ€œThe difference in snowpack is why Denver Water has built a large collection system spread across several counties. That way if one area is having a down year, hopefully things are better in another area. And thatโ€™s what weโ€™re seeing so far this year,โ€ Elder said. 

Elder said this year the snowfall in the mountains has been steady since November 2022, compared with last winter, which will be remembered for having only a couple big storms that hit over the holiday season and ended up providing the bulk of the entire seasonโ€™s total snowfall.

โ€œAs a water planner, it would be nice to have a steady, predictable snowpack season, but weather doesnโ€™t work that way and each year plays out differently,โ€ Elder said. โ€œThatโ€™s why we constantly monitor the mountain snowpack and adjust our water planning accordingly.โ€


See how Denver Water monitors the snowpack from the air, on the ground and by using automated weather stations. 


Denver Waterโ€™s reservoir storage stood at 82% full heading into February, which is average for this time of year. Elder said heโ€™s cautiously optimistic the reservoirs will fill when the snow melts in the spring due to the snowpack so far.

Heโ€™s also encouraged by the fact that soil moisture for the state is the best itโ€™s been in eight years

โ€œWhen the soil moisture is in good shape, it means more water will flow into rivers and streams instead of being absorbed by dry ground,โ€ he said.

Denver Waterย monitors snowpackย throughout the winter season, using monthly measurements gathered by crews on the ground and daily reports from automated weather stations. The utility also gets information about the snowpack from planes surveying its collection system using high-tech equipment.ย 

Denver Waterโ€™s Rob Krueger (left) and Adam Clark work out of the utilityโ€™s Moffat Collection System office in Winter Park. Here they are weighing a snow sample to calculate how much water it contains. Photo credit: Denver Water.

This year, planes will fly over forests in Summit and Grand counties where Denver Water collects water โ€” and for the first time also will fly over the utilitiesโ€™ South Platte and South Boulder Creek watersheds.

โ€œWeโ€™ve got our snowiest months of the season coming up, and weโ€™re hoping the snow will keep falling,โ€ Elder said. โ€œSnowpack typically peaks around the third week of April, so thatโ€™s the key snowpack measurement weโ€™ll be watching.”

Elder said that even though water supply looks good now, the winter months are a great time to get your house into water-wise shape indoors by finding and fixing toilet leaks, installing low-flow aerators and replacing old showerheads with WaterSense-labeled fixtures.

Well, the West is Getting a Lot of Snow and Rain — Audubon #snowpack #ColoradoRiver #COriver #aridification

The Colorado River flows through Gore Canyon in Colorado. Photo: Mitch Tobin/The Water Desk

Click the link to read the article on the Audubon website (Jennifer Pitt):

Itโ€™s early January, and while snow season in the Southern Rockies continues for another three months, we already see snowpack at 59% of the seasonal average. That is something to celebrate, as the Colorado River Basin has been in an extended drought going on 24 years, with consequences for people, birds and every other living thing that depend on rivers in this region. But the abundant start to the snow season does not mean Colorado River managers get a reprieve from their aggressive efforts to reduce water use and reform Colorado River operations.

In recent years we have seen โ€œabove averageโ€ early season snowpack turn into below average snowpack and far-below-average runoff. In 2021 for instance, 85% of average snowpack turned into runoff of 36%. A variety of factors created these dynamics, including fewer storms later in the snow season, warmer temperatures both increasing evaporation and evapotranspiration (evaporation from plants) and drying out soils which then soak up melting snow. Of course, we donโ€™t yet know this how this year will turn out for Colorado River water supply. Butย weย know it is too early to draw conclusions, other than โ€“ย gee, sure would be nice if it keeps snowing.

With Colorado River reservoirs two-thirds empty, federal and state water managers have sounded alarms, pointing to the risk of infrastructure failure and even the ability to deliver water and hydroelectric power to tens of millions of people. The available storage space in the reservoirs can hold more than three years of the Colorado Riverโ€™s average undepleted flow. So even a bomber snow season is not going to end the drought. Tom Buschatzke, who leads the Arizona Department of Water Resources acknowledged this in a recent interview with CNN:  “One good year doesn’t fix usโ€”even a couple of good years doesn’t fix usโ€ฆWe’ve got to rebuild that bank account.”

With climate warming projected to increase, thereโ€™s an urgent need to balance Colorado River water uses with supply, even to reduce uses below supply so that thereโ€™s less risk to the dams, to people and to nature. Best to keep the pedal to the floor on reforming Colorado River managementโ€”because while winter storms areย inherently good for water supplies, there is noย guarantee winters will be long, sustained, or consistent.

#California Rejected a #ColoradoRiver #Water Use Plan and Now Has Its Own. But the Issue is Far From Settled — LAist #COriver #aridification

Lake Mead and the Hoover Dam on the border between Nevada and Arizona on the morning of Friday, April 8, 2022. (Tim Lenard/The Nevada Independent)

Click the link to read the article on the LAist website (Erin Stone), publishedย Feb 1, 2023 2:44 PM:

This article was originally published by LAist on February 1, 2023

The seven states that draw from the Colorado River missed another deadline from the federal government to come up with an agreement to cut total water use by 2 to 4 million acre-feet.

Late Tuesday, California released its own plan after not signing on to a proposalagreed upon by six states to cut about 2 million acre-feet. Both plans agree we need to cut down a lot more on water use, but who shoulders the biggest cuts remains a question.

The Colorado River provides water to more than 40 million people and hundreds of thousands of acres of farmland in Wyoming, Colorado, New Mexico, Utah, Arizona, Nevada and California, plus two Mexican states (Baja California and Sonora).

California gets the most water from the river of any state, and the riverโ€™s main reservoirs โ€” Lake Powell and Lake Mead โ€” are two of our biggest water sources in the Southland (Lake Powell is also a major source of clean hydroelectric power). The river has long been overused โ€” and the climate crisis is pushing a reckoning with a century-old water rights law that many say is outdated in our hotter and drier reality.

Complicated Legal Rights

Last year, the federal government told the seven U.S. states that rely on the Colorado River to come up with a voluntary plan to cut total water use by 2 to 4 million acre-feet โ€” or face federal mandates. For context, California is legally entitled to 4.4 million acre-feet of water from the river every year.

The All-American Canal conveys water from the Colorado River to the Imperial Valley in Southern California. The Imperial Irrigation District is the largest user of Colorado River water. CREDIT: HEATHER SACKETT/ASPEN JOURNALISM

Most of the legal rights to that water are held by farmers in the arid Imperial Valley. The next biggest bucket goes to the Metropolitan Water District of Southern California, which serves 19 million people in cities across the Southland.

Lack of snowpack in the Sierra Nevadas and the crisis on the Colorado led to millions of people in Southland cities being put under outdoor watering restrictions. In Los Angeles, you can only water twice a week, though watering food gardens and trees by hand is allowed whenever needed. 

The crisis on the Colorado River could eventually bring more restrictions.

Two Proposals

After missing an initial deadline last August, on Tuesday six of the seven states releasedย a proposalย to cut water use by about 1.5 million acre-feet per year โ€” calling on California to shoulder the biggest cuts.

California didnโ€™t sign on, citing its senior water rights (the current rules say California is last to lose its water amid a shortage). In response, state officials released another plan that leaves the bulk of water cuts over the next few years to Arizona and Nevada (which have both faced unprecedented cuts to their usual shares over the last two years). California would curb its own water use 9% through 2026, when the current water shortage rules expire.

Both plans would lead to 2 to 3 million acre-feet of water cuts in 2024, but big disagreements remain on how to achieve those cuts.

That lack of consensus could spur federal mandates and lawsuits from the states, which could delay solutions. The current rules expire in 2026. By then, the states and federal government will need a more permanent plan for Colorado River water use. 

A final decision on the plan until then is expected by summer.

The Rockies are having a snowy winter, but not all of that #water will make it to the #ColoradoRiver — KUNC #COriver #aridification #snowpack

West snowpack basin-filled map February 15, 2023 via the NRCS.

Click the link to read the article on the KUNC website (Alex Hager). Here’s an excerpt:

New data show a snowy start to 2023 for the Colorado River basin. Inflows into Lake Powell, the nationโ€™s second largest reservoir, are currently projected to be 117% of average during spring runoff thanks to heavy winter precipitation in the Rocky Mountains… Snow in Colorado is an important factor in determining the amount of water that will flow into the Colorado River system each year. About two-thirds of annual flow starts as snow high in the mountains of Colorado. Across the state, snow totals are almost all above average, withย most zones showingย 120 to 140% of normal for this time of year. Northwest Wyoming and central Utah, which also contribute to the basinโ€™s water supply, posted January snowfall totals that nearly broke precipitation records. Many parts of Utah are showing snow totals above 170% of average, boosting the odds of above-average runoff in the spring, and fostering memorable seasons for theย areaโ€™s ski resorts

New data from the Colorado Basin River Forecast Center show heavy precipitation through much of the Colorado River Basin states โ€“ especially Utah, Wyoming and Arizona.

In the Colorado Riverโ€™s Upper Basin โ€“ which includes parts of Wyoming, Colorado, Utah, and New Mexico โ€“ the strongest precipitation fell in southwestern Colorado. The Gunnison, Dolores and San Juan rivers all saw January precipitation that ranged from 160 to 200% of average. Meanwhile, the lowest January precipitation totals were along the Eagle River in central Colorado, and the Green River above Fontenelle Reservoir in Wyoming. The Lower Colorado River Basin โ€“ which includes parts of Nevada, Arizona, and California โ€“ also saw strong precipitation. The Virgin, Little Colorado and Verde rivers all saw January precipitation above 200% of normal. Rain and snow in the Lower Basin is typically less important for the Colorado Riverโ€™s flow, but is helpful for plants, farms and ranches and wildfire mitigation…

When it comes to predicting the amount of water in the Colorado River each year, snow totals donโ€™t tell the full story. Scientistsย look to soil moistureย for a clearer picture of how much water will actually reach the places where humans divert and collect it. This year, soil moisture in the mountains is well below average. That could prevent some melting snow from ever reaching the Colorado River. That soil acts like a sponge, soaking up water before it has a chance to flow downhill to streams and lakes. Scientists have recorded years with 90% of average snowpack, only to see 50% of average runoff into reservoirs.

Does #Colorado need #water-use standards given the impacts of #aridification?: Agriculture uses the vast majority of water in Colorado, but its cities depend upon #ColoradoRiver diversions. That just might be a problem. Some solutions? @BigPivots #COriver

Leyden area lawn. Photo credit: Allen Best

Click the link to read the article on the Big Pivots website (Allen Best):

Let me give you a precise example of what weโ€™re talking about. An infill housing development took shape a couple of years ago near the Arvada High School in metropolitan Denver.

My midnight walksโ€”itโ€™s safer to walk thenโ€”often take me up that hill above the baseball diamond where grass was planted next to a row of mini-mansions. Rarely, if ever, will anybody set foot on that basketball court-sized plot of grass save to mow it.

Why was the turf planted? Likely because thatโ€™s the way it was always done. What I know with greater certainty is that roughly 75% of the water for this municipality comes from tributaries of the Colorado River. And I also know that these water rightsโ€”Arvada gets water from Denver Waterโ€”are junior to the 1922 Colorado River Compact. Water did not begin flowing through the Moffat Tunnel until 1936.

Huffing up the hill past this ornamental turf, I ask myself, โ€œDonโ€™t they know that adding turf in metro Denver or, for that matter, Grand Junction, during this time of rapid climate change is deeply problematic? Doesnโ€™t this qualify as either terribly ignorant or, just perhaps, arrogant?โ€

In Colorado, weโ€™ve resumed our conversation about how we use water and, more broadly, the type of development we want to see. Gov. Jared Polis made housing a central portion of his state-of-the-state address in early Januaryโ€”and he cycled around again and again to frame it within an ecosystem of impacts and goals, including water. He mentioned water 24 times in his address:

โ€œLet me be clear โ€“ housing policy is climate policy.

Housing policy is economic policy.

Housing policy is transportation policy.

Housing policy is water policy.โ€

On Jan. 26, in an address to the Colorado Water Congress, Polis made it a little more clear what he has in mind. He called for a โ€œcomprehensive approach to housing to preserve our water resources.โ€ He cited multiple benefits for revised land-use policies: reduced traffic, saved money for consumers and โ€“ most important, he added, it โ€œlimits demand on water resources.โ€

Polis said the Colorado Water Conservation Board will lead a study on integrating land use and water demand.

Front yard in Douglas Countyโ€™s Sterling Ranch are sparse on turf. Houses use well below the average volumes for Colorado. Photo/Allen Best

This 21-member Urban Landscape Conservation Task Force is to include representatives from 8 water utilities, 2 conservation districts, 2 environmental NGOs, with the balance to come from areas of expertise and interests such as stormwater, equity, and urban planning.

Looming over the three-day Water Congress conference was the future of the Colorado River. Attorney General Phil Weiser and Becky Mitchell, the director of the Colorado Water Conservation Board, both spoke from the same script. They said Colorado has kept within its limits as specified by the compact. The problems of the Colorado River are due very fundamentally to overuse by the lower-basin states, particularly California.

โ€œDenial is not just a river in Egypt,โ€ Weiser said.

Mitchell reported that Colorado and the three other upper-basin states in 2020 used altogether 3.5 million acre-feet compared to the 7.5 million acre-feet Colorado River Compact apportionment. The lower-basin states used on the order of 10 million acre-feet. The upper basin states live within what the climate delivers, she said, while the lower-basin states have lived beyond their means, steadily draining the federal reservoirs, both big and small. โ€œThey must do something, they must do it now,โ€ Mitchell said.

On Jan. 30, an agreement was announced among six of the seven states โ€“ California was the hold-out. It didnโ€™t impress many people.

โ€œLetโ€™s cut the crap,โ€ Brad Udall, who has emerged in the last decade as one of the most insightful observers of the Colorado River, told The Denver Post. โ€œWe donโ€™t have elevation to give away right now,โ€ a reference to elevations of the two big reservoirs, Mead and Powell.

Some homes in Erie have almost football field-sized back yards. Photo/Allen Best

Sounds simple enough. We wear the white hats. Yet Eric Kuhn, a former long-time manager of the Colorado River Water Conservation District, said itโ€™s not really that simple. Heโ€™s parsed the agreements at length in a book he co-authored called โ€œScience Be Dammed,โ€ a history of the Colorado River Compact, as well as various other papers and studies.

Kuhn said itโ€™s not a given that Colorado municipal water providersโ€”most of whom have water rights junior to the Colorado River Compactโ€”will always be able to access the Colorado River and its tributaries. And having no water is not an option.

โ€œCurtailment of those junior users is not acceptable at any time in the future,โ€ said Kuhn.

But the only logical place for growing towns and cities to expand their water portfolios is from water users with senior appropriations, namely agriculture.

Kuhn and Jennifer Gimbel, the director of the Colorado Water Conservation Board from 2008 to 2013, in November completed a report commissioned by the Common Sense Institute. Itโ€™s called โ€œAdapting Coloradoโ€™s Water Systems for a 21st Century Economy and Water Supply.โ€

When we spoke several days after the water conference, Gimbel reminded me that it was written for a business audience understanding that it needed to include the water community. โ€œIt was our opportunity to tell the business community โ€˜pay attention, because what happens with water is going to affect our economy one way or another.โ€™โ€

This is from Big Pivots 67, a reader-supported e-journal covering climate change and the resulting energy and water transitions in Colorado.

Useful to this understanding is the Common Sense Instituteโ€™s mission statement:

โ€œCommon Sense Institute is a non-partisan research organization dedicated to the protection and promotion of Coloradoโ€™s economy. CSI is at the forefront of important discussions concerning the future of free enterprise in Colorado and aims to have an impact on the issues that matter most to Coloradans.โ€

The report cites the need for demand-mitigation measures such as removing non-functional turf in new development. They cite the examples of Sterling Ranch, a tiny project in Douglas County where the developers, because they had little water, were forced to figure out how to minimize water use. They also cite Aurora, which last year adopted regulations that dramatically ratchet down water for new development.

They say this must become more common as Coloradoโ€™s population grows.

โ€œLacking statewide or regional standards, home developers are free to choose cities with less strict conservation standards,โ€ they wrote. โ€œRegional approaches are needed.โ€

They suggest regional conservancy and conservation districts might be a vehicle in lieu of statewide standards. They also cite WISE, the project in metro Denver and several of its suburban water providers, particularly those on the south side.

Lake Powell has been about a quarter-full. The snowpack looks strong now, but itโ€™s anybodyโ€™s guess whether there will be enough runoff come April and May to substantially augment the reservoir. May 2022 photo/Allen Best

The report, if broad-ranging and data-rich, also has a vagueness to it on this point. Gimbel says that lack of specificity was intentional. โ€œThe idea of demand-management measures in the report was left vague for a reason,โ€ she says. โ€œWe purposefully did not develop it more, to allow discussion already taking place to maybe morph into broad action.โ€

โ€œWe have to do more with less,โ€ said Kuhn. He cited projected population growth of 1.6 to 1.8 million new residents by 2050, most along the Front Range, but also the probability that the warming climate will make less water available, particularly from the Colorado River.

At several times during their Water Congress presentation, Gimbel and Kuhn acknowledged that state-wide standards would be an uphill struggle. In Colorado, towns, cities, and counties have traditionally called their own shots on land use and other development questions.

This is starting to shift, though. It is clear in Coloradoโ€™s agenda on reducing greenhouse gas emissions. But even here, thereโ€™s a balancing act. Legislatorsโ€”with the consent of Polisโ€”have told the investor-owned utilities they must meet carbon reduction goals. They have delivered the same mandate to Tri-State Generation and Transmission, which operates in ways that somewhat resemble those of Xcel.

But legislators left alone the municipal providers and the independent electrical cooperatives, instead choosing to persuade. It always helps, though, when the market is marching at a fast pace in the same direction.

In what I see as a direct parallel, the state recently has started to apply pressure to local jurisdictions to get ready for electrification in their building codes. Thereโ€™s some wiggle room for local jurisdictions, but itโ€™s not the free-for-all of yesteryear. Climate change forces a more urgent focus on issues we would have faced anyway but for other reasons.

Colorado has been having this water conversation for a while. In 2014, Ellen Roberts, then a state senator from Durango, and Don Coram, then a state representative from Montrose, introduced a conservation bill called โ€œLimit Use of Ag Water for Lawn Irrigation.โ€

Local governments didnโ€™t want the state stepping in. And there was pushback from the ag sector. โ€œIf itโ€™s water intensive, are you going to tell us that we canโ€™t grow that?โ€ one agriculture sector representative responded.

In the end, the bill became a study bill, the idea directed to an interim committee for further study. That, notes Roberts, is where bills commonly get sent to die. In this case, though, the conversation continuedโ€”and that was what she had intended all along.

โ€œMy concern was that if we waited for that to happen naturally, it might never happen or it would be so slow that it would have no meaningful impact,โ€ she says.

If the proposal was watered down, so to speak, even some legislators from the Western Slope who might not vote for it were โ€œappreciative that somebody was willing to walk the plank on the topic.โ€ In Durango itself, support ranged from those on the far left to those on the far right of the political spectrum.

The same issues that Roberts encountered are still very much alive.

Aurora, if lately a shining light for advocates of demand-management policies, harbors skepticism of mandates. โ€œAurora must retain control of what our city looks like,โ€ says Greg Baker, the cityโ€™s spokesman. Guidelines could be acceptableโ€”and smaller water municipalities could very well use help in delivering incentives.

This said, Aurora is open to discussion โ€œand it needs to be a proportional discussion,โ€ says Baker. โ€œWe donโ€™t want to tell agriculture how to use their water, but they account for 85% of water use in this state.โ€

On Jan. 31, in a legislative forum sponsored by Empower our Future, a Boulder County energy-focused organization, I asked State Sen. Fenberg, the Senate president, if the legislative broad brushes to advance the Polis land-use agenda could be described. He didnโ€™t deliver specifics, but he did a good job of describing the dynamics of what he called a โ€œthird-rail issue.โ€

โ€œIt will come down to what things should stay at the local level and I think the vast majority will remain at the local level.โ€ That said, he continued, the question remains of how we go about this in ways to advance Coloradoโ€™s other goals.

More issues have become statewide in nature. More state funding has been advanced for funding to expand housing. Water use is associated with housing, so the state has a connected interest, he suggested.

โ€œBecause of that, I think people have started asking more questions. If it is a state problem, shouldnโ€™t the state be more involved in either solving the problem or stopping the problem from getting worse?โ€

It will be, he concluded, a โ€œtough conversation.โ€ Laws governing water move slowly, and speakers at the Water Congress repeatedly said it is wise to move cautiously. Can the rapidly changing water story in the Colorado River Basin and the changing climate that is producing the crisis abide caution?

The latest seasonal outlooks (through May 31, 2023) are hot off the presses from the #Climate Prediction Center: No expectation for #drought to redevelop over the mountains and W. #Colorado

#Drought news February 16, 2023: Portions of #NewMexico and S. #Colorado recorded above-normal precipitation

Click on a thumbnail graphic to view a gallery of drought data from the US Drought Monitor website.

Click the link to go to the US Drought Monitor website. Here’s an excerpt:\

This Week’s Drought Summary

An active weather week over much of the South, Southeast and portions of the Midwest allowed many locations in eastern Oklahoma, northern Arkansas, central Mississippi, northern Florida, southern Georgia and into coastal areas of South Carolina to record above-normal precipitation. Dry conditions dominated the West and northern Plains. Temperatures were well above normal in the northern Plains and upper Midwest, with departures of 15-20 degrees above normal. Most areas east of the Missouri River were above normal for the week with departures of 5-15 degrees above normal common. Cooler-than-normal temperatures dominated the intermountain West and into the Four Corners region where temperatures were 5-10 degrees below normal for the week…

High Plains

Temperatures for the week were warmest over the eastern and northern extent of the region with departures 10-15 degrees above normal while the western areas were 5-10 degrees below normal in portions of Wyoming and Colorado. Most of the region was dry this week with the exception of eastern Kansas where over 200% of normal precipitation was recorded for the week. As temperatures warmed up and the benefits of the snowpack over portions of southern South Dakota and northern Nebraska started to be observed, improvements were made this week to the drought intensity levels along the South Dakota and Nebraska borders. A full category improvement was also made to conditions in eastern Kansas where more moderate drought was eliminated and improvements to severe and extreme drought were made in southeast portions of the state. Some slight degradation was introduced in Wyoming where severe drought was expanded in the east and southwest portions of the state…

West

Cooler-than-normal temperatures dominated most of the region outside of Montana where temperatures were 15-20 degrees above normal for the week. Most of the region was dry with only portions of New Mexico, southern Colorado, southern Montana and portions of the Pacific Northwest recording above-normal precipitation. Snowpack over the region remains well above normal. With the continued wet pattern over the Southwest, portions of Arizona and New Mexico were improved this week with moderate drought and abnormally dry conditions reduced in both states. Drier conditions in Washington allowed for some expansion of abnormally dry conditions while a reassessment of the extreme drought in northwest Nevada determined that conditions had improved enough to remove all of the extreme drought in this region…

South

Precipitation was widespread throughout most of eastern Oklahoma, northern Texas, northern Arkansas and portions of southern Louisiana with most of these areas recording 150-200% of normal precipitation for the week. Temperatures were warmest in the eastern extent where Arkansas and Louisiana were 4-6 degrees above normal while most of Oklahoma and Texas were 2-4 degrees below normal. The recent wetter pattern allowed for most of eastern Oklahoma to observe a full category improvement to the drought intensities with abnormally dry conditions removed from the eastern extent and some exceptional drought improved as well. Areas of eastern Texas had improvements made to moderate drought and abnormally dry conditions but saw degradations, mainly on long-term indicators highlighting the changes over portions of the panhandle, central and south Texas…

Looking Ahead

Over the next 5-7 days, a storm system will track out of the Four Corners region and onto the Plains, bringing with it widespread precipitation from Colorado, through the Plains and into the Midwest. Widespread precipitation is also expected throughout the South and into the Mid-Atlantic where up to 2-3 inches of rain is anticipated. Much of the southern and northern Plains as well as the West will be dry during this time. Temperatures are expected to be above normal over much of the southern Plains, Midwest and eastward with departures of 8-10 degrees above normal. Cooler-than-normal temperatures are expected over the central to northern Plains, and over the West where departures of up to 15 degrees below normal will be expected over Wyoming.

The 6โ€“10 day outlooks show above-normal chances of below-normal temperatures over the northern Rocky Mountains, the Pacific Northwest and much of the West. The best chances of above-normal temperatures will be over the Southeast and through much of the South and Mid-Atlantic. Most of the country is showing above-normal chances of recording above-normal precipitation with the best chances over the Great Basin and in the Mid-Atlantic. South Texas and the peninsula of Florida are still showing a better likelihood of below-normal precipitation.

US Drought Monitor one week change map ending February 14 2023.

Support for #Conservation Remains High in the West Despite a Rise in Other Concerns, New Poll Finds — State of the Rockies Report

Click the link to read the release on the State of the Rockies website [Spanish version here] (Jacob Hay):

Thirteenth annual Conservation in the West Poll reveals voters not willing to go backwards on conservation progress to address gas prices, cost of living, or water shortages

COLORADO SPRINGSโ€”Colorado Collegeโ€™s 13th annual State of the Rockies Projectย Conservation in the West Pollย released today [February 16, 2023] shows strong support for conservation policies among Westerners even as concerns around gas prices, cost of living, drought and water shortages remain high.

The poll, which surveyed the views of voters in eight Mountain West states (Arizona, Colorado, Idaho, Montana, Nevada, New Mexico, Utah, and Wyoming), found support in theย 70 to 90 percentย range for conservation goals like protecting wildlife habitats and migration routes, ensuring healthier forests, preventing light pollution that blocks out the stars, and safeguarding drinking water.

From Bears Ears National Monument. Photo credit: Jonathan Thompson

82 percentย of Westerners support achieving a national goal of conserving 30 percent of land and inland waters in America, and 30 percent of ocean areas, by the year 2030. Support for that proposal is upย 9 percentย since 2020, while opposition to the goal dropped byย 5 percentย during that time. In order to further conservation progress,ย 84 percentย of Westerners support presidents continuing to use their ability to designate existing public lands as national monuments to maintain public access and protect the land and wildlife for future generations.

Voters express higher levels of concern than in the past over several issues that impact Western lifestyles. Asked what they consider to be extremely or very serious problems for their state, 65 percent of Westerners point to inadequate water supplies, 67 percent say drought, 69 percent say the low level of water in rivers, 78
percent 
name the rising cost of living, and 60 percent say the price of gasoline.

Those spiking concerns, however, are not dampening enthusiasm for conservation action across the West. Support remains high for a range of policies aimed at protecting land, water, air, and wildlife, including:

Highway 160 wildlife crossing 15 miles west of Pagosa Springs. Photo credit: Allen Best

85 percentย support constructing wildlife crossing structures across major highways that intersect with known migration routes.

The tallest dunes in North America are the centerpiece of a diverse landscape of grasslands, wetlands, forests, alpine lakes and tundra at Great Sand Dunes National Park in Colorado. Photo credit: The Department of Interior

84 percentย support creating new national parks, national monuments, and national wildlife refuges and Tribal protected areas to protect historic sites or areas of outdoor recreation.

Community solar garden in Arvada. Photo credit: Allen Best/Big Pivots

67 percentย support gradually transitioning to 100 percent of energy being produced from clean, renewable sources like solar and wind over the next ten to fifteen years.

Hey, World! I’m Tye, and I’ve been hiking for about 10 years. Come join me on this hiking journey throughout the state of New York. To learn more about me: https://youtu.be/GH2NqOEWJoc. Photo credit: Hiking While Black

76 percentย support directing funding to ensure adequate access to parks and natural areas for lower- income people and communities of color that disproportionately lack them.

Western San Juans with McPhee Reservoir in the foreground from the Anasazi Center Dolores

85 percentย support ensuring Native American Tribes have greater input into decisions made about areas on national public lands that contain sites sacred or culturally important to their Tribe.

โ€œThis year voters in the West have a lot on their minds, but they are not willing to trade one priority for another,โ€ said Katrina Miller-Stevens, Director of the State of the Rockies Project and an associate professor at Colorado College. โ€œHigh gas prices, increasing costs of living, and water shortage concerns are not enough to move Westerners to reconsider their consistent support for conservation policies or seek out short-sighted solutions that put land and water at risk. In fact, people in the West want to continue our progress to protect more outdoor spaces.โ€

Dories at rest on a glorious Grand Canyon eve. Photo by Brian Richter

Locally, a variety of proposed conservation efforts are even more popular with in-state voters than they were when surveyed last year. In Arizona, 62 percent of voters support legislation to make permanent the current ban on new uranium and other mining on public lands surrounding the Grand Canyon. 90 percent of Coloradans agree with protecting existing public lands surrounding the Dolores River Canyon to conserve important wildlife habitat, safeguard the areaโ€™s scenic beauty, and support outdoor recreation. 84 percent of Montanans support enacting the Blackfoot Clearwater Stewardship Act to ensure hunting and fishing access, protect stream flows into the Blackfoot River, and add eighty thousand acres of new protected public lands for recreation areas, along with timber harvest and habitat restoration. In New Mexico, 88 percent of voters want to designate existing public lands in the Caja del Rio plateau as a national conservation area to increase protections for grasslands and canyons along the Santa Fe river and other smaller rivers flowing into the Rio Grande. 83 percent of Nevadans want to designate existing public lands in southern Nevada as the Spirit Mountain National Monument to ensure outdoor recreation access and help preserve sacred Native American sites.

Voters call for bold action on water conservation in line with heightened concerns

The level of concern among Westerners around water issues remains high in this yearโ€™s poll even amidst a notable uptick in winter precipitation across the West.

Colorado River “Beginnings”. Photo: Brent Gardner-Smith/Aspen Journalism

The Colorado River is held in high regard by voters in the states that rely on it. 86 percent say the Colorado River is critical to their stateโ€™s economy and 81 percent view it as an attraction for tourism and recreation. At the same time, 81 percent of voters say the Colorado River is at risk and in need of urgent action.

Concerns about water availability in the West translate into support for a variety of water conservation efforts, including:

95 percent support investing in water infrastructure to reduce leaks and waste.
88 percent support increasing the use of recycled water for homes and businesses.

87 percent support requiring local governments to determine whether there is enough water available before approving new residential development projects.

80 percent support providing financial incentives to homeowners and businesses to replace lawns and grassy areas with water-saving landscaping.

62 percentย support prohibiting grass lawns for new developments and homes.

Rancher Bryan Bernal irrigates a field that depends on Colorado River water near Loma, Colo. Credit: William Woody

54 percentย support providing financial incentives to farmers to temporarily take land out of production during severe water shortages.

Despite concerns over higher gas prices and cost of living, voters want a cleaner and safer energy future on public lands

In the face of higher gas prices and increased costs of living, Westerners still support proposals to limit the volume and impacts of oil and gas drilling on public lands.

The Four Corners methane hotspot is yet another environmental climate and public health disaster served to our community by industry. But now that weโ€™ve identified the sources we can begin to hold those responsible accountable for cleaning up after themselves. The BLM methane rule and EPA methane rule are more clearly essential than ever. Photo credit: San Juan Citizens Alliance (2018)

91 percent support requiring oil and gas companies to use updated equipment and technology to prevent leaks of methane gas and other pollution into the air. 91 percent of voters support requiring oil and gas companies, rather than federal and state governments, to pay for all of the clean-up and land restoration costs after drilling is finished. 72 percent of voters support only allowing oil and gas companies the right to drill in areas of public land where there is a high likelihood to actually produce oil and gas.

Asked what should be the highest priority for meeting Americaโ€™s energy needs, 65 percent of Westerners say it should be reducing our need for more coal, oil and gas by expanding the use of clean, renewable energy. That is compared to 32 percent who favor drilling and digging for more oil and gas wherever we can find it.

Given a choice of public lands uses facing lawmakers, 68 percent of voters prefer ensuring we protect water sources, air quality, and wildlife habitat while providing opportunities to visit and recreate on national public lands. By contrast, only 26 percent of voters would rather ensure we produce more domestic energy by maximizing the amount of national public lands available for responsible oil and gas drilling and mining.

This is the thirteenth consecutive year Colorado College gauged the publicโ€™s sentiment on public lands and conservation issues. The 2023 Colorado College Conservation in the West Poll is a bipartisan survey conducted by Republican pollster Lori Weigel of New Bridge Strategy and Democratic pollster Dave Metz of Fairbank, Maslin, Maullin, Metz & Associates. The survey is funded by the William and Flora Hewlett Foundation.

The poll surveyed at least 400 registered voters in each of eight Western states (AZ, CO, ID, MT, NV, NM, UT, & WY) for a total 3,413-voter sample, which included an over-sample of Black and Native American voters. The survey was conducted between January 5-22, 2023 and the effective margin of error is +2.4% at the 95% confidence interval for the total sample; and at most +4.9% for each state. The full survey and individual state surveys are available on theย State of the Rockies website.

Colorado College is a nationally prominent four-year liberal arts college that was founded in Colorado Springs in 1874. The College operates on the innovative Block Plan, in which its 2,200 undergraduate students study one course at a time in intensive three and a half-week segments. For the past eighteen years, the college has sponsored the State of the Rockies Project, which seeks to enhance public understanding of and action to address socio-environmental challenges in the Rocky Mountain West through collaborative student-faculty research, education, and stakeholder engagement.

About Fairbank, Maslin, Maullin, Metz & Associates

Fairbank, Maslin, Maullin, Metz & Associates (FM3)โ€”a national Democratic opinion research firm with offices in Oakland, Los Angeles and Madison, Wisconsinโ€”has specialized in public policy oriented opinion research since 1981. The firm has assisted hundreds of political campaigns at every level of the ballotโ€”from President to City Councilโ€”with opinion research and strategic guidance. FM3 also provides research and strategic consulting to public agencies, businesses and public interest organizations nationwide.

About New Bridge Strategy

New Bridge Strategy is a Colorado-based, woman-owned and operated opinion research company specializing in public policy and campaign research. As a Republican polling firm that has led the research for hundreds of successful political and public affairs campaigns we have helped coalitions bridging the political spectrum in crafting winning ballot measure campaigns, public education campaigns, and legislative policy efforts. New Bridge Strategy helps clients bridge divides to create winning majorities.

About Hispanic Access Foundation

Hispanic Access Foundation connects Latinos and others with partners and opportunities to improve lives and create an equitable society.

Billions in federal farm payments flow to a select group of producers, report shows: Colorado ranks 19th for farm subsidies among states — #Colorado Newsline

A farmer plows a field east of Las Animas in Bent County, Colo. July 25, 2019. (Mike Sweeney For Colorado Newsline)

Click the link to read the article on the Colorado Newsline website (Allison Winter):

The top 10% of recipients of federal farm payments raked in more than 79% of total subsidies over the last 25 years โ€” producing billions of dollars for a relatively small group of U.S. producers, according to a new analysis of federal data from an environmental group.

In total, the federal government paid more than $478 billion from 2015 to 2021 in farm support for crop insurance, disasters, conservation payments and subsidies for certain crops like corn and soybeans, according to theย analysis of federal dataย the Environmental Working Group released Wednesday [February 1, 2023].ย 

The U.S. Agriculture Department programs support hundreds of thousands of producers across the country. But a select group of super collectors is bringing in an outsized portion of farm subsidies. 

The top 1% collected 27% of total subsidies between 1995 and 2021, according to the report.  

Some of the farm payments are more opaque. The government does not release information on all of the individuals who receive support for crop insurance. And the Trump administration changed how it reported some farm subsidies, so it lists them by banks instead of individuals, making it harder to see who received some of the payments from 2019 to 2021. 

More than half of farm subsidies over the last 25 years were commodity payments to crops like corn, soybeans, wheat, cotton and rice, according to the EWG database. 

โ€œBased on what we do know, we can still see the most successful farm businesses are still collecting the lionโ€™s share of subsidies โ€ฆ while the vast majority of farmers are getting little or nothing,โ€ said Scott Faber, vice president of government affairs at the Environmental Working Group, an independent nonprofit that conducts extensive research.ย 

The biggest of those were corn subsidies. 

Federal spending on crop insurance has grown in recent farm bills, and crop insurance payments now make up a quarter of all subsidy payments.

In Iowa, the family farm that is managed by the son of Republican U.S. Sen. Chuck Grassley, a farm policy leader, received more than $1.4 million from 1995 to 2021, the report shows. The payments includedย disaster, corn, soybean and oat commodity subsidies.ย 

The payments are listed for Robin Grassley, the family farm manager. Chuck Grassley and Republican Sen. Joni Ernst of Iowa both sit on the Senate Agriculture Committee. 

Pat Grassley, a state representative in Iowa and the senatorโ€™s grandson, collected $55,500 in federal payments since 2005. Most of those were relatively small commodity payments from $700 to $2,000 a year โ€” with the exception of 2020, when he received $20,000.

The database compiles data collected from federal reporting and Freedom of Information Act requests.

Harvesting federal support

The distribution of farm subsidies does not necessarily follow the amount of agricultural production in a state. 

For instance, California is the most agriculture-producing state, according to the USDA, but is 11th on the list for subsidy payments. 

North Carolina is in the top 10 for agriculture production but ranks 20th for farm subsidy receipts. Instead, more money goes to Texas, Iowa and Illinois, where large farms grow subsidized commodity crops, like corn and soybeans.

Theย top 15 states with the most total farm subsidies distributed from 1995 to 2021, ranked by payments, were:ย 

  1. Texas ($44.5 billion) 
  2. Iowa ($39. 6 billion)
  3. Illinois ($32.7 billion)
  4. Minnesota ($28.1 billion)
  5. Kansas ($27.7 billion) 
  6. Nebraska ($27 billion)
  7. North Dakota ($26.6 billion)
  8. South Dakota ($21 billion)
  9. Missouri ($17.4 billion)
  10. Indiana ($16.5 billion)
  11. California ($16.3 billion)
  12. Arkansas ($15.9 billion) 
  13. Ohio ($12.8 billion)
  14. Wisconsin ($11.7 billion)
  15. Oklahoma ($11.5 billion). 

Colorado came in 19th, with $8.7 billion in subsidies from 1995-2021. Most of that money went to counties on the stateโ€™s Eastern Plains, with the most โ€” $906 million โ€” going to Kit Carson County.

Pennsylvania, a major agricultural state, is 29th on the list with $3.4 billion from 1995-2021. The biggest subsidy programs in the state are for dairy farmers. 

But 80% of Pennsylvaniaโ€™s producers do not receive federal farm subsidies, according to the report. 

Producers in House Agriculture Committee Chairman Glenn Thompsonโ€™s congressional district in Pennsylvania received nearly $35 million in commodity payment support from 1995 to 2021, according to the database. The largest of those went to Long Acres Potato Farms in Tionesta, which collected more than $1.5 million over that time period. 

Farm bill debate launches

The report comes as Congress kicks off its rewrite of the sweeping federal farm bill, which will set both policy and funding levels for farm, food and conservation programs for the next five years. The Senate Agriculture Committee held its first farm bill hearing of the year Wednesday. The current farm bill expires at the end of September.

Originally a product of the New Deal, the first farm bill in 1933 focused on commodity price support to provide relief for farmers and ensure a steady domestic food supply for Americans during the Great Depression. 

Since then, lawmakers have passed 18 farm bills and greatly expanded the reach of the legislation. 

For example, Congress added a conservation section to the farm bill in 1985 with payments for farmers who conserve soil, idle land for wildlife habitat or employ certain conservation practices.ย 

But the biggest spending in recent farm bills is not on farms at all but in the nutrition title, which includes the Supplemental Nutrition Assistance Program, or SNAP, formerly known as food stamps. 

The politically fraught process of authoring a new farm bill faces extra challenges this year from a divided Congress, a looming debate over the federal debt ceiling and the potential for extended amendments in the House. 

The leaders of the House and Senate Agriculture committees, Thompson and Democratic Sen. Debbie Stabenow of Michigan, have each said they will aim to finish a new farm bill on time but acknowledged it will be a challenge this year.  

โ€œWe know because of the timeline and all of the complexity of everything going on and the challenges in the House that it may take a little bit longer, but weโ€™re committed to getting it done,โ€ Stabenow said in a January interview on the web broadcast Agri-Pulse newsmakers.

Crop subsidies could face attacks

Crop subsidies come under fire in every farm bill debate โ€” both from environmental groups that would like to see the money invested elsewhere and budget hawks who want to trim federal spending. 

The Republican Study Committee, whose members make up 80% of all Republican members of Congress, proposed drastic cuts for the farm bill and limits on some farm subsidies in the draft budget it released last summer as a โ€œBlueprint to Save America.โ€  

But Agriculture Committee leaders have not indicated they intend to undertake any massive overhaul in this farm bill.

Thompson has said he does not want to dismantle farm supports, which he and other farm state lawmakers see as a safety net critical for producers and rural communities.ย 

Democrats on his committee have not shown enthusiasm for an overhaul of farm subsidies, either. 

In a recent list of farm bill priorities, Georgia Rep. David Scott, the top Democrat on the House Agriculture Committee, did not include changes for farm subsidies other than extending programs for livestock producers and  small farmers.

Georgia Republican Rep. Austin Scott, who will chair the subcommittee that oversees farm commodities, said at a farm bill listening session last month that he wants to look at the reference prices that trigger payments for row crops but has not expressed interest in a massive subsidy overhaul.

How a precipitation โ€˜doughnut holeโ€™ makes #Pueblo drier and warmer than most of #Colorado — The Pueblo Chieftain

A satellite image captured on January 20, 2023 from the National Weather Service Pueblo office shows the ‘doughnut hole’ a section of terrain in and south of Pueblo that receives less precipitation than surrounding areas. The white area in the image indicates snowfall and cloud cover. Courtesy National Weather Service Pueblo Office

Click the link to read the article on The Pueblo Chieftain website (Josue Perez). Here’s an excerpt:

A recent satellite image showing snow throughout Colorado offered a glimpse and insight into a novel southern Colorado weather phenomenon: the Pueblo Precipitation Doughnut Hole.ย  sThe image, released by the National Weather Service of Pueblo, showed that most of Colorado received snowfall on Jan. 20, with some cloud cover mixed in. But there was one specific area that missed out on the precipitation, which encompassed portions of east and northern Pueblo County, as well as portions of Caรฑon City and some of Colorado Springs.

Fisher peak a spur of the Mesa de Maya (Raton Mesa), Colorado. It rises nearly 4,000 feet (1,200 m) above the town (Trinidad?) in the foreground. By Unknown author – Popular Science Monthly Volume 74, Public Domain, https://commons.wikimedia.org/w/index.php?curid=18486163

That area is the home of the Pueblo Precipitation Doughnut Hole, a cross-section of terrain from south to north that tends to receive less precipitation than the areas surrounding it because of different geographical features such as Raton Mesa, the Arkansas River Valley, Palmer Divide and the surrounding mountains.ย 

โ€œItโ€™s all about terrain, elevation and elevation change,โ€ said Michael Garberoglio, an NWS meteorologist. โ€œIf youโ€™re moving towards Pueblo from any direction, youโ€™re decreasing in elevation, and when air flows down, terrain tends to dry out.โ€ 

Precipitation isnโ€™t a fan of that sinking air flow, so those downslope winds contribute to dry and warmer climates for the region, Garberoglio said.ย Itโ€™s something thatโ€™s much more common during winter, especially when dealing with snowfall…

This image illustrates a south to north cross section of terrain and Pueblo’s position in the ‘doughnut hole’. A few terrain features — Raton Mesa and Palmer Divide — contribute to downslope winds that make the area at the bottom of the slope drier and warmer. Courtesy National Weather Service Pueblo Office

Although westerly winds are frequent in the region, intense, low-pressure easterly winds upslope along the terrain, enhancing the possibility for some precipitation, Garberoglio said, as long as theyโ€™re strong enough and have enough moisture in them.ย 

U.S. Senator Hickenlooper rallies senators to help accelerate #ColoradoRiver compromise — The Hill #COriver #aridification

Governor Hickenlooper, John Salazar and John Stulp at the 2012 Drought Conference

Click the link to read the article on The Hill website (Sharon Udasin). Here’s an excerpt:

Keeping the Colorado River flowing will require concessions from seven sparring states โ€” but Congress may have the financial mobility to help get them there, according to Sen. John Hickenlooper (D-Colo.).

โ€œWe are working in a bipartisan fashion at this point,โ€ he told The Hill on Monday. โ€œThereโ€™s a recognition that a lot of peopleโ€™s livelihoods are at stake, and thereโ€™s a real urgency.โ€

Hickenlooper is at the helm of the new Colorado River Caucus โ€” a cohort of senators from both sides of the aisle who intend to help the states agree on consumption cutbacks.

Members of the group include representatives from all seven Colorado River states: California, Arizona, Nevada, New Mexico, Utah, Colorado and Wyoming.

Biden-Harris Administration Delivers $728 Million in Historic Investments to Address Western #Drought, Improve #Climate Resilience — Department of Interior

Map of the Upper Colorado River Basin showing major tributaries and sub-basins. Credit: https://www.mdpi.com/2073-4441/14/23/3813#

Click the link to read the article on the Department of Interior website:

Critical infrastructure investments under President Bidenโ€™s Bipartisan Infrastructure Law and Inflation Reduction Act to provide clean, reliable drinking water to communities and support water conservation in the Upper Colorado River Basin

As part of the Biden-Harris administrationโ€™s commitment to enhance the resilience of the West to drought and climate change, the Department of the Interior today [February 13, 2023] announced a $728 million investment to deliver clean, reliable drinking water to rural and Tribal communities, support water conservation in the Upper Colorado River Basin, and complete projects to improve water supply reliability. This historic funding from President Bidenโ€™s Bipartisan Infrastructure Law, the Inflation Reduction Act, and the Consolidated Appropriations Act of 2023 supplementsย unprecedented investmentsย to protect the stability and sustainability of the Colorado River System now and into the future.

Funded by the Bipartisan Infrastructure Law, seven authorized rural water projects under construction in Iowa, Minnesota, Montana, New Mexico, North Dakota and South Dakota will receive $278 million. These investments build on the allocation of $420 million for rural water construction activities in fiscal year 2022. The funding is helping projects complete construction of water treatment plants and intakes, supporting work related to pipeline connections, pump systems, and reservoir construction, and advancing other efforts to provide potable water to rural and Tribal communities.

The Bureau of Reclamation is also making available up to $125 million to support the relaunch of a System Conservation Pilot Program in the Upper Colorado River Basin. The renewed program โ€“ funded with an initial allocation through the Inflation Reduction Act โ€“ will help support water management and conservation efforts to improve water efficiency and ultimately protect the short-term sustainability of the Colorado River System.

This is in addition to the over $325 million in fiscal year 2023 funding that Reclamation has allocated for ongoing work on drought resilience projects across the country. Separately, this week the U.S. Department of Agriculture announced $25 million in WaterSMART funds to help Western farmers and ranchers conserve water through a partnership with Reclamation and USDAโ€™s Natural Resources Conservation Service.

โ€œThe Biden-Harris administration is committed to making communities more resilient to the impacts of climate change — this includes making the Colorado River Basin and the diverse communities that rely on it more resilient to the ongoing drought in the West,โ€ saidย Secretary Deb Haaland. โ€œWe are investing historic resources through the Presidentโ€™s Bipartisan Infrastructure Law and Inflation Reduction Act to provide clean, reliable drinking water to rural and Tribal communities, protect the stability and sustainability of the Colorado River System, and increase water efficiency across the West.โ€

โ€œThe Bureau of Reclamation is committed to ensuring the continued availability of water across the West, while at the same time enhancing the resiliency of our communities to a changing climate. As we move forward with these urgent priorities, we are doing so in close collaboration with Basin states, Tribes, water managers, farmers, irrigators, and other stakeholders,โ€ said Reclamation Commissioner Camille Calimlim Touton. โ€œThis historic funding underscores how proactive efforts from the Biden-Harris administration are helping increase water efficiency and conservation across the West.โ€

Overall, the Bipartisan Infrastructure Law provides Reclamation with $8.3 billion over five years for water infrastructure projects to advance drought resilience and expand access to clean water for families, farmers, and wildlife. The Inflation Reduction Act is investing an additional $4.6 billion to address the worsening drought crisis and plan for the hydrology of today and into the future. Combined, these laws represent the largest investments in climate resilience in the nationโ€™s history.

Historic Investments for Rural Water

Funding in fiscal year 2023 from the Bipartisan Infrastructure Law will enable significant advances of rural water systems and associated features:

  • $77.56 million for the Rocky Boys / North Central Montana Rural Water System in Montana for core pipeline construction on segments 7 and 8, continued construction progress of a water treatment plant, as well as construction for segments associated with Havre, Chester and Shelby Hub service areas.
  • $62.11 million for the Eastern New Mexico Rural Water System in New Mexico for the construction of approximately 26 miles of raw water transmission pipeline.
  • $60 million for the Lewis & Clark Rural Water System in Iowa, Minnesota and South Dakota to support a water treatment plant, construction associated with the Sible service area, and to reimburse states for related costs.
  • $26.33 million for the Garrison-Diversion Unit of the Pick-Sloan Missouri Basin Program in North Dakota for efforts associated with construction of water treatment plants, as well as efforts to support service on the Spirit Lake, Standing Rock and Fort Berthold Reservations.
  • $25 million for the recently authorized Musselshell-Judith Rural Water System in Montana for substantial completion of phases 3 and 4 of rural water construction activities.
  • $15 million for the Fort Peck Reservation โ€“ Dry Prairie Rural Water System in Montana to support substantial completion of the project.
  • $12 million for the Jicarilla Apache Rural Water System in New Mexico to support progress toward water treatment plant upgrades.

Detailed information on the fiscal year 2023 spend plan is available on Reclamationโ€™s website.

Upper Basin System Conservation Pilot Program

Up to $125 million in funding from the Inflation Reduction Act will enable Reclamation, in partnership with the Upper Colorado River Commission, to immediately move forward to implement the System Conservation Pilot Program. From 2015 to 2018, the Upper Basin System Conservation Pilot Program(link is external) successfully tested new approaches to conserve water on the Colorado River and proved these measures are an effective approach to temporarily increase water efficiency and mitigate the impacts of drought.

The program is cooperatively managed by Reclamation and the Upper Division States of Colorado, New Mexico, Utah and Wyoming acting through the Upper Colorado River Commission.

This program supplements additional investments from the Biden-Harris administration to help increase water conservation, improve water efficiency, and prevent the Systemโ€™s reservoirs from falling to critically low elevations that would threaten water deliveries and power production. Reclamation is currently reviewing applications for a similar program in the Lower Colorado River Basin and expects to make additional announcements in the coming months to support water conservation and address the ongoing drought.

More about the implementation of the 2023 System Conservation Pilot Program can be found on the Upper Colorado River Commission website(link is external).

Investments from the Consolidated Appropriations Act:

The Consolidated Appropriations Act of 2023 provides an additional $325 million in funding for work in five categories within the Water and Related Resources account, including:

  • Over $229 million for Water Conservation and Delivery;
  • $50 million for Rural Water;
  • $31 million for Environmental Restoration or Compliance;
  • $11 million for Fish Passage and Fish Screens; and
  • $4 million for Facilities Operation, Maintenance, and Rehabilitation.

This funding will go to construction and preconstruction activities where environmental compliance has been completed and the project will improve water supply reliability, improve water deliveries, enhance economic development, promote job growth, advance Tribal and non-Tribal water studies and activities or address critical backlog maintenance and rehabilitation activities.

More information on this funding can be found in Reclamationโ€™s Fiscal Year 2023 Distribution of Additional Funds for Ongoing Work list.

Poll: Why more than half of Utahns are less concerned about #drought — The Deseret News #snowpack

Click the link to read the article on The Deseret News website (Amy Joi O’Donoghue). Here’s an excerpt:

Poll probes attitudes on drought, weather in Utah

A new poll shows that while more than 8 in 10 Utah residents remain concerned over the drought impacting the state, the series of storms this winter leaving a bountiful mountain snowpack have more than half of them less concerned than last year…When it came to views people have regarding Utahโ€™s drought in general, 85% of survey participants said they were concerned, 14% said they were not concerned, while another 1% said they did not know…But with winter storms pounding the state, delivering snow levels well above average and in some areas like southern Utah nearly twice what is average, the poll shows some residentsโ€™ concern over drought is starting to wane. More than half of those polled, over 52%, said they are less concerned about drought than last year, 14% remain more concerned, 34% have about the same attitude and 1% donโ€™t know…

โ€œWhen people are seeing the above normal precipitation and snowpack, theyโ€™re talking about meteorological drought, which itโ€™s something that we welcome and we are seeing improvements, of course, in that area,โ€ Clayton said. โ€œThe one thatโ€™s going to take a much longer time to get out of is the hydrological drought, which is essentially our storage systems, our reservoirs โ€” all of our surface water storage.โ€

Six states release consensus framework for #ColoradoRiver cuts โ€”ย with #California absent — The #Nevada Independent

Lake Mead and the Hoover Dam on the border between Nevada and Arizona on the morning of Friday, April 8, 2022. (Tim Lenard/The Nevada Independent)

Click the link to read the article on Nevada’s only non-profit newsroom The Nevada Independent website (Daniel Rothberg):

Six of the seven U.S. states that rely on the Colorado River released a framework Monday that outlines a potential strategy for federal water regulators tasked with making unprecedented cuts on an overused watershed that serves about 40 million people across the Southwest. 

The states released the plan, outlined in a letter sent to the U.S. Department of Interior, one day before a federal deadline to negotiate a consensus-based framework for cutting back. Years of drought, amplified by climate change, have exposed structural imbalances in how the Colorado River is used, as there are often more legal rights to use water than there is water to go around. 

What happens next is an open question. The plan shows a unified front among six states about how some of the cuts should be divided, but it is also a reflection of the unresolved tensions that have characterized seven-state negotiations over short-term cuts, which began last summer. 

Notably, the plan failed to gain the support of California, seen as critical to making meaningful cutbacks, as the state with the largest apportionment of the river and priority legal entitlements to use water. And itโ€™s unclear how federal officials will regard a plan that leaves out a key state.

John Entsminger, who leads the Southern Nevada Water Authority, said in a statement Monday that while the goal remains a seven-state deal, the six-state plan was a โ€œpositive step forward.โ€ย 

Gov. Joe Lombardo also released a statement calling the six-state plan a โ€œmajor step forward.โ€

The plan builds upon a framework Nevada outlined this year. The consensus-based approach would require states to account for water lost to evaporation and leaky infrastructure, resulting in significant cuts to overall use. Together, annual water losses make up about half of the water federal officials are looking to cut as a short-term measure to stabilize the riverโ€™s major reservoirs โ€” Lake Mead and Lake Powell โ€” until a longer-term deal can be negotiated. 

California negotiators said any plan to make major cuts should adhere to a foundational tenet of Western water law โ€” that those who developed their water rights first have a priority to water in times of shortages. They have argued that any cuts should be dealt with under this system, a move that would require junior users, particularly in Arizona, to take potentially steeper cuts.

The proposal to cut back by dividing evaporation losses in proportion to water use, California has argued, would be an unfair way to shift the burden of cuts to some of the stateโ€™s oldest Colorado River users, including the Imperial Irrigation District, the largest single river user.  

โ€œWhen you have a junior right, thatโ€™s what you do,โ€ Tina Shields, an official with the farming district, recentlyย told theย Associated Press. โ€œYou try to share the problem with other users.โ€

In the coming weeks, federal water officials will review the plan and could incorporate parts of it in anย environmental review processย to evaluate the short-term cuts to annual water use. The federal government will likely announce a regulatory action later this year.

This graphic indicates Colorado River reservoir levels as of November 2022. (Arizona Department of Water Resources)

#Snowpack news February 13, 2023

West snowpack basin-filled map February 12, 2023 via the NRCS.
Colorado Snowpack basin-filled map February 12, 2023 via the NRCS.

How the pattern of trends across the tropical Pacific Ocean is critical for understanding the future #climate — NOAA

Click the link to read the article on the NOAA website (Sukyoung Lee,ย Kris Karnauskas,ย Ulla Heede,ย ANDย Michelle L’Heureus):

โ€œHow will climate change influence ENSO?โ€ is one of the most common questions that we get on the ENSO Blog. While it makes sense folks want to know about the future changes in El Niรฑo and La Niรฑaโ€”are they becoming more/less frequent? stronger? weaker? (1)โ€”there is an even more basic question for future climate change that scientists are pondering:

How will trends in sea surface temperatures change across the equatorial Pacific Ocean? 

It is very likely that the equatorial Pacific Ocean is going to warm up somewhere, but where exactly the strongest warming occurs is an important question. In particular, scientists want to know more about the geographic pattern of trends (2). By modifying the heating in the tropics, these changes will then have knock-on influences across the globe because, as we like to say, what happens in the Pacific does not stay in the Pacific!

The trend pattern is critical to understanding how the average or background atmospheric circulation of the tropical Pacific will change. Remember: the background state of the atmosphere in the tropical Pacificโ€”theย Walker Circulationโ€”is fueled by the difference in sea surface temperature between the west and the east.

Sea surface temperatures in the Pacific around the equator are generally cooler in the East (blue colors) than they are in the West (yellow-orange). This temperature contrast, or gradient from warm to cool, is key to the Walker Circulation. January 21, 2023, image from Climate.gov Data Snapshots.

If temperatures warm faster in the western Pacific than in the eastern Pacific, the background tropical circulation could become more La Niรฑa-like (3). But if the trend pattern changes as global temperatures continue to rise, meaning the east starts warming faster than the west in the future, the whole circulation across the tropical Pacific could become more El Niรฑo-like. So actual ENSO events would be occurring against a different background climate than they do today. Yeah, itโ€™s complicated.

How the sea surface temperature trend pattern will change has profound, world-wide implications for impacts such as regional changes in rainfall, where drought occurs, numbers of tropical cyclones, the rate of global mean warming, ocean biogeochemistry, etc. If you are trying to make decisions based on projections of the future, you need to know the answer. And, at this moment, there is some significant (perhaps even growing) debate that surrounds it.

Some scientists believe the recently observed trends suggest the models may be not reproducing some key mechanisms that are critical to provide accurate projections for the tropical Pacific Ocean. There are some long-standing biases in how models simulate the tropical Pacific that we have covered before on this blog, which could be playing some role.

To help us better understand this question, we have assembled a panel of three experts: Professorย Sukyoung Leeย at the Pennsylvania State University, Professorย Kris Karnauskasat the University of Colorado- Boulder (who has previously written on theย ENSO blog), Dr.ย Ulla Heedeย who is now a CIRES postdoctoral visiting fellow, following her PhD withย Alexey Fedorovย at Yale University. Keep in mind that this is not a complete representation of all possible perspectives on the matter, and there are some angles not represented by this group (4).

Questions and Answers

(A) So, what are the trends in sea surface temperature (and other variables) across the tropical Pacific Ocean? Why canโ€™t you just measure past trends and assume they will continue? Whatโ€™s the problem here?

UH:ย Since at least 1980, the tropical Pacific warming pattern has become more La Niรฑa-like in the observations. This means that SSTs are warming faster in the western tropical Pacific Ocean than the eastern Pacific, and that surface winds are blowing stronger from east-to-west along the equatorial Pacific Ocean (5). This is opposite to the El Niรฑo-like trend many climate models are projecting into the future because of greenhouse gases. Right now, there is a vigorous debate in the climate community whether the La Niรฑa-like trend we are observing now is being driven by greenhouse gases or has natural causes. Because natural variations in the ocean circulation are slow, it is difficult to estimate the signal of global warming in a short observational record.

From Jan. 1982 until Dec. 2022, the linear trends of anomalies in sea surface temperature (top left), 850hPa-level zonal winds (top right), outgoing longwave radiation (bottom left), and 1000hPa-level geopotential height (bottom right). Red (blue) shading in the SST map indicates trends toward more positive (negative) SSTs. Purple (green) shading in the wind map indicates that trends are stronger going from east to west (west to east). Brown (green) shading in the OLR map indicates that convection/rainfall is below-average (above-average). Orange (purple) shading in the surface height/pressure map indicates trends toward higher (lower) pressure/heights. Data are in monthly means and the slope is multiplied by the number of months over the period to obtain the total change in the anomalies. Figures by Michelle Lโ€™Heureux and modified by climate.gov.

KK: It might sound simple, but quantifying those trends in the past observed record is more challenging than you might think! This is because the tropical Pacific is home to ENSO, which can either hide the long-term trends with its large variability, or make trends appear that are just temporary and could change later on.

UH: There is another reason why we cannot simply assume the recently observed La Niรฑa-like trend will continue in the future. Mainly, we donโ€™t know with enough certainty what the trend was before we had satellites monitoring the vast expanse of the tropical Pacific Ocean.

KK:ย Ulla is right, we have a tougher time reliably estimating the trends prior to the satellite era (late 1970s), and this problem gets even worse prior to the 1950s. Back then the instrumental data (mostly from ships) have gaps and changes in measurement protocols. Think of it like this: ideally, we would like to estimate the trend using as long of a record as possible (going back to the 1800s) but this is hampered by gaps in space and time. With 40 years of satellite data, we can be more confident that weโ€™re accurately measuring the whole tropics, but with that shorter record, it is harder to distinguish trends from just a random pileup of ENSO events.

Locations of sea surface temperature observations from the International Comprehensive Ocean Atmosphere Data Set (ICOADS) for 20-year periods starting with the 1860-1879 period and ending with 1980-1999. The colors represent the percentage of months with at least one sea surface temperature measurement in each 2 degree by 2 degree grid box. The darker the color the higher the percentage of months in each 20-year period that has an observation. NOAA Climate.gov image with data from ICOADS.

(B) Why is it so important we know the pattern of tropical Pacific trends? Who cares?

UH: Iโ€™d like to rephrase this question another way: What are the climate impacts associated with the tropical Pacific climate change? (6) The short answer is: a lot! This is because the tropical Pacific plays a key role in distributing energy and moisture to the rest of the planet, so any change in the tropical Pacific will be felt in other parts of the world. Letโ€™s look at an example: in the last several decades we have observed drought conditions in many parts of the southwestern United States. This is likely partially related to the stronger tropical Pacific winds (more La Niรฑa-like trends) we have recently observed. So, if the trends in the tropical Pacific changes, we might also see a change in these drought conditions.

SL: During La Niรฑa, the atmospheric circulation over the middle latitudes is unusually wavier in the east-west direction (7). Surface temperatures can also be more variable as this blog recently pointed out. This increased waviness can mean the Arctic tends to be unusually warm and a large area of the North American and Eurasian continents tend to be unusually cold (8). Conversely, during El Niรฑo, the atmospheric circulation is less wavy and the mid-latitude continents tend to be unusually warm and the Arctic tends to be colder than average.

Because climate change might have similar effects, we really need to know how the tropical Pacific sea surface temperature pattern and latent heating [the heating of the atmosphere that occurs when water vapor condenses into rain or clouds] will change. If it becomes more La Niรฑa-like, the likelihood of undesirable conditions such as an even drier southwest U.S., as Ulla mentioned, or an amplified cold continents/warm Arctic pattern, would increase (8). Because most of the population resides in the mid-latitude continents, this clearly has implications for energy and water usage planning.

(C) Why is this happening? Why are future projections more El Niรฑo-like while observations are more La Niรฑa-like? What would even cause more El Niรฑo- vs. more La Niรฑa-like changes?

KK: Perhaps we should not be that surprised that future projections and past observations do not always give the same answer. Future projections are from imperfect computer models, and past observations are from imperfect attempts to measure the vast ocean. The causes of these possible changes have been hotly debated for decades, and it was like โ€œlove at first sightโ€ when I was introduced to it as a postdoc!

SL:ย One explanation is โ€œinternal variability,โ€ which essentially suggests that natural causes explain the recent La Niรฑa-like trend. However, recent work by Dr. Richard Seager (hereย andย here), among others, suggests models are either deficient at correctly estimating this internal variability or the response to greenhouse gases may not be right. Either outcome raises some doubts on the future projections of the tropical Pacific made by the current generation of climate models. Thus, it is important to understand the mechanisms that could drive El Niรฑo-like vs. La Niรฑa-like trends.

The left column shows the relevant processes in the pre-industrial climate and the right column shows how these same processes initially respond to GHG warming (this schematic does not show the final state). Technical Details(left panel): Convection is strongest in the western Pacific where the SST is the highest. Latent heating warms aloft, and evaporation cools the ocean surface. In the eastern Pacific, the thermocline is closest to the surface. Right panel: Under GHG warming, a uniform surface heat flux into the Pacific Ocean causes the SST to rise, but in the eastern tropical Pacific, the upwelling of cold water counters the forced warming. As a result, the zonal SST gradient increases. Schematic by climate.gov.

KK:ย One mechanism that could lead to more La Niรฑa-like change is that cold waterย upwellingย in the eastern Pacific may keep warming at bay โ€” the idea here is that the coldest waters at depth in the ocean are slower to feel the effects of climate change and provide a break on local rates of warming (see figure above). Another mechanism that could lead to more El Niรฑo-like change is that radiative effects of global warming [the upward transfer of heat away from the surface] would cause the tropical atmosphere to become more stable, slow down the Walker circulation, weaken the upwelling in the eastern Pacific, and lead to more warming there (see figure below).

Caption: Schematic showing a possible mechanism toward an El Niรฑo-like state, reviewed in Lee et al. (2022). The left column shows the relevant processes in the pre-industrial climate and the right column shows how these same processes initially respond to GHG warming (this schematic does not show the final state). Technical Details (left panel): Convection is strongest in the western Pacific where the SST is the highest. Latent heating warms aloft, and evaporation cools the ocean surface. Right panel: SSTs in the tropical Pacific increase leading to more condensational heating aloft and a higher tropopause, which increases dry static stability and gross moist stability, thus weakening the Walker circulation. At the same time, evaporative cooling and cloud shading are more sensitive to warming in the western Pacific, which weakens the zonal SST gradient. Schematic by climate.gov.

SL:ย A final possible mechanism may result in a La Niรฑa-like future. The air over the western Pacific Ocean could become moister, promoting even stronger convection (showers and thunderstorms), and therefore strengthening the Walker circulation. At the same time, in the periphery of the Indo-Pacific warm pool, contraction of the cirrus cloud cover could cause more surface cooling by allowing more infrared radiation to escape to space, again helping to create a more La Niรฑa-like sea surface temperature pattern (see figure below).

Schematic showing a possible mechanism toward an La Niรฑa-like state, reviewed in Lee et al. (2022). The left column shows the relevant processes in the pre-industrial climate and the right column shows how these same processes initially respond to GHG warming (this schematic does not show the final state). Technical Details (left panel): Highlighting the abundance of water vapor in the lower troposphere, and the trapping of infrared radiation (IR) by cirrus outflow from convective towers which otherwise escapes to space. Latent heating warms aloft, and evaporation cools the ocean surface. Right panel: Under GHG warming, the lower troposphere becomes more moist which decreases the gross moist stability and thus strengthens the Walker circulation. In the margins of the convective region, the horizontal moisture gradient increases, and advection from the surrounding drier region diminishes the area of convection. The so-called โ€œiris effectโ€ can also lead to a similar response to increased warming: Precipitation efficiency in convective tower increases, leaving less moisture for cirrus outflow. The resulting contraction of the cirrus cover in the periphery of the warm pool allows for more IR to escape, potentially cooling SSTs and thus enhancing the zonal SST gradient between the warm pool and its surroundings. Schematic by climate.gov.

(D) Can we reconcile the seemingly different trends in the models versus the observations? Could they both be โ€œright?โ€

 UH: It is entirely possible that the La Niรฑa-like trends in the Pacific we are observing now are transient (short-term) and will reverse at some point in the next 100 years and start to look more like the modeled projections, with the eastern Pacific Ocean warming faster than the rest of the tropical oceans (9). Even if it is just transient, we need to understand these trends better: is it a response to global warming? (I tend to think so!), natural variability, or some mix of the two? However, this is difficult to diagnose using the models because the historical model simulations (run using observed historical forcings) and the observations still do not agree very well.

KK: It is fair to say both might be โ€œrightโ€ in the very general sense that both sets of mechanisms are real and part of the fundamental physics controlling the climate system, but I donโ€™t think we can say that both are right in terms of their relative importance. If the models and observations agreed on what *has* happened since the beginning of the Industrial Revolution, then that would be one thing, but they donโ€™t. As for the future, it is possible that a mixture of physical processes can evolve, and some of Ullaโ€™s work has really been groundbreaking in thinking along those lines. However, I suspect that as time goes on, we will learn that the models are still not representing some of the key ocean processes very well (10), such as the currents and upwelling, and their relation to changes in the windโ€”especially in places like the eastern equatorial Pacific Ocean where the thermocline is very shallow.

(E) How and when will scientists figure out where we are headed? What more could be done to help resolve this important question?

KK: Progress on the observational side might be slow. I donโ€™t know how much more we can improve our ability to describe historical trends back to the 1800s. Even as different groups of scientists throw new statistical techniques to fill in the gaps, etc., the observational uncertainties arenโ€™t being reduced very much. That said, we now have 40+ years of satellite data. When I started grad school, that was only 22 years. We probably have a few more decades to go, but we are getting closer to an acceptably long satellite record that can distinguish between ENSO, decadal variability, and long-term trends that are arising from human activities.

On the modeling side, heroic efforts are being done at modeling centers around the world to improve the representation of the physical processes. Perhaps gains will come from moving toward higher spatial resolution of the models as computers get cheaper and faster, which I suspect is critical for resolving upwelling, the shear between currents flowing in different directions, and the way that the friction from wind makes its way down into the ocean to influence the currents and mixing. Iโ€™m hopeful, and Iโ€™m glad I still have a few decades left to work on this fun and important problem!

SL: I agree with Kris that as the length of observational records increases, the impact of the internal variability on the trend diminishes, and therefore increasing the likelihood that the La Niรฑa-like trends weโ€™ve seen represents natureโ€™s response to greenhouse gases. However, it is difficult to lengthen our historical record and infill where there are few measurements, so improving the accuracy of climate models is critical. Kris points out that we need to better resolve the ocean, but I think we also need to focus on how well tropical convection and rainfall is captured, which occur on scales that are unresolved by current model grid spacing. The current generation of parameterizationsstill warms the upper troposphere too aggressively and therefore weakens the simulated Walker circulation, leading to a more El Niรฑo-like state.

For good reason, improving the parameterization is one of the most prominent research activities in climate science. At the same time, I believe that continued efforts should be made to develop new theories and to improve existing theories of fundamental mechanisms. In the meantime, for users who need to make decisions, it is important to recognize that there may be two different โ€œstorylinesโ€ for the tropical Pacific in the future, which they need to take into account.

Lead Editor: Michelle Lโ€™Heureux (NOAA CPC)

Footnotes:

(1) Tom has done a masterful job going over these questions. Check out his most recent post going over the latest IPCC findings related to ENSO and climate change. I also really like his older post using a dimmer switch metaphor.
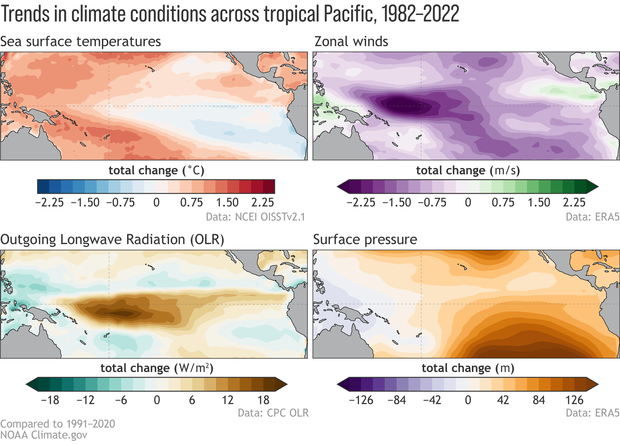
(2) Iโ€™m avoiding using the term โ€œzonal gradientโ€ up top because it involves two fairly jargon-y terms that I think confuse most non-scientific readers. But, for those who are familiar, Iโ€™m talking about trends in the zonal gradient across the tropical Pacific Ocean. In other words, weโ€™re interested in the relative rate of trends in tropical sea surface temperature, sea level pressure, rainfall, etc. in the zonal, or east-west, directionโ€”i.e. comparing impacts between the eastern Pacific versus the western Pacific.

(3) Now some readers might ask โ€œWait, isnโ€™t ENSO already tied to the pattern of sea surface temperatures across the tropical Pacific Ocean? El Niรฑo is associated with ocean temperatures warming up (more than average) in the central and eastern equatorial Pacific and La Niรฑa is linked to cooler ocean temperatures there. So how is this question about trend patterns any different from asking how ENSO itself will change?โ€ Good question smart readers! 

Changes in El Niรฑo and La Niรฑa are most strongly tied to seasonal (3-month) average anomalies in the climate system, and this seasonal variability has its own mechanismsthat result in the growth and decay of events over the span of a year or couple years. In contrast, what we are talking about here is the slower, smaller background changes in the tropical Pacific that occur over multiple decades or even centuries. Even though the timescales and mechanisms are separate and distinct from the seasonal ENSO cycle, folks often use the phrases โ€œEl Niรฑo-like change/trendsโ€ or โ€œLa Niรฑa-like change/trendsโ€ to describe these longer, gradual trends.

Although potentially confusing, these terms provide a handy shortcut because El Niรฑo-like change means that these trends will look more El Niรฑo-like over the tropical Pacific (relatively warmer in the central/east Pacific and cooler in the western Pacific) or La Niรฑa-like (relatively cooler in the central/east Pacific and warmer in the western Pacific).

(4) I think Sukyoung Leeโ€™s review paper (which available through open access) is a nice place to start reading about different ideas and approaches (disclosure: two ENSO bloggers are co-authors). There are also more papers that have been released since that review paper was assembled that are also worth checking out:

Hartmann, D. L. (2022). The Antarctic ozone hole and the pattern effect on climate sensitivity. Proceedings of the National Academy of Sciences119(35), e2207889119. https://doi.org/10.1073/pnas.2207889119

Wills, R. C. J., Dong, Y., Proistosecu, C., Armour, K. C., & Battisti, D. S. (2022). Systematic climate model biases in the large-scale patterns of recent sea-surface temperature and sea-level pressure change. Geophysical Research Letters, 49, e2022GL100011. https://doi.org/10.1029/2022GL100011

Dong, Y., Pauling, A. G., Sadai, S., & Armour, K. C. (2022). Antarctic ice-sheet meltwater reduces transient warming and climate sensitivity through the sea-surface temperature pattern effect. Geophysical Research Letters, 49, e2022GL101249. https://doi.org/10.1029/2022GL101249

(5) For example, one recent study has shown that the ocean surface near the Galapagos Islands in the far eastern equatorial Pacific cooled down by about a half degree Celsius over the past 40 years.

(6) It is often useful to make a distinction between climate change and climate impacts. Climate change refers to the โ€˜big pictureโ€™ of how earthโ€™s climate is changing in response to more greenhouse gasses in the atmosphere. This includes questions like how much the surface of the planet is warming, how the jet stream is changing, how fast the ice sheets are melting, and – you guessed it – how the tropical Pacific is changing. Climate impacts are the consequences of climate change that impacts humans locally. For example, climate impacts could be increased droughts, more frequent forest fires, flooding of coastal cities, stronger hurricanes making landfall. 

(7) The reason why La Niรฑa events bring about wavier conditions is because the latent heat released during cloud formation in the tropics is mostly confined to the western part of the tropical Pacific. The latent heating generates so-called Rossby waves which are responsible for the aforementioned waviness (see Figure 6 in Lee et al., 2022). If the latent heating is uniform in the east-west direction, the heating cannot generate Rossby waves. Therefore, the more east-west confinement of the latent heating, the more the waviness, which has profound impacts on temperature and precipitation locally around the globe. The pattern of the future tropical Pacific is not necessarily the same as either El Niรฑo or La Niรฑa.

(8) For more details see: 

Lee, S. (2012). Testing of the Tropically Excited Arctic Warming Mechanism (TEAM) with Traditional El Niรฑo and La Niรฑa, Journal of Climate25(12), 4015-4022.

Clark, J. P., & Lee, S. (2019). The role of the Tropically Excited Arctic Warming Mechanism on the warm Arctic cold continent surface air temperature trend pattern. Geophysical Research Letters, 46, 8490โ€“ 8499. https://doi.org/10.1029/2019GL082714 

(9) Here are some papers that delve on the issue of future Pacific warming:

Heede, Ulla, and Alexey Fedorov. 2021. โ€˜Eastern Equatorial Pacific Warming Delayed by Aerosols and Thermostat Response to CO2โ€™.

Heede, Ulla K., Alexey V. Fedorov, and Natalie J. Burls. 2020. โ€˜Timescales and Mechanisms for the Tropical Pacific Response to Global Warming: A Tug of War between the Ocean Thermostat and Weaker Walkerโ€™. Journal of Climate, April. https://doi.org/10.1175/JCLI-D-19-0690.1.

Wu, Mingna, Tianjun Zhou, Chao Li, Hongmei Li, Xiaolong Chen, Bo Wu, Wenxia Zhang, and Lixia Zhang. 2021. โ€˜A Very Likely Weakening of Pacific Walker Circulation in Constrained Near-Future Projectionsโ€™. Nature Communications12 (1): 6502. https://doi.org/10.1038/s41467-021-26693-y.

Ying, Jun, Matthew Collins, Wenju Cai, Axel Timmermann, Ping Huang, Dake Chen, and Karl Stein. 2022. โ€˜Emergence of Climate Change in the Tropical Pacificโ€™. Nature Climate Change, March, 1โ€“9. https://doi.org/10.1038/s41558-022-01301-z.

(10) Karnauskas, K. B., J. Jakoboski, T. M. S. Johnston, W. B. Owens, D. L. Rudnick, and R. E. Todd, 2020: The Pacific Equatorial Undercurrent in Three Generations of Global Climate Models and Glider Observations. J. Geophys. Res.โ€“Oceans125(11), e2020JC016609, doi: 10.1029/2020JC016609.

This paper analyzed a ton of climate models, from the ones that were state-of-the-art a dozen years ago (CMIP3 / IPCC AR4) to the most recent generation of CMIP6 models that fed into the 6thIPCC Assessment Report. While the currents along the equatorial Pacific have improved over time, there is still a ways to go, and this has implications for how SST changes.

Coats, S., and K. B. Karnauskas, 2018: A role for the Equatorial Undercurrent in the ocean dynamical thermostat. J. Climate31, 6245โ€“6261, doi: 10.1175/JCLI-D-17-0513.1.

This paper analyzed a recent generation of global climate models (CMIP5 / IPCC AR5) and found, among other things, that the relationship between the wind stress and the underwater currents does not match observations in the eastern equatorial Pacific, which has implications for how SST changes in that climatically important region.

Calls grow for statewide #Colorado water #conservation standards; some cities skeptical — @WaterEdCO #ColoradoRiver #COriver #aridification

Castle Rock Water Conservation Specialist Rick Schultz, third from the right, inspects and tests a new landscape watering system in Castle Rock, one of many Douglas County communities reliant on the shrinking Denver Aquifer. In a Fresh Water News analysis of water conservation data, Castle Rock leads the state, having reduced its use 12% since 2013. Oct. 21, 2020. Credit: Jerd Smith, Fresh Water News

Click the link to read the article on the Water Education Colorado website (Allen Best):

With the Colorado River crisis deepening and the warming climate continuing to rob streams and rivers of their flows, talk in Colorado has resumed about how to limit growing water demand statewide for residential use.

A new report commissioned by the Common Sense Institute and written by Colorado water veterans Jennifer Gimbel and Eric Kuhn, cites the need for broader conservation measures such as removing non-functional turf in new development, among other things.

โ€œLacking statewide or regional standards, home developers are free to choose cities with less strict conservation standards,โ€ they wrote in the November 2022 report,ย โ€œAdapting Coloradoโ€™s Water Systems for a 21stย century Economy and Water Supply.โ€

โ€œRegional approaches are needed,โ€ they added in their broad-ranging report. They suggest regional conservancy and conservation districts might be a vehicle in lieu of statewide standards.

Gimbel, a senior scholar at CSUโ€™s Water Center and former director of the Colorado Water Conservation Board, and Kuhn, retired general manager of the Colorado River Water Conservation District, summarized their findings last Friday [January 27, 2023] in a presentation at the Colorado Water Congress Annual Convention. The water congress is a bi-partisan group representing dozens of water users across the state.

โ€œWe have to do more with less,โ€ said Kuhn. He cited projected statewide population growth of 1.6 to 1.8 million new residents by 2050, most along the Front Range, but also the probability that the warming climate will make less water available, particularly from the Colorado River.

Kuhn warned that deliveries of water from the Colorado River Basin to the Front Range are by no means guaranteed. Several Front Range water providers, including Pueblo, Denver and Northern Water have at least some water rights that are younger, or more junior than those farther downstream in places such as California, and could be vulnerable if mandatory cutbacks ever occurred. Within individual states in the West, older water rights are typically fulfilled before younger water rights during times of scarcity, though itโ€™s yet to be seen how mandatory cutbacks would materialize across the entire Colorado River Basin.

โ€œCurtailment of those junior users is not acceptable at any time in the future,โ€ said Kuhn.

Earlier during the conference, Colorado Gov. Jared Polis called for a โ€œcomprehensive approach to housing to preserve our water resources.โ€ He cited multiple benefits for revised land-use policies: reduced traffic, saved money for consumers and โ€“ most important, he added, it โ€œlimits demand on water resources.โ€

Polis said the Colorado Water Conservation Board will lead a task force on integrating land use and water demand. This 21-member Urban Landscape Conservation Task Force is to include representatives of 8 water utilities, 2 conservation districts, 2 environmental NGOs, with the balance to come from areas of expertise and interest such as stormwater, equity, and urban planning.

Local control, a basic precept of Coloradoโ€™s form of government, will also likely be an issue. Towns, cities and counties who are authorized to govern themselves in most cases, often resist state control in matters they believe should remain in local hands.

Aurora, if lately a shining light for turf removal and strict water conservation policies, harbors skepticism of any potential statewide mandates. โ€œAurora must retain control of what our city looks like,โ€ says Greg Baker, Aurora Waterโ€™s spokesman.

Aurora is open to discussion but โ€œit needs to be a proportional discussion,โ€ says Baker. โ€œWe donโ€™t want to tell agriculture how to use their water, but they account for 85% of water use in this state.โ€

In 2014, when Ellen Roberts, then a state senator from Durango, introduced a conservation bill, she found significant opposition.

Roberts said she introduced the bill, which did not pass, to get the conversation going in Colorado about stepped-up conservation programs. โ€œMy concern was that if we waited for that to happen naturally, it might never happen or it would be so slow it would have no meaningful impact,โ€ she says.

This latest report was designed for the business community, says Gimbel, but with the understanding that it needed to include the water community. โ€œIt was our opportunity to tell the business community โ€˜pay attention, because what happens with water is going to affect our economy one way or another.โ€™โ€

Allen Bestย grew up in eastern Colorado, where both sets of grandparents were farmers. Best writes about the energy transition in Colorado and beyond atย BigPivots.com.

Conservation Organizations Emphasize Need to Protect Environmental Priorities in #ColoradoRiver Basin — Audubon #COriver #aridification

Great Blue Heron. Photo: Patricia Kappmeyer/Audubon Photography Awards

Click the link to read the release on the Audubon website:

Several conservation organizations today [February 2, 2023] urge Colorado River Basin decision-makers to protect critical environmental priorities as they wrestle with Basin management decisions being made over the next several months. The groups warn that ignoring these priorities risks further damage to the Basinโ€™s environment and natural heritage, the foundation of the iconic Colorado River system.ย 

The U.S. Bureau of Reclamation is pursuing a supplemental Environmental Impact Statement (SEIS) process to evaluate the need to partially modify operating criteria for primary Colorado River reservoirs given extreme drought conditions and historically low reservoir levels at Lake Powell and Lake Mead.

While the groups are encouraged to see six of the Basin states put forward a โ€œconsensus based modeling alternativeโ€ for Reclamation to consider in the SEIS process, the groups seek to ensure that critical environmental concerns are considered in any operational actions that Reclamation models and evaluates.

As the Colorado River community considers operational changes, seven conservation organizations identify five (5) environmental priorities that are most directly linked to or implicated by the SEIS process, which is expected to be completed in the summer of 2023:

  • Investing federal funds in watershed health, long term resilience, and agricultural innovation in the Upper Basin tributaries with high fish and wildlife and recreational value;
  • Preserving the Endangered Fish Recovery Programs in the Upper Basin and the Lower Colorado River Multi-Species Conservation Program;
  • Safeguarding the integrity of the Grand Canyon ecosystem and recreational values;
  • Restoring wetlands at the Salton Sea to minimize toxic dust and benefit bird habitat along the Pacific Flyway;
  • Forestalling the loss and continuing restoration of the Colorado River Delta.

โ€œWe highlight these particular priorities because, for the Colorado River community, they are closely tied to the continued integrity of the Colorado River Basin and are potentially most affected by the current SEIS process,โ€ said Jennifer Pitt, Colorado River Program Director for National Audubon Society. โ€œIn the face of a hotter, drier climate, the Colorado Riverโ€”and all of the living things depending on itโ€”require that we stay focused on these priorities.โ€

โ€œWhatever options Reclamation ultimately considers as part of the SEIS process, these environmental priorities cannot be lost in the mix or sacrificed in the name of a crisis, or we risk making the entire situation worse,โ€ said Christy Plumer, chief conservation officer for Theodore Roosevelt Conservation Partnership.

โ€œThese and related priorities are essential to the continued sustainability of the Colorado River system.ย  Failing to consider them when making basin management decisions would undermine the ecological health of the Colorado River Basin, adding more potential for controversy in a Basin that needs to move forwardโ€”urgentlyโ€”with consensus efforts to reduce water demand and restore the health of the watershed,โ€ saidย Sara Porterfield, western water policy advisor for Trout Unlimited.ย 

โ€œOur groups have worked hard over the last decade to find environmental solutions that also benefit water users. We want to ensure those hard-won solutions and benefits arenโ€™t sacrificed because of interstate disputes over water allocations,โ€ said Taylor Hawes, director of the Colorado River Program at The Nature Conservancy. โ€œWe know the Basinโ€™s stakeholders are facing difficult decisions with dropping reservoir levels, drier soils, hotter temperatures, and that adjustments are needed now to deal with those issues in both the Upper and Lower Basins. Nevertheless, we donโ€™t want to lose sight of the risks to the extraordinary natural heritage of the Colorado River,โ€ Hawes added.

โ€œWe stand ready to work with Basin states, Tribes, water users, and the federal government to ensure that the SEIS process is sufficiently transparent, efficient, and comprehensive,โ€ said Kevin Moran, associate vice president of regional affairs for Environmental Defense Fund.

As #ClimateChange and overuse shrink #LakePowell, the emergent landscape is coming back to life โ€“ and posing newย challenges #ColoradoRiver #COriver #aridification

The white โ€˜bathtub ringโ€™ around Lake Powell, which is roughly 110 feet high, shows the former high water mark. AP Photo/Rick Bowmer

Daniel Craig McCool, University of Utah

As Western states haggle over reducing water use because of declining flows in the Colorado River Basin, a more hopeful drama is playing out in Glen Canyon.

Lake Powell, the second-largest U.S. reservoir, extends from northern Arizona into southern Utah. A critical water source for seven Colorado River Basin states, it has shrunk dramatically over the past 40 years.

An ongoing 22-year megadrought has lowered the water level to just 22.6% of โ€œfull pool,โ€ and that trend is expected to continue. Federal officials assert that there are no plans to drain Lake Powell, but overuse and climate change are draining it anyway.

As the water drops, Glen Canyon โ€“ one of the most scenic areas in the U.S. West โ€“ is reappearing.

This landscape, which includes the Colorado Riverโ€™s main channel and about 100 side canyons, was flooded starting in the mid-1960s with the completion of Glen Canyon Dam in northern Arizona. The areaโ€™s stunning beauty and unique features have led observers to call it โ€œAmericaโ€™s lost national park.โ€

Lake Powellโ€™s decline offers an unprecedented opportunity to recover the unique landscape at Glen Canyon. But managing this emergent landscape also presents serious political and environmental challenges. In my view, government agencies should start planning for them now.

A tarnished jewel

Glen Canyon Dam, which towers 710 feet high, was designed to create a water โ€œbank accountโ€ for the Colorado River Basin. The U.S. Bureau of Reclamation touted Lake Powell as the โ€œJewel of the Coloradoโ€ and promised that it would be a motorboaterโ€™s paradise and an endless source of water and hydropower.

Lake Powell was so big that it took 17 years to fill to capacity. At full pool, it contained 27 million acre-feet of water โ€“ enough to cover 27 million acres of land to a depth of one foot โ€“ and Glen Canyon Damโ€™s turbines could generate 1,300 megawatts of power when the reservoir was high.

Soon the reservoir was drawing millions of boaters and water skiers every year. But starting in the late 1980s, its volume declined sharply as states drew more water from the Colorado River while climate change-induced drought reduced the riverโ€™s flow. Today the reservoirโ€™s average volume is less than 6 million acre-feet.

Nearly every boat ramp is closed, and many of them sit far from the retreating reservoir. Hydropower production may cease as early as 2024 if the lake falls to โ€œminimum power pool,โ€ the lowest point at which the turbines can draw water. And water supplies to 40 million people are gravely endangered under current management scenarios.

These water supply issues have created a serious crisis in the basin, but there is also an opportunity to recover an amazing landscape. Over 100,000 acres of formerly flooded land have emerged, including world-class scenery that rivals some of the crown jewels of the U.S. national park system. https://www.youtube.com/embed/y7jm08U38c0?wmode=transparent&start=0 As Lake Powell recedes, it is uncovering formerly flooded land and things that past visitors left behind.

Bargained away

Glen Canyon made a deep impression on explorer John Wesley Powell when he surveyed the Colorado River starting in 1867. When Powellโ€™s expedition floated through Glen Canyon in 1869, he wrote:

โ€œOn the walls, and back many miles into the country, numbers of monument-shaped buttes are observed. So we have a curious ensemble of wonderful features โ€“ carved walls, royal arches, glens, alcove gulches, mounds, and monuments โ€ฆ past these towering monuments, past these oak-set glens, past these fern-decked alcoves, past these mural curves, we glide hour after hour.โ€

A red rock cliff towers above trees and a small pool of water.
This side canyon emerged in recent years as Lake Powell shrank. The white โ€˜bathtub ringโ€™ on the rock wall shows past water levels. Daniel Craig McCool, CC BY-ND

Glen Canyon remained relatively unknown until the late 1940s, when the Bureau of Reclamation proposed several large dams on the upper Colorado River for irrigation and hydropower. Environmentalists fiercely objected to one at Echo Park in Dinosaur National Monument on the Colorado-Utah border, alarmed by the prospect of building a dam in a national monument. Their campaign to block it succeeded โ€“ but in return they accepted a dam in Glen Canyon, a decision that former Sierra Club President David Brower later called his greatest regret.

New challenges

The first goal of managing the emergent landscape in Glen Canyon should be the inclusion of tribes in a co-management role. The Colorado River and its tributaries are managed through a complex maze of laws, court cases and regulations known as the โ€œLaw of the River.โ€ In an act of stupendous injustice, the Law of the River ignored the water rights of Native Americans until courts stepped in and required western water users to consider their rights.

Tribes received no water allocation in the 1922 Colorado River Compact and were ignored or trivialized in subsequent legislation. Even though modern concepts of water management emphasize including all major stakeholders, tribes were excluded from the policymaking process.

There are 30 tribes in the Colorado River Basin, at least 19 of which have an association with Glen Canyon. They have rights to a substantial portion of the riverโ€™s flow, and there are thousands of Indigenous cultural sites in the canyon.

Another management challenge is the massive amounts of sediment that have accumulated in the canyon. โ€œColoradoโ€ means โ€œcolored redโ€ in Spanish, a recognition of the silt-laden water. This silt used to build beaches in the Grand Canyon, just downstream, and created the Colorado River delta in Mexico.

But for the past 63 years, it has been accumulating in Lake Powell, where it now clogs some sections of the main channel and will eventually accumulate below the dam. Some of it is laced with toxic materials from mining decades ago. As more of the canyon is exposed, it may become necessary to create an active sediment management plan, including possible mechanical removal of some materials to protect public health.

The creation of Lake Powell also resulted in biological invasives, including nonnative fish and quagga mussels. Some of these problems will abate as the reservoir declines and a free-flowing river replaces stagnant still water.

On a more positive note, native plants are recolonizing side canyons as they become exposed, creating verdant canyon bottoms. Restoring natural ecosystems in the canyon will require innovative biological management strategies as the habitat changes back to a more natural landscape.

Finally, as the emergent landscape expands and side canyons recover their natural scenery, Glen Canyon will become a unique tourist magnet. As the main channel reverts to a flowing river, users will no longer need an expensive boat; anyone with a kayak, canoe or raft will be able to enjoy the beauty of the canyons.

Glen Canyon National Recreation Area, which includes over 1.25 million acres around Lake Powell, was created to cater to people in motorized boats on a flat-water surface. Its staff will need to develop new capabilities and an active visitor management plan to protect the canyon and prevent the kind of crowding that is overrunning other popular national parks.

Other landscapes are likely to emerge across the West as climate change reshapes the region and numerous reservoirs decline. With proper planning, Glen Canyon can provide a lesson in how to manage them.

Daniel Craig McCool, Professor Emeritus of Political Science, University of Utah

This article is republished from The Conversation under a Creative Commons license. Read the original article.

Department of Interior funds 5 tribal #water rights settlements in #Arizona — The Arizona Mirror

From the 2018 Tribal Water Study, this graphic shows the location of the 29 federally-recognized tribes in the Colorado River Basin. Map credit: USBR

by Shondiin Silversmith, Arizona Mirror
February 10, 2023

Several tribal nations will start seeing some funding as part of their water rights settlements, as the U.S. Department of the Interior has allocated nearly $580 million to start fulfilling Indian water rights claims. 

โ€œWater is a sacred resource, and water rights are crucial to ensuring the health, safety, and empowerment of Tribal communities,โ€ Secretary Deb Haaland said. โ€œThrough this funding, the Interior Department will continue to uphold our trust responsibilities and ensure that Tribal communities receive the water resources they have long been promised.โ€

Five tribes in Arizona will receive more than $306 million in funding from the settlement: the Ak-Chin Indian Community, Gila River Indian Community, Navajo Nation, San Carlos Apache Tribe and Tohono Oโ€™odham Nation.

The money will help each tribe develop infrastructure projects that will fulfill the terms of their water rights settlements.

โ€œI am grateful that Tribes, some of whom have been waiting for this funding for decades, are finally getting the resources they are owed with the help of this crucial funding from President Bidenโ€™s Bipartisan Infrastructure Law,โ€ Haaland said.

Part of the funding comes from the Bipartisan Infrastructure Lawโ€™s Indian Water Rights Settlement Completion Fund, where nearly $460 million will be applied to settlements enacted before Nov. 15, 2021. 

An additional $120 million has been allocated from the Reclamation Water Settlement Fund, a fund created by Congress in 2009 that receives $120 million in mandatory funding annually from 2020 through 2029.โ€ฏ

Together, both funds allocated nearly $580 million to fulfill 14 tribal water settlement claims from 12 tribal nations.

โ€œThe federal governmentโ€™s trust responsibility to Native communities includes providing Tribes with access to clean, reliable water,โ€ said U.S. Sen. Brian Schatz, D-Hawaii,ย the chairman of the United States Senate Committee on Indian Affairs.ย 

Schatz said the Department of Interiorโ€™s funding announcement shows leaders following through on the work legislatures did toโ€ pass and fund Indian water rights settlements to ensure water security for Tribes and surrounding communities.โ€

There are 34 congressionally enacted Indian Water Rights settlements as of Nov. 15, 2021, when the Bipartisan Infrastructure Law was signed, which included $2.5 billion to implement the Indian Water Rights Settlement Completion Fund. 

The Department of Interior stated that it will help deliver long-promised water resources to Tribes, certainty to all their non-Native neighbors, and a solid foundation for future economic development for entire communities dependent on common water resources.

โ€œAs a champion of the Bipartisan Infrastructure Law in the House, Iโ€™m excited to see this significant investment in Arizonaโ€™s Tribal communities,โ€ U.S. Rep. Ruban Gallego said in a statement.

Gallego, a Phoenix Democrat, said that Arizona is experiencing the devastating impacts of a 1,200-year drought, but the funding will go a long way to help secure Arizonaโ€™s water which ensures a sustainable water future and follows through on tribal water settlements.

Indian reserved water rights are vested property rights for which the United States has a trust responsibility, according to the department. The federal policy supports the resolution of disputes regarding Indian water rights through negotiated settlements. 

For Arizona, this funding supports five specific settlements:

  • $22,000,000: Ak-Chin Indian Water Rights Settlement Operations, Maintenance & Replacement
  • $18,225,000: AZ Water Settlements Act Implementation โ€“ San Carlos Irrigation Project Rehabilitation
  • $79,000,000: Gila River Indian Community โ€“ Pima Maricopa Irrigation Project
  • $1,500,000: San Carlos Apache Tribe Distribution System
  • $8,000,000: So. Arizona Water Rights Settlement โ€“ Farm Extension

The Navajo Nation is included in these settlements, and their funding will support projects they have established in the New Mexico and Utah portions of their tribal land. The settlements include:

  • $2,000,000: Navajo-Gallup Water Supply Operations, Maintenance & Replacementโ€ฏ  
  • $137,000,000: Navajo-Gallup Water Supply Projectโ€ฏ
  • $39,114,000: Navajo-Utah Water Settlement

#Coloradoโ€™s Proposed Stream Restoration Legislationโ€”Part 1 — Audubon

Kawuneeche Valley Ecosystem Restoration Collaboartive Leadership Tour, July 2022. Photo credit: Northern Water

Click the link to read the post on the Audubon Rockies website (Samantha Grant):

Audubon and the Colorado Department of Natural Resources (DNR) have partnered to host a webinar series on important stream restoration legislation. The DNR-led stream restoration legislation is expected to be introduced in mid-February and will provide clarity on where stream restoration projects can occur without being subject to enforcement actions.

Part one of the series showed substantial interest with more than 160 live participants, including legislators, staff/aids, and interested stakeholders. The roster of expert panelists included Senator Dylan Roberts and Representative Karen McCormickโ€”bill sponsors for the stream restoration legislationโ€”Assistant Director of Water Policy for Coloradoโ€™s Department of Natural Resources Kelly Romero-Heaney, Colorado State University Professor and renowned Fluvial Geomorphologist Dr. Ellen Wohl, Land and Water Conservation Lawyer Jackie Corday, and was facilitated by Audubon Rockies Western Rivers Regional Program Manager Abby Burk. Hereโ€™s a recap of the discussion and what you need to know to support Coloradoโ€™s streams and riverscapes. A recording of the webinar is included at the end.

Healthy streams and riverscapes are beneficial to us allโ€”they provide a suite of multifaceted benefits that all Coloradans depend upon. Unfortunately, the majority of our streams have been degraded by more than two centuries of hydrologic modification, agricultural land use practices, roads and development, channelization, mining, and climate-driven disasters. The good news is that case studies of Colorado and other Western statesโ€™ stream restoration projects have proven successful to improve human and environmental health and reduce vulnerability to fire, flood, and drought. However, existing Colorado water governance creates substantial uncertainty and even barriers to restoring the valuable natural processes of streams.

Under the direction of Governor Polis, the DNR and associated experts drafted a legislative solution to this challenge. As with many water law issues, there is a need to provide clarity, which is what the legislation will do by setting forth where stream restoration can take place (in the historic footprint of the stream riparian corridor), without being subject to water administration.

Senator Dylan Roberts (6:16) reports, โ€œThis bill is a key part in protecting our watersheds, streams, and rivers, and capitalizing on the incredibly unique and once-in-a-lifetime opportunity to receive funding from the federal government so that we can have healthy streams and rivers for decades into the future.โ€ He further stated that โ€œby having legal clarity for stream restoration, we can reduce barriers for these important projects to get off the ground and still protect water rights, and draw down some of the federal funding.โ€

Dr. Ellen Wohl (22:05) led the audience through the changes and challenges our river systems face and the importance of this timely opportunity to steward our rivers back into health. Jackie Corday (32:14) provided a detailed overview of the many benefits that healthy riverscapes offer through a series of successful restoration case studies, including reduced flood risks, improved water quality and resilience to drought and fires, reduction in sedimentation of reservoirs and headgates, and restoration aquatic and terrestrial habitat. All such projects could be in jeopardy in the future without a legislative fix.  

Kelly Romero-Heaney (10:55) spoke to the importance of this unique opportunity for the Colorado General Assembly to โ€œset a vision for the state, and the landscapes that have served us well for generations.โ€ She reminded the audience that โ€œColorado provides the headwaters for 19 states and Mexicoโ€ and that โ€œwe have shared responsibility to store water through our landscapes in a way that restores and maintains its environmental benefits.โ€ Both Kelly and Senator Roberts informed the audience that the Colorado General Assembly has invested $45 million in watershed restoration over the last few years. Water providers, conservation organizations, and local governments have also invested millions of dollars in restoring our streams.

Representative Karen McCormick (43:55) recounted the similar policy solutions in neighboring Western states, setting the path for Colorado to take lead. โ€œWe want to make sure weโ€™re removing these barriers to stream restoration while protecting the rights of water users. This is an everybody conversation. We need to craft the best solution that brings all voices to the table.โ€

Healthy riverscapes contribute to healthy forest systems, provide habitat for birds and wildlife, improve water supplies and forage for agriculture, and offer clean and reliable drinking water. Please join us in supporting our streams to ensure they can be restored to their natural function so that we can all thrive. Mark your calendars for a second installment of the series on March 8th. Registration and further details will be released in the coming weeks.

For specific draft stream restoration bill inquiries, please contactย Kelly Romero-Heaneyย orย Daphne Gervais. Any further questions about the need and benefits of stream restoration can be sent toย Abby Burkย orย Jackie Corday.

Moral questions on a standard San Luis Valley farm — Source #NewMexico @sourcenm

Kyler Brown drives a calf on June 21, 2022 as part of a drive that went through downtown Del Norte, Colorado. (Photo by Diana Cervantes for Source NM)

by Danielle Prokop, Source New Mexico
February 3, 2023

Hard calculations and changed practices in the era of drought and global warming

A self-described Midwest import from Missouri, 39-year old Kyler Brown is a cowboy, farmer and philosopher. These days, he feels driven by questions of life and death.ย 

โ€œDo people feel like they have morality in their occupation? I think people have moral moments, but probably most people donโ€™t question the morality of their profession. And I feel like I come in contact with mine almost daily,โ€ he said, driving over the Rio Grande outside of Monte Vista, Colorado. 

โ€œI see life and death a lot. I got to see baby calves get born in the spring. And then I had to put a cow downโ€ he said. โ€œI see whole cottonwood galleries dying. I just feel my morality is being challenged every day, where other people go through their life and donโ€™t question it.โ€

Brown lives on his farm in Del Norte with wife Emily, and two kids โ€” Elijah and Olivia.ย 

Kyler Brown and his son Elijah Brown go over the schedule for the day on June 21, 2022, before Kyler heads to the cattle drive. (Photo by Diana Cervantes for Source NM)

He also works his father-in-lawโ€™s farm just outside of Monte Vista. Itโ€™s a small operation โ€” two circles of russet potatoes, another two circles of barley and a small herd of cattle.

โ€œA standard San Luis Valley farm,โ€ Brown said, piling pivot sprinkler supplies into the back of a battered white truck. โ€œIโ€™m kind of slowly dragging him towards something different.โ€

Some of those changes included using a new fungal compost to improve soil health, building 21 pastures on a 600-acre lot to prevent overgrazing โ€” and determining that this will be the last season for growing barley for Coors beer. 

Still, the drought creeps in, ruining best-laid practices. No clover grows in the meadow cultivated for cattle. In early summer, there wasnโ€™t enough rain to grow forage.

Brown credits the institutional knowledge of his in-laws, but also their very senior water rights, for the farmโ€™s endurance. In recent years, thereโ€™s a stark visual divide drawn by water rights, he said, watching some neighborsโ€™ fields โ€œgrow green, the literal color of money,โ€ while others withe

Cows can be seen amid alfalfa fields during the cattle drive on June 21, 2022. (Photo by Diana Cervantes for Source NM)

A few years before, Brown had an epiphany, realizing his generation โ€œwould have to bear the brunt of climate changeโ€ and needed to be in the room when tough decisions are made. 

He slowly entered the fray, sitting on the board for a nonprofit conservancy district, meeting with state and national lawmakers as chapter president of the Rocky Mountain Farmers Union.

The conversations have often focused on an urban-rural divide, he said, which ignores a crucial interconnectedness.

โ€œWe give them a host of things: food, asphalt for roads, clean air, water, places to recreate. And they give us a tax base, so that we can have police departments, fire stations and school districts,โ€ he said. โ€œWe need each other. It is a Faustian bargain, but we both need each other.โ€

Kyler Brown helps wife Emily Brown put on boots before the cattle drive the morning of June 21, 2022. (Photo by Diana Cervantes for Source NM)

A ballooning population

Growth in Denver and the surrounding metropolitan areas caused tension across the state, including a decades-long effort to build a 200-mile pipeline to pump San Luis water for residential use in Douglas County.

Opposing water exportation, Brown said, rallies the valley and is โ€œfighting the good fight,โ€ but may pull attention away from other threats bearing down on the region. 

โ€œBut it also does a good job of distracting us from us being our own enemy,โ€ he said. โ€œOur pumping, our management of water, our management of our land and climate change will have far greater impacts on our valley and our water than an exportation scheme.โ€

Heโ€™s worried about the โ€œtremendous cultural and economic implicationsโ€ of determining who will have to fallow land โ€” or stop farming altogether in future years as the aquifers and Rio Grande shrink more.

Brown turns the truck into a barley circle, parallel to the pivot sprinkler, green stems and spikes rustling in the summer wind. Grabbing the stepladder from the back of the truck, he acknowledges that the politics feel fraught and toxic, and the solutions arenโ€™t easy.ย 

Kyler Brown stands atop an irrigation sprinkler on the Monte Vista, Colorado property. (Photo by Diana Cervantes for Source NM)

He describes listening to a public meeting back in April from the irrigation district as he was simultaneously fixing yet another pivot sprinkler, Zoom playing on his speakerphone. An early snowmelt at the headwaters of the Rio Grande meant managers had to scramble to provide water for the upcoming growing season. With an earlier snowmelt, there may not be enough river water for irrigation when crops need it most.  

โ€œI could just tell that this is just the beginning of folks trying to figure out how to do the same thing with far less resources โ€” and being very, very frustrated at their capabilities, their power, or more importantly, their options,โ€ he said. 

Not only is the source of the river sometimes melting early as seasons change, snowmelt also doesnโ€™t result in as much water in a hotter, drier climate thanks to global warming. โ€œYouโ€™re literally trying to move the days of a calendar year, which does nothing to make you have more water,โ€ Brown said.

Sprinkler repaired, he drives out of the barley circle, down the highway to another parcel which he calls โ€œjust a little nature preserve on the river.โ€

What once was a gravel pit has been transformed into habitat on the edge of the Rio Grande, with a pond for waterfowl. Bald eagles and owls roost in the trees at its edge. Itโ€™s a place for mule deer to gather, too. Another resident, a groundhog, Brown nicknamed โ€œLarry the whistlepig.โ€ 

This haven offers both solace and grief. 

Sitting back in the truck, as the river chuckles by, Brown said he senses thereโ€™s been a reckoning, even if just a small one, over the impacts of climate change in the valley.  

โ€œPeople are really saying โ€˜Wow, itโ€™s the driest itโ€™s ever been,โ€™ or โ€˜Man, another bad fire year.โ€™ So theyโ€™re seeing the symptoms of the disease,โ€ he said. โ€œAnd you donโ€™t have to name the disease in order for people to be feeling it intimately.โ€ย 

Kyler Brown, a farmer in the San Luis Valley, looks on the cottonwood stands on his father-in-lawโ€™s property along the Rio Grande in Monte Vista. โ€œIt makes me sad to go through drought, but every other year is drought.โ€ (Photo by Diana Cervantes for Source NM)

Will it be enough?

For water managers, naming the problem offers more clarity for solutions.  

โ€œThis is no longer drought. This is aridification,โ€ said Cleave Simpson Jr., a longtime Republican state senator and manager of the Rio Grande Water Conservation District, living outside Alamosa, Colorado. 

Drastic river patterns the last two decades and mostly below average flows โ€” plus two of the worst drought events in recorded history in 2022 and 2018 โ€” are harbingers of the permanent change to agriculture and ways of life in the valley, Simpson said.

โ€œUltimately, thereโ€™s going to be less irrigation,โ€ he said. โ€œIf weโ€™re thoughtful, thatโ€™ll be a managed, incremental change, versus if weโ€™re not engaged.โ€

Simpson said it takes both collective decision making from individuals and institutions to build resilience. 

โ€œLook, I raise alfalfa, the most water-consumptive use crop we have here,โ€ Simpson said. โ€œHow do I figure out how to raise something else here?โ€

He and his son raised hemp for fiber, and they found it only consumed half the water compared to the alfalfa crop. 

โ€œI have a 31-year-old son and a 2-year-old grandson,โ€ he explained. โ€œIโ€™m very mindful about being in that space to set this place up for success for being resilient and being able to respond when these water supplies continue to dwindle.โ€ 

Being more efficient, growing crops that require less irrigation โ€” those are just the first steps in finding alternatives to help the community long-term in the valley. 

โ€œItโ€™s worth fighting for,โ€ Simpson said.