The health of our waters is the principal measure of how we live on the land — Luna Leopold
Runoff news
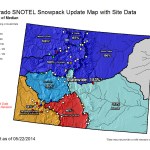
Statewide snowpack map May 22, 2014 via the NRCS. Note all the stations without a report.
Arkansas River Basin High/Low graph May 22, 2014 via the NRCS
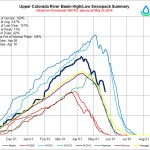
Upper Colorado River Basin High/Low graph May 22, 2014 via the NRCS
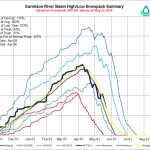
Gunnison River Basin High/Low graph May 22, 2014 via the NRCS
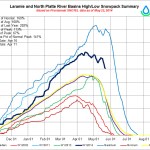
Laramie and North Platte Basin High/Low graph May 22, 2014 via the NRCS
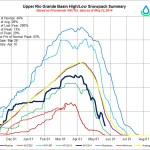
Upper Rio Grande River Basin High/Low graph May 22, 2014 via the NRCS
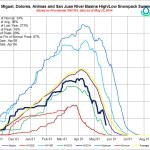
San Miguel, Dolores, Animas, and San Juan Basin High/Low graph May 22, 2014 via the NRCS
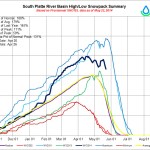
South Platte River Basin High/Low graph May 22, 2014 via the NRCS
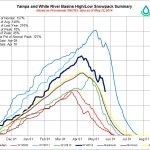
Yampa and White Basin High/Low graph May 22, 2014 via the NRCS
This is the time of year when snowpack numbers do not tell the story well. Also, as you can see above, the statewide map does not contain data from many stations.
The runoff has started all over the state so it’s more fun to watch the slope of the melt-out on the basin high/low graphs. The data in the graphics above do not reflect the recent wet upslope storm system that hit northeastern Colorado.
The southern basins were close to complete melt-out on May 22.
The May peaks in snow water equivalent also occurred in the record water year 2011.