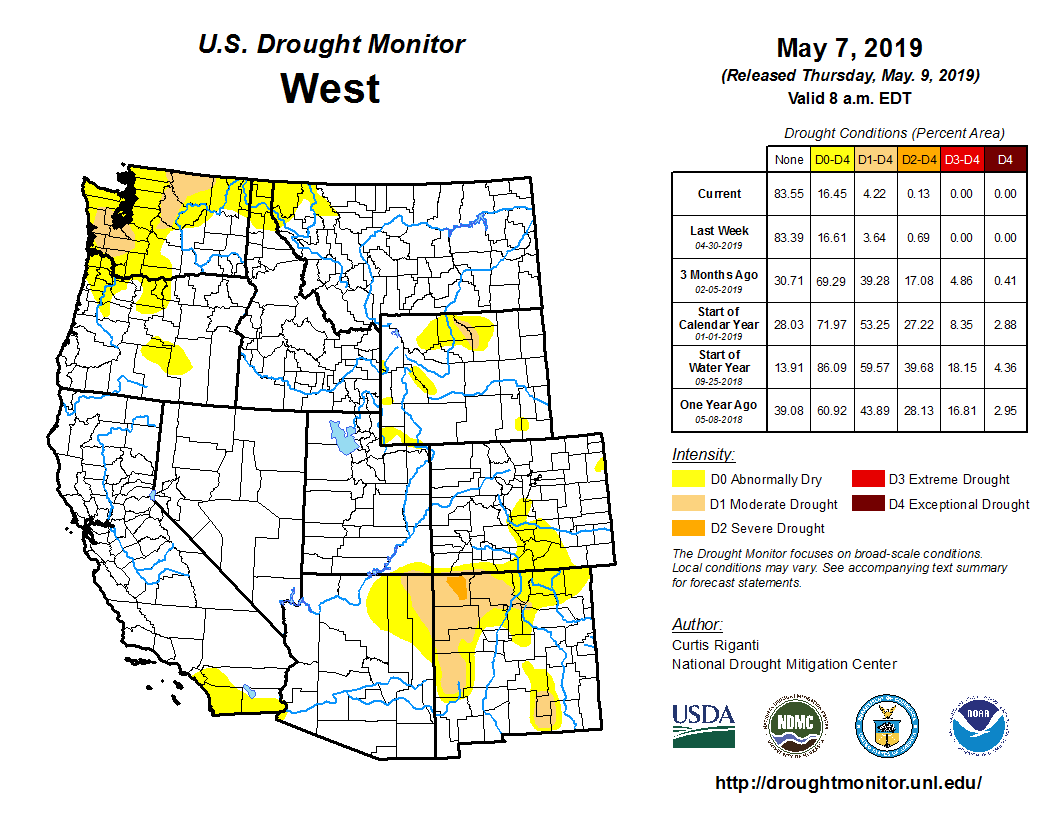
Utah water managers had a big reason to celebrate Friday [May 10, 2019].
Thanks to this year’s snowpack and runoff, Utah’s drought is officially over — at least for now…
It would have been a tough wager to predict Utah would obliterate its drought designation from October of last year after a dismal 2018 gave Utah one of the country’s worst drought designations, yet “we did it in six months’ time,” McInerney said…
Water managers, hydrologists and storm forecasters have been keeping a close eye on Utah’s mountain ranges over the past month, wary of the possibility warm temperatures could rapidly melt this year’s high snowpack and cause damaging flooding.
But Utah’s bipolar weather patterns over the last several weeks have created the perfect conditions to avoid flooding while also filling just about all of the state’s reservoirs…
thanks to several warm-then-cold spells over the last month, Utah still has thick snowpack in high elevations — even creating statistical anomalies in southeastern Utah, where snowpack sits about a mammoth, nearly record-breaking 8,500 percent of average.
“Southeast did fantastic,” said Troy Brosten, Utah Snow Survey supervisor with the U.S. Department of Agriculture’s Natural Resources Conservation Service.
And in high elevations across state, “there’s still quite a bit of snow up there,” Brosten said. “It’s holding pretty good.”
As a result, some reservoirs are already releasing water in anticipation of more runoff. Nearly all of Utah’s reservoirs are expected to fill, with some exceptions including Strawberry (due to its size) and Steinaker Reservoir, which was drained for repair, according to Gary Henrie, a civil engineer with the U.S. Bureau of Reclamation.
Lake Powell, which has struggled due to the nearly 20-year drought on the Colorado River, obviously won’t fill — but it’s expected to see an about 11 percent peak increase. That could mean an almost 50-foot rise in waters for the boating destination, Henrie said.
Along the Wasatch Front, it’s likely rivers will be flowing their highest around the end of May — particularly rivers fed from high elevations such as Big and Little Cottonwood canyons, McInerney said.
The High Plains Aquifer provides 30 percent of the water used in the nation’s irrigated agriculture. The aquifer runs under South Dakota, Wyoming, Nebraska, Colorado, Kansas, Oklahoma, New Mexico and Texas.
Click here to snag a copy to read (Erin M.K. Haacker, Kayla A. Cotterman, Samuel J. Smidt, Anthony D. Kendall, David W. Hyndman). Here’s the abstract:
We use an 82-year record of water table data from the High Plains Aquifer to introduce a new application of segmented regression to hydrogeology, and evaluate the effects of droughts, crop prices, and local groundwater management on groundwater level trajectories. Across the High Plains, we find discernable regional cycles of faster and slower water table declines. A parsimonious Classification And Regression Tree (CART) analysis details correlations between select explanatory variables and changes in water table trajectories, quantified as changes in slope of well hydrographs. Drying relative to prior-year conditions is associated with negative changes in slope; in the absence of drying conditions, steep declines in commodity price are associated with positive changes in hydrograph slopes. Establishment of a groundwater management area is not a strong predictor for change in water table trajectories, but more wells tend to have negative changes in around the time of management areas are formation, suggesting that drought conditions are associated with both negative deflections in water table trajectory and enactment of management areas. Segmented regression is a promising tool for groundwater managers to evaluate change thresholds and the effectiveness of management strategies on groundwater storage and decline, using readily available water table data.
This report was part of the May 3 issue of Mountain Town News.
Peter Butler, of Durango, and Auden Schendler, a town councilman in Basalt, are members of the Colorado Air Quality Control Commission, whose monthly meeting I attended this morning. At hand was whether to go forward with rule-making that would put Colorado in the company of 9 other states in adopting California’s zero-emission vehicle standards. It’s called Regulation 20.
The intent is to accelerate the adoption of electric vehicles. Gov. Jared Polis, in an executive order in January, the first of his administration, directed the air agency to consider the California program.
There are at least two good reasons to do so. One is ozone pollution, ozone being the primary constituent of what we more loosely call smog. Colorado’s Front Range has violated federal ozone standards since 2008, and vehicle emissions are a major reason why. Second, if Colorado has any hope of meeting its greenhouse gas reductions goal, it must reduce emissions from the transportation sector. Transportation became the No. 1 source of greenhouse gas emissions in the United States in 2017.
A staff member of the Colorado Department of Public Health and Environment (an agency now headed by former Eagle County Commissioner Jill Ryan), described electric vehicles as being evolutionary rather than revolutionary. Left to its own devices, the staff member suggested, the free market will eventually embrace electric vehicles for the simple matter of cost. The cost of gasoline to get 100 miles in an internal-combustion engine is 2.5 times that of a battery-powered vehicle.
Of course, electric cars remain more costly. The staff member said the state assumes that battery-powered vehicles will reach up-front cost parity with internal-combustion engines somewhere between 2025-2028. In adopting California’s standards, Colorado will seek to accelerate the rate of adoption, by requiring manufactures to offer more electric vehicles in Colorado.
I sat in the second row, amid a bunch of suits. When it came time for testimony, nearly all of them identified themselves as auto dealers. They objected without exception. They want a voluntary market. They don’t want “cumbersome regulations.” Legislators need to tackle this, not a state agency directed by the governor. If it worked so well for California, why does California have such crummy air quality?
(As for California’s air quality, it has improved as the state now nears 10 percent market penetration of EVs. In Colorado, EV sales in late 2018 neared 3 percent).
The most interesting objection was that hydrogen will be the better solution than electrification, and time should be allowed for the hydrogen-powered cars to come a long. There were objections to subsidization of electric vehicles. We can, said several, do better than this.
The car dealers never did explain why the regulations would be burdensome, nor did they offer evidence of how fast the market, without guidance by government, would respond to the need to abate the pollution, both ozone and greenhouse gases.
But there was pushback. “A lot of people here have said we can do better,” said an individual who identified himself as Josh, a mechanic in a car dealership that specializes in EVs and hybrids. “If we could have done better, we wouldn’t be here (today). I am here because air quality in Denver is just awful and because of climate change, which we all know is a real thing.”
A woman pointed out that car dealers make little money on sale of cars. Their money comes from fixing cars and unlike internal-combustion engines, electric vehicles need comparatively few repairs.
Then came the final testimony of the morning. The speaker, Jim Burness, manages a company called National Car Charging. Revisiting automotive changes of the last 50 years, he pointed out that safety belts came as a result of a government mandate. Ditto for airbags. Ditto for improved fuel efficiency. His take-away conclusion: “Industry today is fighting for their right to pollute, and I find that very disturbing.”
A few minutes later, the commission voted with only a shrug of dissent from a member from Craig to pursue the rule-making. Colorado is hurrying to accelerate the energy transition. As one speaker said, there’s no time to spare.
Here’s the release from the Environmental Protection Agency:
The U.S. Environmental Protection Agency (EPA) announced the availability of $2.6 billion in new funds to assist states, tribes and territories with improving drinking water and wastewater infrastructure across the country. This funding advances President Trump’s efforts to rebuild the country’s aging water infrastructure, create local jobs, and ensure all Americans have safe and clean water.
“EPA is delivering on President Trump’s commitment to modernize our nation’s water infrastructure and improve public health and environmental protections,” said EPA Administrator Andrew Wheeler. “EPA’s $2.6 billion contribution to the State Revolving Funds will enable more communities to make the investments needed to ensure Americans have safe water for drinking and recreation. These funds can also be combined with EPA’s WIFIA loans to create a powerful, innovative financing solution for major infrastructure projects nationwide.”
The State Revolving Funds (SRFs) require state match, loan repayments, and interest that flows back to the funds. With more than 30 years of federal capitalization grants and state contributions, approximately $80 billion has been invested into these programs. According to the agency’s estimate of national drinking water and wastewater needs, over $743 billion is needed for water infrastructure improvements. Through loan repayments and investment earnings, the SRFs have leveraged these contributions to provide more than $170 billion in financial assistance to over 39,900 water quality infrastructure projects and 14,500 drinking water projects across the country.
This year, EPA is making available more than $1 billion in new federal grant funding for the Drinking Water State Revolving Fund (DWSRF). This funding can be used for loans that help drinking water systems install controls to treat contaminants such as PFAS and improve distribution systems by removing lead service lines. In addition, more than $50 million in DWSRF grant funding is available to tribes, U.S. territories, and the District of Columbia to use for drinking water system upgrades.
EPA is also providing approximately $1.6 billion in new federal grant funding for the Clean Water State Revolving Fund (CWSRF). This funding is available for a wide range of water infrastructure projects, including modernizing aging wastewater infrastructure, implementing water reuse and recycling, and addressing stormwater. More than $64 million in CWSRF grant funding is available to tribes, certain U.S. territories, and the District of Columbia for infrastructure projects.
Background:
Under the Clean Water and Drinking Water State Revolving Fund programs, EPA provides funding to all 50 states and Puerto Rico to capitalize SRF loan programs. The states and Puerto Rico contribute an additional 20% to match the federal grants. The 51 SRF programs function like infrastructure banks by providing low-interest loans to eligible recipients for drinking water and clean water infrastructure projects. As the loan principal and interest are repaid over time, it allows the state’s DWSRF or CWSRF to be recycled or “revolve.” As money is returned to the state’s revolving loan fund, the state makes new loans to other eligible recipients.
In 2018, the SRFs committed $9.6 billion in drinking water and clean water infrastructure loans and refinancing and disbursed $8.8 billion for drinking water and clean water infrastructure.
Here’s the release from the U.S. Department of Agriculture (Chris Groskreutz):
Some have called water “the new gold.” When you consider the fact that about one percent of the Earth’s water supply is available for human use, coupled with a growing global population, the comparison makes sense. Irrigator Pro is one irrigation scheduling tool available to farmers. Now, you can access the tool right from your mobile device.
Across the United States and beyond, farmers are looking for innovative ways to conserve water while maintaining or boosting crop yields. With this goal in mind, leading farmers like Marty McLendon are helping others manage water more efficiently. McLendon and his fellow Flint River Soil and Water Conservation District members in Southwest Georgia have used a Conservation Innovation Grant from USDA’s Natural Resources Conservation Service to partner with other like-minded groups to advance technology available for water conservation.
The result? Irrigator Pro now comes with a new tool – an app that allows farmers to access irrigation water management practices right from their mobile device.
A Georgia peanut farmer using his smartphone to monitor his crop’s water needs. Photo credits: Flint River Soil and Water Conservation District, Matt Hanner
“Our goal through this project, and many others, is to significantly advance conservation through partnership and innovation,” said McLendon. “Irrigator Pro will aid farmers throughout our region in making decisions that enhance both water conservation and on-farm efficiency.”
What is Irrigator Pro?
Irrigator Pro is an irrigation scheduling tool for peanuts, cotton, and corn that was first developed by the Agricultural Research Service’s National Peanut Research Laboratory in Dawson, Georgia. It’s a system designed to provide recommendations based on scientific data resulting in conservation-minded irrigation management.
A team of agriculture and conservation partners in Georgia recently unveiled an updated version of the system to now include a smartphone app and web-based platform to increase accessibility. Irrigator Pro is available for free in the Apple and Google Play Stores, or online at IrrigatorPro.org.
How was the new Irrigator Pro developed?
The Flint River Soil and Water Conservation District partnered with the ARS National Peanut Research Laboratory and the University of Georgia to develop a smartphone app and cloud-based web platform for Irrigator Pro. Over the last two years, the team has worked to further develop, refine, and test the new version of Irrigator Pro to ensure it is consistent and user-friendly.
What makes Irrigator Pro better than before?
Irrigator Pro is a trusted tool by many farmers and crop consultants in the Southeast. However, a major barrier to increased accessibility and adoption was the time-consuming nature of the original version of the tool, which required hand-reading soil moisture sensors in the field and manual entry of data into a desktop software platform to generate an irrigation recommendation.
The new version, supported through a CIG, takes the science and models from the old version and integrates them with modern technology to automate the process. Data is retrieved remotely from sensors in the field and automatically sent to the Irrigator Pro server, generating a real-time irrigation recommendation on the app. The website, IrrigatorPro.org, syncs with the app and has additional capabilities that can be configured by users to help document meeting USDA conservation program requirements.
Examples of Irrigator Pro’s smartphone app display. Photo Credit: Austn
How does Irrigator Pro help farmers enhance both efficiency and production?
Irrigator Pro is designed to optimize water use while maintaining or improving yields. The tool utilizes real-time field conditions – including soil moisture, soil temperature, and crop growth stage – to generate an irrigation recommendation.
In a 2018 study at the University of Georgia’s Stripling Irrigation Research Park, researchers evaluated several irrigation scheduling methods for peanuts. The new version of Irrigator Pro out-performed all other treatments in both yield and irrigation water use efficiency.
What’s next for Irrigator Pro?
This season, with funding from the National Fish and Wildlife Foundation and the Southeast Aquatics Resources Partnership, the partner team will be launching a hands-on project with over 40 farmers in Georgia, Florida, and Alabama to use Irrigator Pro and soil moisture sensors on irrigated peanut farms. In the future, project partners would like to expand both the crops and geographic capacity of this tool to help farmers across the country optimize their irrigation decisions.
Visit http://farmers.gov/conserve to learn about additional tools and programs that are available to help you meet conservation goals across your working land.
Forecasters estimate a 70% chance that our current El Niño will continue through the summer, and a 55-60% chance it will extend into the fall.
Just a number
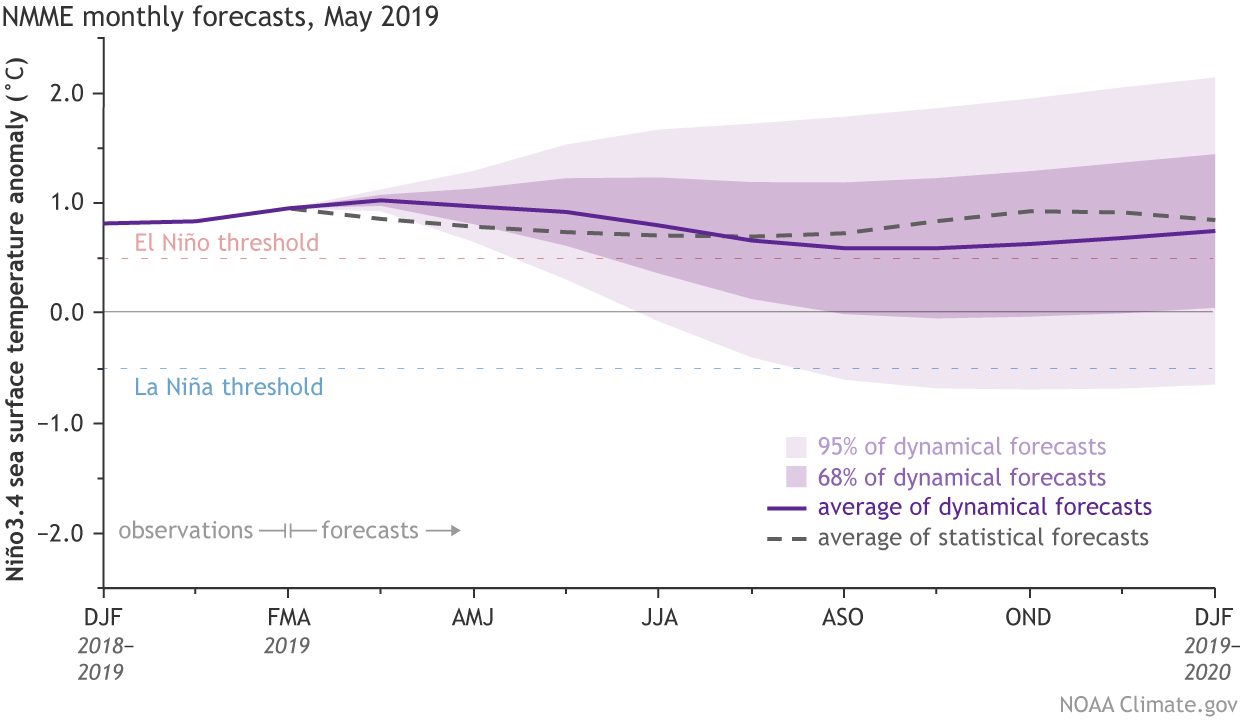
El Niño conditions were still evident across the tropical Pacific Ocean during April, as the sea surface temperature in the Niño3.4 region averaged about 0.7°C warmer than the long-term average (via the ERSSTv5 database). Most computer models predict that the ocean surface will stay warmer than average in the Niño3.4 region, with the majority of predictions remaining above the El Niño threshold of 0.5°C through next fall.
Climate model forecasts for the Niño3.4 Index. Dynamical model data (purple line) from the North American Multi-Model Ensemble (NMME): darker purple envelope shows the range of 68% of all model forecasts; lighter purple shows the range of 95% of all model forecasts. Statistical model data (dashed line) from CPC’s Consolidated SST Forecasts. NOAA Climate.gov image from CPC data.
However, there is a broad range of potential outcomes shown here, and we’re still within the spring predictability barrier, when forecast models have a tougher time making successful predictions, partly due to the tendency of ENSO to be in transition during the spring. We’re starting to pass that barrier, but we still bear it in mind when looking at forecasts made in early May.
Blow out your candles
The atmosphere also continued to reflect El Niño in April, with more clouds and rain forming over the warmer-than-average waters of the central tropical Pacific, and drier conditions over the far western Pacific and Indonesia, although this pattern was somewhat weaker than during February or March.
The near-surface winds in the tropical Pacific, the trade winds, were near average in April. The trade winds usually blow from the east to the west, keeping warm water piled up in the far western Pacific. Changes in these winds are a critical component of the El Niño system. When they weaken in the central Pacific, surface waters can warm, and sometimes allow a downwelling Kelvin wave to form: a large blob of warmer-than-average water that moves from the west to the east under the surface of the Pacific.
After a couple of months of weaker-than-average trade winds (what we expect during El Niño conditions), they were near average overall during April. This slight weakening of the typical El Niño signal is in part due to a reawakening Madden-Julian Oscillation (MJO) in the second half of April.
The MJO is an area of active storms and convection (rising air) that travels from west to east along the equator. It can circle the globe in about 30-60 days. We’ve talked about the MJO quite a bit on the ENSO Blog and climate.gov, since this pattern can affect US weather, and interact with El Niño and La Niña.
The surface and upper-atmosphere structure of the MJO for a period when the enhanced convective phase (thunderstorm cloud) is centered across the Indian Ocean and the suppressed convective phase is centered over the west-central Pacific Ocean. Horizontal arrows pointing left represent wind departures from average that are easterly, and arrows pointing right represent wind departures from average that are westerly. The entire system shifts eastward over time, eventually circling the globe and returning to its point of origin. Climate.gov drawing by Fiona Martin.
Near-surface air is drawn toward the MJO-related area of convection. So when the MJO is over the Indian Ocean, the trade winds in the west-central Pacific are stronger than average, because the inflow to the MJO reinforces them. But when the MJO moves into the central Pacific, the trade winds tend to be weaker, because the inflow to the MJO opposes them.
After going mostly quiet in mid-March, by mid-April the MJO was showing signs of re-development. The trade winds in the western Pacific during mid-late April were stronger than average (more east-to-west), consistent with what we’d expect when the center of MJO convection is in the Indian Ocean. However, during the first week of May, as the MJO moved into the Pacific, the trade winds weakened substantially in the west-central Pacific.
Over the hill
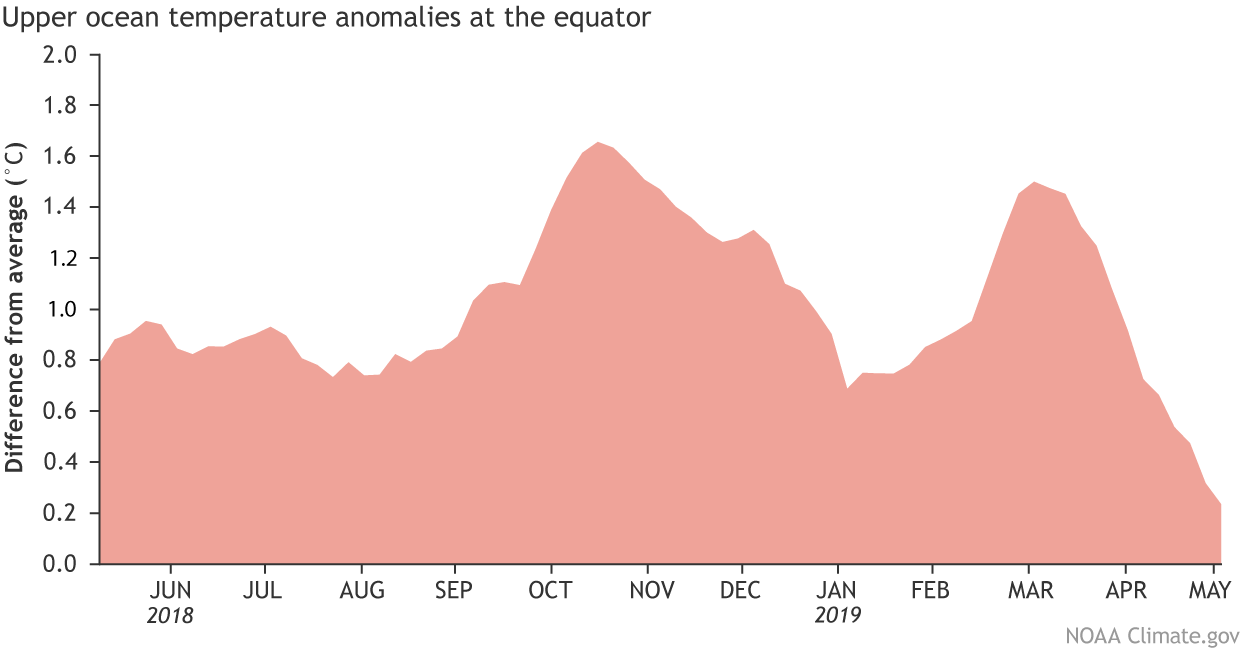
Area-averaged upper-ocean heat content anomaly (°C) in the equatorial Pacific (5°N-5°S, 180º-100ºW). The heat content anomaly is computed as the departure from the 1981-2010 base period pentad (5-day) means. Heat content has been elevated for the last 12 months, but recently decrease. Climate.gov figure from CPC data.
Over the past year, subsurface waters (from the surface down to about 1,000 feet) have remained warmer-than-average overall, but with some substantial increases and decreases, resembling a particularly brutal stage of the Tour de France. If the recent weakening in the trade winds does lead to a downwelling Kelvin wave and increases the subsurface anomalies, it could provide fuel to help this El Niño event to persist. Bikers beware, another uphill climb may be ahead of you.
Bon anniversaire
Lastly, happy 5th birthday to the ENSO Blog! We’ve learned a lot over the past 60 months, and we hope you have, too. We’ve reported on a slow-to-develop, but strong El Niño; consecutive weak La Niñas; and the current, weak El Niño. We’ve built an extensive catalog of posts on ENSO (the whole El Niño/La Niña system), other climate patterns, and many other climate-related topics. Check out our editor’s handy index page for a stroll down memory lane. And, never forget Tom’s three-post series on forecast verification.
The best part is that we have a long list of topics we’re looking forward to covering in future posts, and we’re happy to solicit suggestions in the comments section below on topics you would like us to cover. Thank you for reading us—we’ve had well over 2 million unique page views so far—otherwise, we’d just be yelling into the (trade) winds.
Sen. John Barrasso, R-Wyo., argued in a recent op-ed that fossil fuels, like the coal processed at this Wyoming plant, will continue to power the world for decades, and that the solution to climate change is “investment, invention and innovation,” not regulation. Photo credit: BLM Wyoming
On Saturday (May 11), the levels of the greenhouse gas reached 415 parts per million (ppm), as measured by the National Oceanic and Atmospheric Administration’s Mauna Loa Observatory in Hawaii. Scientists at the observatory have been measuring atmospheric carbon dioxide levels since 1958. But because of other kinds of analysis, such as those done on ancient air bubbles trapped in ice cores, they have data on levels reaching back 800,000 years…
During the ice ages, carbon dioxide levels in the atmosphere were around 200 ppm. And during the interglacial periods — the planet is currently in an interglacial period — levels were around 280 ppm, according to NASA.
But every story has its villains: Humans are burning fossil fuels, causing the release of carbon dioxide and other greenhouse gases, which are adding an extra blanket on an already feverish planet. So far, global temperatures have risen by about 1.8 degrees Fahrenheit (1 degree Celsius) since the 19th century or pre-industrial times, according to a special report released last year by the United Nation’s Intergovernmental Panel on Climate Change.
Every year, the Earth sees about 3 ppm more carbon dioxide in the air, said Michael Mann, a distinguished professor of meteorology at Penn State University. “If you do the math, well, it’s pretty sobering,” he said. “We’ll cross 450 ppm in just over a decade.”
[…]
“CO2 levels will continue to increase for at least the next decade and likely much longer, because not enough is being done worldwide,” said Donald Wuebbles, a professor of atmospheric sciences at the University of Illinois at Urbana-Champaign. “The long-term increase is due to human-related emissions, especially the emissions of our burning of fossil fuels.”
However, he noted that the annual peak in carbon dioxide, which fluctuates throughout the year as plants change their breathing rhythms, occurs right now. The annual average value will be more like 410 to 412 ppm, he said. Which … is still very high.
“We keep breaking records, but what makes the current levels of CO2 in the atmosphere most troubling is that we are now well into the ‘danger zone’ where large tipping points in the Earth’s climate could be crossed,” said Jonathan Overpeck, the dean of the School for Environment and Sustainability at the University of Michigan. “This is particularly true when you factor in the additional warming potential of the other greenhouse gases, including methane, that are now in the atmosphere.”
The last time atmospheric carbon dioxide levels were this high, way before Homo sapiens walked the planet, the Antarctic Ice Sheet was much smaller and sea levels were up to 65 feet (20 meters) higher than they are today, Overpeck told Live Science.
“Thus, we could soon be at the point where comparable reductions in ice sheet size, and corresponding increases in sea level, are both inevitable and irreversible over the next few centuries,” he said. Smaller ice sheets, in turn, might reduce the reflectivity of the planet and potentially accelerate the warming even more, he added.
“It’s like we’re playing with a loaded gun and don’t know how it works.”
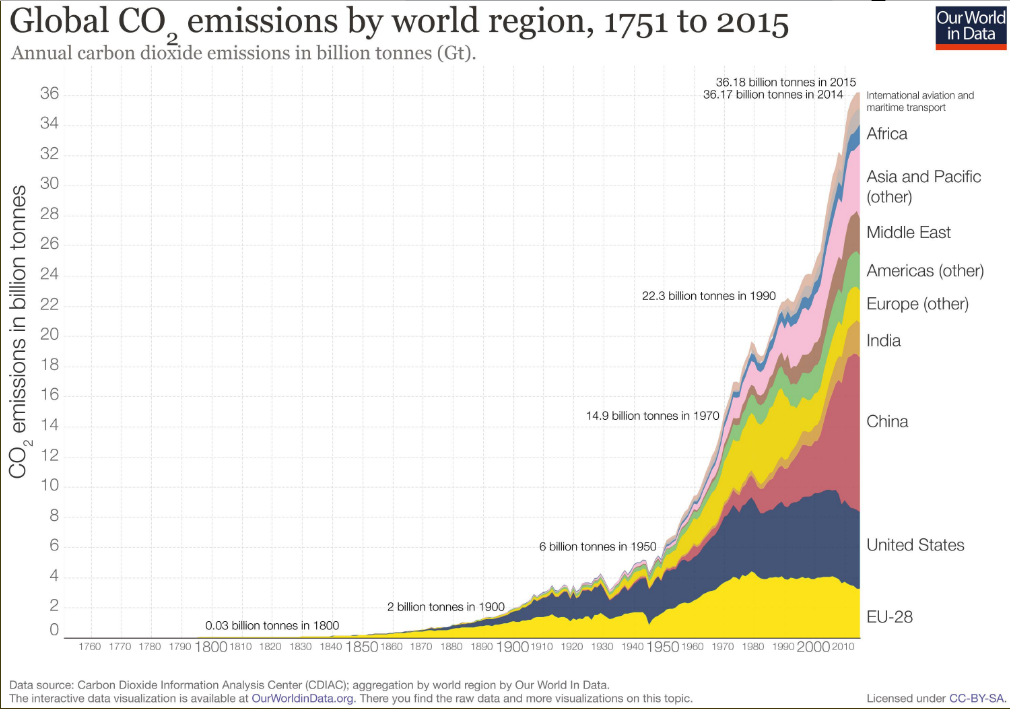
Global CO2 emissions by world region 1751 through 2015.
“The Colorado River runs right right behind our backyard on the (border) of our reservation if you look at the map,” said [Damon] Clarke in an interview. “And we don’t get a drop from it. You guys, down there in the Valley, you get tons and tons of water from the river.”
If a water rights settlement became law, the Hualapai Tribe would get 4,000 acre-feet of Colorado River water each year…
The current bills, introduced in both the U.S. House and Senate, include:
$134.5 million to construct a pipeline bringing most of that water to the reservation, which includes the community of Peach Springs and Grand Canyon West, the tribe’s tourist hotspot;
$32 million for operations, maintenance and repairs once the tribe assumes title over the pipeline;
$5 million for the Department of Interior to operate it before that time;
$2 million for DOI to provide technical assistance to the Hualapai Tribe.
But Interior is still against the specific terms of the settlement.
During testimony in late 2017, Alan Mikkelsen, who was then the deputy commissioner of the Bureau of Reclamation, told the Senate Indian Affairs Committee that while the Department of Interior generally supports settlements for Indian water rights, “we believe the cost to construct a 70-mile pipeline from the Colorado River lifting water over 4,000 feet in elevation will greatly exceed the costs currently contemplated.” In his testimony, Mikkelsen also worried about litigation.
Mikkelsen is now senior adviser to DOI Secretary David Bernhardt. Interior declined an interview, but a spokeswoman said via email that the department’s position on the Hualapai water settlement remains the same.
Rep. Tom O’Halleran (D-AZ01), the lead sponsor of the settlement legislation in the House, said the only sticking point is the dollar amount.
Many Indian reservations are located in or near contentious river basins where demand for water outstrips supply. Map courtesy of the Bureau of Reclamation.
More than a dozen new energy and environment bills are headed to Gov. Jared Polis for a signature. They cover an array of issues from the oversight of electrical generating companies to how companies have to factor climate change into their decision making to the nitty gritty of how oil and gas drilling is governed in the state.
“Given the priority we saw voters make of energy and the environment this past fall they were a really an important part of this past legislative session,” said Kelly Nordini, executive director of Conservation Colorado, an environmental nonprofit.
While momentous, the actual impacts of some policies are yet to be determined. At least two — the oil rule and greenhouse gas reduction goals — will see many details decided in rulemaking by state agencies.
Agencies will release basic ideas on their plans for new regulations. Then they’ll release a draft rule for the public to weigh in on. Some environmental groups plan to put pressure on the state to hold evening sessions, so the public has a better chance to share their concerns.
The oil and gas law, for example, will require at least a half-dozen rules to be written or rewritten. That means it could take years — not months — to completely spell out details of measures that could have the biggest impact on curbing climate change…
Here’s a list of the key energy and environment bills:
Protect Public Welfare Oil and Gas Operations. 29-page bill makes health and safety a priority for regulators and launches more than a half dozen rulemakings on things like flowlines, adopting additional methane controls.
Collect Long-Term Climate Change Data. Directs state health officials to collect greenhouse gas emission data annually, and make data available to local governments.
Building Energy Codes. Local governments required to adopt one of three international energy conservation codes when they update building codes.
Climate Action Plan To Reduce Pollution. Directs Colorado’s Air Quality Control Commission to reduce greenhouse gas emissions 26 percent by 2025, 50 percent by 2030 and 90 percent by 2050.
Housing Authority Properties. Allows public housing authorities to participate in state PACE program, a way to finance clean energy projects.
Sunset Public Utilities Commission. 81-page bill gives new charter for state electric utility regulators, including a move in 2020 to calculate the social cost of carbon dioxide emissions in certain utility proceedings.
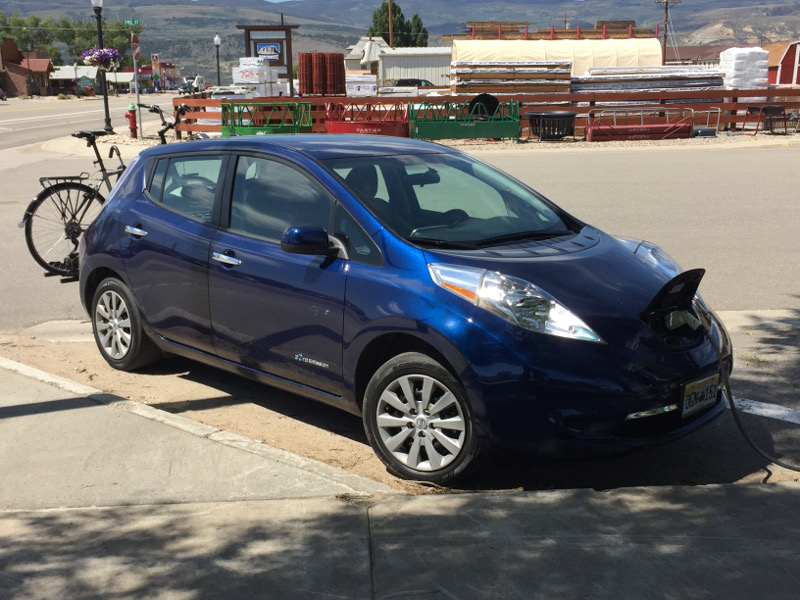
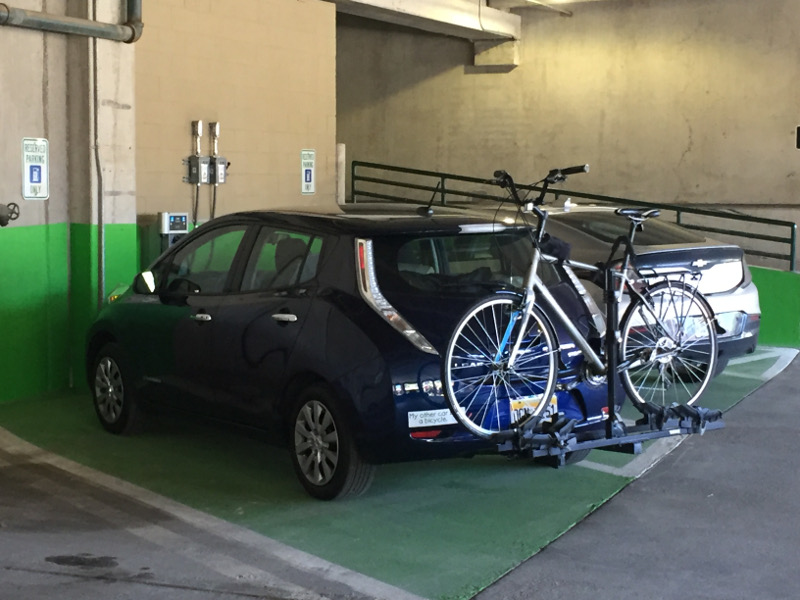
Coyote Gulch’s Leaf connected in the parking garage in Winter Park, August 21, 2017.
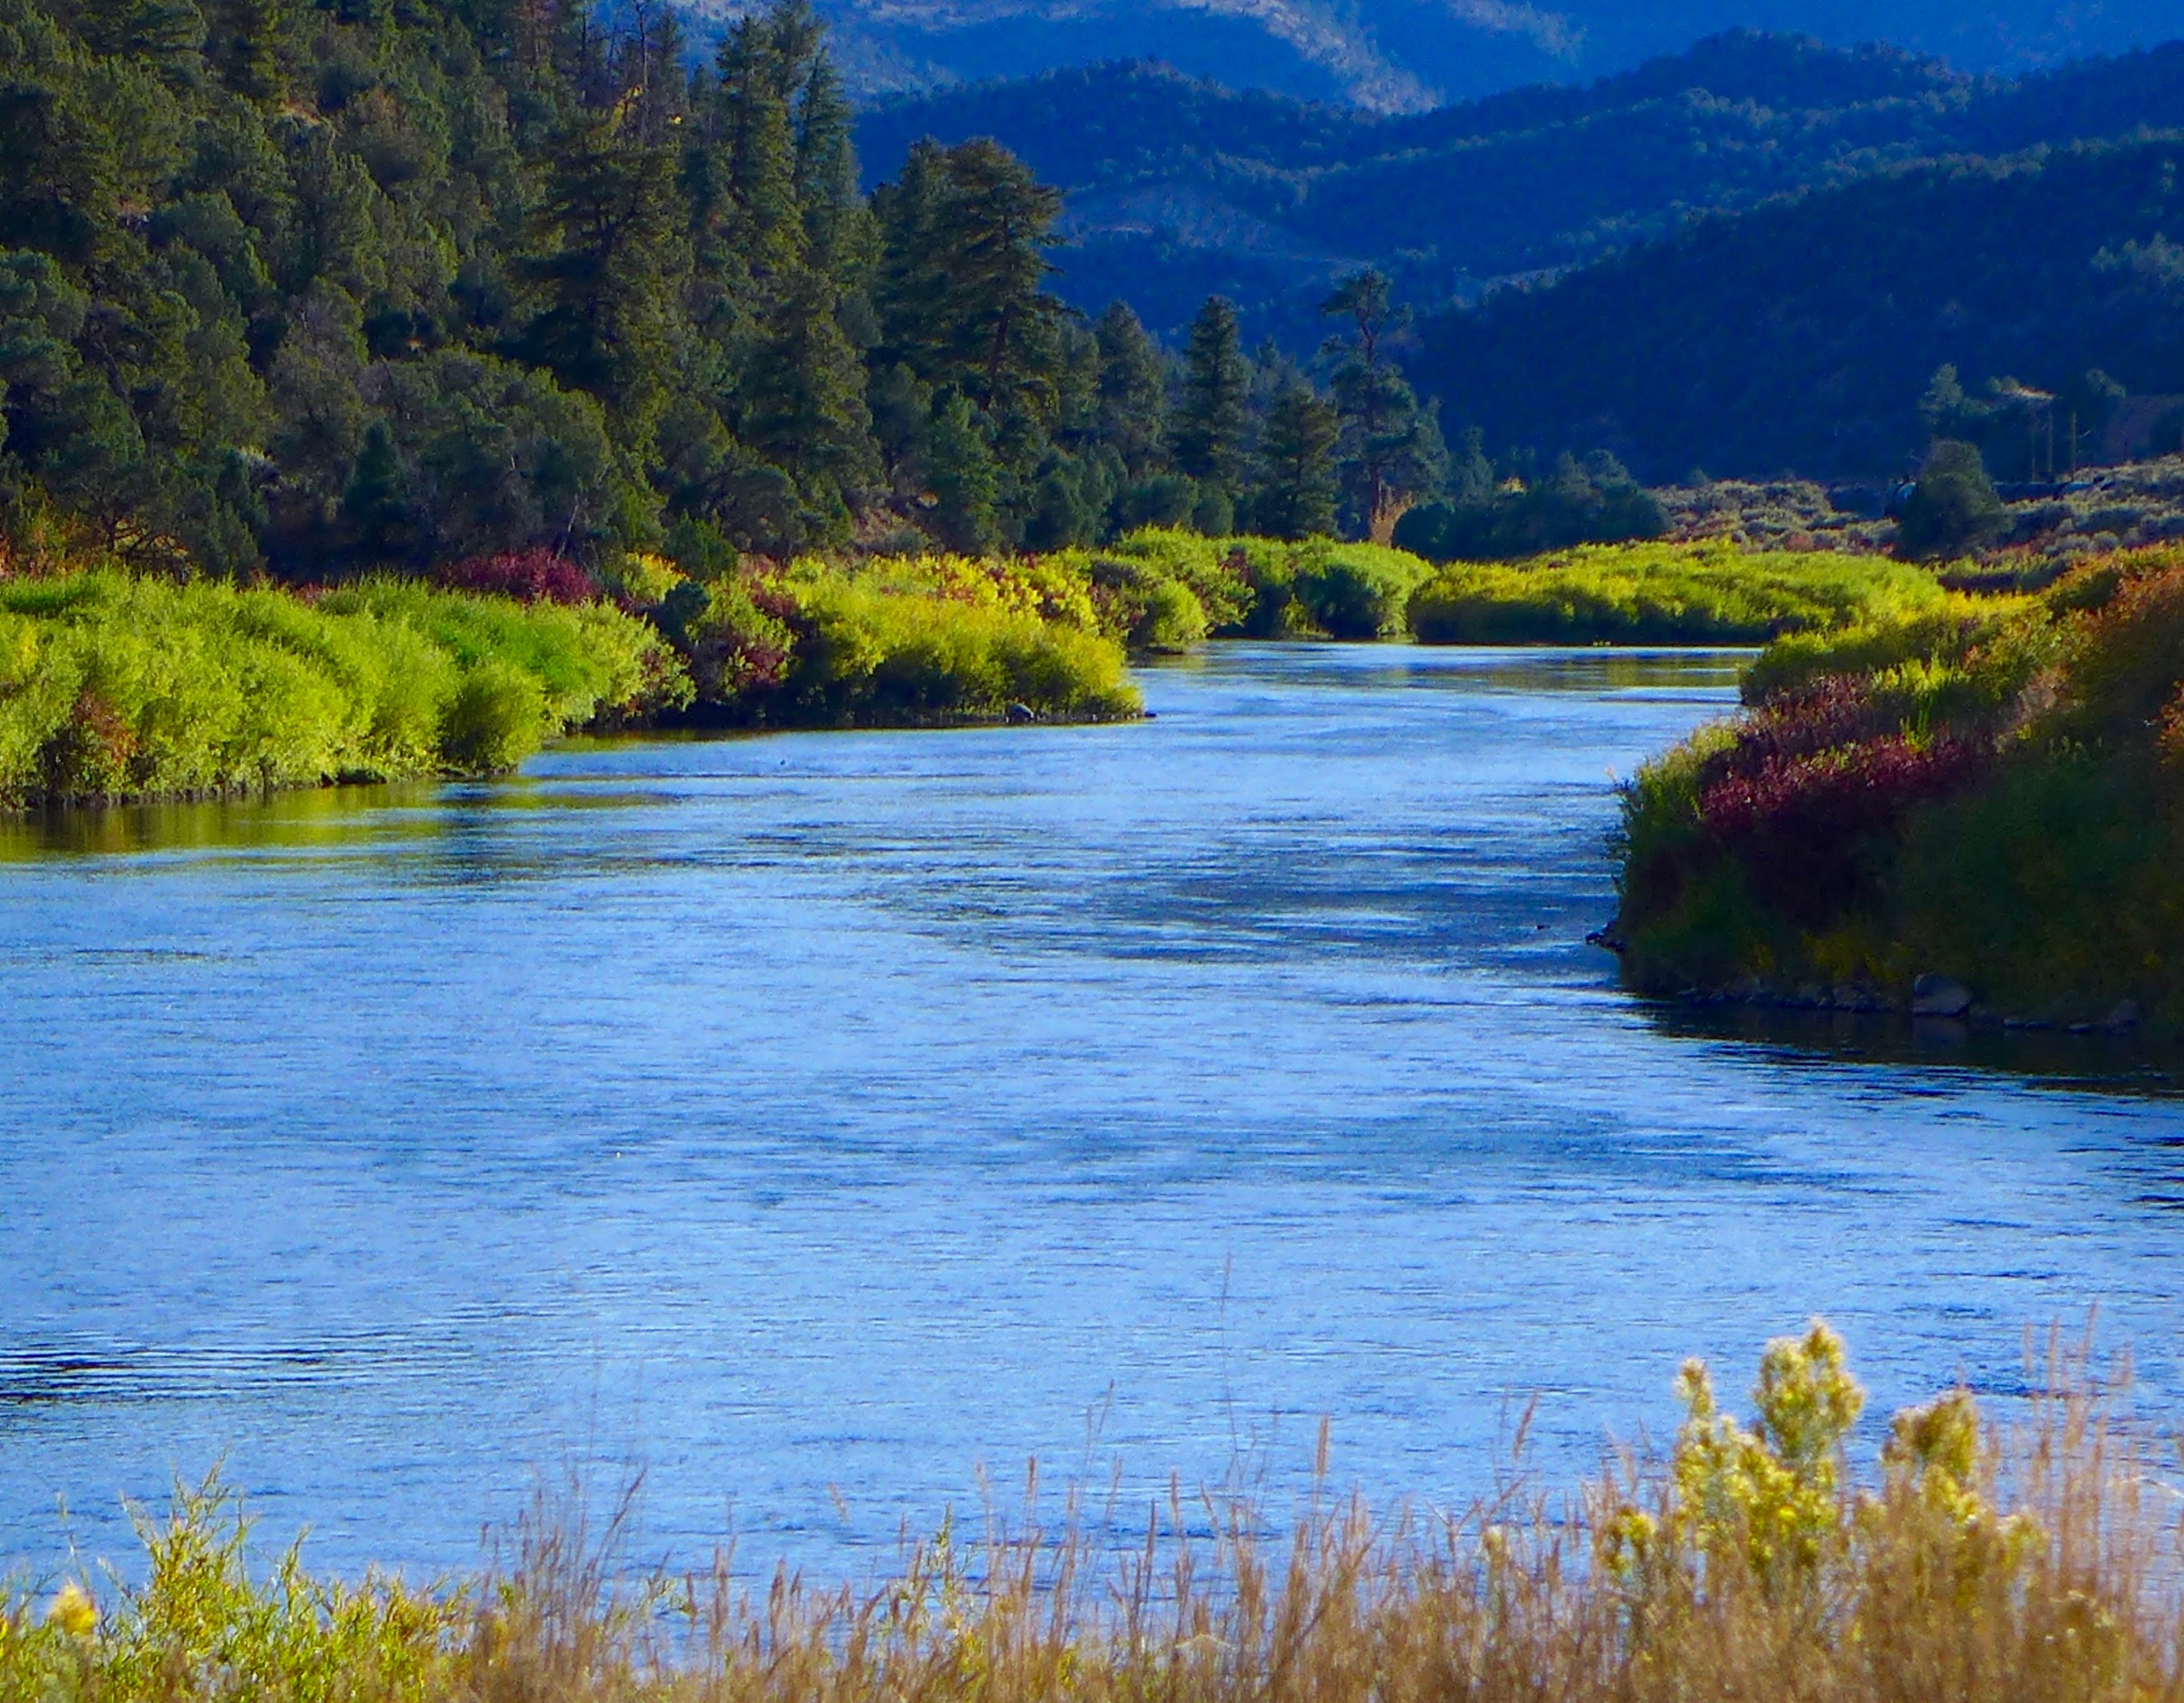
The 17-acre Two Bridges property and 10-acre State Bridge property were acquired by Eagle County in 2011 to improve public access to the river. Additionally, the Eagle County Open Space Program financed improvements at both sites, including boat launches, bathroom facilities, and developed parking areas. During the county’s ownership, the sites were managed collaboratively with the BLM, together with nine existing BLM recreational sites within the Upper Colorado Special Recreation Management Area.
Sticking to the plan
While county officials decided eight years ago that it was important to purchase the formerly private parcels for public use, it was never the county’s intention to keep the sites as part of its open space inventory.
“They always intended to be an interim owner,” said Christine Quinlan of The Conservation Fund. “Everything has now come full circle. The parcels are in the BLM’s hands.”
“It’s also a win for the county because they have recouped $1.8 million through the sale,” Quinlan added.
“This sale fulfills our plan to enhance these two recreational properties for the public, while returning funds to Eagle County Open Space for future uses,” said Eagle County Commissioner Kathy Chandler-Henry. “We are proud of our partnerships to protect land and water while supporting excellent recreation management on the Colorado River.”
Bipartisan support
U.S. Senators Michael Bennet and Cory Gardner and U.S. Representative Scott Tipton (CO-3) supported Colorado’s request for federal Land and Water Conservation Fund dollars and helped secure the Congressional appropriations for permanent protection of the State Bridge and Two Bridges properties. Permanently reauthorized by U.S. Congress this winter, LWCF is a 50-year-old bipartisan, federal program that uses a percentage of proceeds from offshore oil and gas royalties — not taxpayer dollars — to acquire critical lands and protect natural resources.
The State Bridge and Two Bridges properties are heavily used for boating and recreation. The Two Bridges property provides a popular put-in and take-out site on the 10-mile stretch between State Bridge and the Catamount Bridge Recreation Site.
The conservation of the Two Bridges and State Bridge parcels complemented the previous addition of the 9-acre Dotsero Landing site to the Upper Colorado River Special Recreation Management Area. In 2016, in cooperation with Eagle County and The Conservation Fund, the BLM used similar federal funding to acquire Dotsero Landing, providing continued river access where the Eagle and Colorado Rivers join. Quinlan noted that together, the three river access sites are helping to secure the significant scenic, recreational, cultural, and wildlife resources along the upper basin of the Colorado.
During recent testing mandated by the Colorado Department of Public Health and Environment at 20 different sites earlier this year, the town discovered that seven had lead levels in excess of the state’s maximum allowable limit of 15 parts per billion. The finding comes just months after Frisco discovered a similar issue in their sampling pool.
Dillon officials stress that the town has good, clean surface water.
“We don’t have lead in our source water,” said Scott O’Brien, Dillon’s public works director. “We’ve monitored for that, and it’s not the issue. … The issue is the materials that were used prior to 1987 for constructing homes, copper pipe with leaded solder. In addition to that, a lot of fixtures like faucets were constructed with either brass or bronze — metal alloys that contain lead.”
O’Brien said that because the source water is so “aggressive,” it’s leeching the lead out of older pipes and fixtures at testing sites, resulting in the elevated rates. In determining aggressiveness, the town looks at four main factors: pH levels, alkalinity, temperature and hardness.
The pH level in the water measures how acidic or basic the water is on a scale of 0 to 14 — anything below 7 is considered acidic, and anything higher is considered basic. In general, high acidity means the water is more corrosive, and more likely to leech metal ions like lead and copper. Dillon’s source water is naturally about 7.3, or slightly leaning towards the basic side.
Alkalinity is a measure of the buffering ability of the water, essentially the ratio of hydrogen ions versus hydroxide ions that determines the water’s ability to neutralize acid. O’Brien noted that Dillon’s water has low alkalinity. Temperature is self-explanatory, literally describing how hot or cold the water is — wherein hotter water is more reactive and aggressive than cold water. Hardness measures the mineral concentration in the water, or what it’s naturally picking up as it flows along. Because Dillon uses its source water so quickly, it is relatively soft.
“We’re the first in line to pick it up, and it doesn’t have the chance to pick up these other minerals and other things that help reduce the aggressiveness of the water,” said O’Brien.
This is a problem that Dillon has dealt with in the past. The town’s testing also returned high lead levels in both 2012 and 2014, and officials have been working with the state since to address the issue. In 2014, the town attempted to adjust the pH levels up to about 8.5 on the scale, which appeared to have worked over the last five years. Though, due to recent changes in regulations from the state level — which essentially requires towns to zero in on high-risk testing sites to determine the worst-case scenarios for water quality issues — new issues are being discovered.
“To get a representative sample pool they don’t want us to go over the distribution system geographically, and sample it spread out,” said Mark Helman, chief water plant operator. “They want us to sample these particular sites built from 1983 to 1987 (before the Lead Contamination Control Act in 1988) they know are going to give us the worst results. … This is a process of us learning where the worst sites are that we have, testing those sites, seeing how our water is doing at those sites, and if we have a problem we want to address the worst case scenario.”
Both O’Brien and Helman noted that they already have a plan to try and address the issue of overly aggressive water. The plan is to add soda ash — sodium carbonate or baking soda — during the water treatment process to increase pH levels, alkalinity and hardness to the water to reduce aggressiveness. However, because it includes changes to the plant, the new process must first be signed off on by the state.
O’Brien said that once the state approves the town’s new water treatment methods they’ll be able to implement the new process quickly, though the review process could take between 30 and 60 days.