Click here to read the newsletter. Here’s an excerpt:
FOREST THINNING AND SNOWPACK
A new article in Frontiers in Forests and Global Change looks at how forest thinning can impact snowpack, with promising results for thinning strategies that would also serve fire suppression and wildlife habitat goals.
A trail of wolf tracks observed by Colorado Parks and Wildlife officers in Northwest Colorado on January 19, 2020. Photo credit: Colorado Parks & Wildlife
FromThe Fort Collins Coloradoan (Miles Blumhardt):
Now that a pack of wolves has been confirmed in Colorado for the first time in decades, could the state also have its first breeding pair?
Answering that question could have ramifications for a ballot initiative and legislative bill that calls for reintroducing wolves, predators that have been absent from the state since the 1940s (aside from sporadic reports of wandering lone individuals).
Both measures require the state to establish a sustainable wolf population. However, wording in the bill allows the state to cancel reintroduction efforts if the gray wolf already has a self-sustaining population.
“There is some trickiness and uncertainty for the ballot initiative and legislation (if the pack does produce young in Colorado), but you need a couple of packs successfully producing a couple of years to call it a population,” said Eric Odell, Colorado Parks and Wildlife species conservation program manager.
Now that a pack has been reported in the state for the first time in 80 years, the start of that self-sustaining population may already be happening.
Currently, neither Colorado Parks and Wildlife nor the U.S. Fish and Wildlife Service is actively monitoring the pack, which was discovered in the northwest corner of the state earlier this month…
If the pack was captured and tracking collars applied, it would identify if there is a breeding pair of adults, allow biologists to locate a possible den site and help determine if the pair produces young in the state this spring…
Carbondale rancher Bill Fales said he would like to see the pack more closely monitored.
“I think we need to know if they are breeding and what they are eating, and the sooner we know that information, the better,” said Fales, while checking calves at his ranch Friday.
Rob Edward, president of the Rocky Mountain Wolf Action Fund, which is spearheading the ballot initiative, said more closely monitoring the pack may not be needed until later.
“It is conceivable in the future that there will be a closer eye paid to them because it will play into discussions of what we do going forward with reintroduction or augmentation of the wolf population,” he said…
What biologists do know about the pack
Odell said district wildlife mangers used spotting scopes to locate six wolves from more than a mile away on March 4. The pack was spotted several miles south of where the animals were initially seen in January in Moffat County.
He said no tracking collars were seen on any of the wolves verified by CPW employees. He said genetic evidence collected from the pack’s scat samples near an elk kill indicated three females and one male and that the animals are siblings. Their age is unknown.
He said it is unknown if the other wolves in the pack are parents of the siblings. If that is the case, it would indicate a breeding pair but would still leave unanswered whether the parents produced the siblings in Colorado.
Wolves generally breed in January and February and give birth in April and May. Wolf packs are usually made up of parents and their pups from the previous several years.
“You can connect the dots and make an educated guess based on the genetics that there has been reproduction in the past, maybe even last spring,” he said. “But that could have taken place in Colorado, Utah, Wyoming, who knows.”’
Edward said it is likely if there are adults in the pack and they do produce young in the state this spring, given the current monitoring of game cameras and the local’s interest in the wolves, they will be seen.
Confluence of the Little Colorado River and the Colorado River. Climate change is affecting western streams by diminishing snowpack and accelerating evaporation, a new study finds. Photo credit: DMY at Hebrew Wikipedia [Public domain]
With another World Water Day upon us, it is a good time to examine how we can accelerate progress in solving wicked water problems, including achieving United Nations Sustainable Development Goal 6, ensuring the availability and sustainable management of water and sanitation for all.
I come back to the belief that we can create water abundance and achieve SDG 6. I am not alone in believing we can create abundance with regards to water. What that looks like is universal access to safe drinking water and ample water supply for economic development, business growth and ecosystem health.
This is not a strategy of increasing water supplies to accommodate business-as-usual practices in the water sector. Instead, it is a view that innovation in technology, financing, business models, partnerships and policy will enable society and business to do more with less water in a sustainable manner.
Creating abundance
Creating abundance is integral to the work of Peter Diamandis and the X-PRIZE Foundation. I was introduced to the mindset of creating abundance when I led the 2016 Safe Drinking Water X-PRIZE Sponsored by Brita. This experience convinced me that we can create abundance through deploying exponential technologies such as digital solutions (think: IoT devices, artificial intelligence applications and data acquisition and analytics via remote sensing).
Consider what digital technologies have accomplished in education, healthcare and transportation — increasing access to essential services and resources. The same potential exists for water. I also have expanded my view that it is not just innovation in scaling exponential technologies but also driving innovation in financing, business models, partnerships and policy that can create water abundance.
The view of water abundance has gained traction over the last few years, in reports such as “Creating 21st Century Abundance through Public Policy Innovation: Moving Beyond Business as Usual” and “Water Stewardship and Business Value: Creating Abundance from Scarcity.” A recent report from the World Resources Institute (WRI). “Achieving Abundance: Understanding the Cost of a Sustainable Water Future,” advances the thinking behind this strategy.
Sure, a sustainable water future comes at a cost. However, compared to the cost of business as usual, the investment is more than reasonable. As outlined in the WRI report, “It is estimated that to achieve sustainable water management for all countries and major basins is $1.04 trillion annually to close the gap between renewable water supply and demand.”
The report also references specific benefits of sustainable and accessible water management:
The return on investment ratio for water access, sanitation and hygiene (WASH) services ranges from 0.6 to 8.0. The primary drivers of these economic benefits are health-related improvements and fewer deaths associated with water-related diseases.
The World Bank estimates that regional GDP decline from water scarcity can be avoided through more efficient water allocation and policies.
The estimated benefit of reducing water scarcity risk globally for agriculture at $94 billion annually.
It is estimated that one in six cities (sample size was 4,000) that implemented source protection measures could net immediate positive returns through recued treatment costs. Associated benefits would be improved local health and well-being, higher biodiversity value and carbon value on top of saving water treatment costs.
It is unclear if these estimates assume incremental improvements in technologies and if the positive impact of deploying exponential technologies (such as digital solutions) and innovation in financing, business models, partnerships and policy were considered. Regardless, the WRI paper does map out a path forward and the investment required with a focus on the private sector.
The bottom line is that water abundance is achievable, and I believe even more so if exponential technologies are commercially scaled.
Click on the image to go to the UN World Water Day 2020 website.
At a regular meeting of the Pagosa Area Water and Sanitation District (PAWSD) Board of Directors on March 12, District Manager Justin Ramsey noted that COVID-19 cannot be spread through drinking water.
“It’s very susceptible to chlorine,” Ramsey said. “We do keep chlorine in our water.”
However, COVID-19 can be found in sewage, Ramsey noted, adding that there are other unhealthy things found in sewage as well…
The only way PAWSD could be affected by COVID-19 is if too many staff members were to get sick, Ramsey added later.
According to Ramsey, the state of Colorado has put together a program, called CoWARN [Colorado Water/Wastewater Agency Response Network] that allows PAWSD to “share” equipment and staff.
“So if PAWSD gets hit real hard with this, I can call Durango and say ‘I need two water operators’ and if they have them available, they’ll send them to us,” he said. “It sets out how we’re going to pay for it and pay them back and so on and so forth.”
In a follow-up interview on March 17, Ramsey noted that PAWSD is now a part of CoWARN.
Additionally, Ramsey noted that PAWSD has run into issues with citizens using and flushing items that cause problems with PAWSD’s infrastructure.
“It is causing somewhat of a problem. It’s not a major catastrophe, but it is definitely clogging some pumps and causing a little bit of issues,” he said.
On March 17, PAWSD’s administrative offices closed to the public indefinitely, Ramsey explained in an email.
PAWSD customers will still receive regular water and wastewater service, Ramsey noted.
The proliferation of fake news about the COVID-19 pandemic has been labelled a dangerous “infodemic”. Fake news spreads faster and more easily today through the internet, social media and instant messaging. These messages may contain useless, incorrect or even harmful information and advice, which can hamper the public health response and add to social disorder and division.
Confusingly some fake news also contains a mixture of correct information, which makes it difficult to spot what is true and accurate. Fake news may also be shared by trusted friends and family, including those who are doctors and nurses. They might not have read the full story before sharing or just glanced over it. Before you decide to share, make sure to read stories properly and follow some checks to determine the accuracy.
If the story appears to claim a much higher level of certainty in its advice and arguments than other stories, this is questionable. People will be seeking certainty in a time of high uncertainty, anxiety and panic. So it is only natural to more readily accept information that resolves, reassures and provides easy solutions – unfortunately, often in a false way.
Similarly, if a story is more surprising or upsetting than other stories it is worth double-checking, as fake news will try to grab your attention by being more exaggerated than real stories.
What to look out for
Source.
Question the source. References have been made to “Taiwanese experts” or “Japanese doctors” or “Stanford University” during the outbreak. Check on official websites if stories are repeated there. If a source is “a friend of a friend”, this is a rumour unless you also know the person directly.
Logo:
Check whether any organisation’s logo used in the message looks the same as on the official website.
Bad English:
Credible journalists and organisations are less likely to make repeated spelling and grammar mistakes. Also, anything written entirely in capital letters or containing a lot of exclamation marks should raise your suspicions.
Pretend social media accounts:
Some fake accounts mimic the real thing. For example, the unofficial Twitter handle @BBCNewsTonight, which was made to look like the legitimate @BBCNews account, shared a fake story about the actor Daniel Radcliffe testing positive for coronavirus. Media platforms try to remove or flag fake accounts and stories as well as verify real ones. Look out for what their policies are to try to do this.
Over-encouragement to share:
Be wary if the message presses you to share – this is how viral messaging works.
Use fact-checking websites:
Websites such as APFactCheck and Full Fact highlight common fake news stories. You can also use a search engine to look up the title of the article to see if it has been identified as fake news by the mainstream media.
Who to trust
The best sources to go to for health information about COVID-19 are your government health websites and the World Health Organization website. Primary sources are generally better than news articles.
Even government messaging and the mainstream media can get things wrong, but they are more trustworthy than unverified sources on social media and viral messaging. For instance, The Conversation is a more trusted source because all content is written by academics who are experts in their fields.
The effects can also be more serious than losing some cash. Iran has reported at least 44 people died from alcohol poisoning after drinking bootleg alcohol in a misguided attempt to cure COVID-19.
Unfortunately, the most basic and correct advice given so far does not offer a miracle or special insight. Wash your hands often (use hand sanitisers if you cannot), avoid touching your face, and sneeze or cough into the crook of your elbow or a tissue (and throw it away in a bag-lined bin). Avoid crowds and public places, keep a sensible distance from people, and do not travel unless absolutely necessary. Now many governments are introducing measures including travel bans and quarantines that need to be followed to protect the health of everyone, especially the most vulnerable.
We can all get caught out. Think twice about the messages currently circulating and help guide your family and friends to decide what to trust.
“Kenny Rogers left an indelible mark on the history of American music. His songs have endeared music lovers and touched the lives of millions around the world,” a statement posted by Hagan says.
Rogers was inducted to the Country Music Hall of Fame in 2013, for what organization officials called a “distinctive, husky voice.”
He had 24 No. 1 hits and through his career more than 50 million albums sold in the US alone.
He was a six-time Country Music Awards winner and three-time Grammy Award winner, Hagan said.
“Country Music has lost the great Kenny Rogers, who has forever left a mark on Country Music’s history,” the Country Music Association said in a statement. “His family and friends are in our thoughts during this difficult time.”
Some of his hits included “Lady,” “Lucille,” “We’ve Got Tonight” and “Through the Years.”
[…]
In 1985, he participated in the original recording of “We Are the World” along with more than three dozen artists. A year later, according to his website, he co-chaired “Hands Across America,” a campaign which sought to raise awareness about the homeless and hungry in the US.
… thanks to the March 19 snowstorm, the San Juan and Gunnison basins are now approaching average.
“Now the southern half of the state is close enough to average, we’re definitely going to feel more comfortable instead of the growing concern we’ve been seeing,” assistant state climatologist Becky Bolinger said.
The northern and central mountains didn’t see much of a boost in snowpack last week, but Bolinger adds “they’re keeping up with average or just above average.”
February and March are key months for building Colorado snowpack, which fills the state’s water reservoirs.
The one caveat to all good snowpack news is that predicted runoff is expected to be lower than normal, according to the Colorado River Basin Forecast Center. This is because low precipitation in the fall created thirsty soils, which could grab moisture from spring runoff before it makes its way to reservoirs.
“Even though snowpack is looking good, the precipitation accumulation since October has been lower,” Bolinger said. “Once that melting starts, say we have a normal season, we would have to get soil moisture back to a normal level, so that might mean there’s less for reservoirs.”
Homeland Security on March 19 announced that agriculture is among 16 industries the department deems a critical infrastructure industry that should continue operations. While this may not have come as any surprise to the thousands calving cows, many of them in blizzard conditions Thursday, it provides some guidance.
The roles recognized by the department as critical include those raising animals for food, animal production operations, slaughter and packing plants and associated regulatory and government workforce, veterinary health, farm truck delivery and transportation, those involved in field crops, and a host of others in supporting industries.
The Livestock Marketing Association said it is actively working with federal, state, and local officials to ensure the continuity of business while taking into account the public health consequences of the COVID-19 virus situation. The group said in a press release that markets are essential to producers as well as to maintaining the infrastructure and food supply for consumers…
In order to mitigate disease spread, the LMA suggests utilizing social media and websites to communicate changes to producers. In the case of needing to reduce crowd size, request that consignors drop off livestock and not remain on the premises for the sale and offer flexibility to sellers needing to pick up checks by offering to bring checks to their vehicle.
Some markets, including Centennial Livestock Auction, are encouraging buyers to sign up for online bidding accounts prior to sales and have moved to online sales. Many production sales already offer online bidding and are continuing to do so.
The Colorado Cattlemen’s Association asked Governor Jared Polis on Tuesday to allow markets and bull sales to continue despite limits on gatherings, though no answer had been received at press time.
In a letter to Gov. Polis, the CCA said the sale of livestock is a critical element of the food supply system and at least 14 markets sell livestock in the state as frequently as weekly. Additionally, bull sale season is in full swing in the state, constituting for many, an annual paycheck. Interruption of these sales would have lasting impacts throughout the food chain and are time sensitive.
Sterling Livestock Commission manager Jason Santomaso said Friday morning they are moving forward with the regular and production sales so vital to producers this time of year though online bidding remains an option.
In Brush, Colo., Chuck Miller, owner of Auctioneers Miller and Associates, said regular sales would continue as they are outdoors and are necessary as buyers and consignors alike, many of whom are farmers and ranchers, make the time sensitive, necessary decisions that will affect future crops. AMA has offered online sales for a number of years, as well, and will continue to do so. However, Thursday evening, Gov. Polis announced an updated executive order shuttering additional non-essential businesses. Miller said after conferring with legal counsel, the usual Wednesday and Saturday sale will be an online-only Wednesday and Thursday sale.
After an unusually mild winter across the nation, forecasters are now calling for a substantially warmer-than-normal spring.
The National Weather Service, AccuWeather and the Weather Company, in rare lockstep agreement, are all predicting above-average temperatures into June…
Hues of orange, signaling various degrees of anomalous warmth, cover the maps…
The Weather Service and AccuWeather both forecast the strongest warm signal in the eastern United States and along the West Coast, with a weaker signal in the middle of the nation…
While factors such as the strength of the polar vortex and ocean and atmosphere cycles, such as El Niño, play a large role in a given season’s weather, the long-term increase in average temperatures due to human-caused climate change are increasing the likelihood of abnormal warmth.
The months of December, January and February – which meteorologists define as winter here in the Northern Hemisphere – were the second-warmest on record, federal scientists announced Friday.
Only the El Niño-fueled winter of 2015-16 was warmer, the National Oceanic and Atmospheric Administration said. El Niño, a natural warming of sea water in the tropical Pacific Ocean, acts to boost global temperatures.
Global temperature records for the Earth go back to 1880.
Some of the most extreme warmth was in Russia, which smashed its record for warmest winter. Temperatures there were as much as a whopping 12 degrees above average, according to the country’s weather service.
Map credit: NOAA
All the weird warmth messed with the region’s flora and fauna, as Gizmodo noted. Flowers started to bloom early in the winter, and some bears even awoke from hibernation at the Bolsherechensky Zoo, the Washington Post said.
In Europe, France had its warmest winter on record, while both Austria and the Netherlands had their second-warmest winter. Austria has a long history of keeping weather data: temperature records there go back to 1767, when Mozart was 11 years old.
Alaska’s coldest February and winter in 21 years; Sixth warmest winter on record for contiguous U.S.
During February, the average contiguous U.S. temperature was 36.2°F, 2.4°F above the 20th century average. This ranked among the warmest one-third of the 126-year period of record. Despite being on record pace for warmest winter on record in January, the winter (December–February) average contiguous U.S. temperature was 36.0°F, 3.8°F above average, ranking sixth warmest winter on record.
The February precipitation total for the contiguous U.S. was 2.40 inches, 0.27 inch above average and ranked among the wettest one-third of the historical period of record. The winter precipitation total was 7.71 inches, 0.92 inch above average, and ranked among the wettest one-third of the 125-year period of record. For the 12-month period March 2019–February 2020, the precipitation total was 34.12 inches, 4.16 inches above average and the sixth wettest March–February period on record.
This monthly summary from NOAA National Centers for Environmental Information is part of the suite of climate services NOAA provides to government, business, academia and the public to support informed decision-making.
Temperature
Much-above-average temperatures were observed across parts of the Mid-Atlantic and Northeast as well as portions of California and Florida. New Jersey and Rhode Island ranked third warmest, while Maryland, Delaware and Connecticut ranked fifth warmest.
Below-average temperatures were observed across portions of the central Rockies to western Texas during February. No state ranked below average for the month.
The Alaska February temperature was 1.5°F, 3.3°F below the long-term average. This ranked among the coldest one-third of the 96-year period of record for the state and was the coldest February since 1999.
The North Slope had its coldest February in 31 years.
It was the coldest February since 1984 in Utqiaġvik (Barrow).
Utqiaġvik had seven days in February with low temperatures as cold or colder than −40°F — the most in any February since 1984 and in any calendar month since January 1989.
Cold temperatures across the region were a catalyst for rapid ice growth across the Bering Sea in February, where sea ice extent expanded to 100% of average for the month. This was the first February since 2013 where the Bering Sea ice extent was not below average.
Precipitation
Much-above-average to record wet conditions were present across much of the Southeast during February, as flooding rainfall on multiple days caused landslides and severe damage to roads and other infrastructure. In Jackson, Mississippi, the Pearl River crested at its highest level since 1983, inundating many homes. Several other rivers across Alabama and Mississippi were near-to or above flood stage. Georgia ranked second wettest, while Alabama and North Carolina ranked third wettest for the month.
After a dry January across southwestern California, February brought little to no relief, with many locations reporting less than 5% of average rainfall. California ranked driest on record for February with 0.20 inch of precipitation, besting the previous record of 0.31 inch set back in 1964.
Stations across the San Francisco Bay area and interior parts of northern California tied or set records for driest February on record. San Francisco, San Jose, Sacramento, Oakland and many other stations received no precipitation during the month, setting local records for the driest February.
Air temperatures during the winter were warm enough across the Great Lakes to keep surface water temperatures above freezing across a large portion of the basin. As a result, enhanced lake-effect snow events occur much later in the season than on average, which lead to higher seasonal snowfall totals. This was indeed the case during February 27–29, as heavy lake effect snowfall impacted portions of the Tug Hill Plateau region of upstate New York. Cold and blustery winds blew across the length of Lake Ontario, over the relatively warm waters, lifting moisture and dumping several feet of snow along the downwind communities. Carthage, New York, received 48 inches of snowfall from this event while Croghan and Redfield observed 42.5 inches and 31.2 inches, respectively. Other communities south of Buffalo received between one and two feet of snow from this event and lesser amounts across the Upper Peninsula of Michigan According to the March 3 U.S. Drought Monitor report, 11.5% of the contiguous U.S. was in drought, up slightly from 11% at the end of January. With the extremely dry conditions during January and February across California, moderate drought blossomed across 34% of the state over the last three weeks and expanded across Oregon and into Nevada. In Texas, the drought footprint contracted, yet intensified as extreme drought expanded across parts of south Texas. Drought conditions improved across Hawaii. as well as the northern Lower Peninsula of Michigan.
Winter Temperature
The Arctic Oscillation (AO) was strongly positive for most of the winter, particularly in January and February. Twice in February, it set all-time records for its highest values.
The positive phase of the AO is associated with enhanced troughing of the upper-air jet stream in the Arctic and enhanced ridging of the jet stream in the midlatitudes. This strengthens the jet stream and traps the colder temperatures in the Arctic, leaving warmer conditions to the south, including across the contiguous U.S.
During January, February and the latter half of December, the jet stream was stronger than normal and upper-air troughs were strongest near Alaska, Greenland and central Russia, leading to persistently cold anomalies in those regions. The ridges were strongest over Europe, East Asia and the northeastern Pacific, allowing warmer anomalies to persist.
As a result of this positive AO, winter temperatures were above average across most of the contiguous U.S. and much-above-average across the eastern U.S. West Virginia and Rhode Island each had their fourth warmest December–February on record. Twenty-two additional states had a top 10 warmest winter.
The Alaska December–February temperature was 0.7°F, 2.9°F below the long-term average, ranking among the coldest one-third of the 95-year record and the coldest winter in 21 years. Much-below-average temperatures were concentrated in parts of the Central Interior region with below-average temperatures across much of mainland Alaska. Above-average temperatures were present across portions of the Panhandle.
For the first time in 21 years, Fairbanks remained below freezing during all of climatological winter (December–February).
Precipitation
Much-above-average to record precipitation was observed from the Southeast into the Great Lakes. Alabama and Georgia ranked wettest on record for winter precipitation, while South Carolina ranked second wettest. Parts of the West and northern Rockies received below-average precipitation for the season.
Much of the Rockies, northern Plains, western Great Lakes and northern New England received average to above-average snowfall during winter. The Sierra Nevada Mountains, the southern Great Lakes and from the Ohio Valley to the Mid-Atlantic region and into the Northeast saw below-average to near-record low snowfall totals for the season. This was due in part to the northward deviation of the polar jet stream, which brought colder air to the West and warmer air across much of the eastern U.S. As a result, very few cold winter storms traversed the south-central portions of the Lower 48 and up the East Coast during the winter season.
Climatologically speaking, winter is the wet season in California and across much of the West. If March and April do not produce adequate precipitation to make up for the dry conditions experienced during winter, there will be increased concerns regarding sufficient water resources to get through the dry season (summer) and also for the increased potential for wildfires this coming fall.
While much of interior and northern Alaska was drier than average during the winter, portions of the Alaskan Panhandle were wetter than average. Petersburg, Alaska, received 40 inches of precipitation — the wettest winter since 2006–2007.
Click here to read the update (Megan Holcomb/Tracy Kosloff):
This year’s spring and summer drought outlook may be tough to predict, but currently the state’s northern mountains and Front Range look strong. There are increasing concerns of dry conditions along the Eastern Plains, in the southwest and San Juans where we are seeing slightly below average snowpacks and reservoir levels. There are reports of extremely dry subsoils on the Eastern Plains. Precipitation averages statewide have slipped from 95 to 90% of average statewide since mid-February. Statewide snowpack has decreased from 110% to 104% since mid-February. Streamflow forecasts are already showing the implications of dry autumn precipitation with forecasts ranging from 54% (Surface Creek near Cedaredge) to 132% (Spinney Reservoir Inflow) of median streamflow values.
● The 90-day Standardized Precipitation Index (SPI) (from Dec 18 to Mar 17) shows below average moisture for the SW and NE and distributed average or slightly above for the central and north mountain regions.
● The U.S. Drought Monitor, released March 19, shows worsening conditions in NE Colorado. D0 (abnormally dry) conditions cover 25% of the state; D1 (moderate) covers 42%; D2 (severe) drought covers 3% of the SE and SW corners; and 30% of the state (north-central) remains drought free.
● ENSO forecasts are still trending toward neutral conditions for spring and summer 2020.
Colorado Drought Monitor March 17, 2020.
● NOAA’s Climate Prediction Center three month outlook maps show increased probability for warmer than average temperatures March through May for much of the state, and equal chances of near, above, or below average precipitation outlooks.
● Reservoir storage remains near to above normal: 84% to 123% of average in all major basins and 107% of average statewide. Last March 2019, statewide reservoirs were at 83% of average.
● SNOTEL Snow Water Equivalent (SWE) sites show statewide snowpack at 104% of record median (as of Mar 19).
● Water providers and water users did not report any unusual impacts or concerns at this time.
Conozca los pasos tomados para garantizar un suministro de agua potable seguro y confiable para el área metropolitana. The post Respuesta de Denver Water a COVID-19 appeared first on News on TAP.
These days the Arkansas River doesn’t seem threatening as it ripples past Pueblo’s historic district. But in early June of 1921, it was a very different story. That’s when days of heavy rains combined with mountain snowmelt to catastrophic results…
Locomotives and train cars were responsible for a lot of damage; more than 1,200 were washed away, smashing through buildings. There were fires and vast amounts of mud. Telephone lines were out, leaving Pueblo cut off from the rest of the world. And the city was littered with the corpses of livestock, adding to public health concerns.
When the floodwaters receded, Puebloans got to work to make sure it wouldn’t happen again. The engineers literally moved the Arkansas River about a half-mile to the southwest and built a massive levee to protect the city.
The former river channel through downtown languished for decades, becoming an eyesore for the city…
More than fifty years after the flood, a group of locals started working to change that, with the goal of making the old riverbed into a new attraction, something to help draw people downtown. Residents inspired by San Antonio’s River Walk worked with the conservancy district that controlled the river on an effort that took decades and resulted in the HARP, the Historic Arkansas Riverwalk of Pueblo.
FromThe High Country News (Ethan Linck) [March 1, 2020]:
The last wolf resident in Colorado in the 20th century died in 1945 at the edge of the San Juan Mountains, where a high green country falls into dark timber near the headwaters of the Rio Grande. It was caught by its leg in the ragged jaws of a steel trap, set by federal authorities following reports that it had killed 10 sheep.
If the wolf was mourned, it wasn’t mourned by many. Contemporary newspaper articles reflected widespread support for ridding the West of wolves. “Wolves are like people in that they must have their choice morsel of meat,” wrote Colorado’s The Steamboat Pilot in an April 1935 story on the retirement of William Caywood, a government contract hunter with over 2,000 wolf skulls to his credit. “(Some would eat) nothing but the choice parts of an animal unless they were very hungry. Wolves are killers from the time they are a year old.”
Seventy-five years later, public perception has changed, and otherwise clear-eyed Westerners regularly wax poetic over Canis lupus. “Colorado will not truly be wild until we can hear the call of the wolf,” opined one writer in a recent editorial for Colorado Politics. “That mournful sound rekindles primordial memories of our ancestors, and to most of us, brings a state of calmness that nothing else can approach.”
Wolves, it turns out, may be a part of the world we want to live in after all.
This about-face is more than conjecture. According to a recent poll of 900 demographically representative likely voters, two-thirds supported “restoring wolves in Colorado,” echoing similar polls over the past 25 years. Yet state wildlife officials have been reluctant to comply, wary of the toxic politics surrounding reintroduction in the Northern Rockies.
In response, activists seized an unprecedented strategy. A coalition of nonprofit groups in Colorado, led by the recently formed Rocky Mountain Wolf Project, spent 2019 tirelessly gathering support to pose the question to voters directly through a 2020 ballot initiative. They succeeded, delivering more than 200,000 signatures to the Colorado secretary of State. Initiative 107 was officially ratified in January and will be voted on this November. (Meanwhile, neither politicians nor wolves have stayed still. In January, a state senator introduced a controversial bill to regain legislative control of the issue; in the same week, Colorado Parks and Wildlife confirmed that a pack of at least six wolves was now resident in northwest Colorado, though it’s far from clear they represent the start of a comeback. For the moment, the future of wolves here still likely rests on the initiative.)
A new transplant to Colorado from the Pacific Northwest, I learned about the campaign from a canvasser outside Whole Foods in north Boulder on a sunny June day last year. In a parking lot filled with Teslas and Subarus, the tattooed volunteer stood opposite a wall-sized advertisement for the store, featuring the smiling faces of ranchers and farmers on the Western Slope.
It was a scene that would have done little to assuage fears that urban liberal voters were forcing reintroduction on rural residents. The canvasser caught my eye as I left the store. “Can I talk to you about reintroducing wolves to Colorado?” he asked, waving a pamphlet. I demurred and walked back to my bike. But the initiative and its backers — happy to use scientific justifications for their cause, paired curiously with populist rhetoric about its overwhelming public support — lingered in my head.
Darlene Kobobel. Photo credit: Colorado Wolf and Wildlife Center
The initiative fascinated me, beyond its potential to transform the landscape of my adopted home. As an academic biologist, I tended to think science should be both privileged in debate and somehow above the fray. But my own environmental ethic operated on an independent track — drawing on the scientific literature when it supported my opinions, and claiming it was beside the point when it didn’t. The Rocky Mountain Wolf Project reminded me uncomfortably of this contradiction.
If voters decide to reintroduce wolves to an increasingly crowded state from which they were effectively absent for over 70 years, Colorado’s ecosystems and rural communities may change rapidly, in unexpected ways. Yet unlike nearly all other major wildlife management decisions, the choice would rest not with a handful of experts, but with the public.
The case poses a thorny set of questions. What will happen if wolves return to Colorado? When, if ever, can science tell us what to do? And, in the face of empirical uncertainty, could direct democracy be the best solution?
I wondered: If I knew my own research could dramatically affect ecosystems and livelihoods, would I want it to play more of a role in public life — or less?
CONSERVATIONISTS OFTEN HESITATE to frame arguments in moral terms, leaning on the perceived authority of empiricism to buttress their positions. At the same time, many conservation debates are complicated by the collision of disparate worldviews, where evidence is almost beside the point. Large carnivores — intensively studied and politically controversial — fall squarely in the center of this push-and-pull between data and belief.
In 1995, federal biologists released eight gray wolves from Alberta, Canada, in Yellowstone National Park, seeding a population that eventually grew to as many 109 wolves in 11 packs. With the wolves came the unique opportunity to test the theory that their influence on elk numbers and behavior reduced grazing pressure on riparian vegetation, with consequences for the very structure of rivers themselves.
Preliminary data suggested that this process — known as a trophic cascade — was indeed in effect. Elk numbers were down, grazing patterns were different, tree growth was up, and at least some river channels appeared to recover. A tidy encapsulation of the idea that nature had balance, it had broad appeal: In a viral YouTube video from 2014, British environmentalist George Monbiot breathlessly described these changes over soaring New Age synthesizers and stock footage of an elysian-seeming Yellowstone, calling it “one of the most exciting scientific findings of the past half century.”
Yet ecology is rarely simple, and as the mythology surrounding the return of wolves grew, so, too, did skepticism in the literature. Over the past 15 years, a cascade of papers has called into question most of the findings taken for granted in the popular account of Yellowstone’s transformation. Elk browsing might not be reduced in areas with wolves; streams and riparian communities had not returned to their original state; maybe beavers were more fundamentally important to these processes than wolves were. In sum, a 2014 review paper suggested that there are no “simple, precise, or definitive answers” to the question of whether wolves caused a trophic cascade in the park; another evocatively concluded that “(the wolf) is neither saint nor sinner except to those who want to make it so.”
Yellowstone represented a single experiment — one possible outcome among many. In a different corner of the West with more people, or different habitats, or more or fewer elk — in Colorado, for example — would wolves have had the same effect? Last June, a paper in the journal Biological Conservation attempted to answer this question indirectly by aggregating data on species reintroductions and introductions around the world and asking whether their removal or addition caused a reversion to historic conditions. Unsurprisingly, the answer was “it depends”: Restoring predators has unpredictable, complex consequences.
That paper’s lead author, Jesse Alston, was a graduate student in the Department of Zoology at the University of Wyoming. I met him on a bright fall day in Laramie, at a coffee shop in a strip mall on the east side of town. Driving up from Boulder the same morning, I marveled at the abrupt transition in landscape at the border between Colorado and Wyoming: In the span of only a few miles north of Fort Collins, the sprawl of the Front Range fades away, and the High Plains begin rolling up into a sepia-colored saucer from the flatter, hotter agricultural land of eastern Larimer County.
Alston spoke quietly and slowly, in the cautious manner of someone who anticipated a long future working with wildlife and wildlife-related controversies. Though he thought the evidence favored trophic cascades in Yellowstone, he was circumspect about predicting whether wolf reintroduction in Colorado would have the same effect. “(It) really hinges on the idea of there not being adequate predation currently. And there are a lot of hunters in Colorado.” But hunters are a minority of trail users, he added, and recreation of all kinds can influence elk behavior much the way fear of wolves does.
Jesse Alston. Photo credit: jmalston.com
I asked him to elaborate on the role of science in justifying carnivore restoration and whether he thought it might backfire. He paused, thinking, then said: “I think the people who would be most turned off if you don’t see large-scale ecosystem effects are the people who are least inclined to listen to science anyway, so I don’t see that being that big of a deal. But I do think that — as scientists, particularly as good scientists — that we should be sure that our ideas are buttressed by empirical findings.”
Of course, there are empirical findings, and then there are the caveats that always accompany them — the reasons we can’t say for sure what will happen when wolves return. “I think really where the science-policy nexus is most problematic has been when there’s misunderstanding of uncertainty,” Alston continued. “I think it’s good to advocate for causes that we believe in, but we should be pretty straightforward about discussing the uncertainty that comes along with that.”
IF WOLVES ARE NOT an ecological magic bullet, it is not readily apparent in the literature of the Rocky Mountain Wolf Project, which nonetheless aims to “disseminate science-based information” as part of its mission. On its website, a blog post suggests that since wolf reintroduction to Yellowstone, “the ecosystem has balanced.” This isn’t wrong, necessarily. But it isn’t correct, either, and the simplification belied a willingness to use science as a political battering ram. I was on board with the group’s mission as a voter, a Coloradan. As a scientist, though, it made me uneasy.
Though the Rocky Mountain Wolf Action Fund is itself young — founded at the end of 2018 — its roots go back nearly to the release of wolves in Yellowstone, through its Boulder-based predecessor, Sinapu. In 2008, Sinapu — whose name was taken from the Ute word for wolves — was folded into Santa Fe-based WildEarth Guardians, which also sought to restore large carnivore populations to the Southern Rockies. On an October evening at a brewery in South Boulder, I asked Rob Edward — founder and president of the board of the wolf fund, longtime Sinapu employee and the public face of wolf reintroduction in Colorado for decades — why the group had chosen to emphasize what might be described as the spiritual resonance of the effects of carnivore reintroduction on ecosystems and landscapes.
Edward was eloquent but blunt, a middle-aged man who dressed in a way that suggested he was as comfortable in the rural parts of the state as in Boulder. His wife, Anne Edward, also a longtime wolf advocate, joined us; she was quieter, with gray hair and eyes that lit up whenever wolves were mentioned. They had chosen their language based on polling data, Rob Edward said. “They use that term — ‘restoring the balance of nature.’ Now, is it an oversimplification of a tremendously complicated system? Absolutely. Do I care? Not really.” At the same time, he said, the connection to research and its perceived authority was important. “The public as a whole places a tremendous amount of stock in scientists.”
While it was clear the couple would support reintroduction even if they were the only two people on earth in favor of it, they nonetheless viewed public opinion as validating. A ballot initiative was a necessary last resort, a way to force the state and its slow-moving wildlife officials to comply with the will of the people of Colorado. “We’re not excluding experts, we’re simply telling them, get it done!” Rob Edward said, pounding the table in a gesture that passed unnoticed against the backdrop of his general animation. “Figure it out! Don’t keep machinating about it for another five decades. Get it done!”
As I listened to him, I again found myself deeply conflicted at the prospect of the ballot initiative, and at putting major wildlife management decisions up to a simple vote. On the one hand, I appreciated that it was a creative solution to an intractable political problem, on behalf of a natural system divorced from the political ebb and flow of Denver. On the other, it seemed to set a dangerous precedent. As the history of our complicated relationship with wolves shows, popular opinion can be capricious. Was it really right to pose complex questions — questions at the limit of expert understanding — to a largely naive public?
Laws that translate science to policy can give a voice to a nonhuman world that cannot advocate for itself. Yet in our society, democracy is haunted by the question of whose voices matter. Edward was clear that polling showed clear majorities of Coloradans support wolf reintroduction across the state, including groups that you might expect to oppose it: Rural residents on the Western Slope, hunters and Republicans all support it by a substantial majority. But Colorado is changing, becoming less white, and he was unable to refer me to data broken down along racial and ethnic lines — particularly among historically disadvantaged groups that remain underrepresented at the ballot box.
Nor have the views of Indigenous people — who have the longest history of cultural connection to wolves, and whose lands in Colorado will likely be among the first impacted by a rebounding wolf population — been highlighted in the debate. I was unable to reach wildlife officials with the Southern Ute Tribe by press time, but they are clearly watching the issue closely. In a statement on the initiative, the tribe clarified that it does not have an official position on wolf reintroduction and is “simply evaluating whether (to) support, oppose, or remain neutral on the subject.”
Carbondale, Colorado-based muralist Valerie Rose works on one of four murals she’s done for the Rocky Mountain Wolf Project since early 2018. This one is at Green Spaces in Denver. Photo credit: Cheney Gardner
SCIENCE IS VERY GOOD at addressing the how, but often fails when confronted with the should — the biggest questions, which veer into the realm of values. There is no experiment we can conduct to say whether we should proceed with wolf introduction, no data that can tell us if it is the right thing to do. It comes down to how evidence is filtered through our worldview: whether we think of humans as a part of nature or separate from it, and whether we think changes in grazing habits and water channels — and the presence of wolves themselves — add up to a fundamental good worth fighting for.
But, like conservationists, scientists often shy away from such moral judgments, and for valid reasons: the fear of being perceived as not impartial, thereby undercutting the authority of their research; a sense of obligation to the politically diverse taxpayers who fund their work; an acute awareness of the limitations of their data, statistics and the scientific method itself. In the public sphere, however, this feigned objectivity can have the negative consequence of suggesting there are scientific solutions to philosophical questions.
That wolf reintroduction advocates lean on science rather than those weightier themes is understandable. Yet arguing that having wolves in Colorado is an intrinsic good — because they represent what we want Colorado to become, not because they will have a net benefit on aspen growth or stream hydrology — would be more honest, and might win people over in unexpected ways.
Back at the brewery in suburban Boulder, Rob Edward vacillated between polished language justifying reintroduction in scientific terms and moments of raw emotion: “They have wolves on the Gaza Strip. They have wolves in Italy. They have wolves in Northern-freaking-California. Why can’t we have wolves here?”
IF THE BALLOT INITIATIVE passes this November, a three-year planning process begins, followed by what Anne Edward described as “paws on the ground” — the release of the first few wolves — in 2023, almost certainly in the San Juan Mountains. Advocates anticipate that this process will be difficult, and they are prepared for a fight.
A successful reintroduction would be a remarkable accomplishment, given the fraught history of wolves in Colorado, as well as a landmark event in the gradual return of large carnivores to the 21st century West. It would also be a remarkable reflection of the blurring lines between science, belief and politics in the 21st century. As political gridlock becomes a feature of daily life, and environmental degradation — the cancerous rot of the Anthropocene — metastasizes, the impulse to circumvent collapsing institutions in response to crises is likely to become more common. In these circumstances, what role should scientists and science play? How much should uncertainty prevent action, and how much should empiricism determine our value system?
There are no easy answers here. If the basic question of whether or not to reintroduce wolves to Colorado is largely beyond the purview of science, then perhaps putting it to a vote is the most responsible option. The messiness of democracy can be terrifying. Still, there may not be a better way. After all, the language of values has been a part of the modern conservation movement since its birth — the Endangered Species Act of 1973, for example, states that endangered species provide “esthetic, ecological, educational, historical, recreational, and scientific value to the Nation.”
Toward the end of my conversation with the Edwards, thinking of their many years of advocacy and of the curious arc of history, I asked them what it was like to see an end in sight. “Do you allow yourselves to get a little carried with the fantasy of it?” I asked. “Things are in your favor — have you started imagining ‘paws on the ground’?”
Both were quiet for a moment, and the noise of the bar washed over us. “I’ve been working on this for 25 years,” Rob said, his voice breaking into a sob as Anne reached out and gripped his arm. “I certainly do.”
Ethan Linck has previously written about recreation and conservation for High Country News, and about science and nature for Los Angeles Review of Books, Undark and Slate. He is a National Science Foundation postdoctoral fellow at the University of New Mexico, where he studies evolution and genetics in birds. Email High Country News at editor@hcn.org.
A CRJ jet waits for takeoff in 2012 from Bozeman, Mont. Air travel has improved from 34 passenger miles per gallon in 1991 to 56 passenger miles today. Photo/ Allen Best
In early December a friend from Denver and I both traveled to Las Vegas for a conference. I flew, he drove. We both worry about greenhouse gases accumulating in the atmosphere and the strong evidence now emerging of climate disruption. Which of us should have more carbon guilt?
Flying shame, the phrase translated from its native Swedish, has come into vogue, at least in some circles. We zoom around the continent, sometimes across great oceans, because we can, and because it’s wonderful compressing great distances with so little effort, so quickly immersing ourselves in new geographies and cultures, and because, as was the case of my friend and I, we thought our work required it.
Quick and easy movement has a cost, though.
If emissions from airplanes were a country, they would rank somewhere between Japan and Germany. That means about 1.5% of global emissions (carbon dioxide equivalent) as of 2012, according to the World GHG Emissions Flow Chart 2014. Other sources, slicing the greenhouse gas pie differently, put it at 2.4%. Residential buildings (11.2%), cars and trucks (10.6%) or even livestock and manure (6.5%) produce more.
Scientists, however, suspect impacts may actually be double or more those at ground level because of the chemical interactions of emissions at high altitudes. Uncertainty remains about how contrails produced by airplanes may force radiative heating.
High-income countries and upper-middle income countries have been responsible for 90% of emissions. The U.S. alone is responsible for 24% of emissions. Less-developed countries that contain half the world’s population accounted for only 10% of all passenger transport-related aviation CO2.
In the U.S., 12% of the population take 66% of flights.
“Although huge homes and hulking SUVs are familiar symbols of emissions excess, frequent flyers are among the people with the very biggest carbon footprints,” says Robert Henson in “The Thinking Person’s Guide to Climate Change.”
Just 6% of the world’s population has ever flown.
The International Air Transport Association projects that global air travel will reach 8.2 billion annual passenger trips by 2040, up from 1.8 billion in 2000. A large part of that story will be China, India and other countries as they produce larger middle classes able to afford air travel. Aircraft might account for 25% of the global carbon budget by 2050 as emissions from other sectors phase out combustion of fossil fuels, according to a 2019 report from United Nations International Civil Aviation Organization projects.
Success of ski and other resorts during the last 60 years has been tethered tightly to wings of airplanes. Ease of flight has been so important in attracting customers that many ski resorts have offered subsidies to airlines or at least income guarantees.
This poses a conundrum. Snow sliders more than most embrace environmental values, not least the joys of snow. Greenhouse gases pose a direct and almost immediate threat to snow. How can we harm that which we treasure? What is our responsibility?
Technology solutions remain distant. Climatic disruptions look more imminent.
A plane flying across the Sawatch Range in Colorado in the approximate location of Monarch Pass in February 2017 showed the string of 14,000-foot peaks commonly called the Collegiate Peaks to the north. Photo/Allen Best
The climate emergency
Weather warms and cools naturally, with “very strong inter-annual and decadal variability,” as a 2019 report by the International Panel on Climate Change noted. But clear human fingerprints have become evident.
NASA and the National Oceanic and Atmospheric Administration reported in January that 2019 was second hottest on record, trailing only 2016. The past five years each rank among the five hottest since record-keeping began. And 19 of the hottest 20 years have occurred during the past two decades.
Human fingerprints have also been detected in weather extremes. Consider the wildfires in Australia that in just a few days in early January covered areas the size of Switzerland. As New York Times columnist Paul Krugman notes, “climate change makes the kinds of extreme weather events we’ve been seeing much more likely.”
If winter can still bring tremendous dumps of snow, the edges have begun fraying discernibly, most notably during spring. But even mid-winter can have eerie warm spells. Vail and Aspen both had significant January rainstorms several years ago. Other resorts, including Whistler, lower in elevation and near the Pacific Ocean, have always had rain, but now expect to see rain become more common and occur higher up the slopes.
Scientists have stipulated we must keep warming within 2 degrees Celsius or risk serious threat of destabilization. Better would be 1.5 degrees. Temperatures have already climbed about 1 degree globally, less in some places but more in others. Even if emissions were to stop tomorrow, the heat to be produced from existing atmospheric pollutants will likely increase temperatures another 0.5-degree globally.
Why the fuss about 1 or 2 degrees Celsius? A little change can have outsized impact. Consider that it took just drops of 1 or 2 degrees to plunge the Earth into the Little Ice Age, permitting Queen Elizabeth to routinely play ice games during the 16th century on a frozen Thames River. But then there were the big Ice Ages, when glaciers marched southward across North America. The last glacial advance put parts of Canada under ice of up to 4 kilometers and extended southward across Wisconsin and other border states. It was accompanied by a 5-degree average drop.
Change may be neither uniform nor linear. The IPCC’s 2019 special report noted that the American South has warmed very little. But Alaska and western Canada among other places with higher elevations and northerly latitudes that have had increases of 5 degrees Celsius (9 degrees Fahrenheit) since the 1950s. The Washington Post’s Juliet Eilperin in December told about cemeteries in coastal towns of Alaska being submerged by water as the earth melts.
Worries about feedback loops
Scientists fret about feedback loops. For example, there’s the albedo effect. White reflects sunlight, but dark materials absorb it. This has been demonstrated in Colorado’s San Juan Mountains. There, storms have delivered dust from the drying and disturbed deserts of the American Southwest on the snowfields above Telluride, Silverton, and other mountain towns. The dark-colored dust causes the snow to melt more rapidly. Now consider what happens as glaciers recede and Arctic sea ice is replaced by dark-colored sea water.
Worrisome to many has been the accelerating retreat of the Greenland ice sheet. A 2019 article in Nature, a scientific journal, reports that the massive ice sheet could be doomed at 1.5 degrees, which could happen as soon as 2030.
Methane released as the polar permafrost warms would be another feedback loop. This greenhouse gas disappears from the atmosphere for less than a decade while carbon dioxide lingers for hundreds and even thousands of years. It has powerful heat-trapping properties during that short time, though, 86 times as effective than carbon dioxide over a 20-year period. Henson, in “Climate Change,” cites the IPCC report of 2014 in concluding that methane releases from a warming Arctic are not expected to become a major issue for some time, “although the longer-term risks are sobering indeed.”
To stay within that margin we must quickly and dramatically cut back emissions. Instead, we’re accelerating like a driver heading into a tight curve.
During the Industrial Revolution, as factories in England billowed with coal fires, concentrations of carbon dioxide, the most common greenhouse gas, stood at 280 parts per million. When climate scientist James Hansen famously testified before the Senate committee in 1988, they had reached 350 ppm. This year they can be expected to near 420 ppm. Human-caused emissions have more than doubled in only three decades. Unless we have drastic changes, babies being born this year can expect, when entering college or trade school, to have global concentrations of 450 ppm.
In 2003, when I began studying climate change reports, scientists were warning about greater risks of climate destabilizing at 450 ppm. Since then I’ve observed that scientists, for the most part, have tended toward conservatism. The reality has had faster feet.
Private jets crowded the perimeters of the Aspen/Pitkin County Airport in the summer of 2010. Mountain resorts have been highly reliant upon air travel for delivery of customers. Photo/Allen Best
Perhaps the Swedes were unnerved by their fires above the Arctic Circle. In 2015, Olympic biathlon gold medalist Bjørn Ferry committed to stop flying. Some Swedish celebrities have followed suit. To avoid flying, the adolescent climate activist Greta Thunberg last summer sailed to the United States to call for urgent action. She has a following, as was acknowledged by Time Magazine with its Person of the Year designation, displacing a churlish Donald Trump. It’s fair to assume that some snow riders, with their devotion to environmental action, follow the sometimes dour but always precocious Swedish lass.
Most carbon-efficient travel
What’s the least carbon-tainted mode of travel to a mountain resort? Bicycle, obviously, although catching a bus will do you well, too. It’s a bit cumbersome, definitely more time-consuming, but you can take a bus from Chicago, for example to Glenwood Springs, then catch a RFTA bus to Aspen or Snowmass. The state-sponsored Bustang from Denver to Glenwood Springs has won raves. But again, don’t be in a hurry.
Few people ride the rails to go skiing. At Colorado’s Winter Park, for example, rails emerge from a tunnel under the Continental Divide within a few dozen yards of ski slopes, but Amtrak delivers just 10,152 travelers to the nearby depot in Fraser annually. A ski train from Denver adds 20,000 passengers annually for day trips.
Amtrak delivers passengers to Fraser, within four miles of the slopes of Winter Park Resort. Photo/Winter Park Resort
We fly, because we’re in a hurry. Air travel has become more efficient in jet fuel. By the metric of passenger travel achieved on a gallon of jet fuel, air travel has improved from 34 passenger miles per gallon in 1991 to 56 passenger miles today.
Not all air travel is equal, though. You can bet that Air Force One, the jet used to ferry U.S. presidents around the globe, with its executive desk and sleeping quarters, has a higher carbon footprint than somebody flying scrunched between other passengers, barely able to breath. And first-class commercial travel has three times the carbon footprint of economy.
How far you fly also matters. Shorter flights have a greater carbon intensity per mile than long-haul flights. A quarter of the fuel on a single trip can be burned in getting from the ground to 30,000 feet. That makes short-hop flights, say between Denver and Aspen, the most energy intensive.
This rule only applies so far, though. The fuel itself for very long-haul flights requires energy for transport, because of its weight. WorldWatch Institute estimates that the most fuel-efficient distance for airlines is 2,600 miles, a little longer than the trip from New York to Los Angeles. But those added miles still produce more fuel consumption and hence emissions. Shorter, if less efficient, is still less.
What does this mean in practice? The carbon-tracker website maintained by the International Civil Aviation Organization allows you to calculate your carbon dioxide emissions. For example, an economy round-trip flight between New York City’s JFK Airport and Denver produces 946 pounds (of carbon per passenger. That’s the equivalent of 59 bowling balls. Talk about carry-on baggage. A longer distance produces a fatter footprint as does flying premium instead of economy: 3,934 pounds. OK, you wanted to know: 246 bowling balls.
Can you really offset your travel?
What makes environmental sense—and economic sense for ski areas—is that when customers fly, they linger. A study of Rocky Mountain resorts by Colorado-based RRC that was commissioned by the National Ski Areas Association found 40% of out-of-state customers who flew stayed six days or longer. Of international travelers, 80% stayed six days or longer. The difference was particularly evident among those who stayed between 10 and 22 nights at the resorts.
“As would be expected, international visitors tend to have the longest stays, followed by out-of-state visitors (and then) in-state visitors,” says RRC’s David Becher.
Driving, in some situations, could be worse than flying. It depends upon the vehicle and the number of occupants. Driving solo from Chicago to Denver in a SUV, for example, will be more carbon intensive than flying economy. But number of occupants, distance, and plushness of the jet make this less than straightforward. The best guide to travel comparisons I found was assembled by the Union of Concerned Scientists. (See chart).
For the water conference in Las Vegas, my friend from Denver rented a medium-sized electric hybrid that gets 40 mpg and drove alone. I flew first to Reno then Las Vegas. A woman sat next to me, her hair dreaded fashionably and dyed blond at the ends, her perfume so powerful I nearly gasped as we flew over the slopes of Park City. My return to Denver was direct.
Who should have less carbon guilt? My research on the carbon-tracker website suggests I was responsible for 240 pounds (109.1 kg) of carbon emissions compared to 334 pounds (151.5 kg) for my friend in his rented hybrid car. Had my friend and I gone together by car, we would have had much lower carbon footprints. But we didn’t know of each other’s plans. Plus, the day he had set out from Denver by car, I had been in Florida in the interest of familial piety. It gets complicated.
My friend does buy carbon offsets when traveling, whether by car or by plane. Such offsets have become more common. Air travelers flying in and out of two mountain resort communities are now participating in an offset program called Good Traveler. Good Traveler was initiated in 2016 by the San Diego International Airport, which chose the Basalt-based Rocky Mountain Institute to manage it. It now has 17 U.S. airports. Including major hubs in San Francisco and New York City. The Aspen/Pitkin County Airport joined the Good Traveler program in 2020.
Flying roundtrip between New York’s La Guardia Airport will nick you $8. Money collected in New York goes to improve marine efficiency in the harbor there. This and other qualifying offsets must demonstrate actions that can be verified and measured. Would this action have occurred or been avoided had the money not been invested?
In Wyoming, the Jackson Hole Airport also offers offset money. That money goes to ensure that the native prairie at the May Ranch in southeastern Colorado remains unplowed, continuing to sequester carbon. Telluride’s Pinhead Climate Institute has also purchased offsets for all its festival-goers at Telluride Bluegrass, with that money also going to the prairie preservation.
If offsets allow us to feel better about our travel, some analysts have been skeptical. We need actual reductions of emissions, not just offsets, they say.
Airport workers load boxes of tropical fish for a flight from Reno to Las Vegas in December 2019. In our era, even fish can fly. Photo/Allen Best
Burning biofuels, instead of fossil fuels, would theoretically reduce emissions. But they have been unable to achieve scale. In 2018, just 2 million liters of alternative jet fuel were produced, compared to the 360 billion liters of jet fuel consumed that year. (Note the “m” and the “b.”) Too, some suspect that lifecycle carbon costs of biofuels make them little better than conventional fossil fuels.
Electric planes?
Electrification of planes has produced excitement of late. All-electric planes began use in 2019 at a Denver-area airport for training of pilots. In December, a Vancouver company attracted international attention when it conducted a 10-minute demonstration flight of a 17-passenger seaplane retrofitted to operate on batteries. Harbour Air hopes to begin commercial operations within two years after safety of the e-planes has been proven. It plans an eventual fleet of 40 e-planes for short hops along the Pacific Coast in the Seattle-Vancouver area.
Ampaire, another company has made slower-moving, short-range and smaller aircraft such as are used to shuttle passengers among the Hawaiian Islands its goal. Peter Savagian, the company’s senior vice president of engineering, told an audience in Aspen during November that such short-haul flights were responsible for one-third of global air emissions. NASA awarded Ampaire and another company, IKHANA, contracts to pioneer hybrid diesel/electric configurations for the 19-passenger Twin Otter.
Advances in battery storage will be needed for longer distances. Battery storage has improved. A Tesla 3 battery has 10 times as much energy density as that used in the EV 1, an early electric vehicle that went into production in 1996 when Savagian was with General Motors. Energy from batteries has been increasing 8% annually.
But much, much more will be needed. Even the newest batteries hold just 2% that of liquid fuel, Wired magazine explained in a 2017 story. In other words, 1,000 pounds of jet fuel yields about 14 times more energy than a 1,000-pound battery.
“It will be decades before the largest aircraft are likely to be fully electrified,” he said. But when that happens, both airlines and consumers will benefit, he added. His company projects savings of 90% from electrified airplanes and maintenance costs cut 50%. Those savings, in turn, will allow airlines to cut fares by 15%, producing 40% more volume.
Use other components
Speaking at the same event, Aspen-area resident Amory Lovins—a co-founder of the Rocky Mountain Institute—maintained that airplane manufacturers could use carbon-fiber composite materials to make airplanes three to five times more energy efficient. “Many components made of metal today should not be,” Lovins said. He cited a simple $20 coffee pot. Replaced by a higher-tech model with energy consumption it saves weight and hence fuel. “You take a pound out of a typical airplane and it’s worth around $2,000 in net-present value in fuel costs.”
Lovins has credentials. In 1976, amid the Arab oil embargoes, he wrote a landmark essay published in Foreign Affairs magazines that talked about climate change, renewable energy and energy efficiency. Both businesses and governments responded to his vision sluggishly. Time has mostly proven him correct.
Price signals are needed to spur airlines to more rapid adoption of fuel-saving technology.
“Without a clear market signal, vendors and investors will largely stay on the sidelines,” Lovins said. He deplored incrementalism that squanders fuel, efficiency and precious time.
“The climate crisis will not wait,” he insisted. “Business as usual won’t work.”
Some think we’re in such a climatic pickle that we need to explore high-risk geo-engineering strategies.
For example, can temperature rise of accumulated greenhouse gases be counteracted by reflecting more sunlight away from the Earth’s surface with giant mirrors in space? Another idea calls for spraying aerosols into the stratosphere, which is about 10 kilometers above the Earth’s surface, simulating the effect of volcanic eruptions. A volcano eruption in the Philippines in 1991 cooled global temperature by 0.6 degrees Celsius for about two years.
Direct air capture is another idea, part of a broader set of solutions called negative emissions technology. This idea seeks to withdraw carbon dioxide or other greenhouse pollutants from the atmosphere. This is already being done in British Columbia by a company called Carbon Engineering. The company was founded in 2009 by David Keith, then a professor at the University of Calgary (and now at Harvard University). Keith, with backing from Bill Gates and Murray Edwards, a financier of oil/tar sands extradition in Alberta (and co-owner of the Calgary Flames), succeeded in removing CO2 from the atmosphere in 2015 and converting it into fuel in 2017 at the prototype between Vancouver and Whistler. Now, with backing from oil producers Chevron, Occidental and BHP, he’s trying to accomplish this at scale.
A Southwest Airlines jet flies into Denver International Airport in 2019. Southwest planned expansion of its traffic in and out of DIA. Photo/Allen Best
But Keith, in a 2013 book called “A Case for Climate Engineering,” warned against seeing geo-engineering as the solution to climate change. “Our gadget-obsessed culture is all too easily drawn to a shiny new tech fix,” he said. Best, he said, would be to avoid creating emissions.
In Colorado, upgrades are planned for the Aspen/Pitkin County Airport. The Pitkin County commissioners early identified “carbon emission reduction” as a core community value that needs to be applied to the new facility. It will not, however, produce any fewer emissions of the flights.
In aviation, as in so much else, it’s easier to create the problem than solutions.
A case in point is Denver International Airport, the fifth busiest airport in the United States and a hub for many connecting flights to Aspen and other ski towns. The airport plans to add 39 new gates to accommodate growing traffic. Nowhere in the stories announcing the expanding airlines was mention of the carbon footprint.
This story was published in the Feb. 11 issue of Big Pivots. It was also published in various iterations in Ski Area Management magazine, Pique Newsmagazine of Whistler, B.C., and the Aspen Times Weekly.
Click here to go to the US Drought Monitor website. Here’s an excerpt:
This Week’s Drought Summary
The U.S. Drought Monitor week ending March 17 saw another round of winter storms, bringing above normal precipitation to parts of the northern High Plains, Southwest, southern plains, and Tennessee Valley. Many areas recorded totals that exceeded 200% of normal over the seven-day period, leading to improvements to areas of abnormal dryness and drought in areas where the excess moisture erased deficits and improved soil moisture and streamflow. Once again, precipitation over the Northwest and Gulf Coast states was below normal with most areas having received less than 50% of their normal amount over the last 30 days. The lack of precipitation, combined with warmer than normal temperatures, led to expansions in pockets of abnormal dryness and drought…
The map’s drought depiction is unchanged this week in the High Plains. A winter storm during March 13-14 brought snow to the west and central parts of the region and rain to locations in the south and east. The Black Hills saw the highest totals, reporting from 6 to 12 inches of snow while portions of western and central South Dakota and Nebraska reported several inches of accumulation. Dry conditions continue to persist in the drought and abnormally dry areas in eastern Colorado, western Kansas, and southwest Nebraska where less than 0.50 inches of precipitation (about 50% of normal or less) has fallen so far this month. As we transition to normally wetter conditions in the spring, hopefully this area will begin to see relief from the deficits that have built over the last six to 12 months…
February’s dry spell over California finally broke as a late winter storm brought heavy showers to southern California and over 2 feet of snow to the Sierra Nevada. In southern California, the excess rainfall improved soil moisture and streamflow levels leading to reductions in areas designated as D0 (abnormally dry) or D1 (moderate drought). Despite the rain and snow, the maps depiction remained unchanged for the majority of the northern two-thirds of the state. Water year-to-date precipitation is more than 12 inches below normal (50% of normal or less) in the Sierras and the north coastal and north central regions. Soil moisture and streamflow values remain low and satellite based indicators of vegetation health continue to show stress across the Central Valley. Extreme northern California and southern Oregon missed out on the heavy precipitation further deteriorating drought conditions and leading to the expansion of D1 and introduction of D2 (severe drought). The Oregon state drought coordination team noted increasing water supply concerns in this region as many locations show record low streamflow values, declines in groundwater, and low reservoirs. Other changes in Oregon include minor improvements D1 areas in the west-central and eastern parts of the state where heavy precipitation fell. Having missed out on last week’s precipitation, Nevada and Utah both saw and expansion of D0 in the north. Further south, rainfall of 1 to 3 inches helped erase precipitation deficits, replenish soil moisture, and improve streamflow in southern Nevada, southwest Utah, and northwest Arizona resulting in reductions in D0, D1, and D2. Drought depictions in Washington, Idaho, Montana, Colorado, and New Mexico were left status quo…
Last week, a band of heavy rainfall fell across the northern half of the region, extending from West Texas to western Tennessee with amounts ranging from 1 to more than 4 inches (equivalent to more than 300% of normal in some locations). In southwest Oklahoma and northeast Texas, the excess moisture erased short-term precipitation deficits and recharged streamflow leading to reductions in D0 (abnormal dryness) and D1 (moderate drought). Additionally, the “S” was removed from the “SL” drought designation to indicate that drought and dry conditions are now only present at timescales longer than six months. With over an inch of rain falling after the close of the Drought Monitor week (Tuesday, 8:00 AM EDT) and more expected on the way, additional reductions may take place on next week’s map. Other areas seeing improvements include West Texas with reductions to D0 and D1. Unfortunately, the rain missed the parts of south Texas that need it most and conditions continued to deteriorate, resulting in expansions to ongoing areas of abnormal dryness and drought and the introduction of D4 (exceptional drought). Supporting data include rainfall deficits of 2 to 8 inches (25 to 50% of normal) over the last six months combined with mean temperatures consistently ranking in the top 10 warmest over the same time interval. The combination of dry weather and high temperatures has dried out soils and stressed vegetation with USDA reporting only 28% of topsoil as adequate for crops in the southeast and 3% in the southwest. Other areas seeing deterioration this week include southwest Louisiana and southeast Mississippi with expansions in D0…
Looking Ahead
The National Weather Service Weather Prediction Center forecast for the remainder of the week shows a winter storm developing east of the Rockies and tracking northeast across portions of the north and central Plains into the Upper Midwest. This storm is expected to bring heavy snow to the southern and central Rockies with a swath of light to moderate snow extending from Nebraska northeast into Minnesota and Wisconsin. A cold front associated with the storm system is forecast to trigger showers and thunderstorms from the southern plains into the Mississippi, Ohio, and Tennessee valleys. Temperature are expected to be below normal by 10 to 20 degrees across California into the Central Great Basin and Southwest. Meanwhile, the Gulf Coast states and Ohio and Tennessee valleys can expect temperatures 3 to 6 degrees above normal. The Central Plains should see large temperature swings as the system passes through. Moving into next week, the Climate Prediction Center six to 10 day outlook (valid March 22-26) favors below normal temperatures for much of the western half of the CONUS, especially near the West Coast, near normal temperatures east of the Mississippi, near normal temperatures in the Midwest and Northeast, and above normal temperatures for states along the Gulf and Southeast Coasts. The precipitation outlook favors an active storm track and above normal amounts for nearly the entire CONUS. Probabilities are highest for California, parts of the Great Basin, and the Tennessee and Ohio valleys.
US Drought Monitor one week change map ending March 17, 2020.
The Colorado Water Conservation Board, the primary water-policy agency for the state, met last week in Westminster, and afterward I had dinner with a friend. The friend, who has long worked in the environmental advocacy space, spoke of some matter before the board, and added this: “Twenty years ago this conversation never would have happened.”
Water politics in Colorado have undergone a Big Pivot. As the century turned, environmental issues had made inroads into the conversation, but water development remained a dominant theme. Then came the drought of 2002, which more or less changed everything. So has the growing realization of how the changing climate will impact the already over-extended resources of the Colorado River.
Instead of a deep, deep bucket, to be returned to again and again, the Colorado River has become more or less an empty bucket.
Jeff Tejral. Photo via The Mountain Town News
Those realizations were evident in a panel discussion at the Colorado Water Congress about water conservation and efficiency. Jeff Tejral, representing Denver Water, spoke to the “changes over the last 20 years” that have caused Denver Water and other water utilities to embrace new water-saving technology and altered choices about outdoor water use.
Denver Water literally invented the word xeriscaping. That was before the big, big drought or the understandings of climate change as a big, big deal. Twenty years ago, the Colorado Water Congress would never have hosted panels on climate change. This year it had several.
Tejral pointed to the growth in Denver, the skyscrapers now omnipresent in yet another boom cycle, one that has lifted the city’s population over 700,000 and which will likely soon move the metropolitan area’s population above 3 million. That growth argues for continued attention to water efficiency and conservation, as Denver—a key provider for many of its suburbs—has limited opportunities for development of new supplies. “The other part of it is climate change,” he said. “That means water change.”
Denver Water has partnered with a company called Greyter Water Systems on a pilot project involving 40 homes at Stapleton likely to begin in June or July. It involves new plumbing but also water reuse, not for potable purposes but for non-potable purposes. John Bell, a co-founder of the company, who was also on the panel, explained that his company’s technology allows water to be treated within the house and put to appropriate uses there at minimal cost.
“It makes no sense to flush a toilet with perfectly good drinking water, and now with Greyter, you don’t have to,” he said.
For decades Denver has had a reuse program. Sewage water treated to high standards is applied to golf courses and other landscaping purposes. Because of the requirements for separate pipes—always purple, to indicate the water is not good for drinking—its use is somewhat limited.
A proposal has been moving though the Colorado Department of Public Health rule-making process for several years now that would expand use of greywater and set requirements for direct potable reuse. The pilot project at Stapleton would appear to be part of that slow-moving process.
Greyter Water Systems, meanwhile, has been forging partnerships with homebuilders, the U.S. Department of Defense, and others in several small projects.
“It seems like 40 homes in Colorado is a small step,” said Tejral, “but a lot of learning will come out of that, which will open the door for the next 400, and then the next 4,000.”
Colorado transmountain diversions via the State Engineer’s office
There are limits to this, however, as water cannot be recycled unless it’s imported into a basin. Water users downstream depend upon releases of water from upstream. Water in the South Platte River Basin is estimated to have 6 or 7 uses before it gets to Nebraska.
In the Eagle River Valley, the streams gush with runoff from the Gore and Sawatch ranges, but there can be pinches during years of drought. That area, said Linn Brooks, who directs the Eagle River Water and Sanitation Districts, has a population of between 35,000 and 60,000 between Vail and Wolcott, “depending where we are during our tourist year.”
Water efficiency programs can make a big difference in what flows in the local creeks and rivers. Brooks pointed to 2018, a year of exceptionally low snowfall. New technologies and policies that put tools into the hands of customers reduced water use 30% during a one-month pinch, resulting in 8 cubic feet per second more water flowing in local creeks and rivers. During that time, Gore Creek was running 16 cfs through Vail. It flows into the Eagle River, which was running 25 cfs. “So saving 8 cfs was really significant,” she said.
Many of Eagle Valley’s efficiency programs focus on outdoor water use. That is because the water delivery for summer outdoor use drives the most capacity investment and delivery expenses. “Really, that is the most expensive water that we provide,” Brooks said.
Tap fees and monthly billings have been adjusted to reflect those costs. One concept embraced by Eagle River Water and Sanitation is called water budgeting. “Our hope is that water budgeting will continue to increase the downward trend of water use per customer that we’ve had for the last 20 years for at least another 10 years,” she said.
Linn Brooks. Photo via The Mountain Town News
Eagle River also has tried to incentivize good design. The district negotiates with real estate developers based on the water treatment capacity their projects will require. “That is a way to get them to build more water-efficient projects, especially on the outdoors side,” explained Brooks. “When we execute these agreements, we put water limits on them. If they go over that, we charge them more for their tap fee. That can be a pretty big cost. We don’t like to do that, but we have found that in those few cases where new developments go over their water limits, we have gone back to them and said, we might have to reassess the water tap fees, but what we really want you to do is stay within your water budget.” That tactic, she added, has usually worked.
In this concept of water budgeting, she said, “I don’t think we have even begun to scrape the surface of the potential.”
Outdoor water use has also been a focal point of efforts by Northern Colorado Water Conservancy District, the agency created to deliver water to customers from the trans-mountain diversion at Grand Lake. Municipalities from Broomfield and Boulder north to Fort Collins and Greeley, even Fort Morgan, get water from the diversion.
Frank Kinder was recently hired away from Colorado Springs Utilities to become the full-time water efficiency point person for Northern. Part of the agency’s effort is to introduce the idea that wall to wall turf need not be installed for a pleasing landscape. Instead, Northern pushes the idea of hybrid landscapes and also introduces alternatives for tricky areas that are hard to irrigate. The ultimate goal falls under the heading of “smiles per gallon.” Some of the district’s thinking can be seen in the xeriscaping displays at Northern’s office complex in Berthoud.
Kevin Reidy, who directs water conservation efforts for the Colorado Water Conservation Board, said the Colorado Water Plan posited a goal of reducing water use by 400,000 acre-feet. Don’t get caught up in that precise number, he advised. “It’s really about trying to figure out a more stable water future for our cities,” he said.
Readers might well be confused by an agency named “water conservation” having an employee with the title of “water conservation specialist.” The story here seems to be that the word conservation has changed over time. In 1937, when the agency was created, water conservation to most people meant creating dams and other infrastructure to prevent the water from flowing downhill. Now, conservation means doing as much or more with less.
On why Eagle River Water takes aim at outdoor use
The amount of water used outdoors is generally twice that used for indoor purposes, and only about 15% to 40% of water used outdoors makes its way back to local waterways.
None of this water is returned to local streams through a wastewater plant. Most of the water is consumed by plant needs or evaporation; what is leftover percolates through the ground and may eventually make its way to a local stream.
— From the Eagle River Water website
This was originally published in the Feb. 18, 2020, issue of Big Pivots.
Click here to read the report (Noah Molotch , Dominik Schneider , Leanne Lestak , Benét Duncan , Jeff Lukas). Here’s the summary of current conditions as of March 12, 2020:
Summary of current conditions (as of 3/12/20)
On March 12th the modeled snow conditions are mostly below the 2001-12 average across the Intermountain West domain, with most basins at 75-95% and a couple above 100% of average . Snow conditions remain low (<80% of average) in the central basins: North Platte, White-Yampa, CO Headwaters, Dolores, San Juan and Upper Arkansas. The eastern and western basins are between 80-95%, with the Big Horn and South Platte above average. At lower elevations, our model estimates indicate generally below average SWE for this time of year, while SWE predictions at higher elevations are above average – consistent with SNOTEL observations. The basin-wide percent of average from the spatial SWE estimates is not directly comparable with the SNOTEL basin-wide percent of average. A better comparison might be made with the % average in the elevation bands that contain SNOTEL sites.
As COVID-19 cases spread across Colorado, water utilities initiated emergency action plans, asking hundreds of employees to work from home to limit the virus’ spread and to help protect the workers needed to operate water treatment and delivery systems.
COVID-19 isn’t typically found in treated water systems, according to the U.S. Environmental Protection Agency and Centers for Disease Control and Prevention, because it is easily susceptible to the disinfectants used in standard water treatment systems.
“This virus is fragile,” said Jim Lochhead, CEO and manager of Denver Water, Colorado’s largest municipal water supplier. “The EPA and CDC and WHO [World Health Organization] have all put out guidance that drinking water systems that are treating water properly are perfectly safe. Our treatment protocols exceed federal and state standards and so we are doing better than we are required to do.”
Though water safety isn’t an issue in this pandemic, at least not yet, worker safety is.
In the heart of Colorado’s ski country, where COVID-19 cases have spread quickly, the Vail-based Eagle River Water and Sanitation District, as well as its sister agency the Upper Eagle Regional Water Authority, issued an emergency declaration March 13, a move that will allow them to apply for state and federal funds and extra equipment should they be needed.
The primary worry, said Eagle River District general manager Linn Brooks, is to prevent a rapid onset of COVID-19 among operations staff, something that could hamper the districts’ ability to ensure consistent water treatment and delivery.
“My biggest concern is that if it spreads quickly through our staff and we have a lot of people out, straining our capacity to do our work. Still, we could absorb a fair amount [of employee absences] before it impacts the service we provide,” Brooks said.
To date no Eagle River or Upper Eagle River District employees have tested positive for the virus nor is her district seeing high rates of absenteeism, Brooks said.
But the Eagle River District has imposed new sanitation and cleaning protocols at its plants and is requiring workers to stay home, with or without testing, if they exhibit any cold or flu-like symptoms. They can return to work only after they’ve been symptom free for at least 72 hours.
On the Front Range, Berthoud-based Northern Water, which serves more than 1 million agricultural and municipal customers, has also instituted emergency action plans, asking non-essential personnel to work from home and keeping operators on the job. Northern serves cities across the northern Front Range, including Fort Collins, Greeley, Boulder and Longmont, among others.
Northern offers workers unlimited sick leave as a matter course, while other utilities, such as Denver Water, are offering special administrative leave to employees who become ill to encourage them to remain home, allowing them to protect their personal vacation and sick time.
The pandemic has arrived just as the spring water delivery season begins. At least three regularly scheduled major water planning meetings across the state, used to inform the public and collect input on how much water should be made available for the year, have been cancelled.
“The hard part is getting the word out,” said Northern Water spokesman Jeff Stahla.
Northern’s board will make a decision April 9 on how much water will be delivered to users this year, based on final snowpack numbers and reservoir storage. But that meeting, like many others, may end up being conducted online or via conference call, Stahla said.
Colorado State of the River meetings, typically hosted by the Glenwood Springs-based Colorado River District, have also been postponed until further notice.
Back in Denver, Lochhead said his agency will remain in emergency mode “indefinitely.”
“We have calls every morning to assess. It’s a dynamic situation that changes daily if not hourly,” Lochhead said. “But in the uncertain world we’re in right now, the safety and reliability of the supply is the surest thing we have going.”
Jerd Smith is editor of Fresh Water News. She can be reached at 720-398-6474, via email at jerd@wateredco.org or @jerd_smith.
As the coronavirus pandemic exerts a tighter grip on the nation, critics of the Trump administration have repeatedly highlighted the administration’s changes to the nation’s pandemic response team in 2018 as a major contributor to the current crisis. This combines with a hiring freeze at the Centers for Disease Control and Prevention, leaving hundreds of positions unfilled. The administration also has repeatedly sought to reduce CDC funding by billions of dollars. Experts agree that the slow and uncoordinated response has been inadequate and has likely failed to mitigate the coming widespread outbreak in the U.S.
The Centers for Disease Control and Prevention in Atlanta, March 6, 2020. President Trump visited the CDC that day in an effort to calm fears about coronavirus. AP Photo/Ron Harris
Decades of underfunding
Spending on public health has historically proven to be one of humanity’s best investments. Indeed, some of the largest increases in life expectancy have come as the direct result of public health interventions, such as sanitation improvements and vaccinations.
However, despite their importance to national well-being, public health expenditures have been neglected at all levels. Since 2008, for example, local health departments have lost more than 55,000 staff. By 2016, only about 133,000 full-time equivalent staff remained. State funding for public health was lower in 2016-2017 than in 2008-2009. And the CDC’s prevention and public health budget has been flat and significantly underfunded for years. Overall, of the more than $3.5 trillion the U.S. spends annually on health care, a meager 2.5% goes to public health.
Not surprisingly, the nation has experienced a number of outbreaks of easily preventable diseases. Currently, we are in the middle of significant outbreaks of hepatitis A (more than 31,000 cases), syphilis (more than 35,000 cases), gonorrhea (more than 580,000 cases) and chlamydia (more than 1,750,000 cases). Our failure to contain known diseases bodes ill for our ability to rein in the emerging coronavirus pandemic.
Failures of health care systems
Yet while we have underinvested in public health, we have been spending massive and growing amounts of money on our medical care system. Indeed, we are spending more than any other country for a system that is significantly underperforming.
At any given time, this decrease in capacity does not pose much of a problem for the nation. Yet in the middle of a global pandemic, communities will face significant challenges without this surge capacity. If the outbreak mirrors anything close to what we have seen in other countries, “there could be almost six seriously ill patients for every existing hospital bed.” A worst-case scenario from the same study puts the number at 17 to 1. To make things worse, there will likely be a particular shortage ofunoccupied intensive care beds.
Of course, the lack of overall hospitals beds is not the most pressing issue. Hospitals also lack the levels of staffing and supplies needed to cope with a mass influx of patients. However, the lack of ventilators might prove the most daunting challenge.
Virginia Hollins-Davidson is taken away by a California Highway Patrol officer after she and other protesters blocked the door to the governor’s office during a protest by the Poor People’s Campaign at the Capitol, June 18, 2018, in Sacramento, Calif. AP Photo/Rich Pedroncelli
And of course, the U.S. heavily relies on private entities, mostly employers, to offer benefits taken for granted in other developed countries, including paid sick leave and child care. This arrangement leaves 1 in 4 American workers without paid sick leave, resulting in highly inequitable coverage. As a result, many low-income families struggle to make ends meet even when times are good.
Can the US adapt?
I believe that the limitations of the U.S. public health response and a potentially overwhelmed medical care system are likely going to be exacerbated by the blatant limitations of the U.S. welfare state. However, after weathering the current storm, I expect us to go back to business as usual relatively quickly. After all, that’s what happened after every previous pandemic, such as H1N1 in 2009 or even the 1918 flu epidemic.
The problems are in the incentive structure for elected officials. I expect that policymakers will remain hesitant to invest in public health, let alone revamp our safety net. While the costs are high, particularly for the latter, there are no buildings to be named, and no quick victories to be had. The few advocates for greater investments lack resources compared to the trillion-dollar interests from the medical sector.
Yet, if altruism is not enough, we should keep reminding policymakers that outbreaks of communicable diseases pose tremendous challenges for local health care systems and communities. They also create remarkable societal costs. The coronavirus serves as a stark reminder.
[You need to understand the coronavirus pandemic, and we can help.Read our newsletter.]
Click on a thumbnail graphic to view a gallery of snowpack data from the NRCS.
Colorado snowpack basin-filled map March 17, 2020 via the NRCS.
Statewide Basin High/Low graph March 17, 2020 via the NRCS.
Arkansas River Basin High/Low graph March 17, 2020 via the NRCS.
Upper Colorado River Basin High/Low graph March 17, 2020 via the NRCS.
Gunnison River Basin High/Low graph March 17, 2020 via the NRCS.
Laramie and North Platte Basin High/Low graph March 17, 2020 via the NRCS.
Upper Rio Grande River Basin High/Low graph March 17, 2020 via the NRCS.
San Miguel, Dolores, Animas, and San Juan Basin High/Low graph March 17, 2020 via the NRCS.
South Platte River Basin High/Low graph March 17, 2020 via the NRCS.
Yampa and White Basin High/Low graph March 17, 2020 via the NRCS.
FromThe Fort Collins Coloradodoan (Miles Blumhardt):
Fort Collins has a good chance of receiving its first snow of 3 inches or more since November, with a strong storm system moving into the area.
Early indications are the Fort Collins area will receive 3 to 6 inches of snow with the foothills and mountains west of the city to see a foot or more of snow, according to some models.
The National Weather Service issued Tuesday afternoon a winter storm watch for much of the northeastern quadrant of the state, including Fort Collins and Denver, from 10 a.m. Thursday through 6 a.m. Friday…
Meteorologists are unsure how much of the precipitation will fall as rain and how much of it snow. They do agree there is a lot of moisture with the system and what snow does fall will be wet and heavy…
They also are unsure where the low-pressure system funneling the moisture will set up. Even short distances in the tracking of low pressure can dramatically change how much snow areas receive. If it stays on its more northerly track through Colorado, that favors Denver and north. If it tracks more southerly, it favors Denver and south…
NWS said 3 to 7 inches of snow is expected along with 45 mph winds in the watch area, which will impact travel from Interstate 76 north.
The weather service also said widespread snow in the mountains will likely be heaviest along the Front Range mountains and foothills, mainly north of Interstate 70…
The National Weather Service in Cheyenne has issued a blizzard warning from Wednesday evening through Friday for a large swath of eastern Wyoming and western Nebraska. It includes area from Laramie to Sidney and will impact Interstate 80 travel. The forecast calls for 4 to 9 inches of snow and winds up to 50 mph…
Fort Collins’ traditional snowiest month — March — hasn’t delivered thus far. As of Tuesday, the city has received 0.7 inches of snow. The monthly average is around 11 inches.
We are at 51.9 inches of snow on the season, which is just less than 4 inches below our annual average and 9.4 inches above normal for this time of the snow season, according to the Colorado Climate Center.
While mountain snowpack has regressed in recent weeks, it’s still above average in five of the state’s river basins. The South Platte basin, which covers Fort Collins and Denver, is the highest at 117% of average.
During yesterday’s Governor’s Water Availability Task Force meeting Brian Domonkos (NRCS) made the point that while snowpack is fair across Colorado precipitation has not been stellar. Here’s a gallery of precipitation data from the NRCS.
Statewide Basin High/Low Precipitation Summary March 17, 2020 via the NRCS.
Arkansas River Basin High/Low Precipitation Summary March 17, 2020 via the NRCS.
Upper Colorado River Basin High/Low Precipitation Summary March 17, 2020 via the NRCS.
Gunnison River Basin High/Low Precipitation Summary March 17, 2020 via the NRCS.
Laramie and North Platte Basin High/Low Precipitation Summary March 17, 2020 via the NRCS.
Yampa and White Basin High/Low Precipitation Summary March 17, 2020 via the NRCS.
San Miguel, Dolores, Animas, and San Juan Basin High/Low Precipitation Summary March 17, 2020 via the NRCS.
South Platte River Basin High/Low Precipitation Summary March 17, 2020 via the NRCS.
Upper Rio Grande River Basin High/Low graph March 17, 2020 via the NRCS.
Yampa and White Basin High/Low graph March 17, 2020 via the NRCS.
And finally, here’s the Westwide SNOTEL basin-filled map for today from the NRCS.
Here’s a guest column from Max Ciaglo that’s running in The Colorado Sun:
Sandhill cranes have been migrating through the San Luis Valley of Colorado for thousands of years. The Rio Grande River likely attracted the first cranes to the Valley, providing the ideal habitat and abundant food resources that they required to complete their migration.
Early settlers brought agriculture to the San Luis Valley with them. To irrigate fields to grow hay, farmers diverted water from rivers onto the land, mimicking natural wetlands and effectively expanding habitat for cranes to thrive. When wheat and barley farming began in the valley in the 1900s, it also provided a high-calorie food resource that buoyed crane populations that were dwindling throughout North America.
Max Ciaglo. Photo credit: Colorado Open Lands
More than 50% of land in the valley is now publicly owned, but over 90% of existing wetlands are on private farmlands. Although these lands and the water on them are managed as part of private business operations, they provide critical habitat for sandhill cranes.
However, we in Colorado relate all too well to the sentiment that “whiskey’s for drinking; water’s for fighting.”
The battles are fought on many fronts: agricultural versus municipal users; rural towns versus urban centers. Water often flows towards money.
Water in Colorado’s rivers and streams is sometimes diverted from one river basin to meet the demands of another. These exports take water from once-productive agricultural lands and dry them up in the process, and the wildlife that depend on these lands are often left out of the discussion entirely.
In the San Luis Valley declining groundwater and extended drought have already left the land thirsty for water. But even now, as Colorado knocks on the door of a third decade of consistent drought conditions, other interests are eyeing water from the valley’s underground aquifer to export to growing cities on the Front Range of Colorado.
Farmers and ranchers across the valley have been working together with partners like Colorado Open Lands and other local coalitions for decades to protect and conserve their water. As they come together once again to fight the threat of water export, they are fighting to make sure that there is a future for agriculture in the Rio Grande Basin. And as long as there is a future for agriculture there will be a future for sandhill cranes.
Max Ciaglo is the Grain for Cranes Fellow at Colorado Open Lands, a statewide land and water conservation nonprofit. The Grain for Cranes program aims to support sandhill crane habitat by supporting agriculture in the San Luis Valley. Find out more at ColoradoOpenLands.org.
Sandhill cranes. Photo: Scott Helfrich/Audubon Photography Awards
Learn about the steps taken to ensure a safe, reliable drinking water supply for the metro area. The post Denver Water’s response to COVID-19 appeared first on News on TAP.
Many Indian reservations are located in or near contentious river basins where demand for water outstrips supply. Map courtesy of the Bureau of Reclamation.
Many of Arizona’s Native tribes have long-standing claims to water rights that haven’t yet been settled, and a discussion of efforts to negotiate possible agreements took center stage at a meeting of Gov. Doug Ducey’s water council.
The meeting grew tense after Arizona’s top water official gave a presentation on the status of tribes’ unresolved water claims, and then didn’t allow leaders of four tribes to speak.
Arizona Department of Water Resources Director Tom Buschatzke said he sent letters a week ago to all 22 federally recognized tribes in Arizona inviting them to speak about the issue at upcoming meetings later this year.
That stance drew criticism from Arizona House Minority Leader Charlene Fernandez, D-Yuma, and sharply worded letters from the leaders of four tribal nations, which laid out grievances about how state officials have been treating their water cases.
Tom Buschatzke.
Buschatzke gave a presentation [March 13, 2020] for the meeting reviewing the history of federal and state law regarding water for Indian reservations, the amounts of water that some tribes have obtained through congressionally approved settlements, and the status of 11 tribes’ outstanding water rights claims.
Buschatzke said it’s important to clarify Indian water rights claims because “unresolved claims create significant uncertainty for water users in our state.” Each tribe has priority water rights based on the date its reservation was established, he said, and may be entitled to large amounts of water.
Blue Mesa Reservoir, Curecanti National Recreation Area. Photo credit: Victoria Stauffenberg via Wikimedian Commons
From email from Reclamation (Erik Knight):
Releases from the Aspinall Unit will be increased to 700 cfs on Thursday, March 19th. Releases are being adjusted to accommodate the start of diversions to the Gunnison Tunnel and to lower river flows given the below average runoff forecast. Snowpack in the Upper Gunnison Basin is currently at 103% of normal. The March 1st runoff forecast for Blue Mesa Reservoir predicts 78% of average for April-July inflows. Flows in the lower Gunnison River are currently above the baseflow target of 1050 cfs. River flows are expected to stay above the baseflow target for the foreseeable future.
Pursuant to the Aspinall Unit Operations Record of Decision (ROD), the baseflow target in the lower Gunnison River, as measured at the Whitewater gage, is 1050 cfs for January through March.
Currently, there are no diversions into the Gunnison Tunnel and flows in the Gunnison River through the Black Canyon are around 600 cfs. After this release change Gunnison Tunnel diversions will be at 300 cfs and flows in the Gunnison River through the Black Canyon will be around 400 cfs. Current flow information is obtained from provisional data that may undergo revision subsequent to review.
Men viewing vortex tube sand trap in Jackson Ditch at Bellvue Hydraulic Laboratory, 1948. Photograph from Irrigation Research Papers, Water Resources Archive.
From email from the CSU Water Resources Archive (Patty Rettig):
Apologies for the mass email, but I wanted to let everyone know that Water Tables has been postponed due to the coronavirus situation. Hopefully this will all pass quickly and we can get the event rescheduled for later this year. I will keep you updated!
In the meantime, thank you for helping us get the word out originally. It’s not necessary to send further updates to your constituencies, as we have this posted on the Water Tables website.
Best,
Patty
Patricia J. Rettig
Head Archivist
Water Resources Archive
Colorado State University
Morgan Library
Fort Collins, CO 80523-1019
Patricia.Rettig@ColoState.edu
970-491-1939
FromThe Washington Post (Harry Stevens). Click through for the full story and the interactive graphics. Here’s an excerpt:
After the first case of covid-19, the disease caused by the new strain of coronavirus, was announced in the United States, reports of further infections trickled in slowly. Two months later, that trickle has turned into a steady current.
Graphic credit: The Washington Post
This so-called exponential curve has experts worried. If the number of cases were to continue to double every three days, there would be about a hundred million cases in the United States by May.
That is math, not prophecy. The spread can be slowed, public health professionals say, if people practice “social distancing” by avoiding public spaces and generally limiting their movement.
Still, without any measures to slow it down, covid-19 will continue to spread exponentially for months. To understand why, it is instructive to simulate the spread of a fake disease through a population…
Even with different results, moderate social distancing will usually outperform the attempted quarantine, and extensive social distancing usually works best of all. Below is a comparison of your results.
A Pi Day pie from Reilly’s Bakery in Biddeford at Biddeford High School in Biddeford, ME on Friday, March 13, 2015. (Photo by Whitney Hayward/Portland Press Herald via Getty Images)
Click here to read the report from the South Platte Regional Opportunites Work Group.
Executive Summary
The South Platte Regional Opportunities Water Group (SPROWG) Concept will provide water supplies to meet future municipal and agricultural water needs in the South Platte Basin. Several aspects of the SPROWG Concept were collaboratively researched in this feasibility study (Study) including identification of future water demands, strategies for incorporating environmental and recreational enhancements, needed infrastructure, water treatment strategies, potential costs, governance considerations, and communication needs.
Project Outreach
Extensive outreach was conducted and included meetings with potential future SPROWG participants and stakeholders and a survey that was sent to over 100 municipal, agricultural, environment, and recreation water users and stakeholders. The results of the outreach informed the types of governance structures that could be viable for a future SPROWG organization, the configuration and delivery goals for SPROWG infrastructure, water treatment strategies needed to provide supplies of suitable water quality, and communication and outreach needs.
Communications and outreach are an important aspect to developing the SPROWG Concept and tailoring it to fit the broadest spectrum of water users and needs. A Communications and Outreach Plan was developed that includes goals, suggested stakeholders, recommended near-term activities, recommended activities to facilitate recruitment of participants, recommended key messages, and metrics to track the success of various types of communication. The Communications and Outreach Plan serves to:
Educate stakeholders and create awareness needed to refine the recommended governance, operational, and infrastructure concepts.
Educate potential SPROWG Concept participants to facilitate recruitment.
Educate ratepayers/taxpayers on the need for the SPROWG Concept and funding.
Continue stakeholder engagement and transparency to build stakeholder support.
The South Platte Regional Opportunities Water Group has released the findings of its year-long study to help bridge the water shortage gap in the South Platte River Basin.
SPROWG’s study evaluated four concept alternatives that would use a combination of off-channel water storage at multiple locations, infrastructure and water exchanges to develop additional water supplies from the South Platte River.
The study results were presented to the Colorado Water Conservation Board Thursday in Denver.
Joe Frank, General Manager of the Lower South Platte Water Conservancy District, who oversaw administration of the grant funds that paid for the study, said the purpose of the study was to find as many options as possible that would still be feasible…
The four water supply alternatives evaluated include multiple linked storage facilities capable of holding between 215,000 and 409,000 acre-feet of water at various locations between Denver and the Colorado Nebraska state line. The water would be transported via a pipeline or through “exchanges” or trading water from one location to another. The study’s alternatives are combinations of four water storage projects: Henderson Storage, Kersey Storage, Balzac Storage and Julesburg Storage. Each is named for the approximate location of the storage facility.
Alternative One includes Henderson, Kersey and Balzac; Alternative Two is the same three sites but with different capacities at each site. Alternatives Three and Four include all four sites but, again, each with different capacities. Alternatives Two, Three and Four also include a pipeline from the Balzac site to pump 30 cubic feet per second of water upstream to Denver.
The alternatives seek to efficiently use these sources of in-basin supply without relying on past practices of diverting additional water from the Western Slope or permanently drying up agricultural lands in the South Platte basin…
The SPROWG study, funded in large part by a grant from the Colorado Water Conservation Board, built upon the work of others who had analyzed various strategies that would develop several types of South Platte water supplies to meet multiple benefits.
The conceptual cost estimates for the concepts ranged from $18,400 to $22,800 per acre-foot for raw water and $33,600 to $43,200 per acre-foot for treated water, which are in line with other large regional water projects. These costs included the anticipated water treatment strategies that were evaluated to make the water suitable for potable uses. While the most expensive to build, Alternative 4 had the lowest per acre foot cost of the alternatives because it has the highest yield.
The closest National Weather Service (NWS) radar is in Pueblo County, more than 90 miles away. And the Wet Mountains and the Sangres block the radar beam.
The other radars are blocked by mountains as well, one in Denver, one in Albuquerque, and another on the Grand Mesa. So there is essentially no weather data available below 10,000 feet.
EVERY DROP COUNTS
There is a critical need to know how much new water will be available each year.
“Right here on the valley floor, it’s really one of the driest places in the state of Colorado,” said Simpson. “We get less than seven inches of precipitation all year, so we are very dependent on snowpack.”
Simpson said they are obligated by state compacts to allow a certain amount of water pass through the Colorado border every year along the Rio Grande and the Conejos Rivers.
“The diversions out of those river systems are what build and support our aquifer system here, and we depend on our aquifer system heavily,” said Simpson.
Simpson said the streamflow estimates could be off as much as 20-30% making it difficult to manage the rights to water during the summer.
THE EXPERIMENT
About seven years ago, [Cleve] Simpson heard about improvements being made to software and computer modeling that estimate precipitation totals based on Doppler radar data.
“We said why don’t we see if we can adopt that to snowpack here,” said Simpson.
Now all they needed was access to Doppler radar.
“That year in 2013, there was a significant wildfire in the area called the West Fork Complex Fire. They had to bring in a radar to help forecast how the weather was changing that fire,” said Simpson.
After that fire, the Conejos Water Conservancy District decided to rent that radar, move it to Alamosa, and try an experiment to better estimate the amount of snow that fell in there basin.
It was a basic radar system that needed quite a bit of attention, but they were determined that some hard work would pay off in the future. Every time there was a storm coming in, they had have a person go out to the radar site to get it running.
“They usually had to wake someone up, usually someone from the local university,” said Simpson. “That person would have to go down to the airport, crank up the unit, and start capturing radar data.”
Simpson said they rented that radar for five years, and over that time they saw very accurate streamflow forecasts based on their new data.
THE SOLUTION
Knowing that the radar data helped them better estimate how much water was available in the snowpack, the next step would be to get their own radar.
“It was a very exciting project to work on because all the players that came to the table wanted to be there, and everybody put in something,” said Gigi Dennis, the Alamosa County Administrator.
Dennis said various state agencies, counties, and water districts came together to get the project off the ground. A brand new Doppler radar was built on the San Luis Valley Regional Airport property in September last year.
“Once we got the all the funding in place, the rest of the project went relatively fast,” said Dennis.
This radar data won’t show up on your apps because it is not an NWS radar in the NEXRAD network, but the product is available on a website set up by those involved.</blockquote
Last March, a powerful storm known as a bomb cyclone erupted in the Plains.
While it set low pressure records and produced blizzard conditions, it had one lasting impact.
It triggered record flooding in Nebraska and other states.
The flooding lasted for months in the Missouri Valley.
It even destroyed a dam along the Nebraska – South Dakota border.
Nebraska state officials flew over the flood-ravaged Spencer Dam on March 16, 2019. The Niobrara River had been running at 5 or 6 feet of gage height before it broke through the 90-year-old dam early on March 14, 2019. After that, an 11-foot wave rolled through. Photo credit: State of Nebraska
The storm intensified rapidly in the High Plains of eastern Colorado and western Kansas. By March 13, 2019, its pressure had plunged fast enough to be classified as a bomb cyclone and set all-time low-pressure records in four locations…
The Epic Flood
The bomb cyclone was the final element in a rare confluence of factors that triggered massive flooding in the nation’s midsection that lingered in some areas for months.
Rapid snowmelt was followed by heavy rain. This unleashed rapid runoff into rivers previously frozen from exceptional February and early-March cold.
The ice-choked Niobrara River in northern Nebraska burst through and destroyed Spencer Dam and sent a wave of water and massive ice slabs into nearby towns and fields.
In all, 42 locations from the Missouri Valley to Wisconsin set new record river levels in mid-March 2019…
This story didn’t end in March.
A wet spring, summer and fall kept stretches of the Missouri River flooded much of the rest of the year, months longer than the previous major flood in 2011.
It took until six days before Christmas for Nebraska to be free of any National Weather Service flood warnings, watches or advisories, a streak that began just after Groundhog Day.
In Nebraska alone the flood affected over 7,000 homes with damage estimated at $2.7 billion.
NOAA estimated total damage from this historic flood event at $10.8 billion, one of the nation’s costliest inland flood events on record.
According to the figures from SNOTEL and the Colorado Natural Resources Conservation Service (NRCS) this week, the snowpack in the Southwestern Colorado mountains is nothing close to the 700% of normal we experienced last year, although it is well above the low mark set in 2018.
As of Tuesday this week, even with a relatively active snow season on Colorado, it turns out that the most intense snowpack is in the northern part of the state, while the San Juans and other more southern ranges did not fare as well.
There were 39 SNOTEL sites across northern Colorado that received above the 90th percentile of February precipitation on the period of record, with nine of these being the record high. Conversely, 24 SNOTEL sites in the southern half of the state were in the bottom 10th percentile with six sites observing record low precipitation…
As of this week the SNOTEL numbers for the Gunnison Basin are ranging somewhere between the 2018 low and the averages over the past couple of decades.
The basin watershed has an average of about 13 or 14 inches of snow water equivalent and rests at about 103 percent of normal, as opposed to even lower numbers in the Dolores River Basin…
The good news tends to be the level of the reservoirs, like Blue Mesa and Ridgway…
Following the trends of snowpack and precipitation, stream flow forecasts predict considerably higher values across Northern Colorado than in the southern half of the state, with respect to normal. On the low end the average of forecasts in the combined San Miguel, Dolores, Animas, and San Juan basins is for 64 percent of normal, followed closely by the Rio Grande at 68 percent.
The Gunnison is doing a little better with all forecast points averaging out to 72 percent of normal. The most plentiful forecasts in the state reside in the South Platte Basin with some exceeding 130 percent of average in the main stem headwaters. The Arkansas, Colorado, and combined Yampa and White basins are forecasted to have near normal runoff volumes with the basin-wide average of forecasts ranging from 96 to 106 percent of normal.
Drought impacted corn. Water stress can lead to insufficient water supply for cities, agriculture, and vegetation. Dry vegetation may facilitate the propagation and increase the risk of wildfires.
Researchers in our region are arguing for new models to better plan for a recent climate phenomenon: flash droughts. According to a new paper published in the journal Nature Climate Change, these events present new challenges for climate predictors.
Angie Pendergrass is a scientist with the National Center for Atmospheric Research in Boulder, Colorado and a co-author of the paper. She said current models are better at measuring long-term drought effects.
“There needs to be a faster timeframe that we monitor, [to] say where we are and what’s happening,” said Pendergrass. “Instead of every week, that needs to happen perhaps every few days.”
Flash droughts are short-term climate events where an area will experience a sudden and rapid escalation of drought conditions. Pendergrass said that can have big impacts on arid regions, like the Mountain West, which has some of the driest states in the nation…
“If you’re already starting out from a state that’s a little bit dry and then suddenly things get a lot drier, it can cause problems in other situations, too,” Pendergrass said.
Those problems range from agriculture concerns to water management and energy production.
“A flash drought could deplete reservoirs, affecting both water availability and hydropower generation capacity in places like the southwest United States, where water is highly managed,” the paper stated.
Click on a thumbnail graphic to view a gallery of drought data from the US Drought Monitor.
US Drought Monitor March 10, 2020.
West Drought Monitor March 10, 2020.
Colorado Drought Monitor March 10, 2020.
Click here to go to the US Drought Monitor website. Here’s an excerpt:
This Week’s Drought Summary
A low pressure system propagated eastward across much of the southern tier states early in the period (March 4-6) and merged with a short-wave trough dropping southeastward from the Midwest before moving off the Mid-Atlantic coast on March 7. This system dropped more than 2 inches of rainfall over large areas from extreme southeastern New Mexico eastward to South Carolina. Some areas of central Alabama and Georgia saw more than 5 inches of rainfall, which fell over saturated soil. However, much of the heavier rainfall remained north of the I-10 corridor from southern Texas to northern Florida, while areas south of I-10 received only modest amounts, which were not nearly enough to reduce deficits. The Pacific Northwest and California also saw some precipitation over the past week, but amounts were not enough to reduce any deficits. Some recent dryness over southern Iowa and northern Missouri was mitigated a bit with near- to above-normal precipitation falling last week as well. Deficits increased in the Mid-Atlantic and New England over the past 30 days, but were kept at bay, as these areas saw 0.1 to 1 inch and 0.1 to 0.5 inches of rainfall, respectively. The active storm track continued last week for Alaska, with the southeastern Panhandle receiving 2 to 6 inches of precipitation over many areas. This precipitation, along with near- to below-normal temperatures, has finally produced above-normal snowpack in the Alaska Panhandle for the first time in 7 to 8 years, warranting D0 removal. Hawaii remained dry on the leeward slopes last week due to persistent trade winds, leading to some D0 expansion and development on the Big Island and Oahu, respectively. Puerto Rico saw D0 removal, as northern portions of the island saw much above-normal precipitation, eliminating short-term deficits…
High Plains
D1 was expanded a bit in northeastern Colorado (i.e. existing D1 areas were connected). This area has continued to experience warmer-than-average temperatures in recent weeks, which has had adverse effects on winter wheat and rangelands prior to green-up. In addition to SPIs showing D1 (and worse over longer periods at a couple locations), USGS stream flows in surrounding locations were showing flows below the 10th percentile. Some drier-than-normal conditions crept into eastern portions of the Dakotas over the past 30 days (25 to 50 percent of normal precipitation, with some small areas of 10 to 25 percent of normal in extreme eastern South Dakota). However, 60- and 90-day precipitation was near and above normal, respectively, for these areas. Therefore, it was status quo for the rest of the High Plains Region…
West
D0 was expanded to the coast in Monterey County, California, with 5 to 10 inch year-to-date (YTD) deficits over much of the county (greater than 10 inch deficits on some of the windward slopes). D0 was also expanded eastward and southeastward from Los Angeles County in favor of those areas receiving 10 to 25 percent of YTD precipitation with some locations seeing 25 to 50 percent of normal water-year-to-date (WYTD) precipitation. However, this area was not extended further southward as most of San Diego County has seen near-normal precipitation going back 6 months, and near-normal rainfall over the past week. D1 was expanded to connect the areas in California and Nevada (near Reno, Nevada). March 10 snow water content (SWC) was still below normal, and YTD precipitation was 5 to 10 percent of normal within the expanded area. D1 was also expanded southward into San Luis Obispo, Santa Barbara, Ventura, and Los Angeles Counties in California, with several locations seeing the January-February period falling within the top 5 driest on record. This has already had large impacts to natural vegetation needed for feeding livestock, as many ranchers have resorted to supplemental feeding. Similar reports have come from northern California (Siskiyou County), over the past couple of weeks, along with unregulated streams running dry, hence the D1 expansion there as well.
Elsewhere in the Western Region, D0 was reduced in southeastern New Mexico and D1 was removed in eastern New Mexico due to last week’s rainfall. In addition, many of these areas are seeing greater than 150 percent of normal YTD precipitation and near-normal (former D0 and D1 areas) and above-normal (former D0 area) WYTD precipitation. D0 was also expanded in eastern Nevada (northeast White Pine County). 6-month precipitation is 25 to 50 percent of normal, which has become worse over the past 30 days (areas of 2 to 5 percent of normal), supporting ground reports of abnormal dryness. D1 was expanded eastward in central and northern Washington. Although the past 60 to 90 days have seen near-normal precipitation for these areas, 6-month deficits show precipitation at 25 to 50 percent of normal and little to no precipitation has fallen in the past 30 days, which has contributed to some below-normal snowpack over eastern portions of the state. D1 was also expanded westward in northwest Oregon (northern Willamette Valley) and eastward in southeastern Oregon in favor of WYTD deficits of over 13 inches and below-normal SWC. In addition, 7-day USGS stream flows continued to be below the 10th percentile last week. Additional D1 expansion was made in southeastern Oregon due to 25 to 50 percent of normal YTD and WYTD precipitation…
South
D0 was expanded northward from the Gulf Coast of Louisiana, Mississippi, and Alabama. Many of these areas have 6-month deficits of over 8 inches; 6-month deficits over 12 inches in southeastern LA (i.e. 50 to 75 percent of normal). Rainfall over the past 30 days has been particularly low, with precipitation falling to 25 to 50 percent of normal, with some locations in the new D1 area seeing 10 to 25 percent of normal. Some expansion of D1 was made northeast of Corpus Christi, Texas, and D2 toward the coast, as USGS stream flows were well below normal at many locations and soil moisture has diminished further in recent weeks. Meanwhile, many areas in western and northern Texas (north of the I-10 corridor) saw anywhere from 0.5 to 3 inches (in isolated locations). The heavier rainfall extended southward into the upper Rio Grande Valley where many areas saw 0.25 to 1 inch of rainfall, warranted some reduction in D0, D1, and D2 areas along the river. It is status quo elsewhere for the Southern Region, including southwestern Oklahoma, whose 7-day totals (0.25 to 1 inch) were not enough to cut into rainfall deficits…
Looking Ahead
During the next 5 days (March 12-16), low pressure will be moving into southern California and the Southwest. This will help to deepen troughing over the western CONUS allowing for a southern stream of moisture to develop, enhancing chances for precipitation over California, the Southwest, southern Great Plains, and the Ohio River Valley. Below-normal temperatures (5°F to 10°F) are also expected for much of the West Coast and northern Rockies. Meanwhile, the Gulf Coast is likely to see temperatures 5°F to 10°F above normal, south of a lingering frontal boundary.
The 6-10 day (March 17-21) extended range forecast favors an amplified 500-hPa height pattern with Pacific ridging building northward into Alaska, leading to above-normal temperatures and precipitation over much of Mainland Alaska, with near- and below- normal precipitation along the southern coast and southeastern Panhandle. Troughing is favored over much of the western CONUS, enhancing probabilities for below-normal temperatures and above-normal precipitation in central and southern California and the southern Rockies, which would be welcome for areas with below-normal snowpack. Above-normal precipitation is favored for the eastern two-thirds of the CONUS, as the pattern is favorable for lee-side cyclogenesis east of the Rockies. Weakly above-normal chances for precipitation are favored along the Gulf Coast east of Texas, with below-normal probabilities favored over the drier areas of the Florida Peninsula. The odds favor above-normal temperatures in the eastern half of the lower 48 states.
US Drought Monitor one week change map ending March 10, 2020.
Westwide SNOTEL basin-filled map March 12, 2020 via the NRCS.
Click here to read the latest briefing (scroll down):
Despite a relatively dry February and a dry start to March, the snowpack in most of the region remains near normal. Below-average (70-90%) spring-summer streamflow is forecasted for much of the region, while near-average streamflow is forecasted in northern Utah, above-average streamflow is forecasted for the Colorado Headwaters and Yampa River basin, and much-below-average streamflow is forecasted for the San Juan River basin. Drought conditions across the region have changed little in the last month.
Lake Powell would become home to a special 500,000 acre foot drought pool if Colorado, Wyoming, Utah and New Mexico agree to save enough water to fill it. Credit: Creative Commons
If Colorado decides to join in an historic Colorado River drought protection effort, one that would require setting aside as much as 500,000 acre-feet of water in Lake Powell, can it find a fair way to get the work done? A way that won’t cripple farm economies and one which ensures Front Range cities bear their share of the burden?
That was one of the key questions more than 100 people, citizen volunteers and water managers, addressed last week as part of a two-day meeting in Denver to continue exploring whether the state should participate in the effort. The Lake Powell drought pool, authorized by Congress last year as part of the Colorado River Drought Contingency Plan, would help protect Coloradans if the Colorado River, at some point in the future, hits a crisis point, triggering mandatory cutbacks.
But finding ways to set aside that much water, the equivalent of what roughly 1 million people use in a year at home, is a complex proposition. The voluntary program, if created, would pay water users who agree to participate. And it would mean farmers fallowing fields in order to send their water downstream and cities convincing their customers to do with less water in order to do the same. The concept has been dubbed “demand management.”
Among the key issues discussed at the joint Interbasin Compact Committee and demand management work group confab last week is whether there is a truly equitable way to fill the drought pool that doesn’t disproportionately impact one region or sector in the state.
In addition, a majority of participants reported that they wanted any drought plan to include environmental analyses to ensure whichever methods are selected don’t harm streams and river habitat.
Some pointed to the need to identify “tipping points” when reduced water use would create harmful economic effects in any given community, and suggested that demand management be viewed as a shared responsibility.
Flipping the narrative of shared responsibility, participants said sharing benefits equally was important as well. They want to ensure that people selected to participate would do so on a time-limited basis, so that a wide variety of entities have the opportunity to benefit from the payments coming from what is likely to be a multi-million-dollar program.
“People are starting to get it,” said Russell George. George is a former lawmaker who helped create the 15-year-old public collaborative program which facilitates and helps negotiate issues that arise among Colorado’s eight major river basins and metro area via basin roundtables. He chairs the Interbasin Compact Committee, composed of delegates from those roundtables.
“It’s understood that we have to be fair about this and we have to share [the burden] or it won’t work. I think we’re making great progress,” George said.
The Colorado River is a major source of the state’s water, with all Western Slope and roughly half of Front Range water supplies derived from its flows.
But growing populations, chronic drought and climate change pose sharp risks to the river’s ability to sustain all who depend on it. The concept behind the drought pool is to help reduce the threat of future mandatory cutbacks to Colorado water users under the terms of the 1922 Colorado River Compact.
The public demand management study process, facilitated by the Colorado Water Conservation Board, has caused concern among different user groups, including farmers. Because growers consume so much of the state’s water, they worry that they are the biggest target for water use reductions, which could directly harm their livelihoods if the program isn’t implemented carefully and on a temporary basis.
In early 2019 the seven states that comprise the Colorado River Basin—Arizona, California and Nevada in the Lower Basin, and Colorado, New Mexico, Utah and Wyoming in the Upper Basin—agreed for the first time to a series of steps, known as the Colorado River Basin Drought Contingency Plan, to help stave off a crisis on the river.
Colorado River Basin. Map credit: The Water Education Foundation
And while Lower Basin states have already begun cutting back water use in order to store more in Lake Mead, the four Upper Basin states are still studying how best to participate to shore up Lake Powell. For the drought pool program to move forward, all four states would need to agree and contribute to the pool. George pointed to Colorado as a leader among the four states, saying it would likely be responsible for contributing as much as 250,000 acre-feet to the pool.
“We appreciate the focus, dedication and collaboration of our work group members,” said CWCB Director Rebecca Mitchell in a statement. “This workshop was the next step in sharing ideas for Colorado’s water future, and positioning our state as a national leader for cooperative problem solving.”
The eight major volunteer work groups, addressing such topics as the law, the environment, agriculture and water administration, will continue meeting throughout the year, with a mid-point report based on their findings to date due out sometime this summer.
Travis Smith, a former CWCB board member from Del Norte who is now participating on the agriculture work group, said he is hopeful that the work groups will be able to come up with a plan the public will endorse. Any final plan will likely have to be approved by Colorado lawmakers.
“Coming together to address Colorado’s water future is something we’ve been practicing through the [nine river basin roundtables] for years. Will we get there? Absolutely,” Smith said.
Jerd Smith is editor of Fresh Water News. She can be reached at 720-398-6474, via email at jerd@wateredco.org or @jerd_smith.
ENSO Alert System Status: Not Active Synopsis: ENSO-neutral is favored for the Northern Hemisphere spring 2020 (~65% chance), continuing through summer 2020 (~55% chance).
During February 2020, above-average sea surface temperatures (SSTs) were evident across the western, central, and far eastern Pacific Ocean. The latest weekly Niño-3.4 and Niño-3 indices were near-to-above average (+0.5°C and +0.1°C, respectively), with the Niño-4 and Niño-1+2 indices warmer, at +1.1°C. Equatorial subsurface temperatures (averaged across 180°-100°W) remained above average during the month, with positive anomalies spanning the western to the east-central equatorial Pacific, from the surface to ~150m depth. Also during the month, low-level westerly wind anomalies persisted over the western tropical Pacific Ocean, while upper-level wind anomalies were mostly westerly over the eastern half of the basin. Tropical convection remained suppressed over Indonesia and was enhanced near and just west of the Date Line. While the equatorial Southern Oscillation index (SOI) was negative, the traditional SOI was near average. Overall, the combined oceanic and atmospheric system remained consistent with ENSO-neutral.
The majority of models in the IRI/CPC plume favor ENSO-neutral (Niño-3.4 index between -0.5°C and +0.5°C) through the Northern Hemisphere fall. Despite elevated Niño 3.4 index values in the near-term, the forecaster consensus expects the Niño-3.4 index values will decrease gradually through the spring and summer. In summary, ENSO-neutral is favored for the Northern Hemisphere spring 2020 (~65% chance), continuing through summer 2020 (~55% chance; click CPC/IRI consensus forecast for the chance of each outcome for each 3-month period).
For example, in Florida, the loss of just 3% of wetland coverage resulted in $480 million in property damage during just one hurricane.
Mangrove forests, marshes, and seagrass beds protect inland areas from storm surges and strong winds. Over long periods, coastal wetlands like these build up sediment that mitigates sea level rise and local land subsidence.
A new analysis of property damage from Atlantic and Gulf of Mexico coastal storms has shown that counties with larger wetlands suffered lower property damage costs than did counties with smaller wetlands.
“Starting in 1996, the U.S. government started to produce damage estimates for each tropical cyclone in a consistent manner,” explained coauthor Richard Carson, an economist at the University of California, San Diego (UCSD) in La Jolla. Before that, the data were collected only for hurricanes, which hindered past attempts to put a price on the marginal value, or price per unit, of wetlands, he said.
With the complete data set, the researchers examined all 88 tropical cyclones and hurricanes that affected the United States starting in 1996. That time period includes Hurricanes Katrina and Sandy.
A Protective and Economic Boon
In addition to property damage data for tropical cyclones of all strengths, “our data set has considerably more spatial resolution,” Carson said, “which is a result of large amounts of information on storm tracks, property location, and wetland location all being digitized for use in a geographical information system basis.”
First author Fanglin Sun, formerly at UCSD and now an economist at Amazon.com, added that “areas subject to flood risk in a county are more accurately estimated, based on local elevation data and detailed information on individual storm trajectories” and wind speeds throughout affected areas.
The finer level of detail for the storm data let the researchers finally begin connecting wetland coverage and storm damage on a county-by-county basis, Carson said. “A storm track moving a couple of kilometers one direction or the other allows the amount of wetland protection to vary within the same county.”
In terms of property damage, Sun and Carson found that a square kilometer of wetlands saved an average of $1.8 million per year. Over the next 30 years, an average unit of wetlands could save $36 million in storm damage.
Some wetlands were valued at less than $800 per year per square kilometer and some at nearly $100 million. That marginal value depended on many factors, including a county’s property values, existing wetland coverage, coastline shape, elevation, building codes, and chance of actually experiencing damaging winds. And each of those variables fluctuated over the 20 years the team studied.
Overall, the highest-valued wetlands were in urban counties with large populations and the lowest-valued were in rural areas with small populations. However, wetlands provided a greater relative savings against weaker cyclones and in counties with less stringent building codes — areas that might not expect or plan for a tropical storm.
The team found no significant difference in the marginal value of saltwater versus freshwater wetlands or mangroves versus marshes. “Forested wetlands tend to be better at reducing wind speed and marshes tend to be better at absorbing water,” Carson said, “so the specific nature of the storm when it hits an area is likely to matter. [But] our results suggest that, on average, there is no difference.”
The team published these results in Proceedings of the National Academy of Sciences of the United States of America on March 3.
Wetlands at Risk
Most areas that have experienced storm-related property damage in the past 20 years have also lost wetland coverage, the researchers found. They calculated that Floridians would have been spared $480 million in property damage from Hurricane Irma alone had the state’s wetland coverage not shrunk by 2.8% in the decade prior.
Moreover, recent changes to the Clean Water Act have made the remaining coastal wetlands more vulnerable.
“The federal government, with respect to the U.S. Clean Water Act, took the position that the previous wetland studies were not reliable enough for use in assessing the benefits and cost of protecting wetlands,” Carson said.
“The value coastal wetlands provide for storm protection is substantial and should be taken into account as policy makers debate the Clean Water Act,” Sun said. “It’s also worth noting,” she added, “that storm protection for property is just one of many ecological services that wetlands provide. We hope our study will spur future research quantifying these other services as well.”
With tropical storms and hurricanes expected to happen more often because of climate change, the team wrote, wetlands will be more economically valuable than ever.
The ocean surface in the central tropical Pacific has been warmer than the long-term average for a few months now, but overall the ocean-atmosphere system is still in neutral—neither El Niño nor La Niña. The El Niño/Southern Oscillation (ENSO) forecast team estimates about a 65% chance that the tropical Pacific will continue in ENSO-neutral this spring, and about a 55% chance neutral will remain through the summer. We’ll take a spin through the current situation, and lay out some of the puzzle pieces forecasters look at when assembling a picture of ENSO in the future.
Jigsaw
First, though—does anyone remember why we spend so much time and energy predicting the evolution of the temperature of the tropical Pacific Ocean? If you guessed “because El Niño and La Niña have impacts on weather and climate around the world and can be predicted in advance,” you get a gold star! While nothing is a sure bet when you’re making predictions, a developing El Niño or La Niña can provide some valuable clues about upcoming seasonal climate. For more on that, check out Tom’s post.
With that important piece of housekeeping out of the way, it’s on to current conditions. As I mentioned above, the tropical Pacific has been hovering a bit warmer than average through the winter, including in our primary monitoring region, Niño3.4. The February Niño3.4 index was 0.4°C above the 1986-2015 average, according to the ERSSTv5 dataset, our most consistent long-term record. This is just a hair below the El Niño threshold of 0.5°C warmer than average.
Monthly sea surface temperature in the Niño 3.4 region of the tropical Pacific for 2019-2020 (purple line) and all other years starting from neutral winters since 1950. Climate.gov graph based on ERSSTv5 temperature data.
The atmosphere in the tropical Pacific region actually looked a bit El Niño-y (El Niño-ish? These are not real words) last month, with greater-than-average amounts of rain and clouds over the central tropical Pacific, and less over Indonesia. Also, the near-surface winds over the western tropical Pacific were weaker than average.
However, some atmospheric features are not consistent with El Niño, such as the atmospheric pressure difference at sea level between Tahiti and Darwin, which is known as the Southern Oscillation Index. Also, most computer models predict we’ll remain ENSO-neutral (neither El Niño nor La Niña) in the coming seasons. I went into more detail about the forecast process last month—this month was quite similar, so head over to that post if you would like more information.
Brain teasers
Getting into late summer and next fall, though, some models predict that the Niño3.4 index could drop below the La Niña threshold of 0.5°C cooler than the long-term average. So are we gearing up for La Niña next winter? Perhaps, but we’re giving it lower odds. Forecasters are putting the odds of La Niña at around 35-40% by next fall, but there are reasons why we’re not giving La Niña a big edge.
Official CPC/IRI forecast of the odds of El Niño, neutral ENSO and La Niña conditions issued in mid-March.
First, check out that Niño3.4 graph a few paragraphs up. The gray lines show every year since 1950 that started from an ENSO-neutral winter like the one we’ve just had. In 22 examples, La Niña has not followed a neutral winter once! Does that mean it’s impossible? Definitely not! But it would be something we haven’t observed before.
Another consideration is the spring predictability barrier. Forecasts made in March, April, and May tend to be less reliable than forecasts made during the rest of the year. This is partly because spring is often a transition time between El Niño, La Niña, and neutral. Also, the tropical Pacific has a particularly narrow temperature range in the spring, with only about 2°C separating the warmest spring Niño3.4 and the coolest. For comparison, the range in winter is more than 5.5°C. Predicting a small change is tougher than predicting a larger one, contributing to the spring barrier.
Trivia night
We’re always looking for more context to interpret model predictions, especially in the spring. An interesting study by friend-of-the-Blog Mike Tippett, of Columbia University, shows that the tendency of the Niño3.4 index in the spring does not have a strong relationship with the tendency through the summer. By “tendency” I mean the direction of the month-to-month change in Niño3.4 temperature. So, if the March Niño3.4 sea surface is cooler than February, that would be a cooling tendency. Mike compared the tendency in February–March to that in April–July.
The relationship between the February–March tendency of the Niño3.4 Index to the April–July tendency. Tendency is the change between February and March, or April to July. The blue line indicates the linear regression model that best fits the data. If the relationship between these two tendencies were very strong, the dots would lie close to the line. If there were no relationship at all, they would be scattered randomly all over the graph. Figure by climate.gov from Mike Tippett’s data.
He found that the relationship between spring and summer tendencies is not particularly strong (see footnote*). And, when the spring tendency is very small, it provides even less information about the summer. We don’t yet know what the March Niño3.4 index will be, but it’s likely that it will be very close to February, meaning a tendency close to zero. In the past, a February–March with little change has preceded a wide variety of April–July outcomes. So, while this may help us make predictions in future springs, currently we are not seeing a strong favorite for upcoming ENSO conditions.
The spring barrier will hang around through May, but we’re here year-round. Thanks for checking in. You can look forward to Michelle taking the helm for the April ENSO Update!
* Mike used linear least squares regression, which finds the closest fit of a line to the scatter points in the graph. He found a correlation between the Feb–Mar and Apr–Jul tendencies of 0.46. A correlation of 0.46 equals an explained variance of about 21%: meaning about 21% of the behavior of the Apr–Jul tendency can be predicted based on Feb–Mar.
The Dolores Town Board [March 9, 2020] raised rates for water and sewer services, increased funding for the farmers market, and preliminarily approved property transactions and a solar project.
Beginning May 1, the water rate will increase by $5 per month, to $30.84 per month, a 19.3% increase. The sewer rate will rise $2.25, to $30.91, a 7.8 percent increase. Rates were last increased in 2015, 2009 and 2006.
The board and town staff said increases are needed to fund rising maintenance costs and system upgrades to the 50-year old infrastructure. It passed by a 6-0 vote.
The increase will help finance a $650,000 project to replace deteriorating water lines beneath Colorado Highway 145. Nine deteriorating lines need to be replaced before the Colorado Department of Transportation repaves the highway in 2021.
To help pay for the project, the town has applied for a $292,630 grant from the Colorado Department of Local Affairs. To cover the 100% grant match, the town would pull from reserves and take out a 4% interest loan, with payments covered by the monthly $5 water rate increase. Revenues from the increases will also help build water and sewer budget reserves for future maintenance and improvements.
The town board created a task force to research a potential tiered water use billing system that would incentivise water savings.
Property owners in 15 Western Slope counties could be asked to pay an average of $7.65 more in annual property taxes to the Colorado River Water Conservation District, if its board votes to place the question on the November ballot. District general manager Andy Mueller has proposed the property tax increase to make up for declining funding and create a new pot of money for water supply projects developed by local partners in each county.
“The money would help us with structural deficits caused by Gallagher, TABOR and the decline of the fossil fuel industry in the district,” Mueller said…
To address declining funding, the district eliminated a grant program for small projects and reduced expenses by cutting staff by 16 percent, which was four employees. Thevehicle fleet was also cut by 25 percent and the travel budget by 20 percent…
Mueller is recommending the district ask for an increase in property taxes from the current 0.252 mills to 0.500 mills, as well as exempting the spending limits from the TABOR law. The district’s property tax revenues, which were $4.1 million in 2018, would increase to approximately $9 million if voters passed the ballot measure.
The median home value would see an annual district property tax increase from $6.03 to $11.96. For homes valued at $300,000, district taxes would go from about $5 to $10 per year.
Marti Whitmore, who is Ouray County’s representative on the district’s board, said, “I tend to believe that this is a very reasonable proposal. On my house, it would result in a tax increase of less than $11 per year. I think it is important for the river district to be able to have funds to assist Western Slope communities in developing and ensuring adequate water supplies for all uses—agriculture, municipal, commercial/industrial — as well as non-consumptive uses such as recreation, fishing, boating or rafting, and so on. We will benefit from this increased support from the river district in Ouray County.”
Mueller is recommending that 20 percent of the property tax increase go toward remedying budget shortfalls for staffing and operations. His proposal is for the other 80 percent to fund projects through partnerships primarily with local governments and water users groups that manage agricultural irrigation supplies.
“We are looking for projects where we can partner with multiple sectors of the community; agricultural, municipal, recreation and others to find projects that work well for all of them,” he explained. “We have identified projects that have those types of attributes in all 15 of our counties to help the communities become more resilient in times of change.”
He said one good use of the new project fund would be a water storage or augmentation plan in Ouray County, which proposes building the Ram’s Horn Reservoir in the Uncompahgre National Forest in the Cimarron Mountains and a pipeline from Cow Creek to Ridgway Reservoir. The project would take much more than the estimated $80,000 per year in property taxes that would come from Ouray County if the ballot measure passes…
The district board, which is made up of one appointed representative from each of its 15 counties, heard the property tax proposal at its January meeting but took no action. The board asked staff to bring more information to its next quarterly meeting on April 21-22, where the board is likely to vote on whether to put the question on this November’s ballot. The meeting will be at the Colorado River District building at 201 Centennial St. in Glenwood Springs, and is open to the public.
Here’s a guest column from the Eagle River Watershed Council that’s running in the Vail Daily:
Dear ERWC: Winter is certainly going to return, but with a warm week behind us I’m thinking about spring cleaning and one of the items on my list is the adventure vehicle. What is the best way to clean my truck with the least impact on our rivers? — Mike, Eagle
Mike: Some might say the answer is to wash at home, where one has direct control regarding water usage and detergent choice. However, when it comes to the health of our watershed and overall water quality, that’s actually not recommended.
Washing a car at home can be more economical and allows time to get into the nitty-gritty details, but what it doesn’t allow for is the capture of contaminated water.
Modern and established car washes adhere to strict standards set in place by the Environmental Protection Agency and Colorado Department of Public Health and Environment. Through the Clean Water Act, they’re required to capture the water running off your car — full of phosphates, oils, dirt and other chemicals — and route it to treatment facilities or approved drainage facilities.
This allows for all of those chemicals to be neutralized and removed before entering the waterways. The drains at the end of driveways are for stormwater and they flow directly into our rivers and streams with no treatment whatsoever.
Water quantity should also be taken into consideration, especially given that we are in the arid west and water is a precious resource. Commercial car washes use 60% less water on average compared to washing a car at home, making them far more efficient at removing the six months of road dirt and magnesium chloride caked on your SUV.
Here in Colorado, commercial car washes are able to use “reclaimed water” or wastewater that has been treated to a safe level but can’t be used for drinking water. This reduces the stress on drinking water supplies and reduces the energy used for treatment.
There is an appropriate way to wash your car at home, should you decide that is still best for you. The EPA recommends the use of biodegradable detergents that are water-based and free of phosphates. It is also a best practice to wash vehicles on a lawn or similar surface. This allows for the contaminants to filter out through the ground before entering the streams — and hey, this waters your lawn too. Additionally, it is recommended to use some form of spray control, such as a pressure washer or other hose attachment to reduce water usage.
Are you curious about critters around the rivers? Do you want to know how snowpack is measured? Do you have questions about our watershed? The Watershed Council has answers! You can email dilzell@erwc.org with your questions – and they might just be featured in articles like this one in our new series: What in the Watershed?
James Dilzell is the Education & Outreach Coordinator for Eagle River Watershed Council. The Watershed Council has a mission to advocate for the health and conservation of the Upper Colorado and Eagle River basins through research, education, and projects. Contact the Watershed Council at (970) 827-5406 or visit erwc.org.
March 2006, 14 years ago, was my first Metropolitan Board meeting as General Manager. It was one of the most important and special days of my life. Today, with more than a little sadness, I would like to announce my intent to step down as General Manager at the end of this year.
I have discussed my plans with Chairwoman Gray and we agree that it is important to the district to ensure a smooth succession. Accordingly, I am announcing my plans at this time to provide the Board with sufficient time to run a thorough recruitment and interview process.
I look forward to working closely with Chairwoman Gray and the Board on a successful transition to new leadership over the remainder of this year. Generally, it has taken about six months to recruit someone for the General Manager position. Assuming a new General Manager is brought on by late fall, I will make myself available to assist her or him in the transition process through the end of the year.
It has been an honor and a privilege to serve as Metropolitan’s General Manager. Metropolitan is the premier public sector water utility with an outstanding work force that is second to
none. People always tell me how impressed they are with Metropolitan’s staff. I consider myself so fortunate to have had the opportunity to work with such a talented workforce.
I want to thank Chairwoman Gray for her strong leadership and personal support for me. She is the right leader at the right time for Metropolitan. I would like to thank the Board for always putting Metropolitan first in its thinking and for making the sound decisions that will ensure water supply reliability for Southern California for generations to come. I want to thank the member agencies and my water colleagues for their friendship and guidance. And most of all, I want to thank all of the employees at Metropolitan for making these past years so richly rewarding on both a personal and professional level. It has been my pleasure to work with each and every one of you.
We have quite a lot to accomplish the rest of this year with regards to Delta conveyance, the State Board’s Water Quality Control Plan update, our Integrated Resource Plan 2020 revision, a review of our rate structure and critical decisions on our Regional Recycled Water Project. And I intend to work hard with everyone to make progress on all of these issues and more in the coming year.
@mwdh2o scouting team looking for where to site our Colorado River Aqueduct intake on the Colorado River. Boats powered w Model T motor! — Jeffrey Kightlinger via Twitter. I will miss the photos that Mr. Kightlinger published from the Metropolitan archives.
I asked Mr. Kightlinger about the genesis of his Twitter handle 8thGenCA. Here’s his response.
Click here to read the current assessment. Click here to go to the NIDIS website hosted by the Colorado Climate Center. Here’s the summary:
Summary: March 10, 2020
Mostly dry, warmer than average conditions prevailed across the IMW over the last week. Some exceptions include northeastern Colorado where they received 0.25-1.00” of precipitation with the greatest accumulation over Weld County. Northern San Juan basin and southern Gunnison basin did see about 0.10-0.25’ with some areas seeing up to 1.00”, however this is low for early March and SPI values are continuing to show degrading conditions in this area. Northern Utah also received decent precipitation, northern Cache county received 1.0-1.50” of precipitation over the last week.
The high elevations of the IMW by and large had a drier week than normal for early March. Snowpack is still strong through most of the IMW with a few stations already over 100% of normal peak values such as Upper Colorado River Basin and the Yampa and White River Basins. However, recent dryness has led to a regression in snowpack values for the southern portion of the region. The San Juans in Colorado have regressed to 88% of average for this point in the season. Snowpack is also below normal in Arizona and western New Mexico. The Colorado Basin River Forecast Center is anticipating low cumulative runoff numbers for this spring and summer from the San Juan Basin southward due to low snowpack and very low soil moisture prior to the start of the cold season. Snowpack numbers are above normal east of the Continental Divide.
Surface water supplies are in generally average to above average conditions for small-to-medium reservoirs across the IMW. This is thanks in large part to a high snowpack in 2019. The giant exceptions are Lake Powell, and Lake Mead, which have been consistently lower than normal for years. Powell and Mead would need an anomalous cool, wet period spanning multiple years to return to levels seen in the 1980s and 90s.
Grasslands east of the Continental Divide are seeing mixed surface conditions, but things have been trending drier. According to the NLDAS NOAH model from nationalsoilmoisture.com, northeastern Colorado is seeing widespread dry topsoils and root zone soils. This is adversely impacting winter wheat and rangeland condtitions prior to greenup. Soil moisture in northeast Wyoming and Utah are in better condition.
Dry weather is in the forecast for much of eastern Colorado but the remainder of the UCRB is forecast to see decent precipitation in the next week. The Tetons, Uintahs, and western Colorado Rockies are forecasted to receive 1.00-3.00” of moisture in the week to come. The 8-14 day outlook will be important to keep an eye on. NOAA’s Climate Prediction Center currently favors below average temperatures and an increased chance of above normal precipitation over the IMW region with highest probability over southern Utah, southern Colorado, all of Arizona and northern New Mexico. Given the persisting drought conditions, and deteriorating snowpack, in the four corners region, a widespread precipitation event over this area would be valuable.
FromThe High Country News [March 10, 2020]: (Anna V. Smith):
The Colorado River Basin is the setting for some of the most drawn-out and complex water issues in the Western U.S. In 2019, the Colorado River Drought Contingency Plan — a water-conservation agreement between states, tribal nations and the federal government for the basin, now in its 20th year of drought — passed Congress. This year, it goes into effect.
2020 will also see the start of the renegotiation of the Colorado River Interim Guidelines. The guidelines, which regulate the flow of water to users, were created in 2007 without tribal consultation and are set to expire in 2026. The 29 tribal nations in the upper and lower basins hold some of the river’s most senior water rights and control around 20% of its annual flow. But the tribes have often been excluded from water policymaking; around a dozen have yet to quantify their water rights, while others have yet to make full use of them. Most of the tribal nations anticipate fully developing their established water rights by 2040 — whether for agriculture, development, leasing or other uses. Drought and climate change are still causing shortages and uncertainty, however. Already, the Colorado River has dropped by about 20%; by the end of this century, it could drop by more than half.
Daryl Vigil, water administrator for the Jicarilla Apache Nation, has pushed for increased tribal participation in Colorado River renegotiation discussions. Courtesy of Bob Conrad via The High Country News
High Country News spoke with Daryl Vigil (Jicarilla Apache, Jemez Pueblo and Zia Pueblo), water administrator for the Jicarilla Apache Nation. Vigil, the interim executive director of the Ten Tribes Partnership, helped co-facilitate the Water and Tribes Initiative, coalitions focused on getting increased tribal participation on Colorado River discussions. Those efforts are critical, Vigil says, “because left to the states and the federal government, they’ve already proven that they will leave us out every time.”
HCN and Vigil spoke about “the law of the river” — the colloquial term for the roughly 100 years of court cases, treaties, agreements and water settlements that govern the Colorado — as well as tribal consultation and climate change.
This interview has been edited and condensed for length and clarity.
High Country News: Sometimes it can be hard to really understand the core value of water, because it gets so caught up in things like policies and laws and bureaucratic language. Could you boil it down a bit and explain, at the core, what’s so important about this?
Daryl Vigil: Through the Water and Tribes Initiative (in 2018), we did over a hundred interviews of all the major stakeholders in the basin: states, water providers, tribes, NGOs, conservation groups. And it was pretty amazing, to find out that when you talk to all these folks, almost universally they’re all committed; they have a personal relationship to the river as a living entity that needs to be sustained. And so there’s two different mindsets looking at ’07 guidelines and some of the policy that’s been created around the river. One really looks at the Colorado River as a plumbing system, getting water to people who need it, versus the other end of the spectrum — when you start to look at tribes and others who have similar values, who look at it as a living entity, who look at it as an entity that provides life. And so we started to try to articulate traditional, cultural values and integrate that into current policy so that people can understand. Because we know most people want to see a healthy, sustainable Colorado River, but they also have their constituencies that they protect. And so, how is it that we bridge that divide? Because people really do care about the basin, and they really do want healthy environments and healthy ecosystems. And so that’s proven part of the conversation that we were having — that the next set of guidelines absolutely needs to be able to capture not only the water-delivery issues that already are at the forefront, but really start to address the cultural, environmental, traditional values of the Colorado River and integrate that into the next set of planning. Because if we don’t, this system cannot be sustained.
HCN: How does climate change figure into the discussion?
DV: We’re already seeing the impacts. And I think that’s something that absolutely has to be considered in the planning of the future, because right now — with 41 million people in the basin — as of 2010, the imbalance between supply and demand is already a million acre-feet. It’s projected, according to the basin study, to be 3 million acre-feet by 2060. We continue to act surprised when something new comes about in terms of a fire or a flood or an incredible drought. We’re making an impact on this planet, and it’s not a good one. That’s where, with the Ten Tribes Partnership, (we’re) really trying to make sure that we integrate those traditional, cultural values and spiritual values that the tribes have for the river as we move forward. Because if we’re not going to address it, it looks pretty catastrophic to us. And so I think, when we start talking about climate change, absolutely pushing to make sure that we’re thinking about a mindset of how we fit into nature, rather than nature fitting into us.
HCN: These kinds of discussions, compromises and negotiations can often, especially around water in the West, go on for decades. I’m curious what gives you momentum to keep working at it and putting so much energy into it.
DV: A few different things. You know, those hundred-plus interviews that we did, we got to know people on a real personal basis. We got to know who they are and their commitment — many of these people have had decades working in the Colorado River Basin and doing the best that they could, given the structure. And everybody understands and agrees that the current system is not sustainable, and it doesn’t work; it’s not inclusive of the voices that need to be included into this process. And so that gives me great hope. And then you see things like the pulse flow, where they got water all the way to the Sea of Cortez. And to look at the faces of those Mexican kids who had never seen water in the Colorado River in their whole life come out, and just the wonder and the magic in their eyes of seeing what water does.
And then we just recently had our second basin-wide workshop and gathering up in Phoenix. We had a hundred-plus of the major stakeholders: states, feds, water providers, tribes and four tribal chairman present at this particular meeting, which is just huge, a bunch of people all in this room all talking about their joint commitment to the river. It’s moving to me because, I mean, I think that’s what it’s going to take.
HCN: Every tribal nation is different, but how might a tribal nation view water similarly or differently than a city or a state or the federal government in terms of water and management?
DV: That’s the thing that we’re really trying to create awareness of. Because in the Colorado River Basin alone, you have 29 distinct sovereign entities — geographically, culturally, languages, and mindsets and traditions and culture in terms of how they think about the river. A lot of it’s really about the same, but in terms of the reverence and the spiritual connection that most tribes have, they look at it in different ways. For instance, invasive species of fish: You get tribes who are really aggressive about wanting to remove them because they’re not part of the natural environment that was always there. Then you get other tribes who are just like, eh, who cares and it’s not on their radar. And that’s why it’s important that a conversation about the next set of guidelines for the Colorado River has to include all 29 tribes — in terms of at least the opportunity to participate and at least having the information to determine whether they want to or not.
HCN: What are some big things that you would like people to better understand about the discussions around water in the Colorado River Basin?
DV: I would like them to understand, from a tribal perspective, the incredible role that tribal water already plays in the basin. The other thing I would like people to understand is that this current law of the river is not sustainable. At some point in time there’s collapse. And I think if we don’t address it quickly, that collapse could happen sooner than later. And I really would like to have them understand that the way that the law of the river is structured — upper, lower basins, and how they’re managed differently, and how there’s different requirements and how states are engaged — it’s really complex and doesn’t make any sense, and, ultimately, I don’t think it’s going to get us where the broader consensus wants us to go in terms of a healthy, sustainable river, and still provide water to all living creatures and plants in the basin.
HCN: Specifically, what is it that tribal nations are bringing to the conversation that was lacking in the 2007 agreements?
DV: I think absolutely a point of view about the sacredness of the river that most people really do share, whether they’re tribal or not. And then the other thing is the unique role that tribes are going to continue to play in the West — the large land areas and our resource development and how we move forward. It creates this mindset, in my mind, of building a pathway of who we want to be in the future. But a huge thing, too, is tribes bring certainty to the table. You know, it’s like, wow, what if we negotiated together about being able to move water where it needs to move, and work from a standpoint of collaboration and need rather than protect, defend and win, lose.
HCN: That’s a good point. Because that’s how water is so often talked about, as somebody versus somebody.
DV: And I think that’s what the law of the river does. It’s contentious, and it automatically puts you in a position to protect and defend. And if that’s the foundation we’re operating from, what does that get us? It’s just going to get us this recurring, vicious cycle that we’ve been stuck in. The work that we’re doing at the partnership and Water and Tribes Initiative hopefully has broader implications in terms of tribal sovereignty, and looking at tribal sovereignty from the standpoint of an opportunity to create your future.
Anna V. Smith is an assistant editor for High Country News. Email her at annasmith@hcn.org or submit a letter to the editor. Follow @annavtoriasmith.
Many Indian reservations are located in or near contentious river basins where demand for water outstrips supply. Map courtesy of the Bureau of Reclamation.

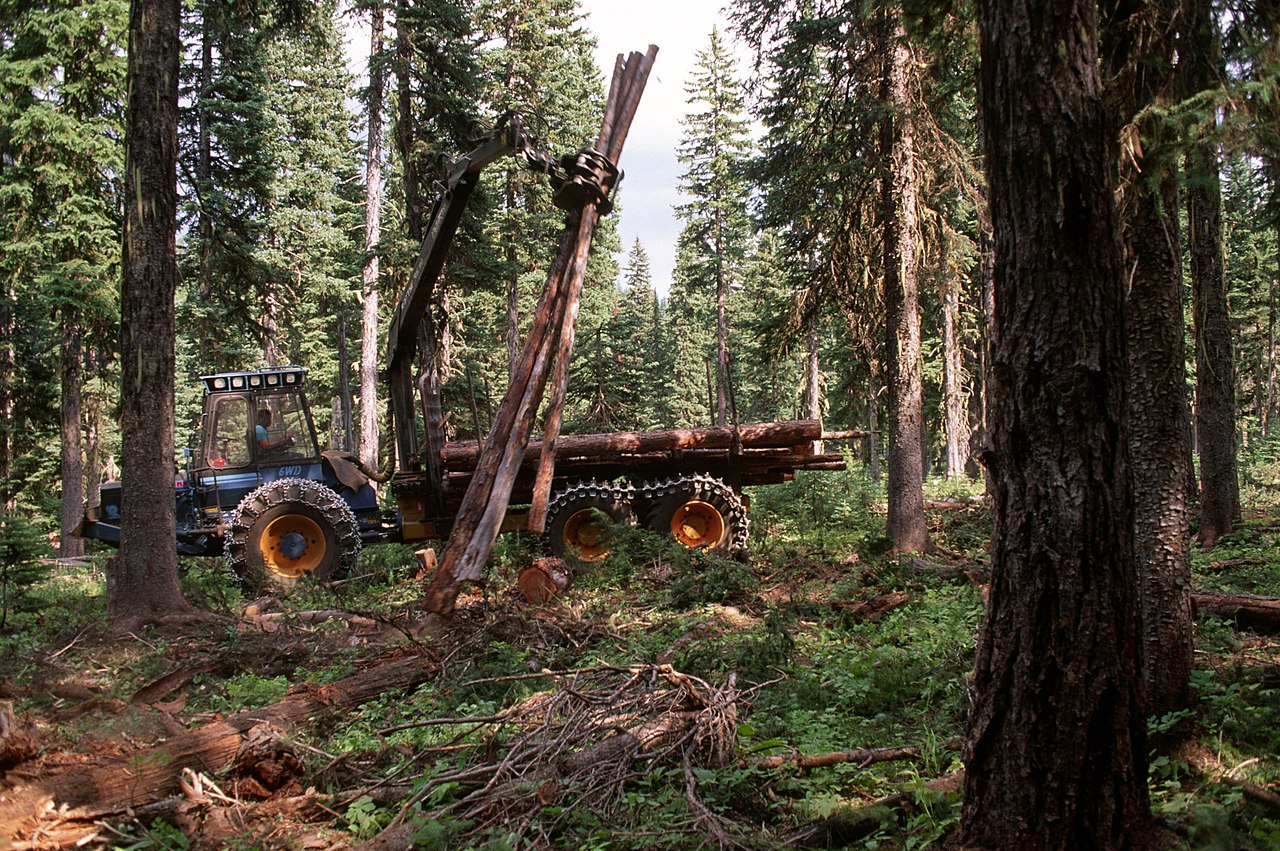
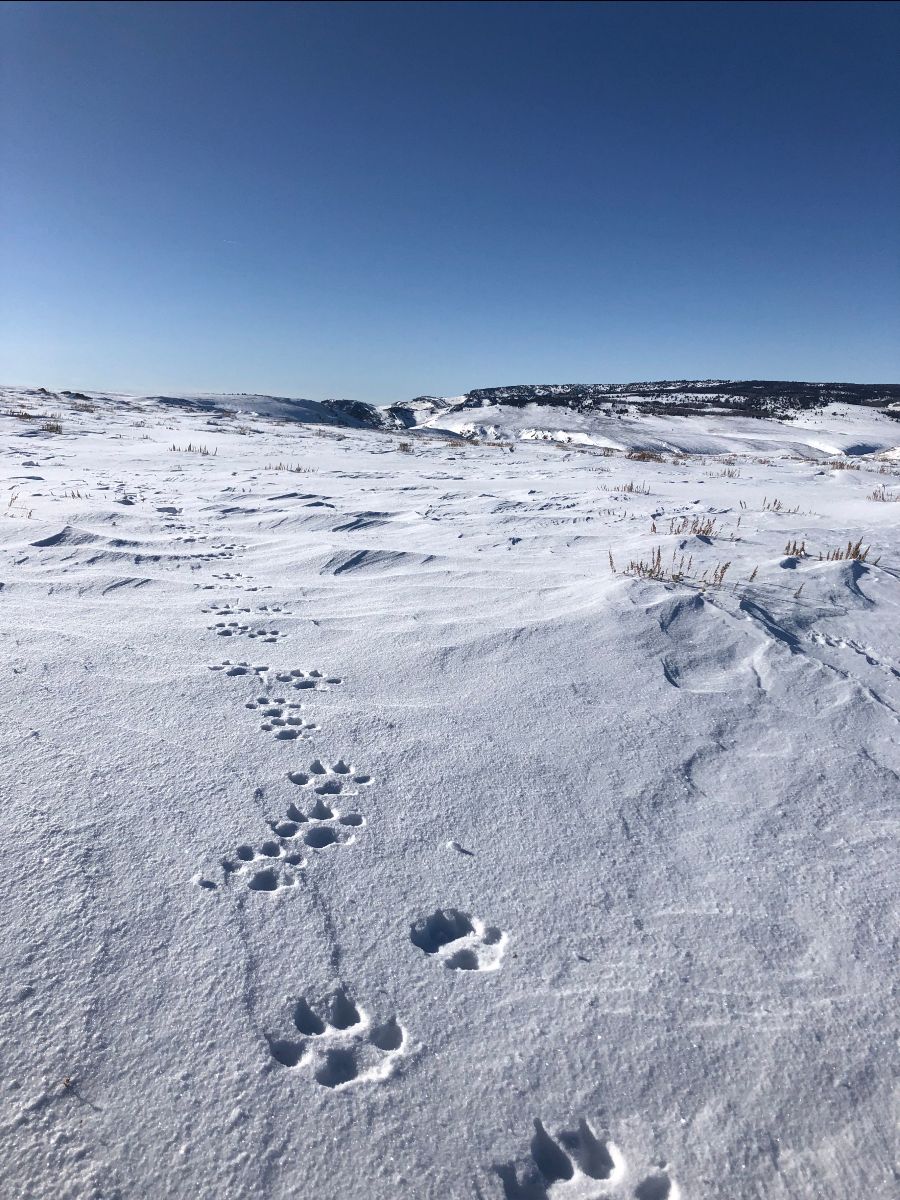

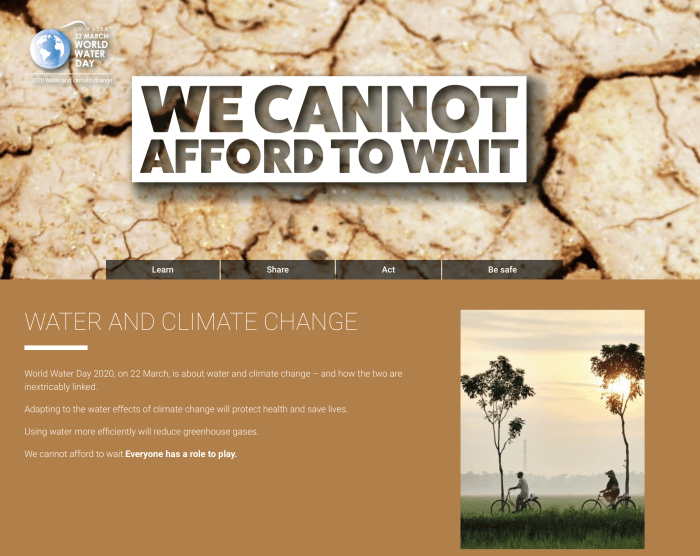


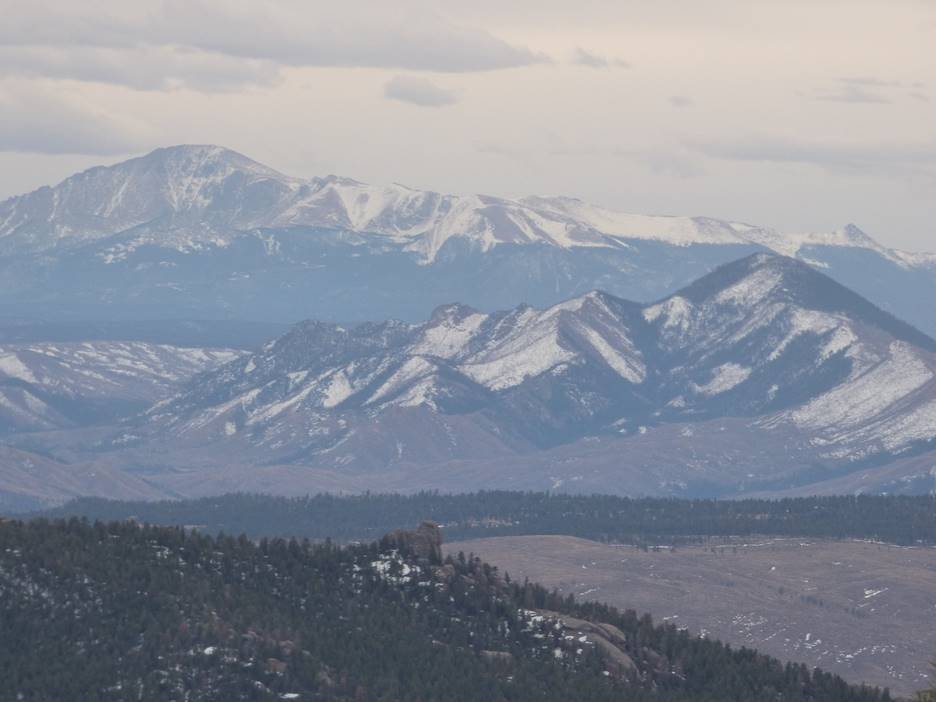
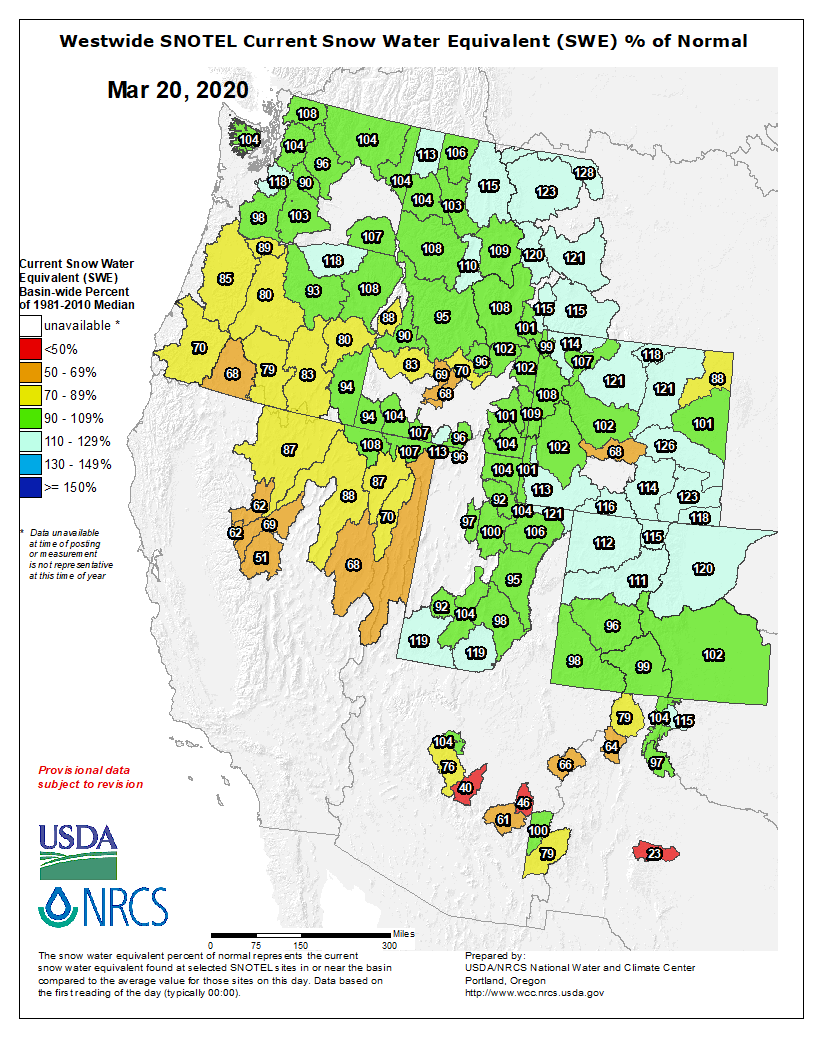
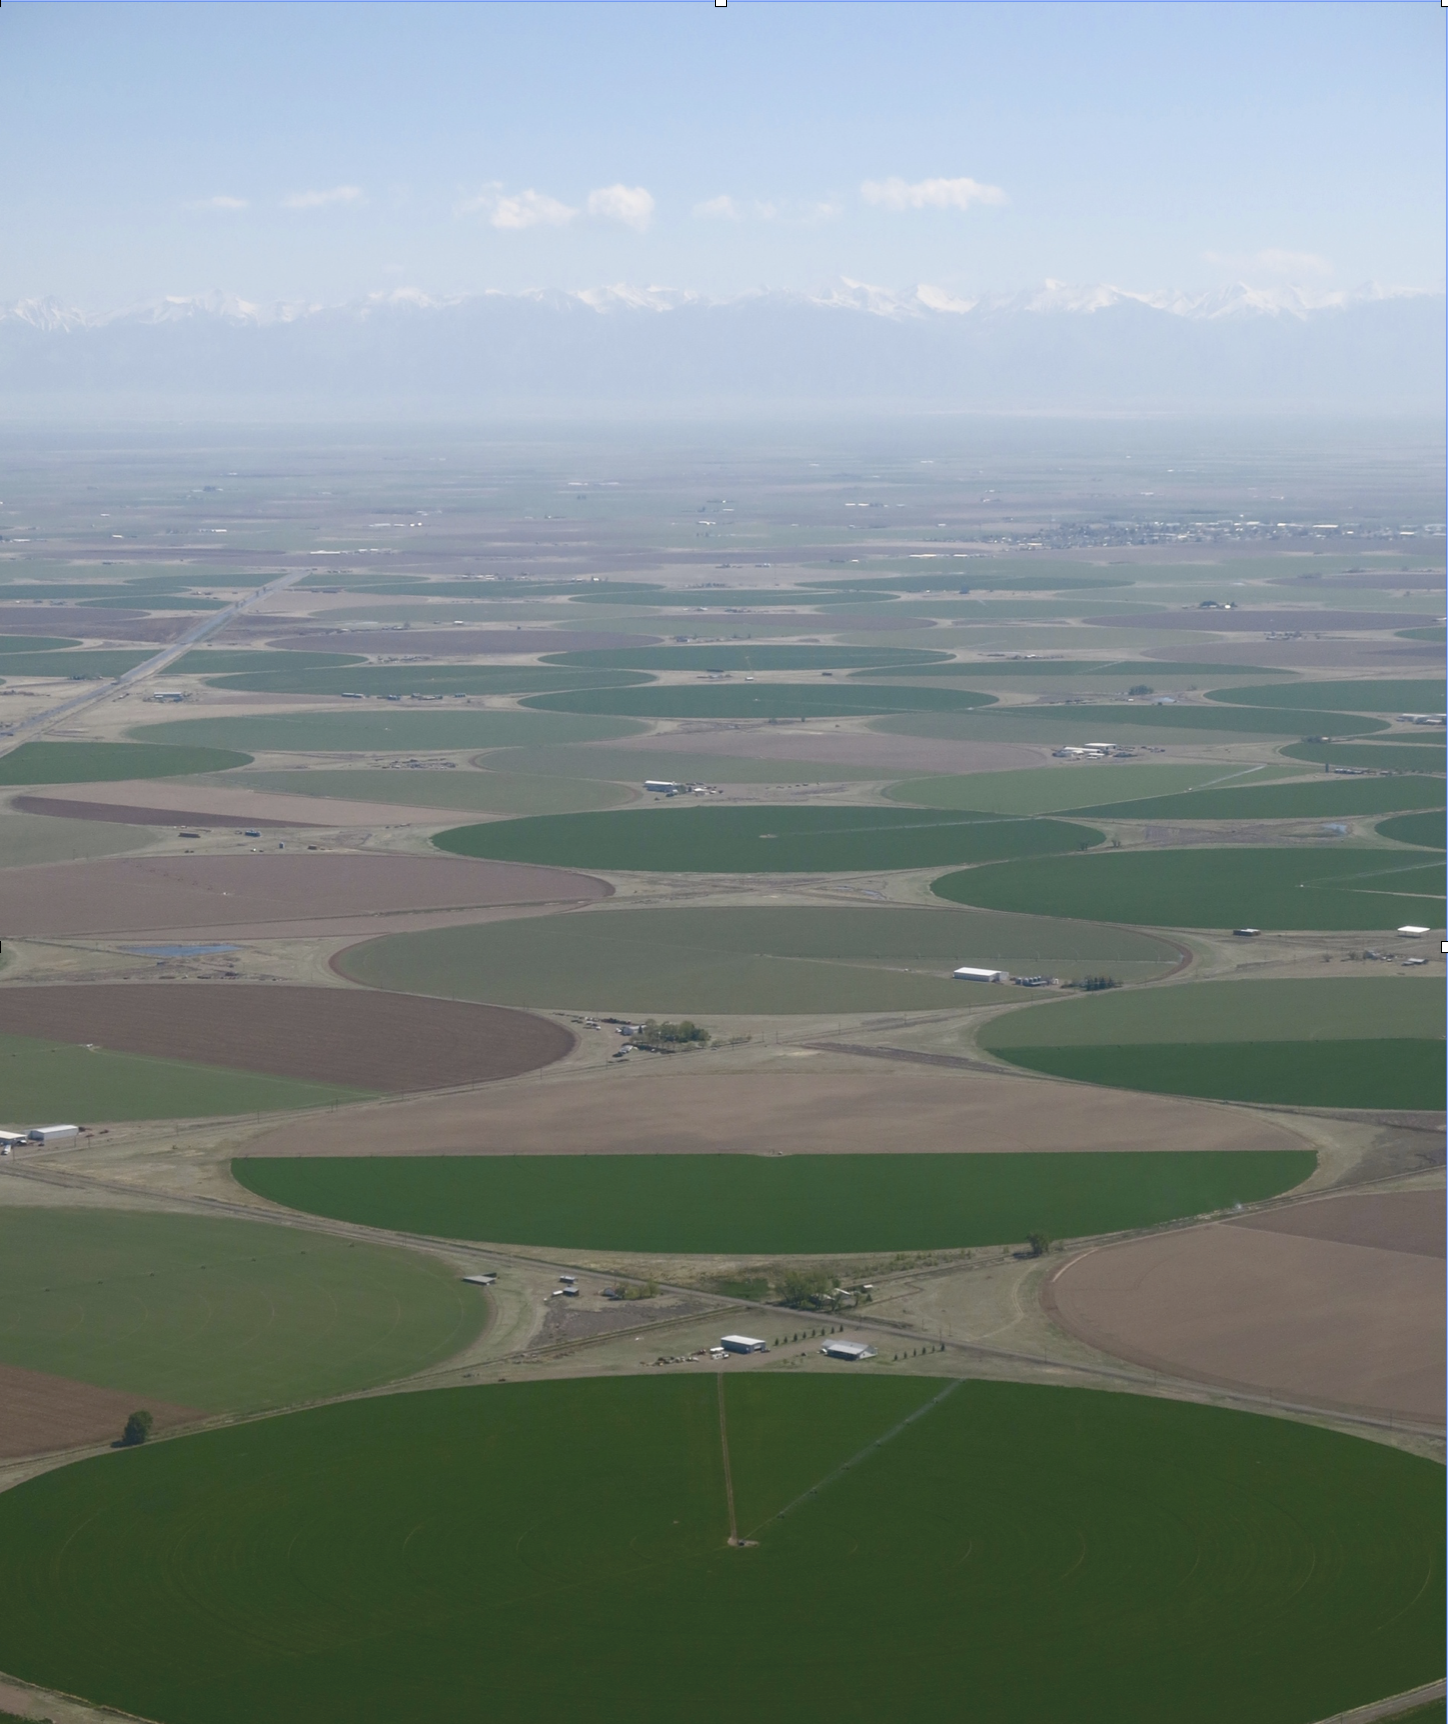
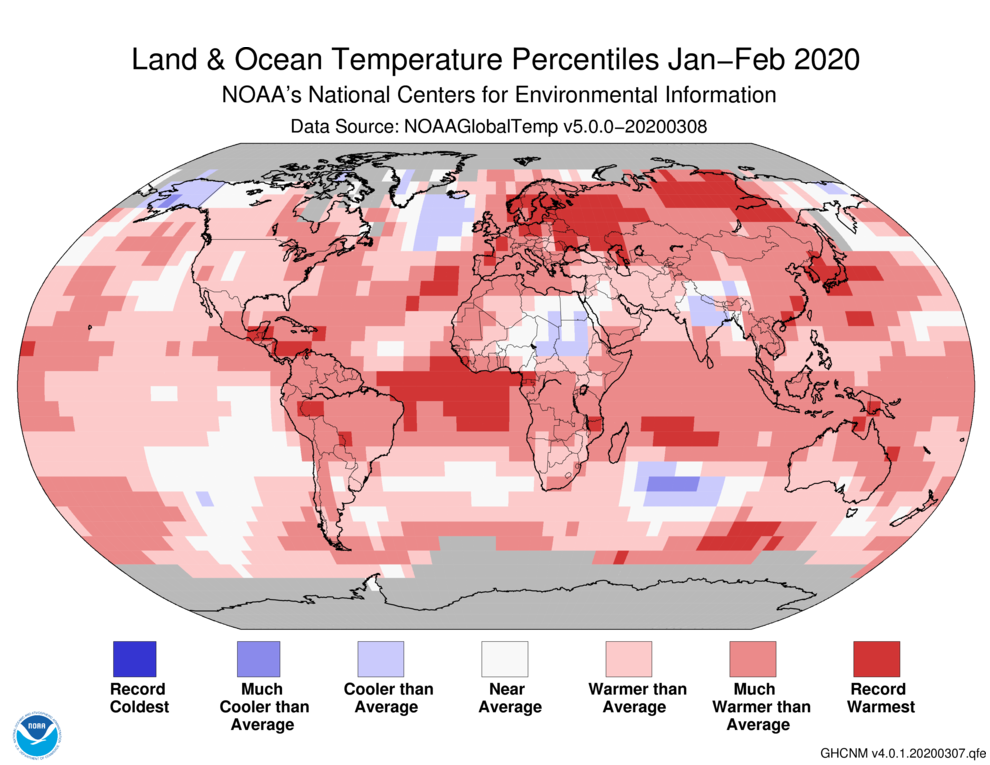
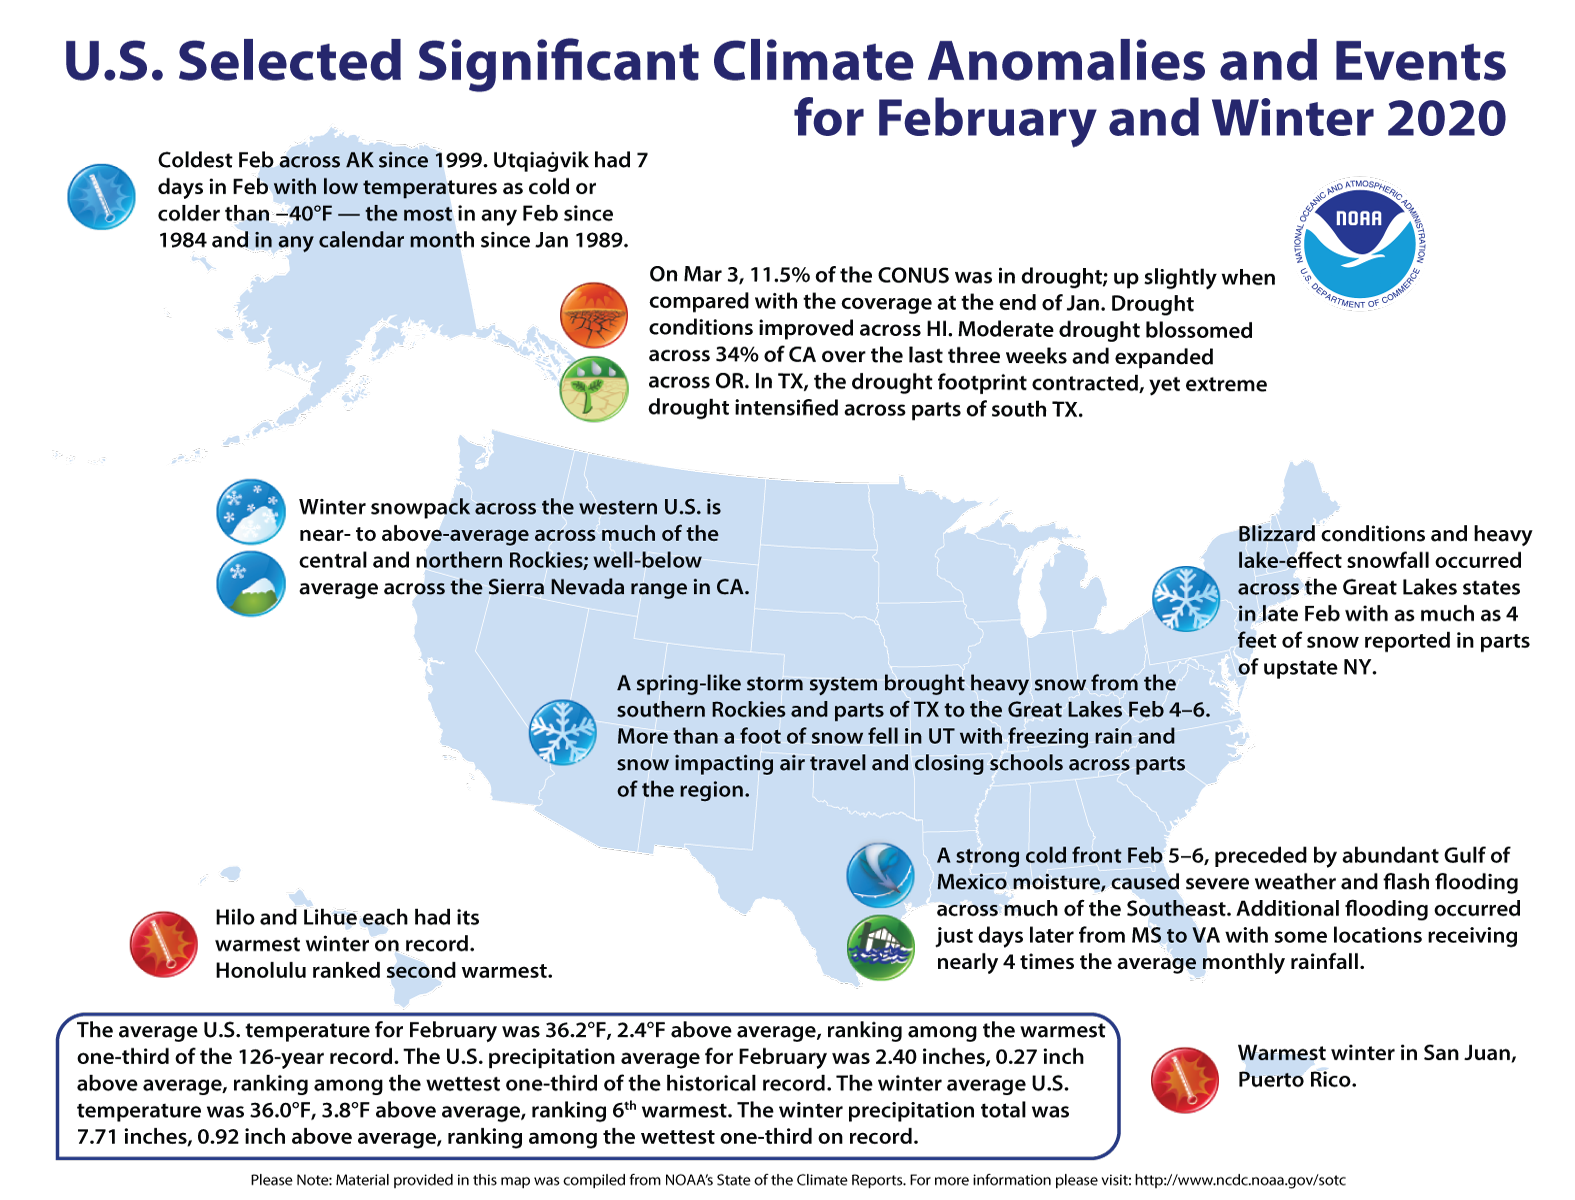
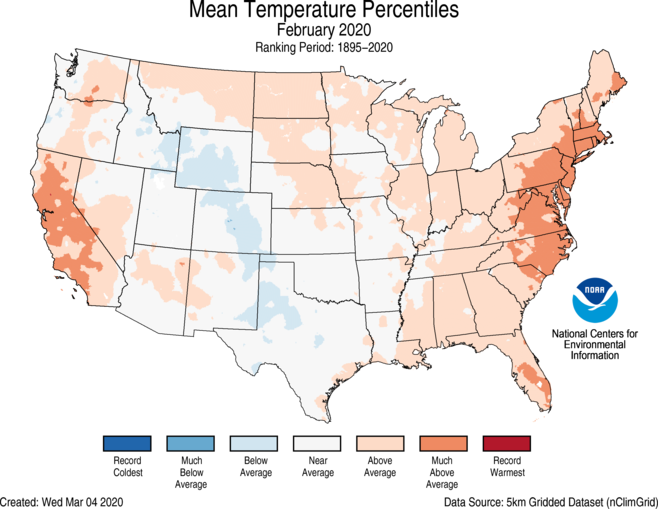

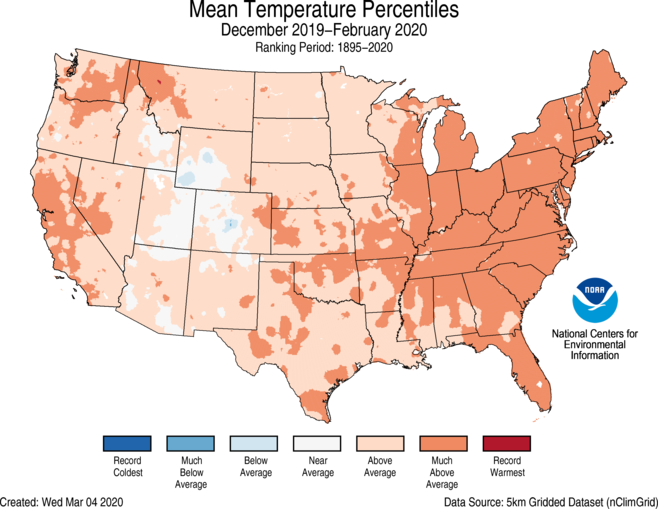
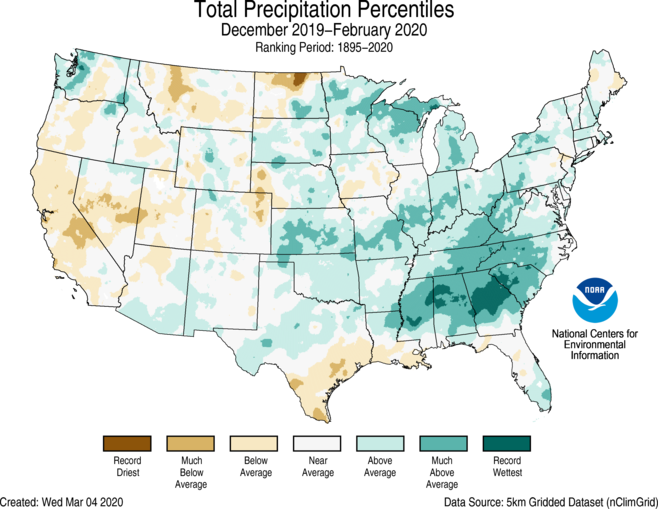
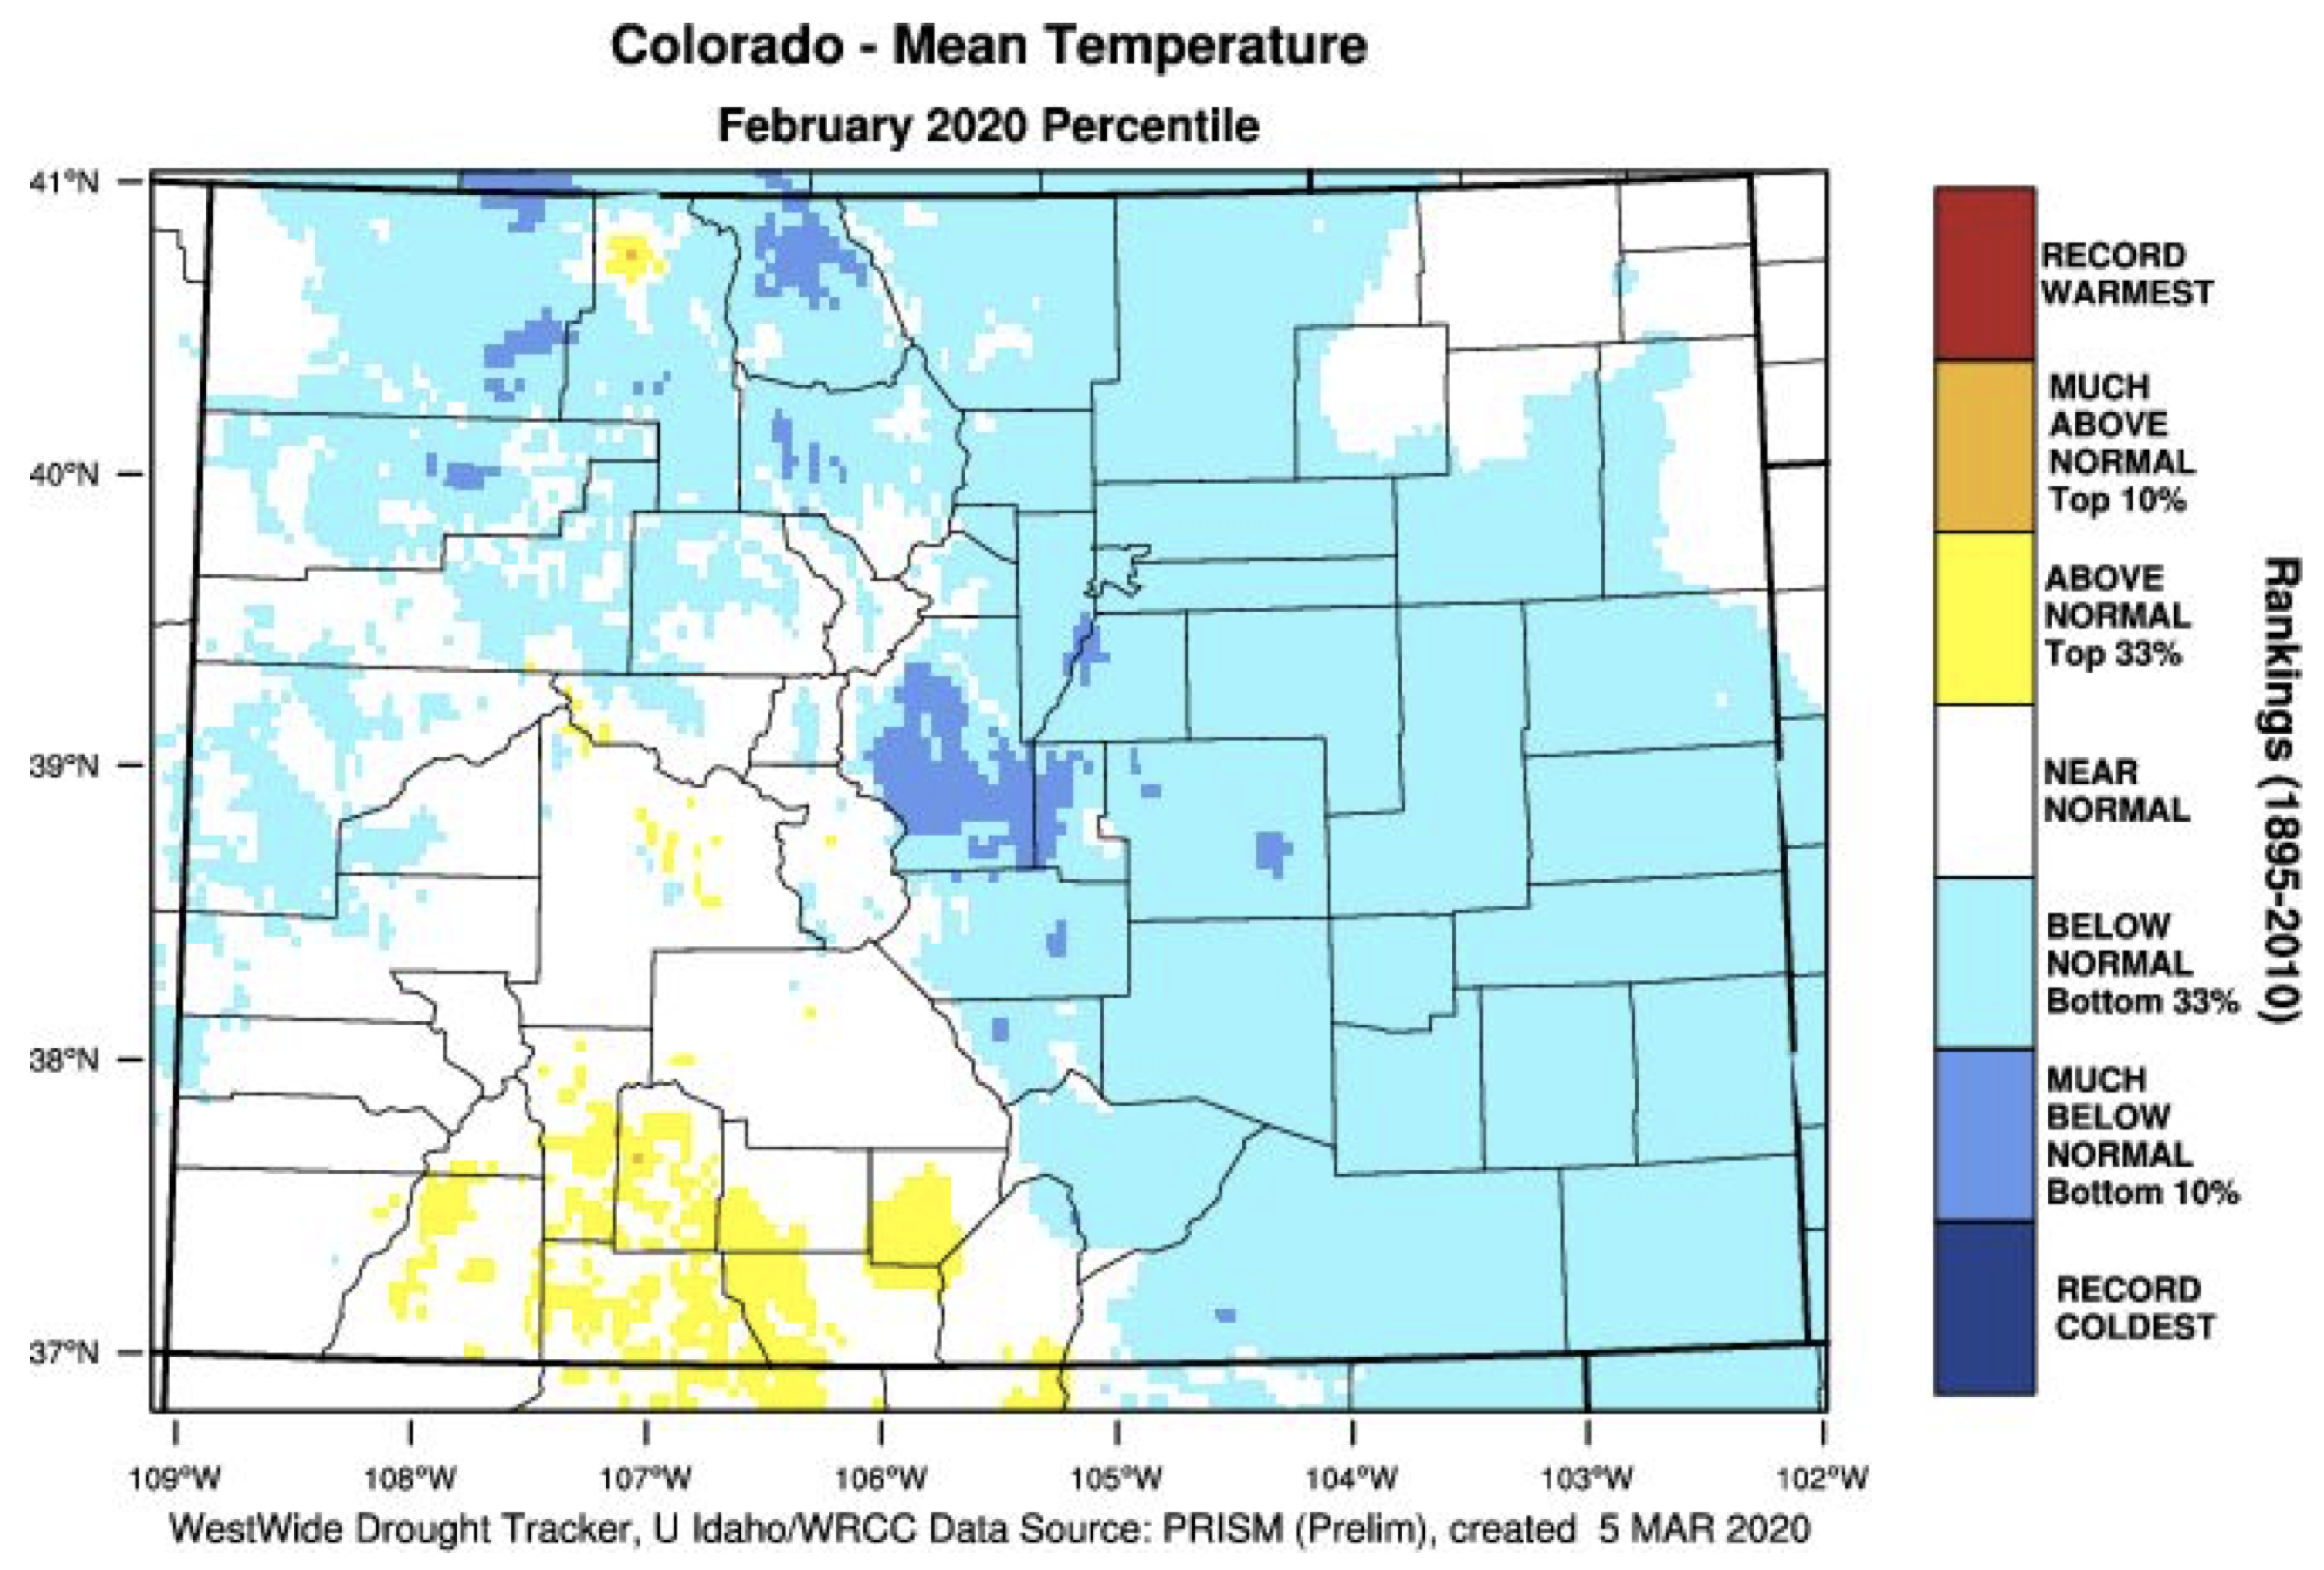
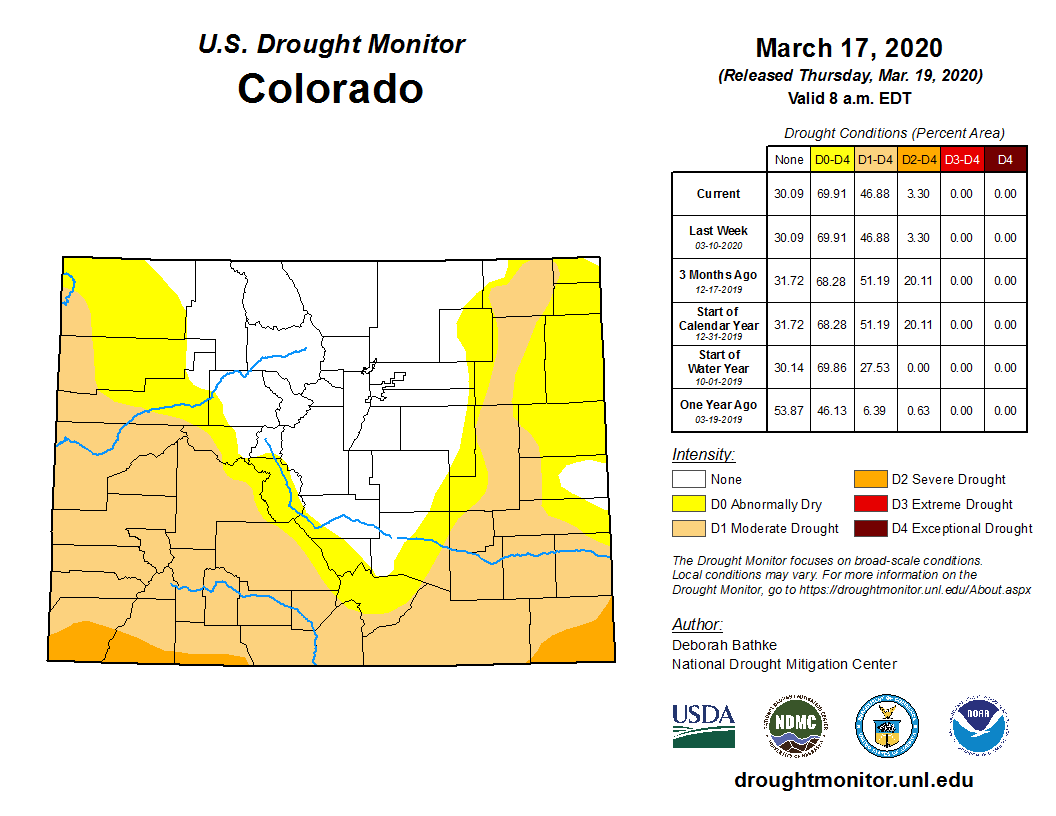

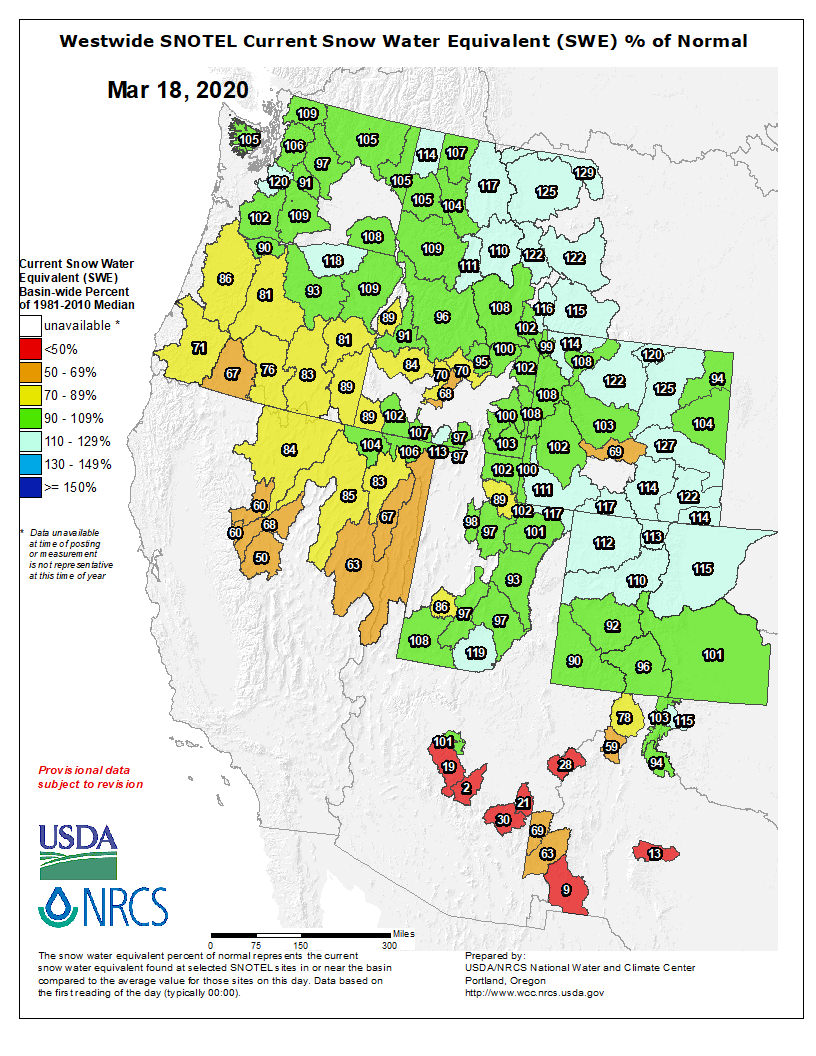

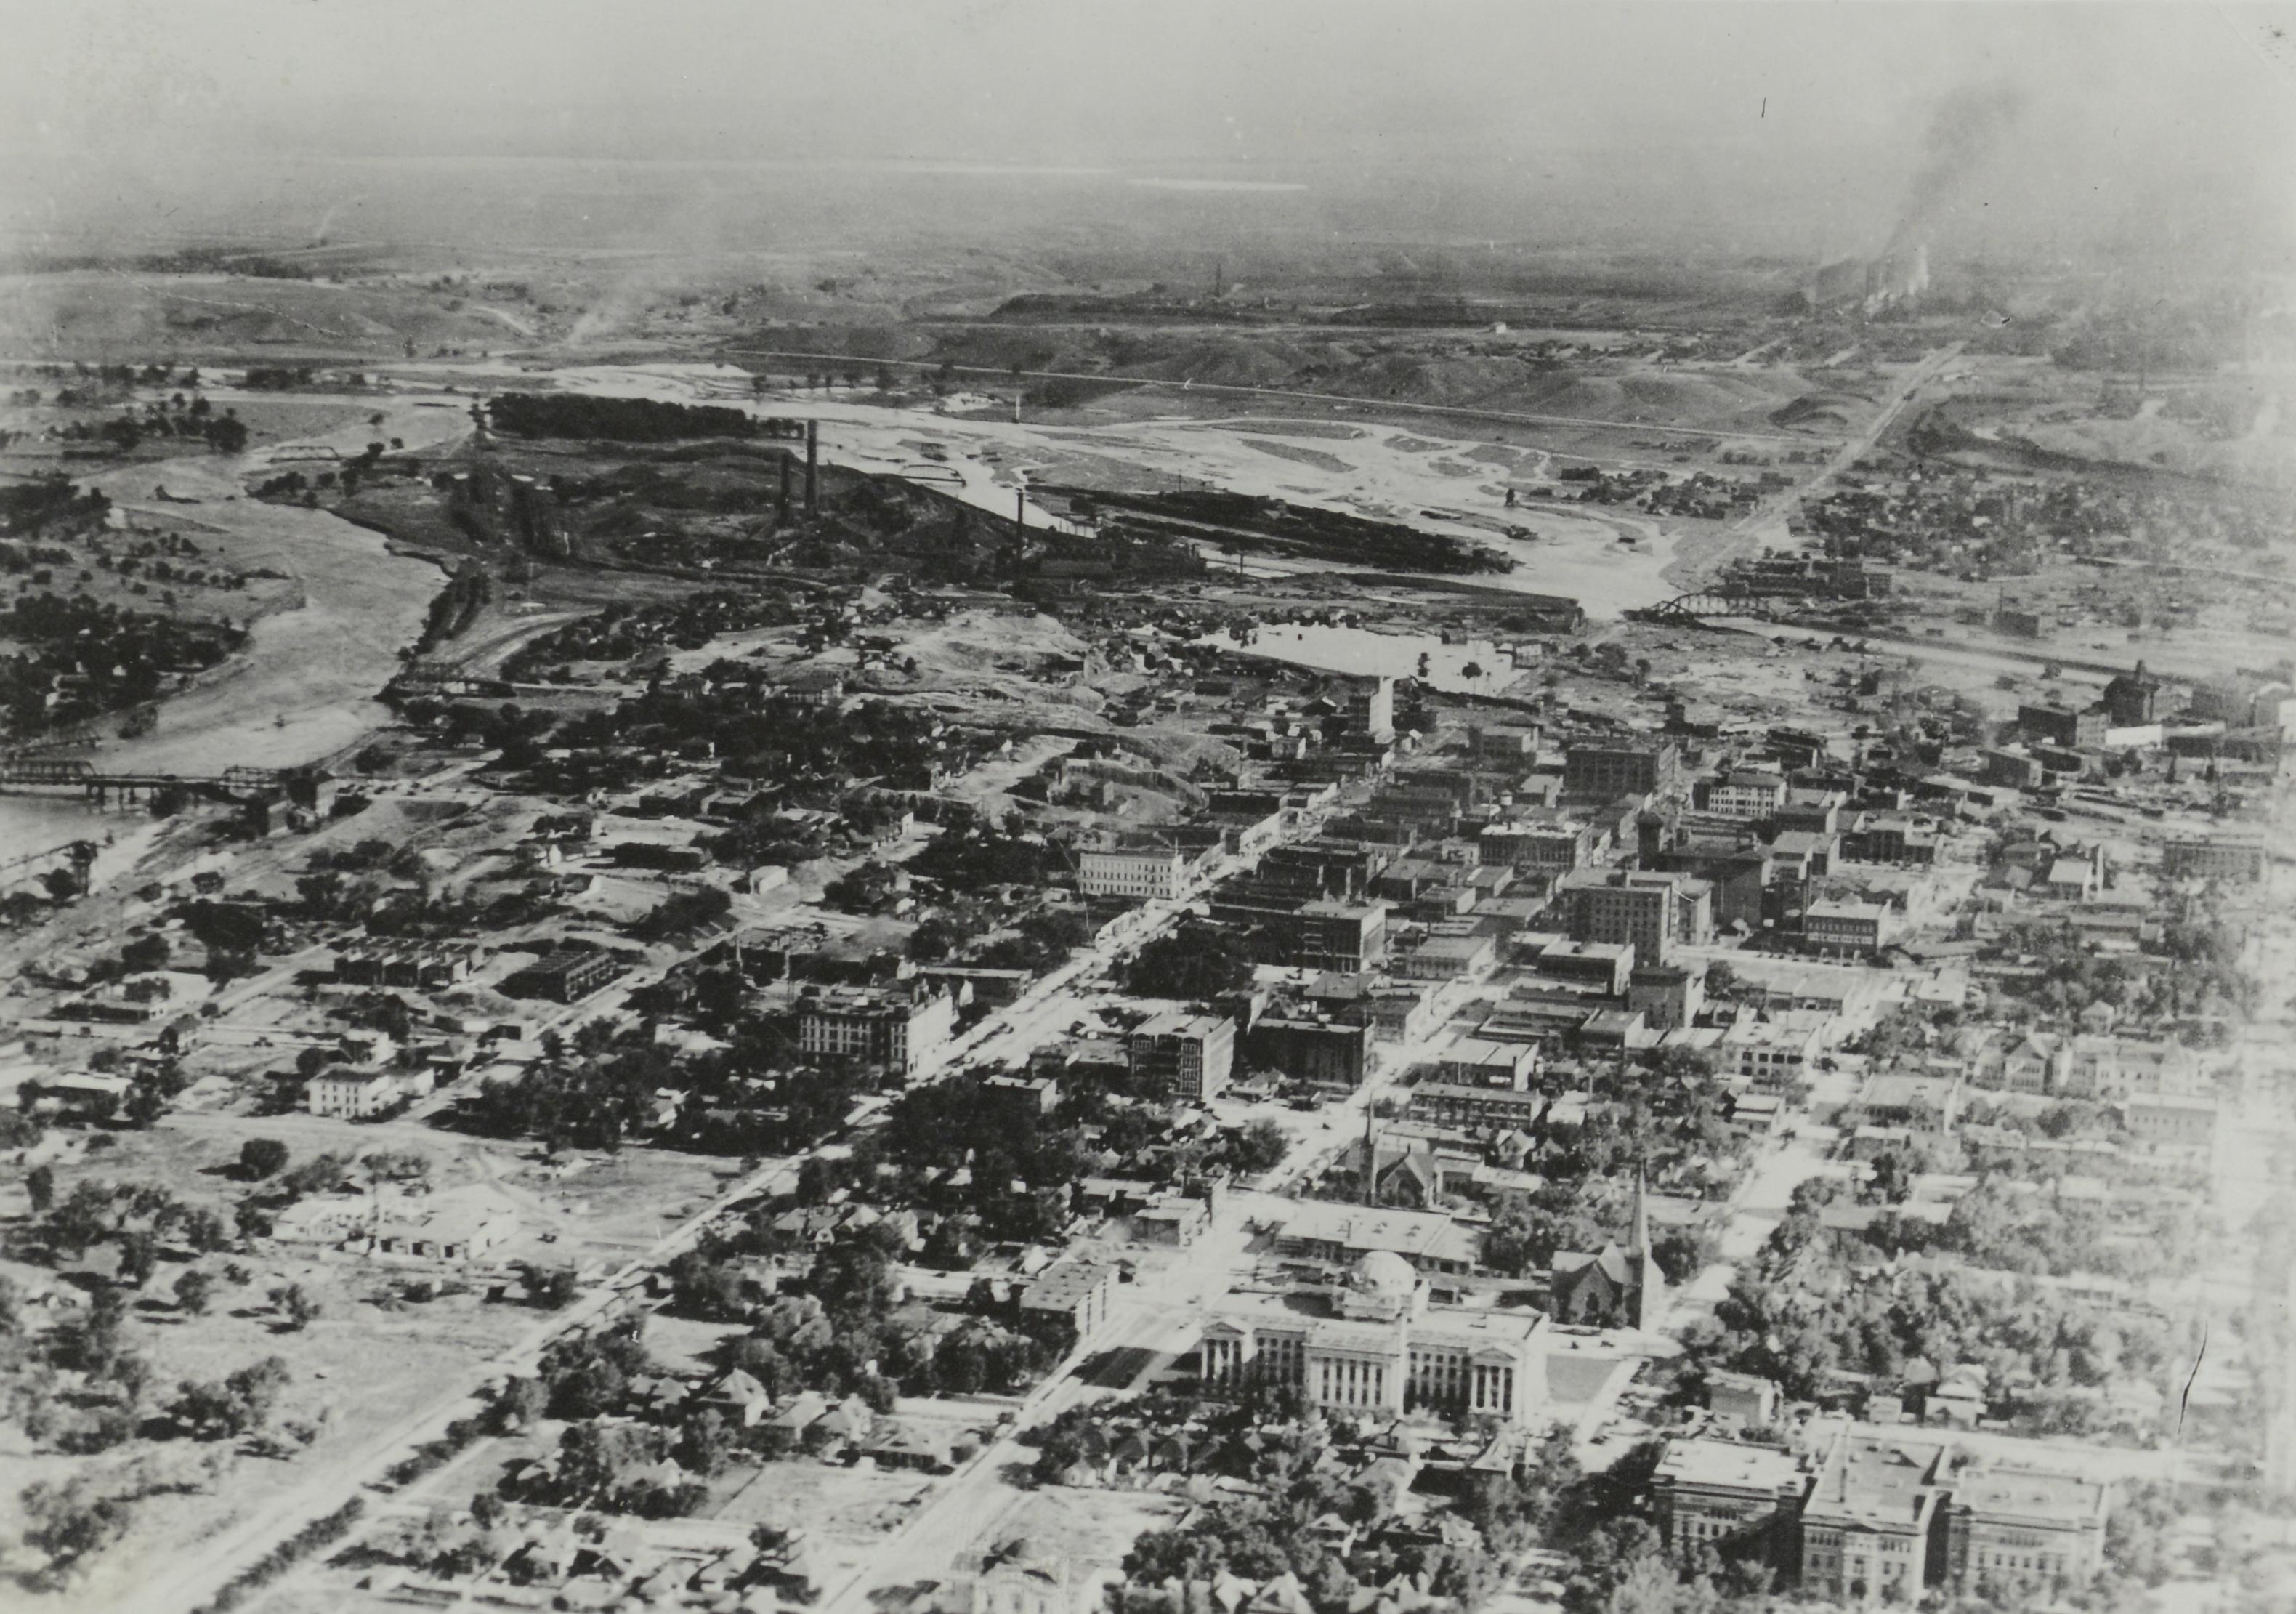
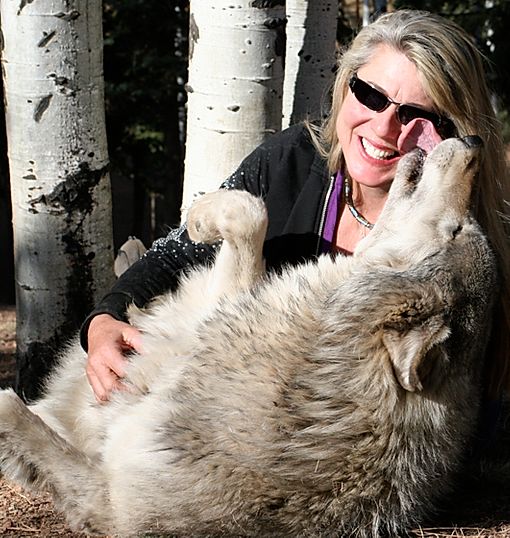
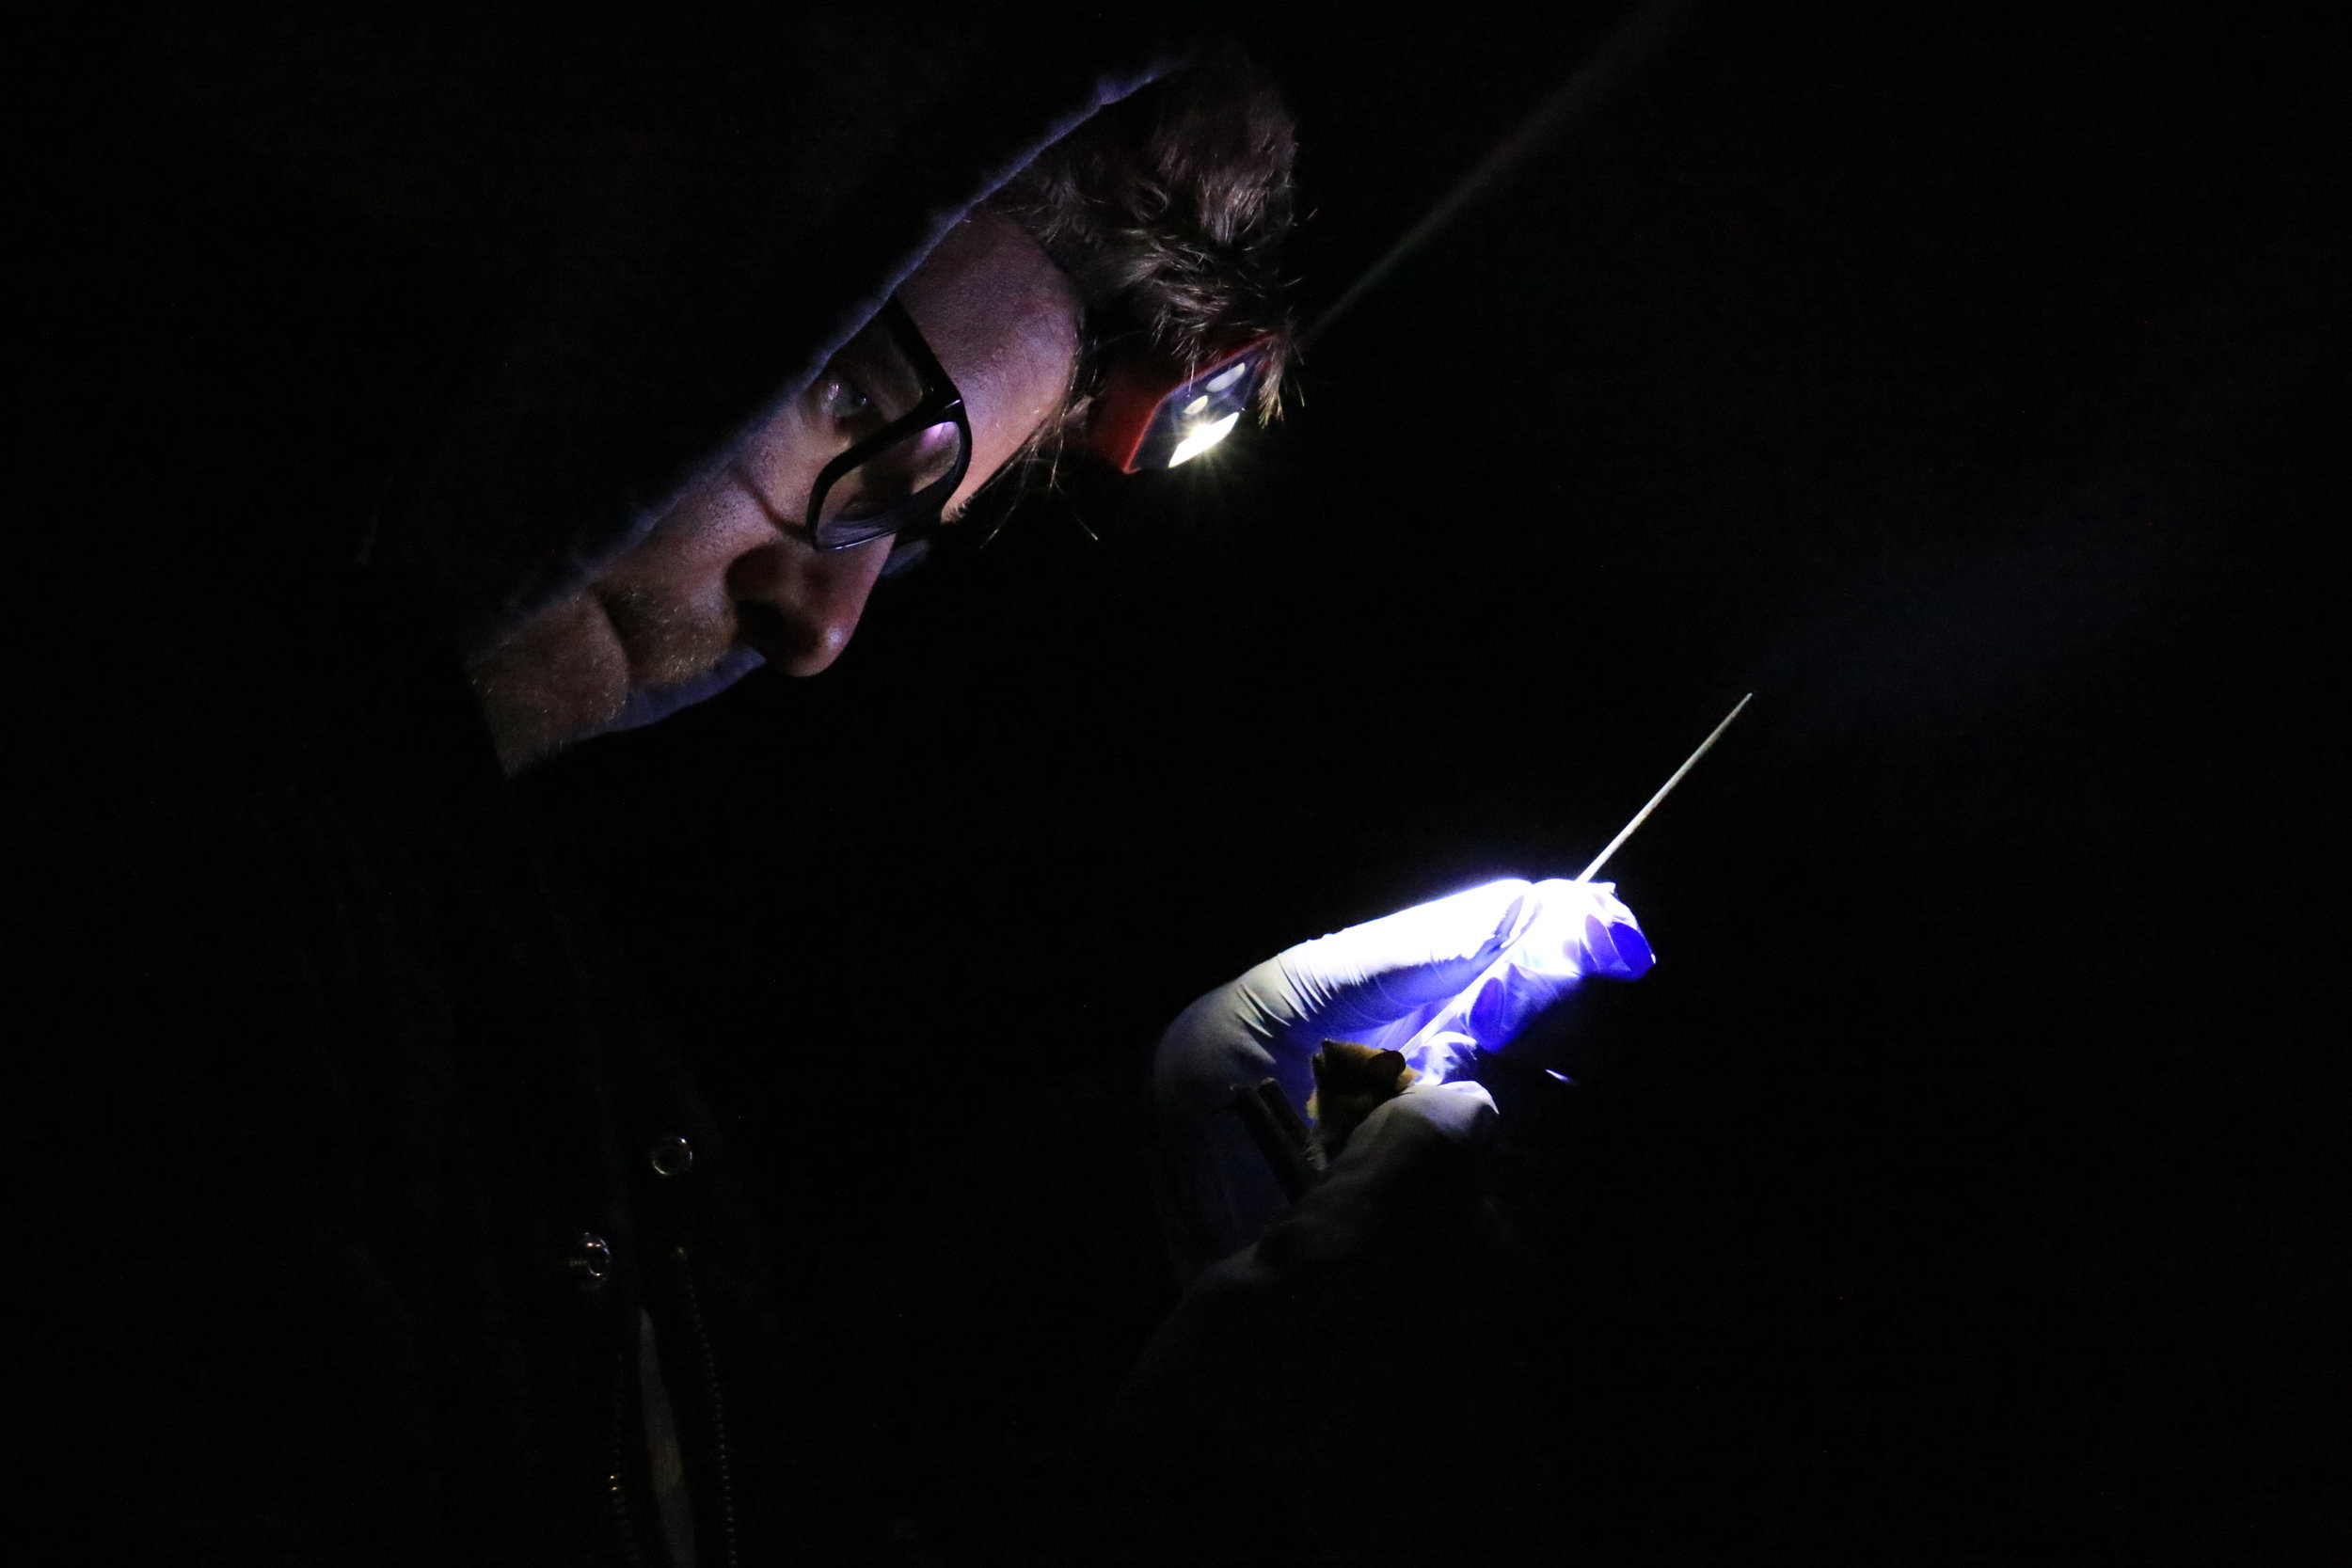
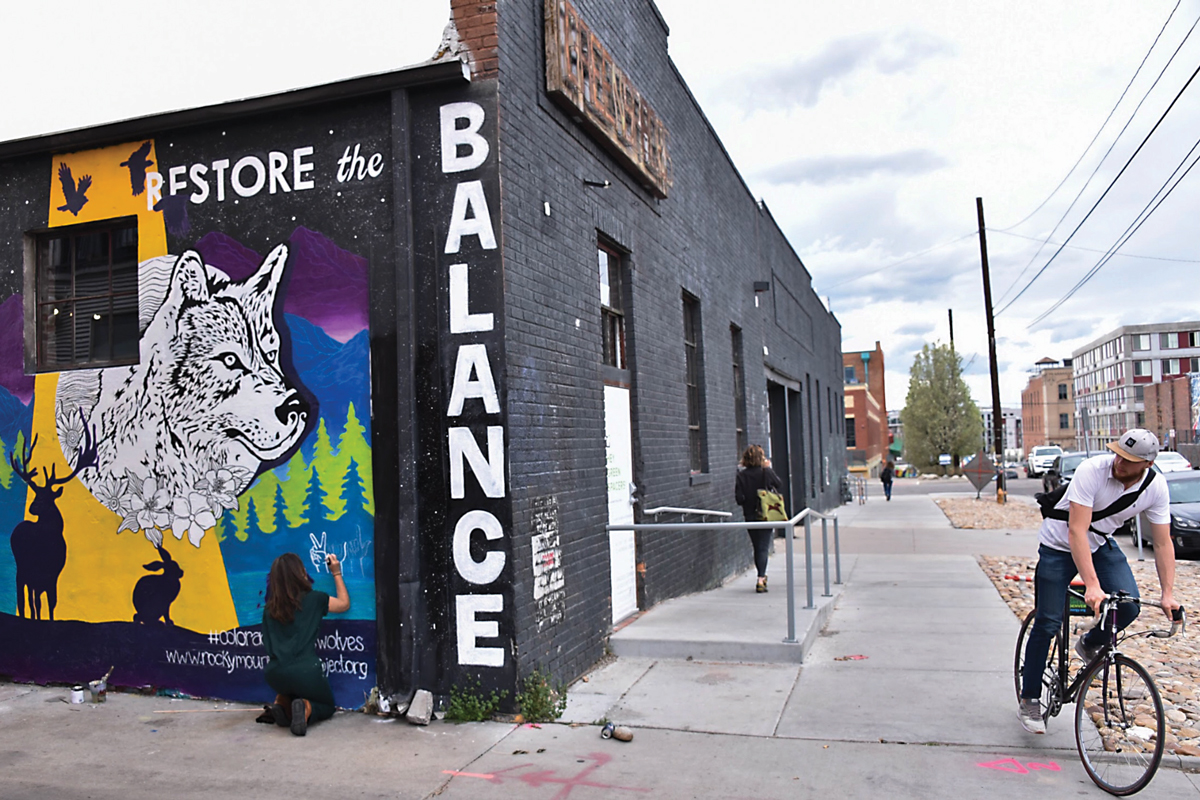
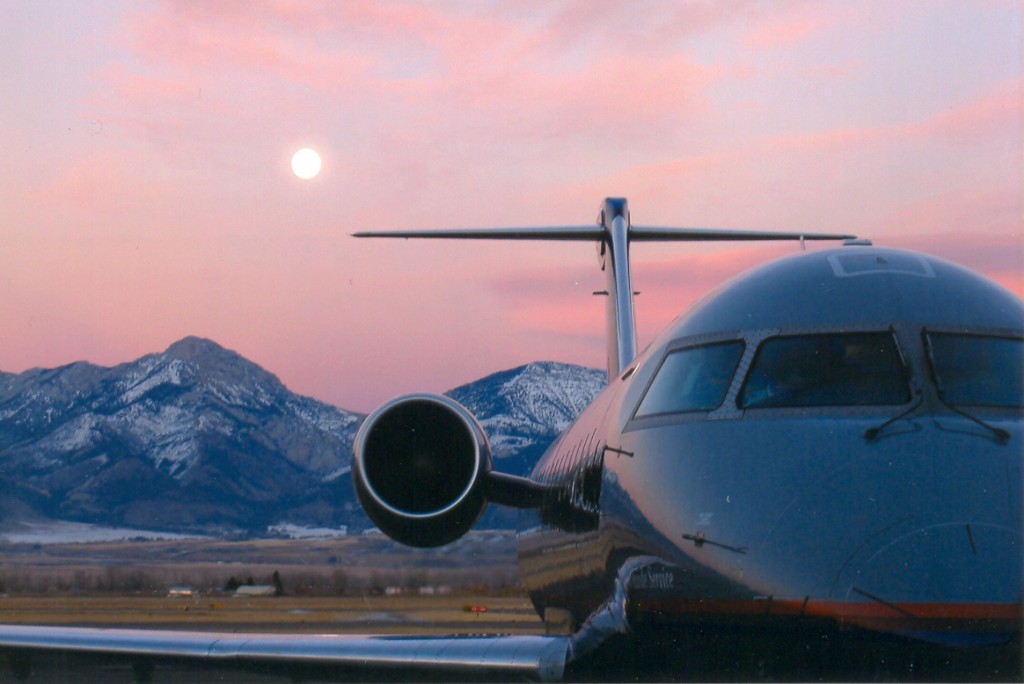

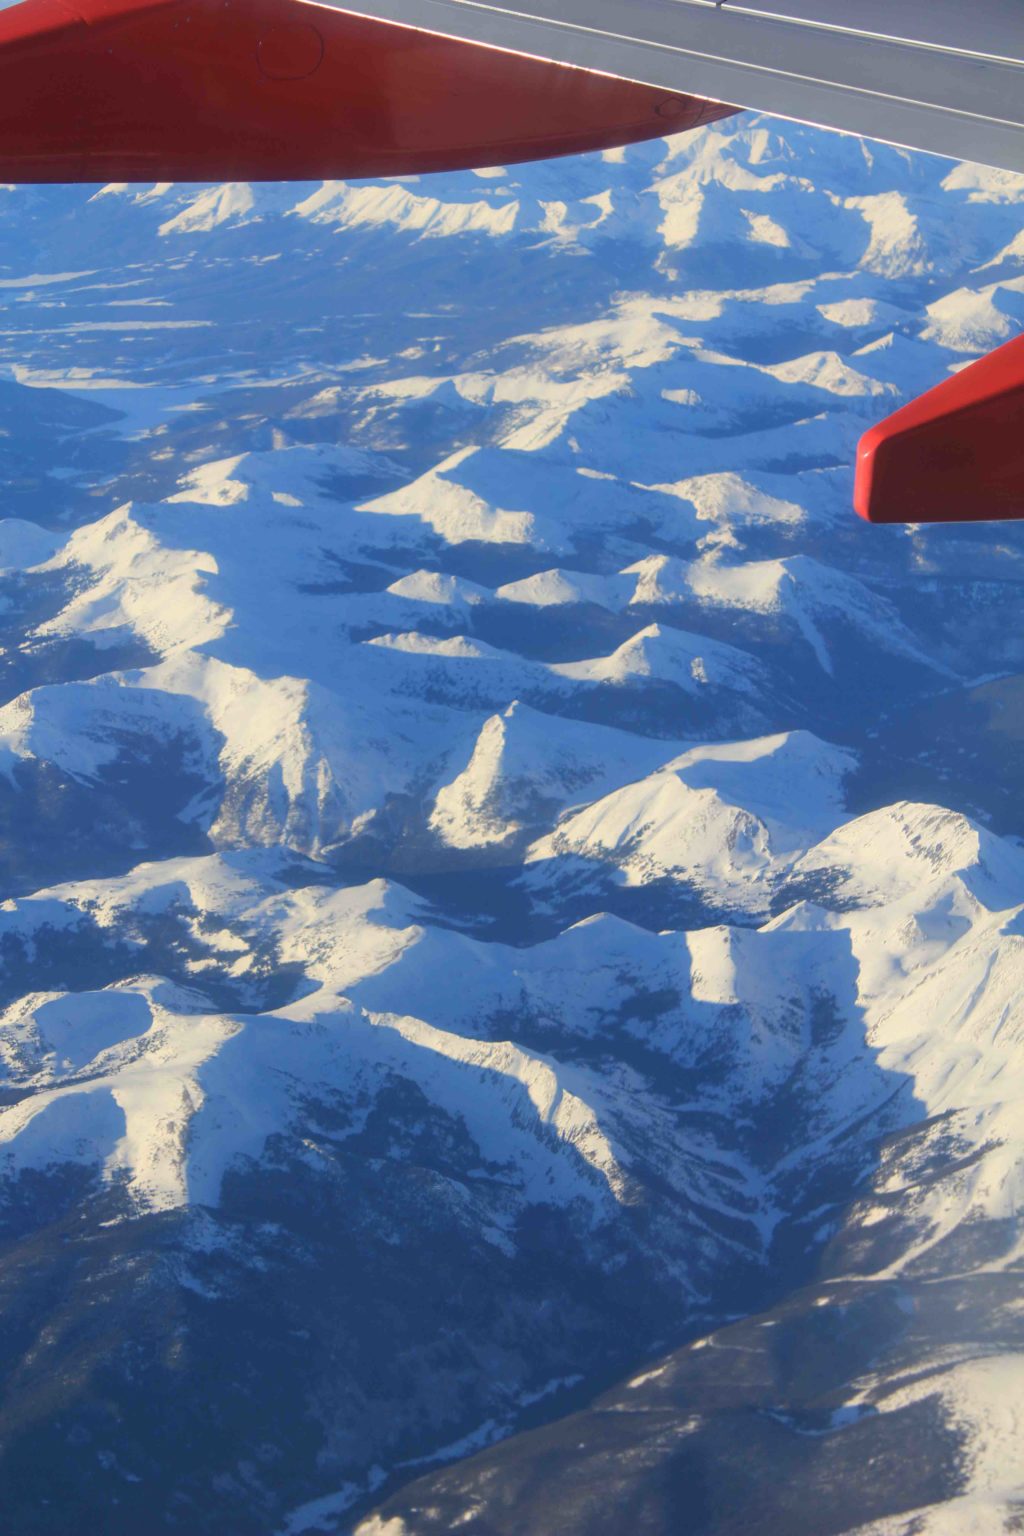

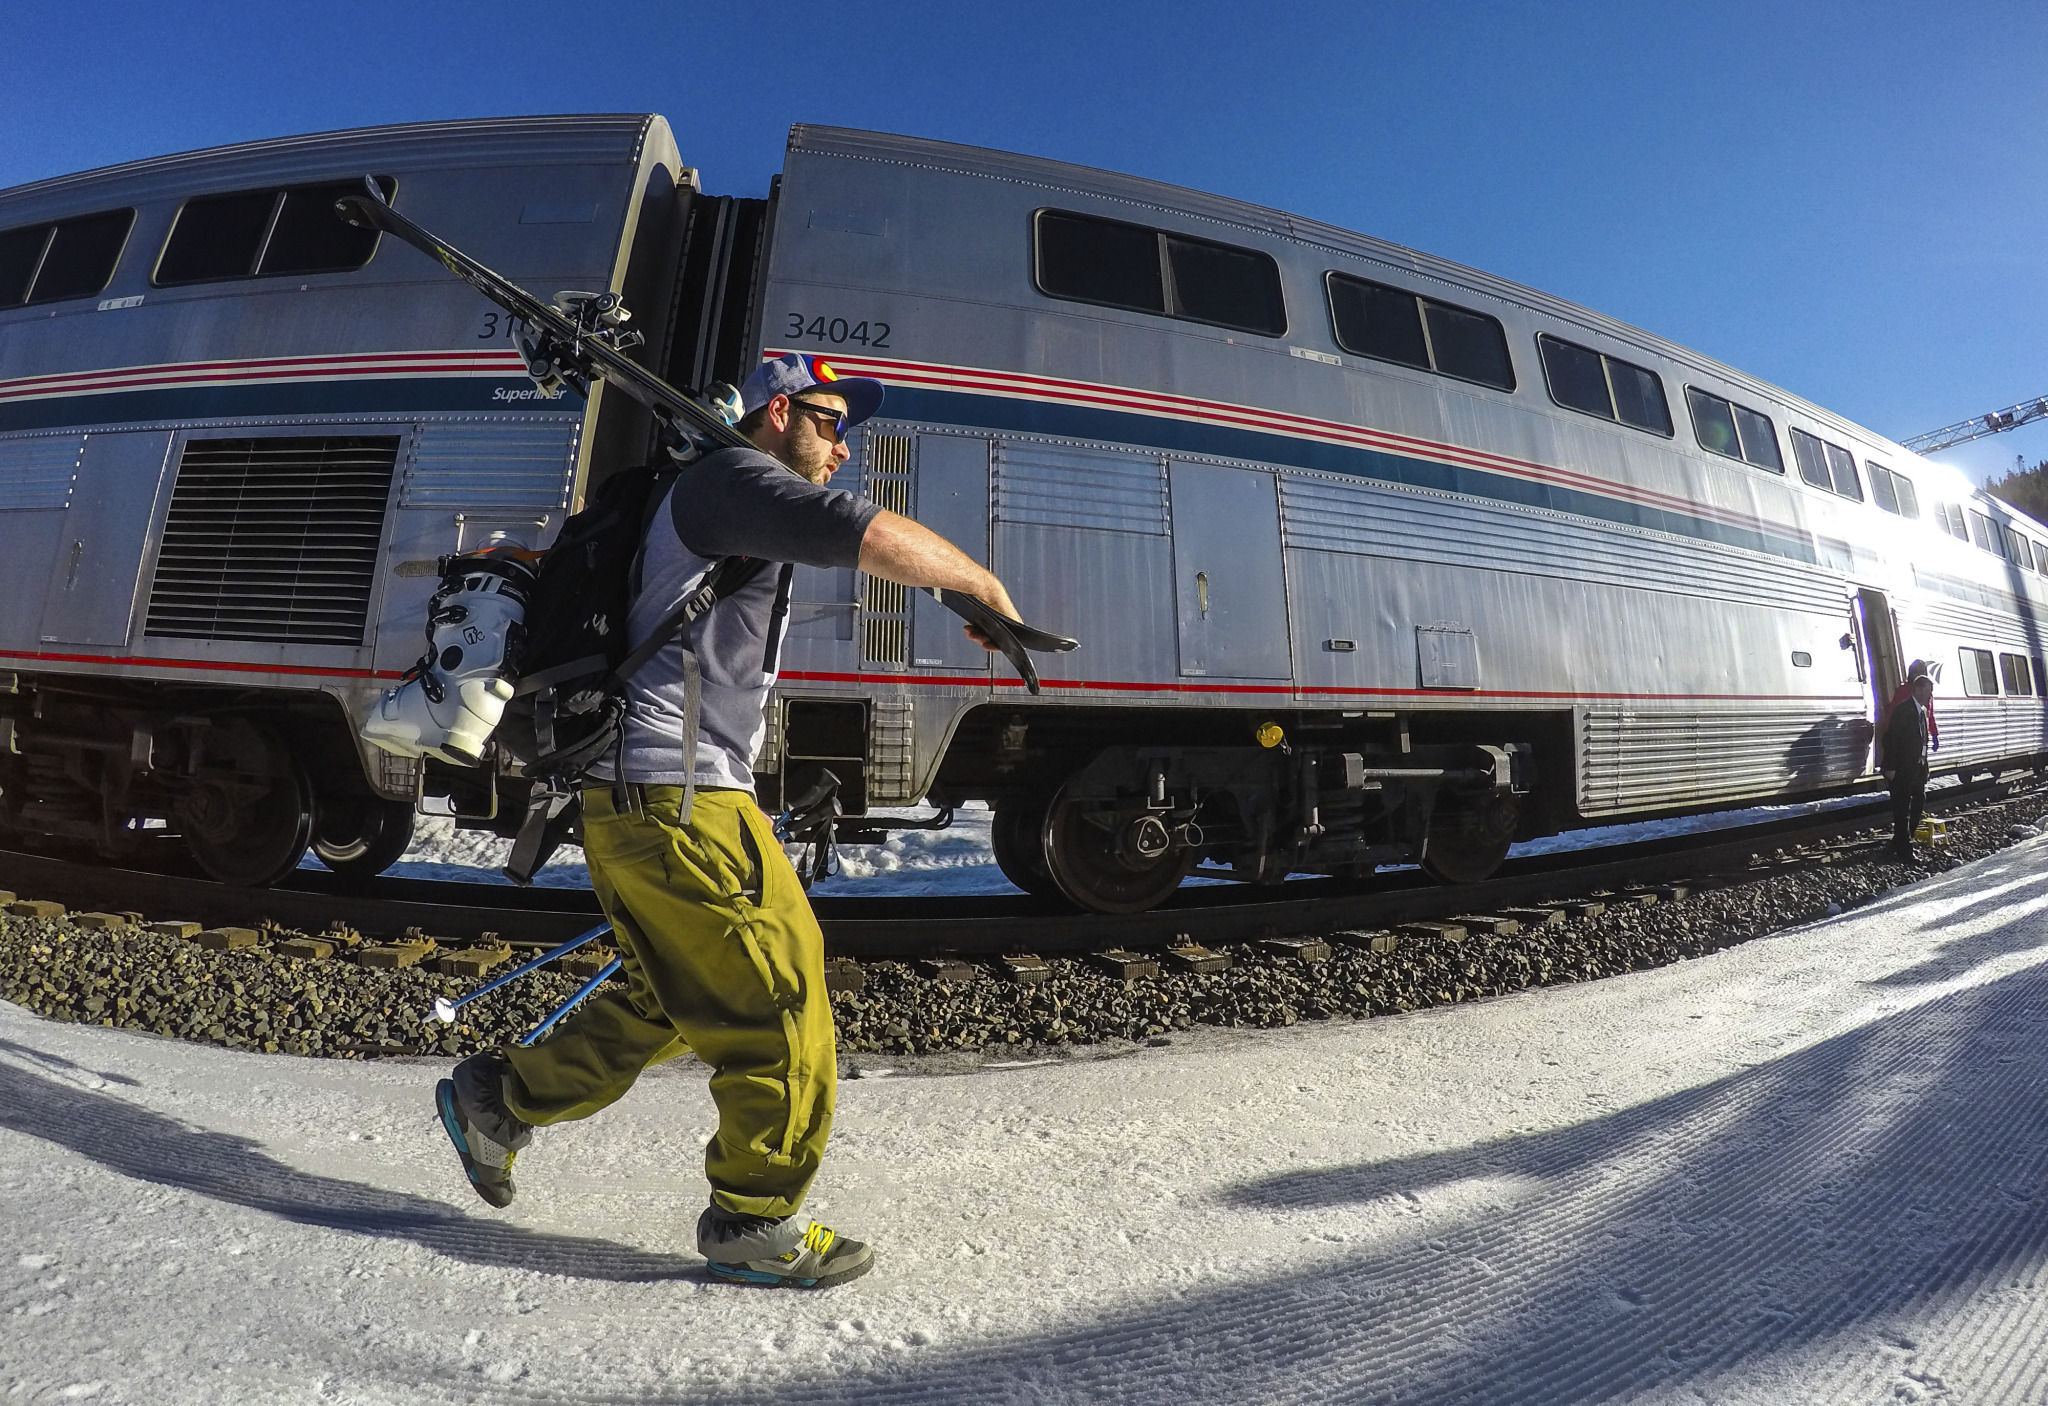
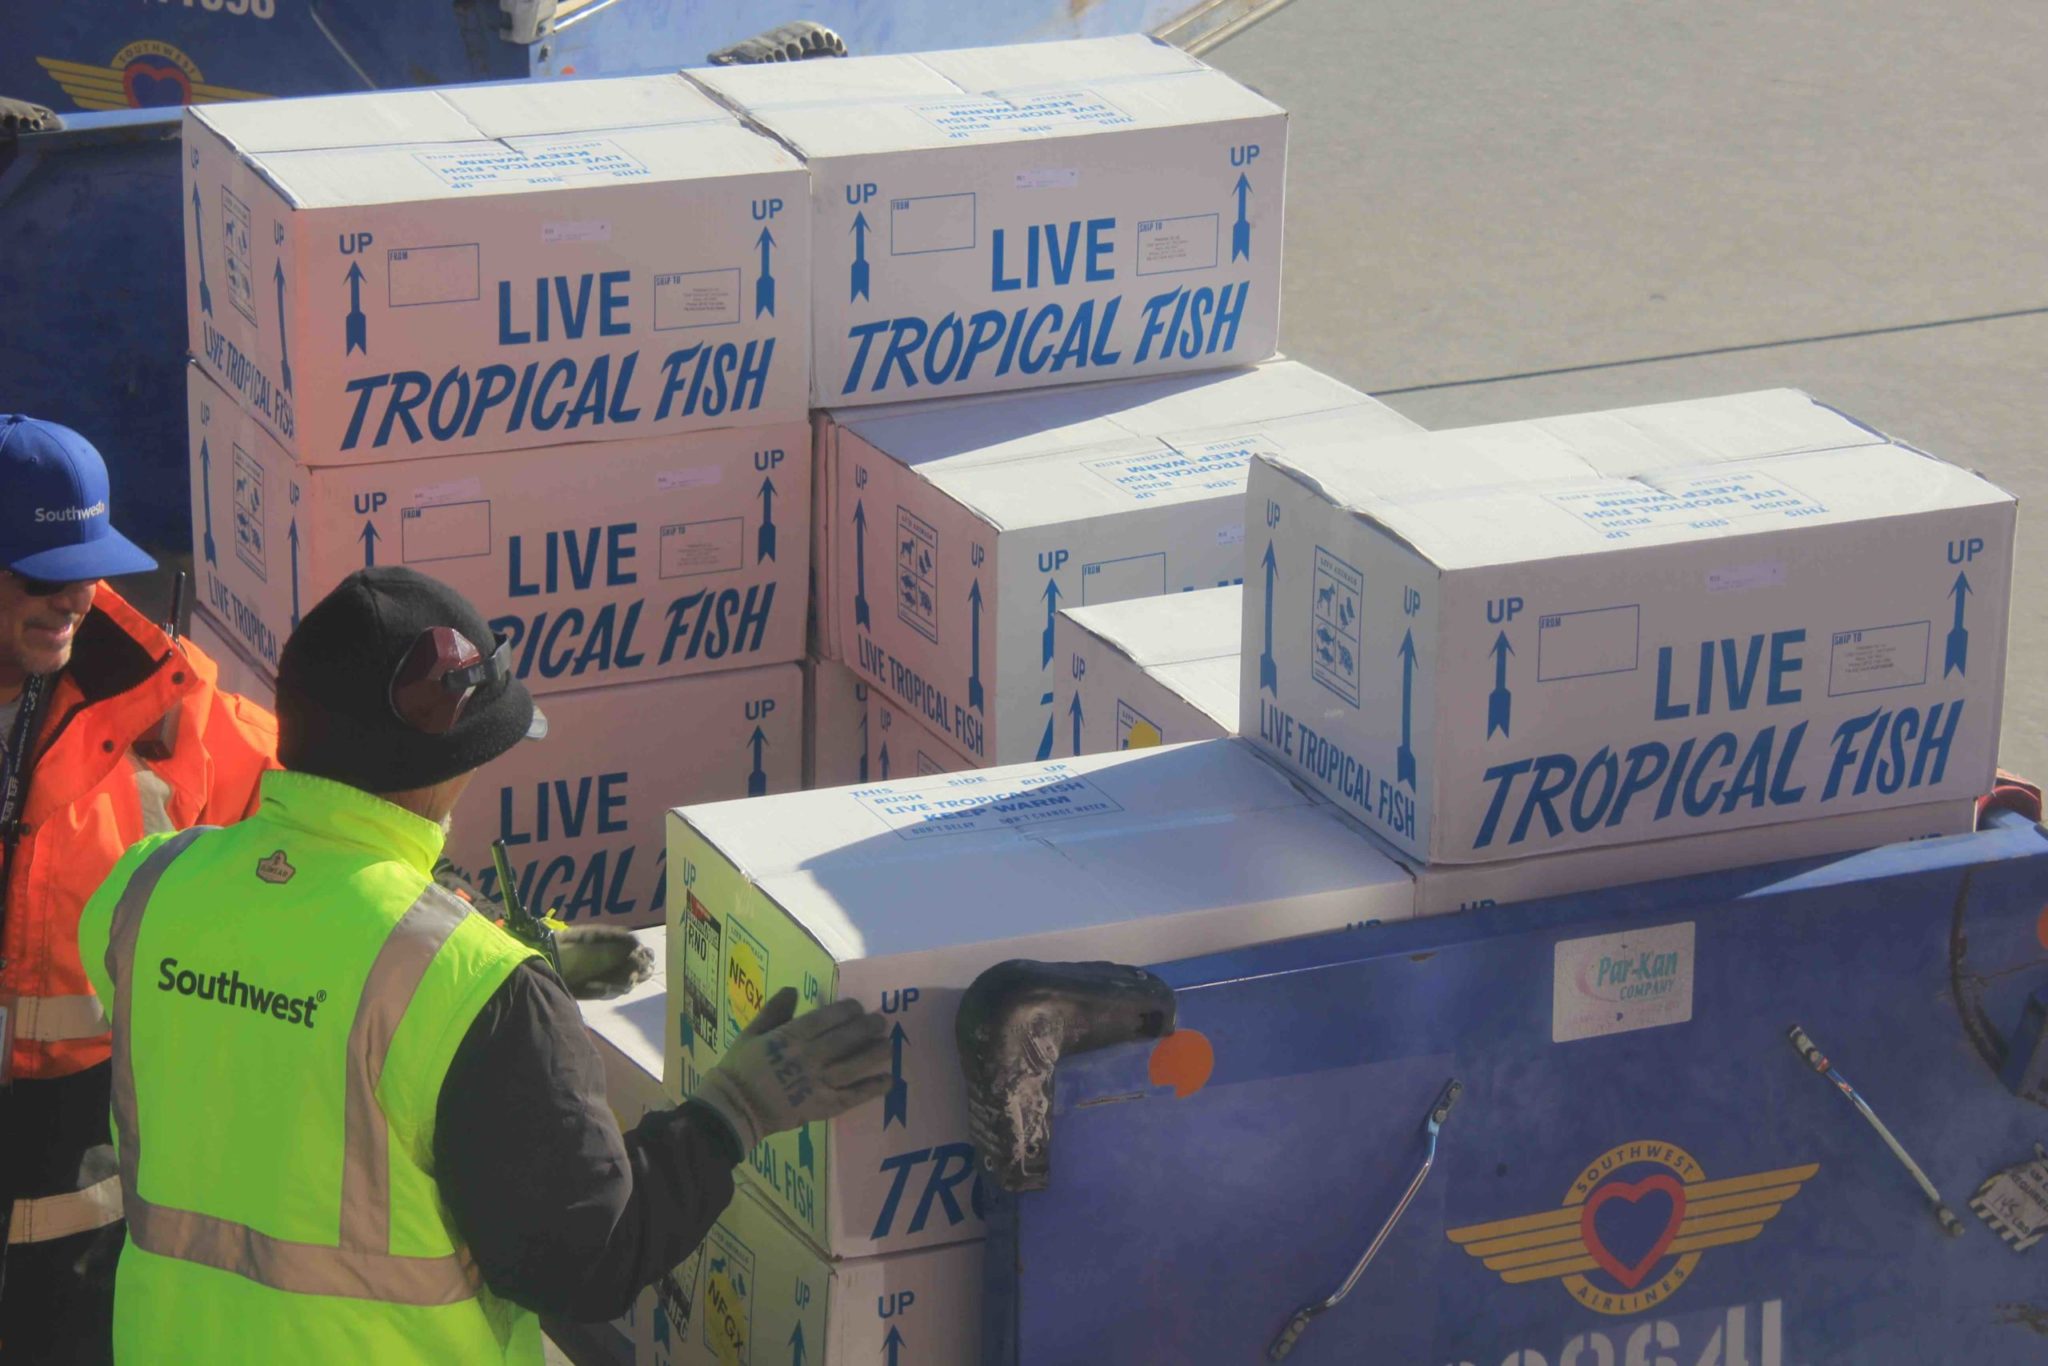

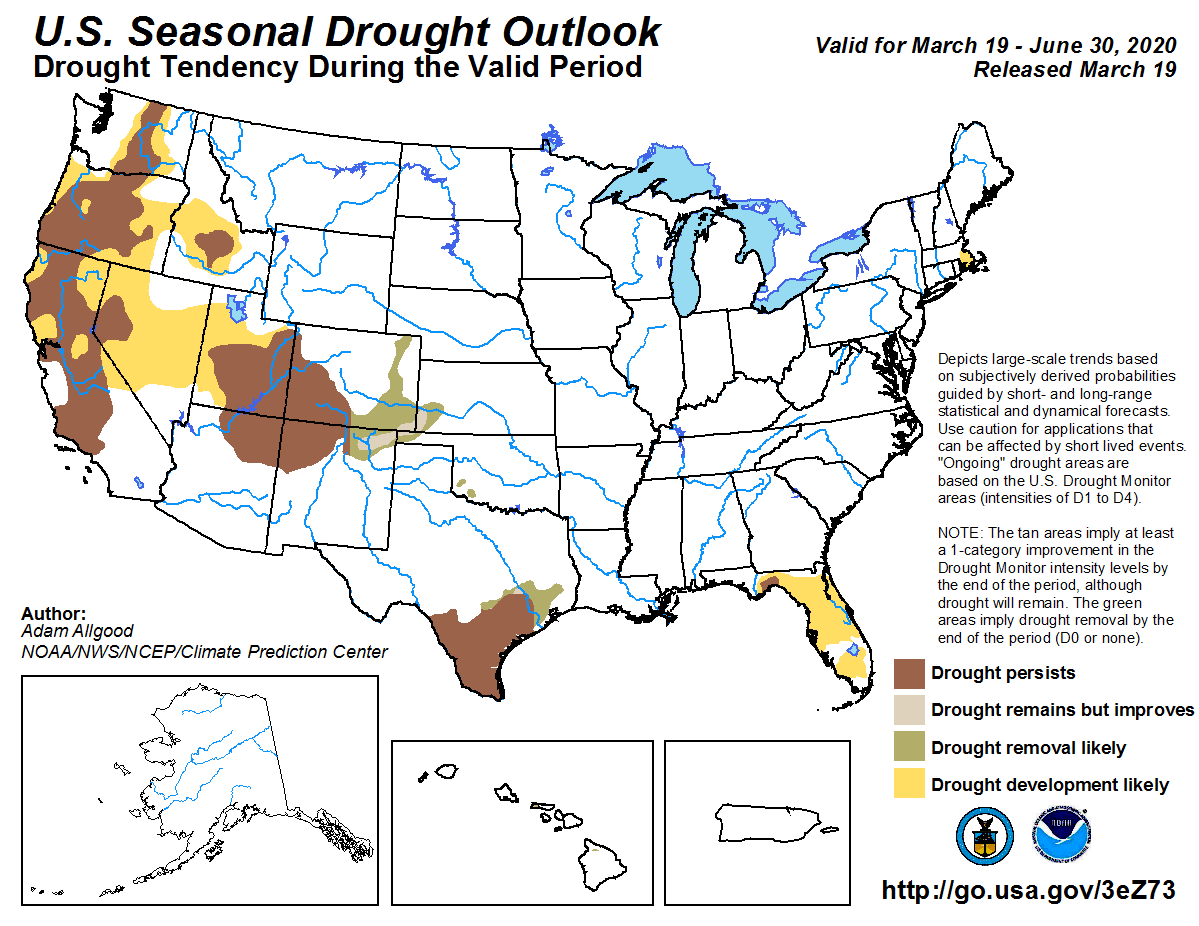


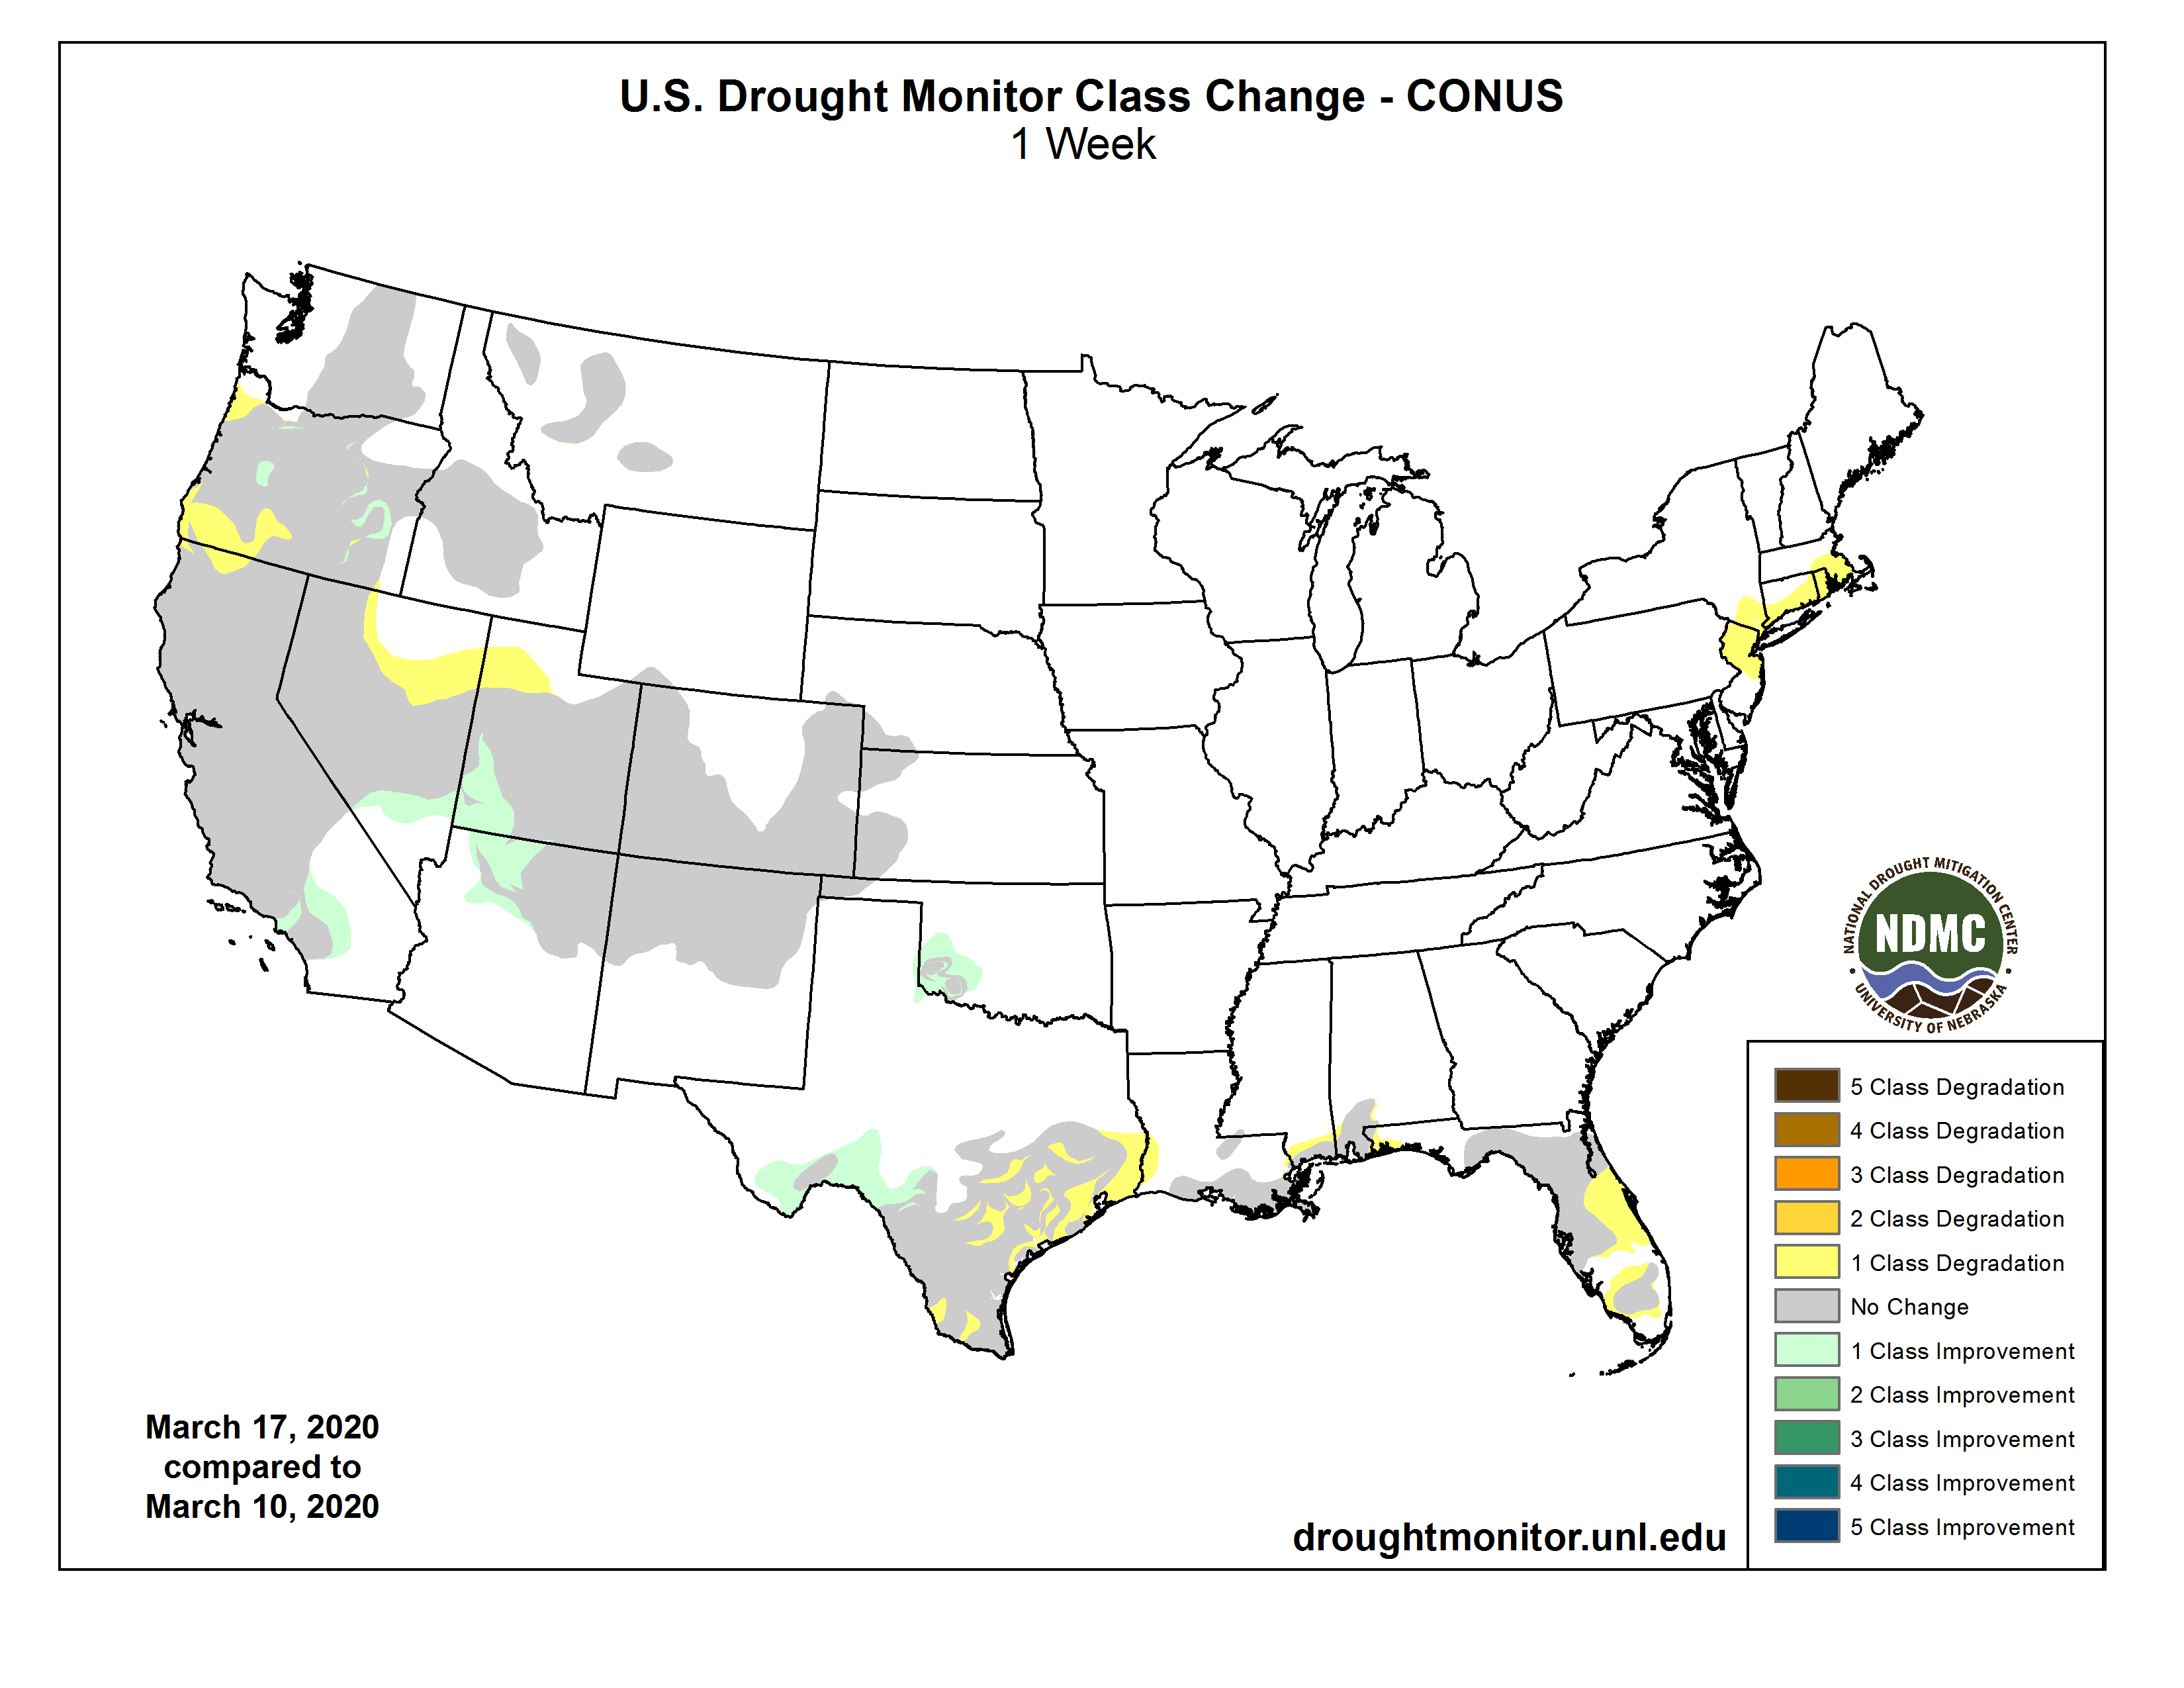


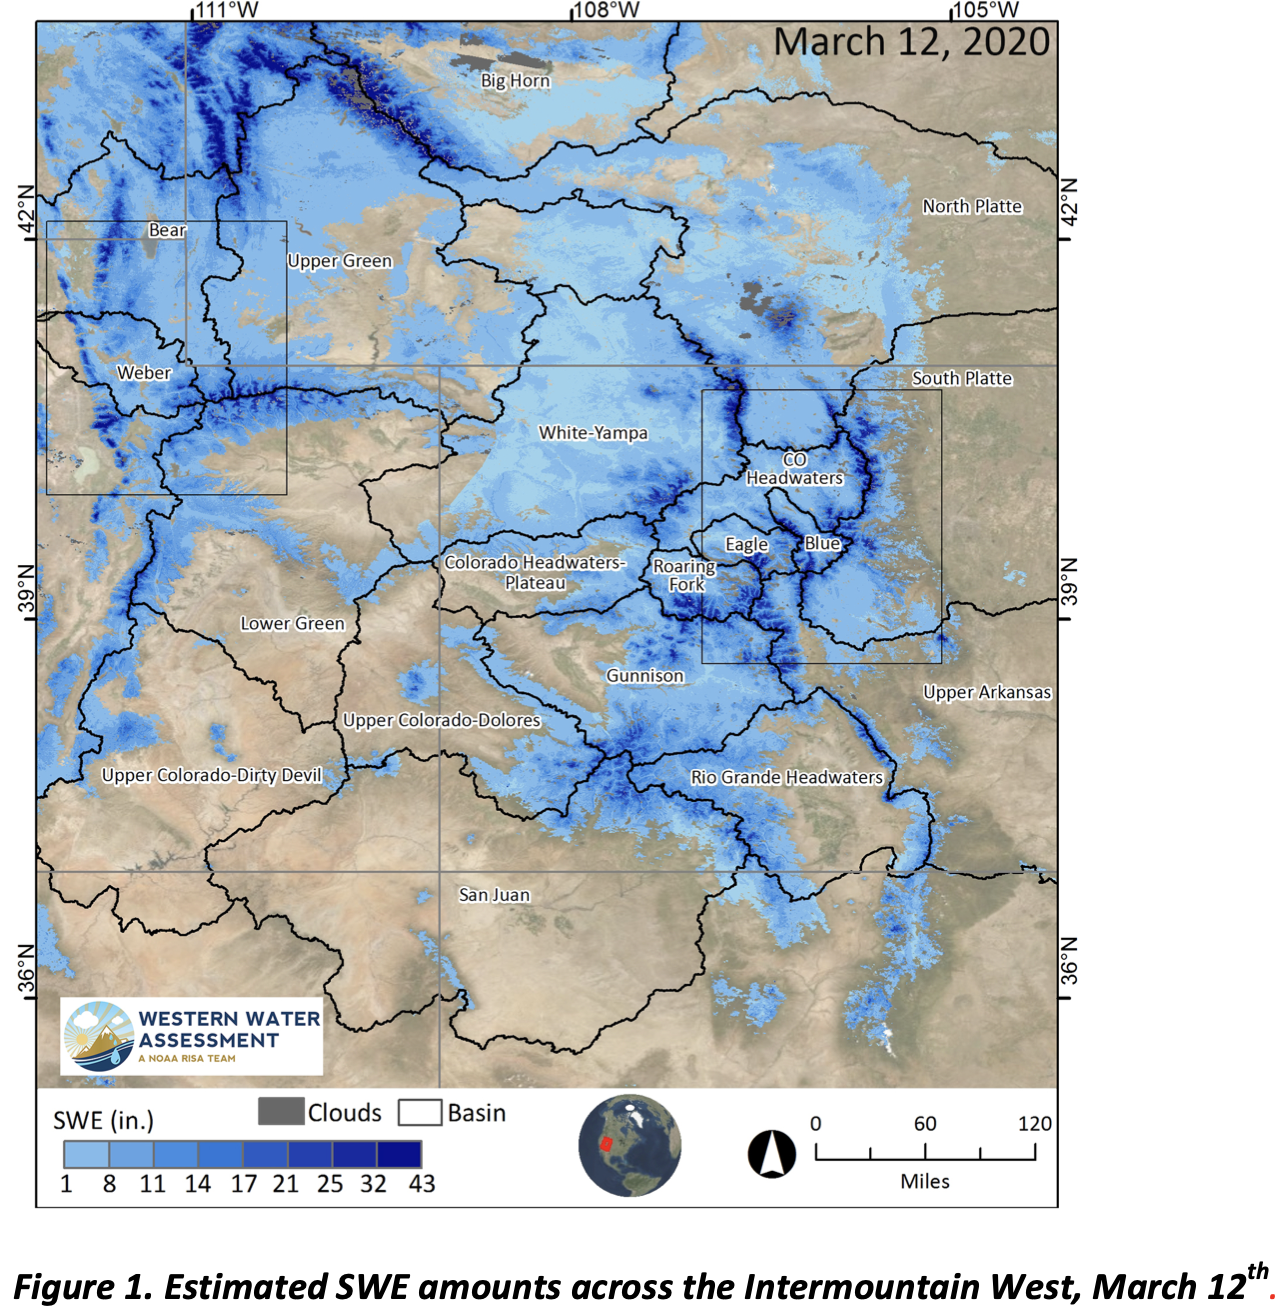


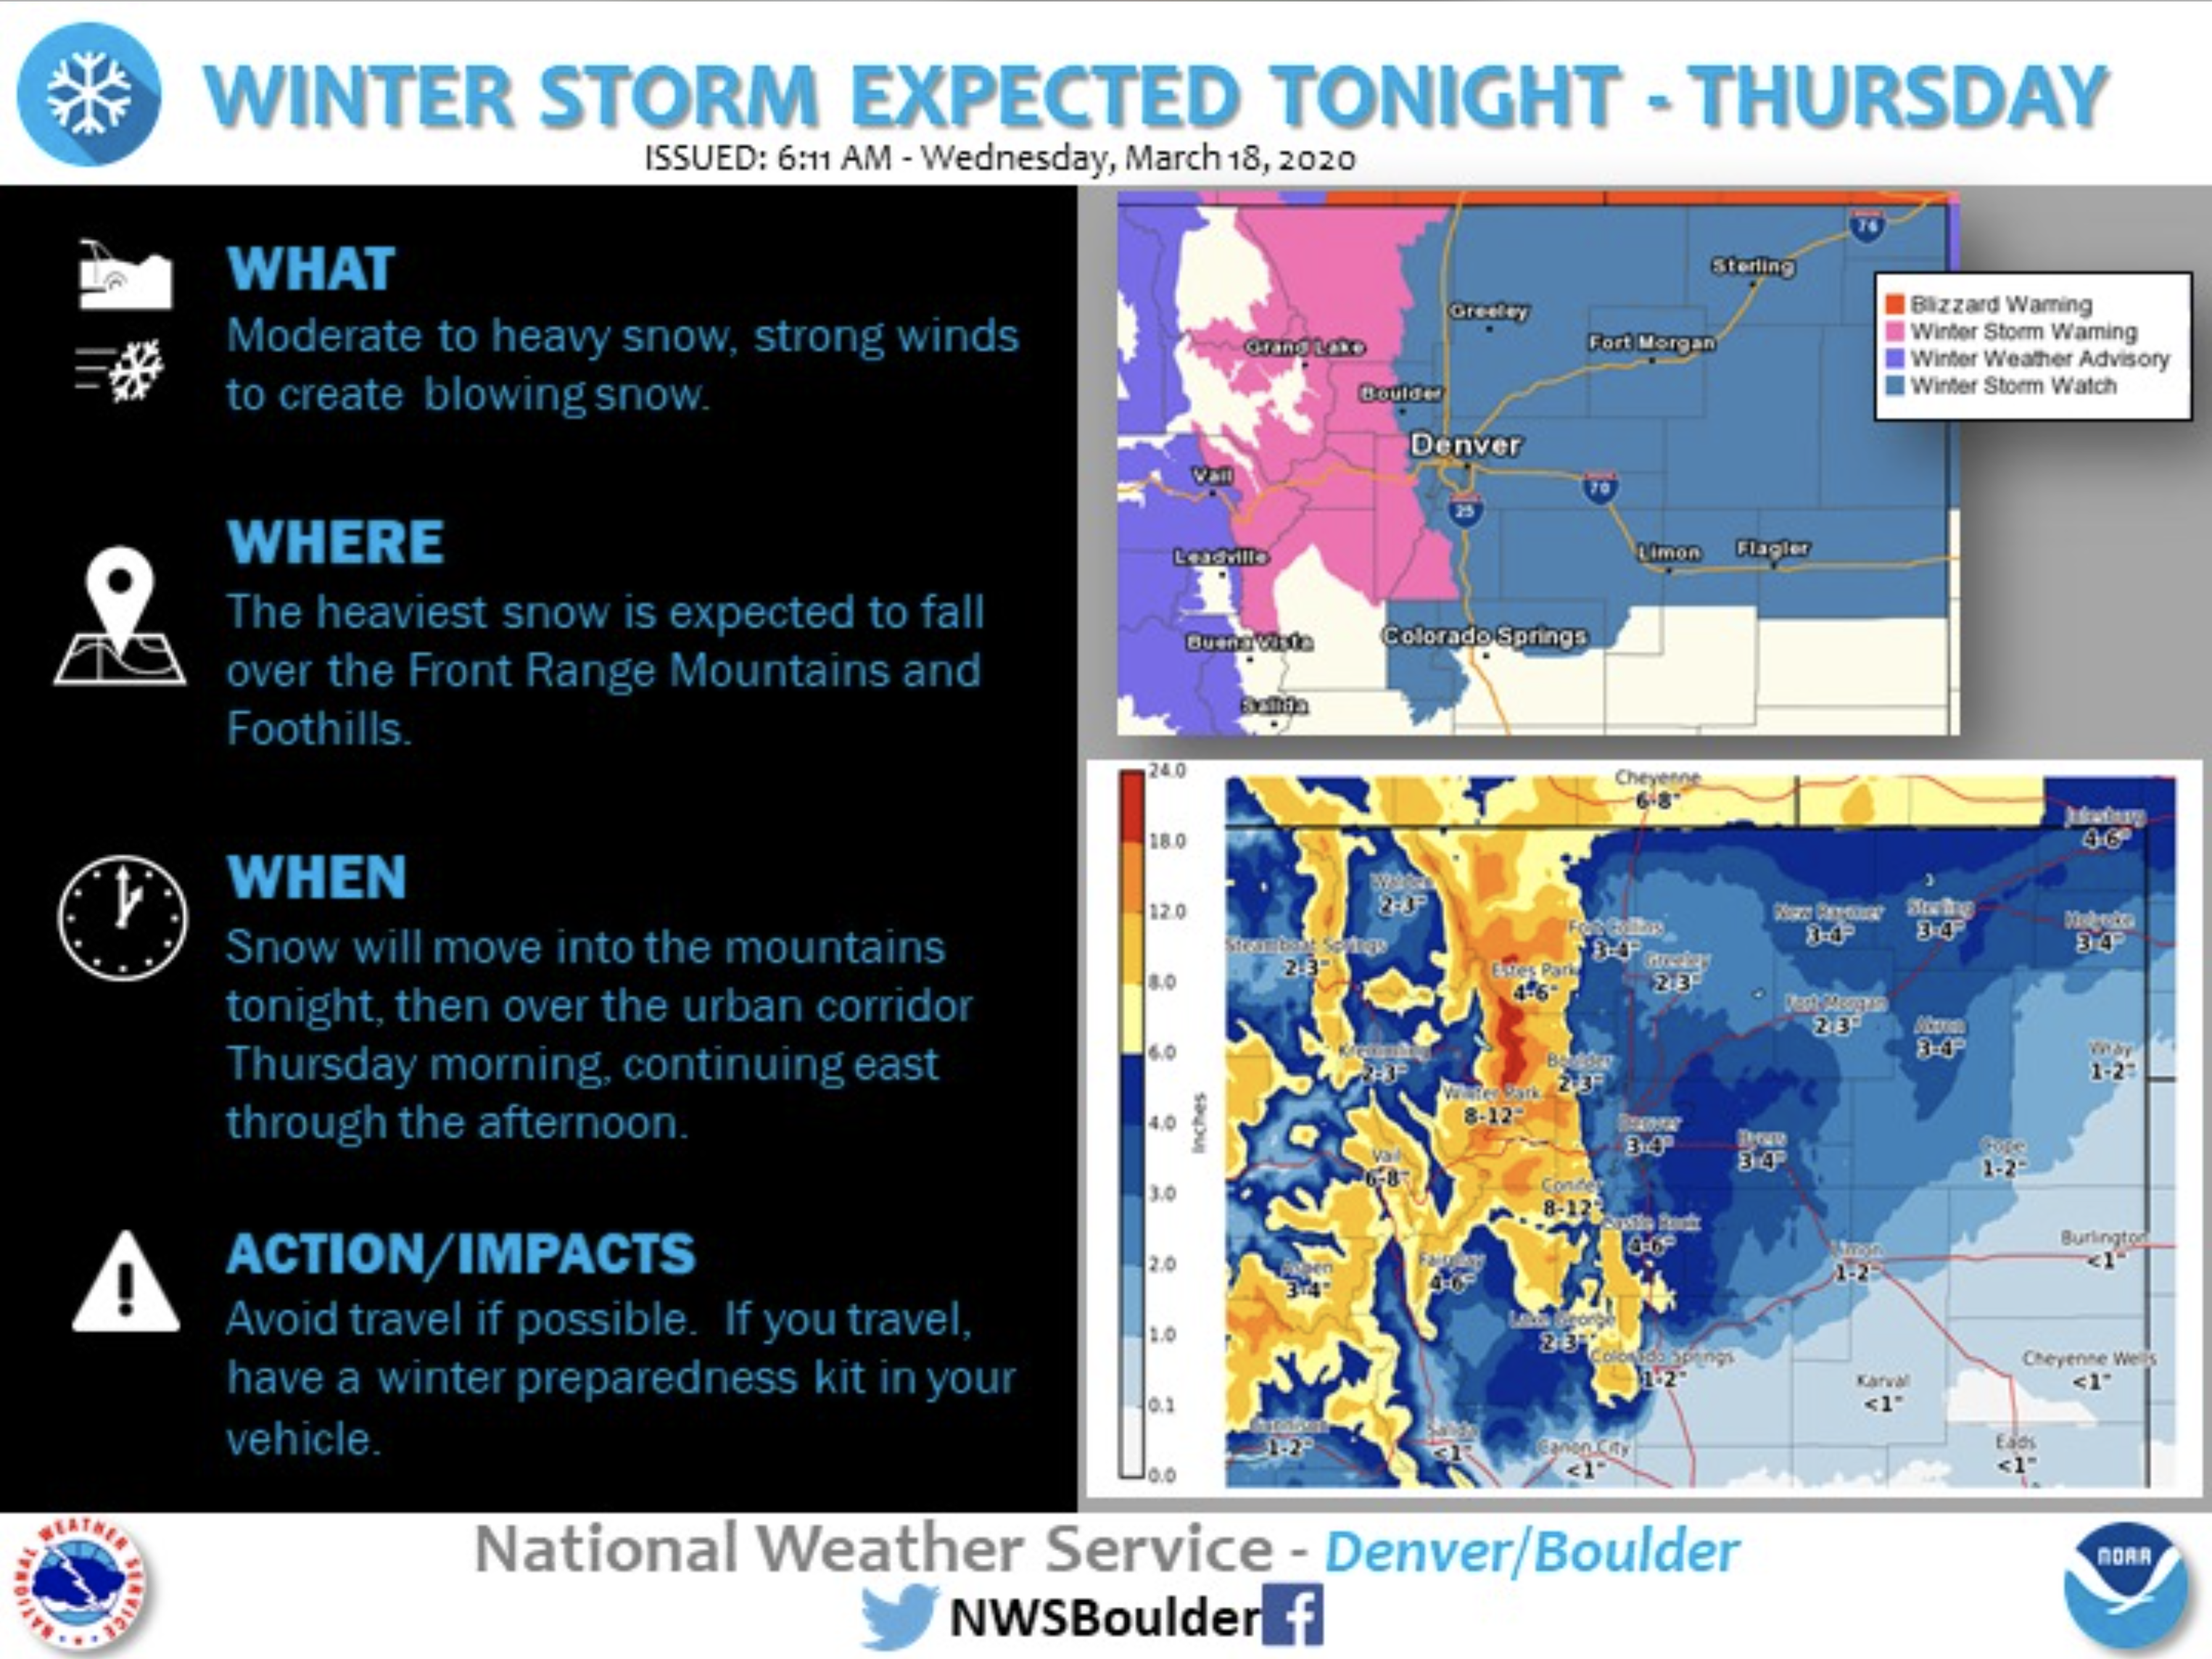


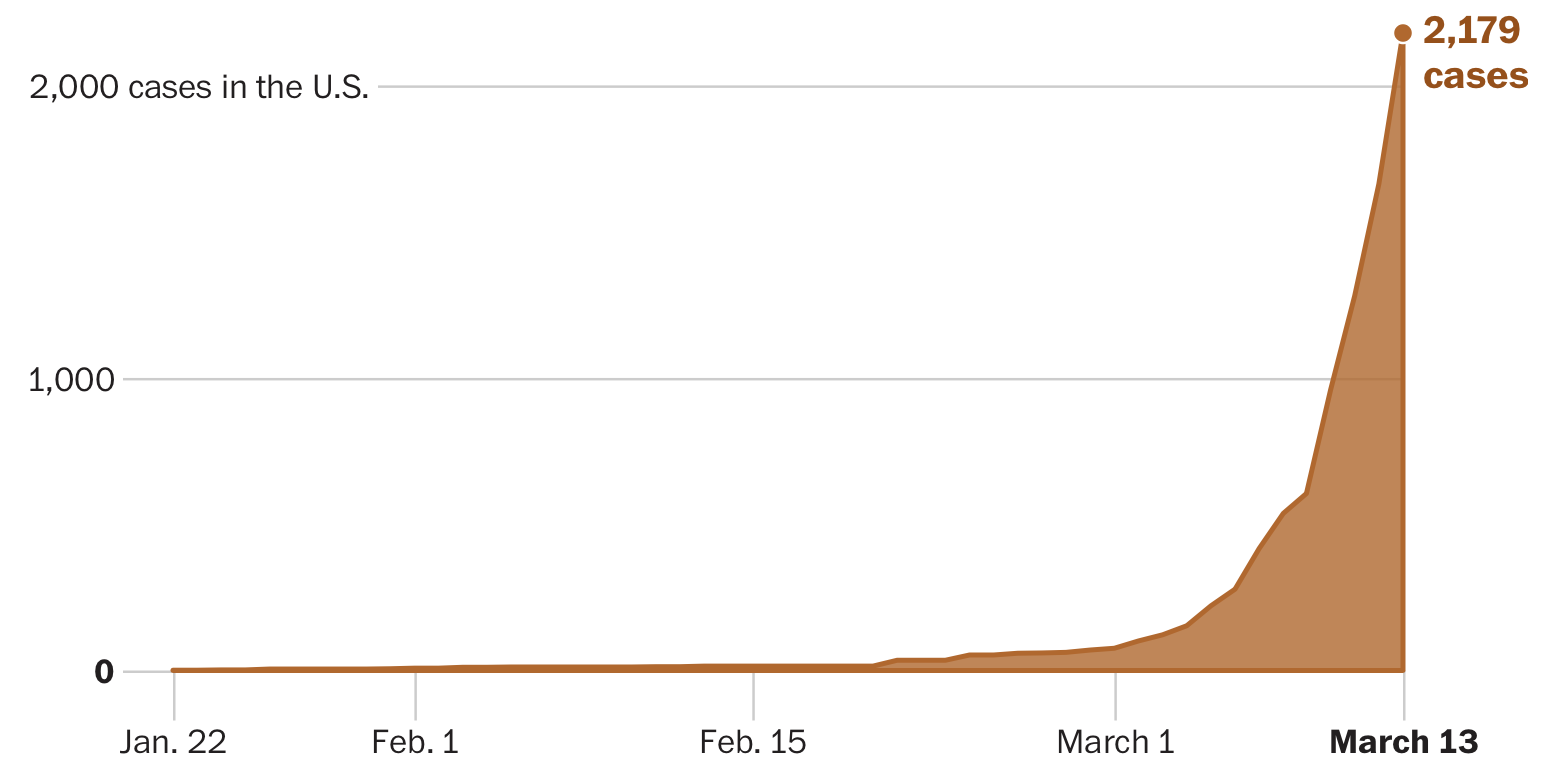
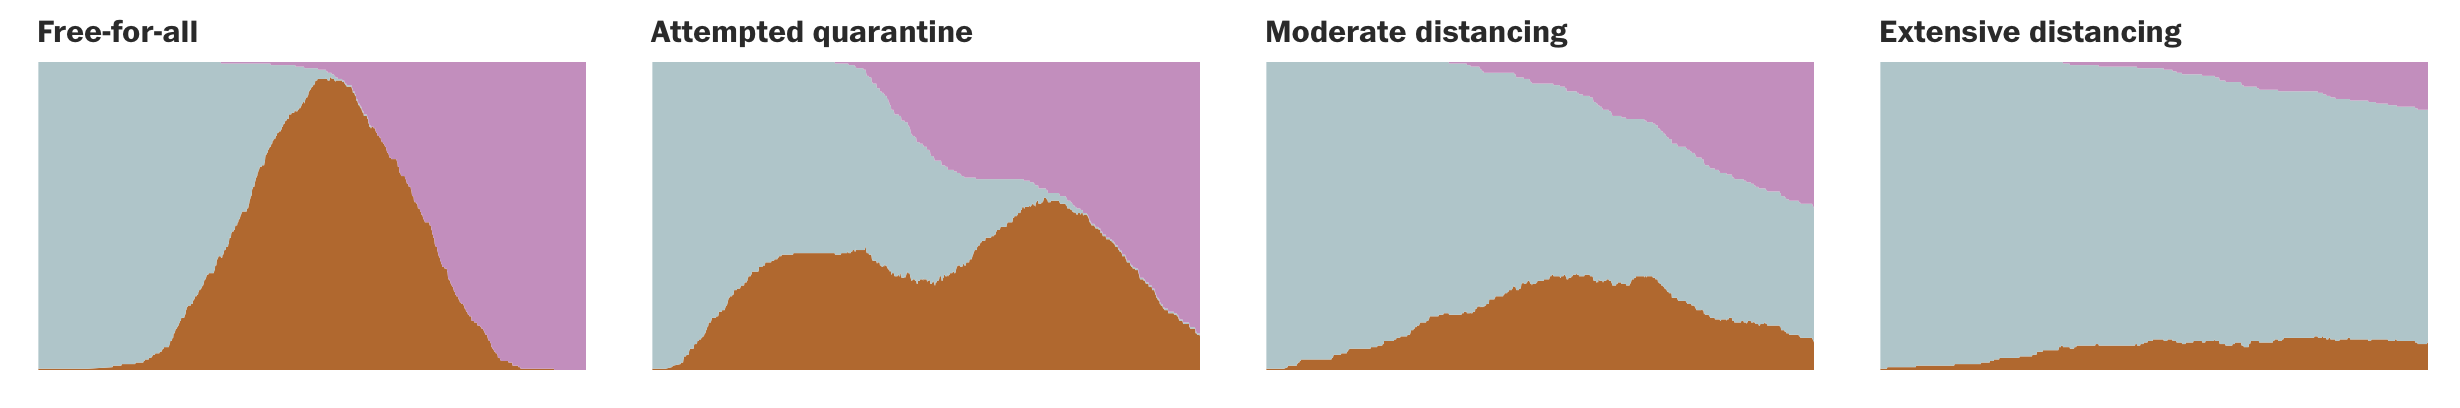


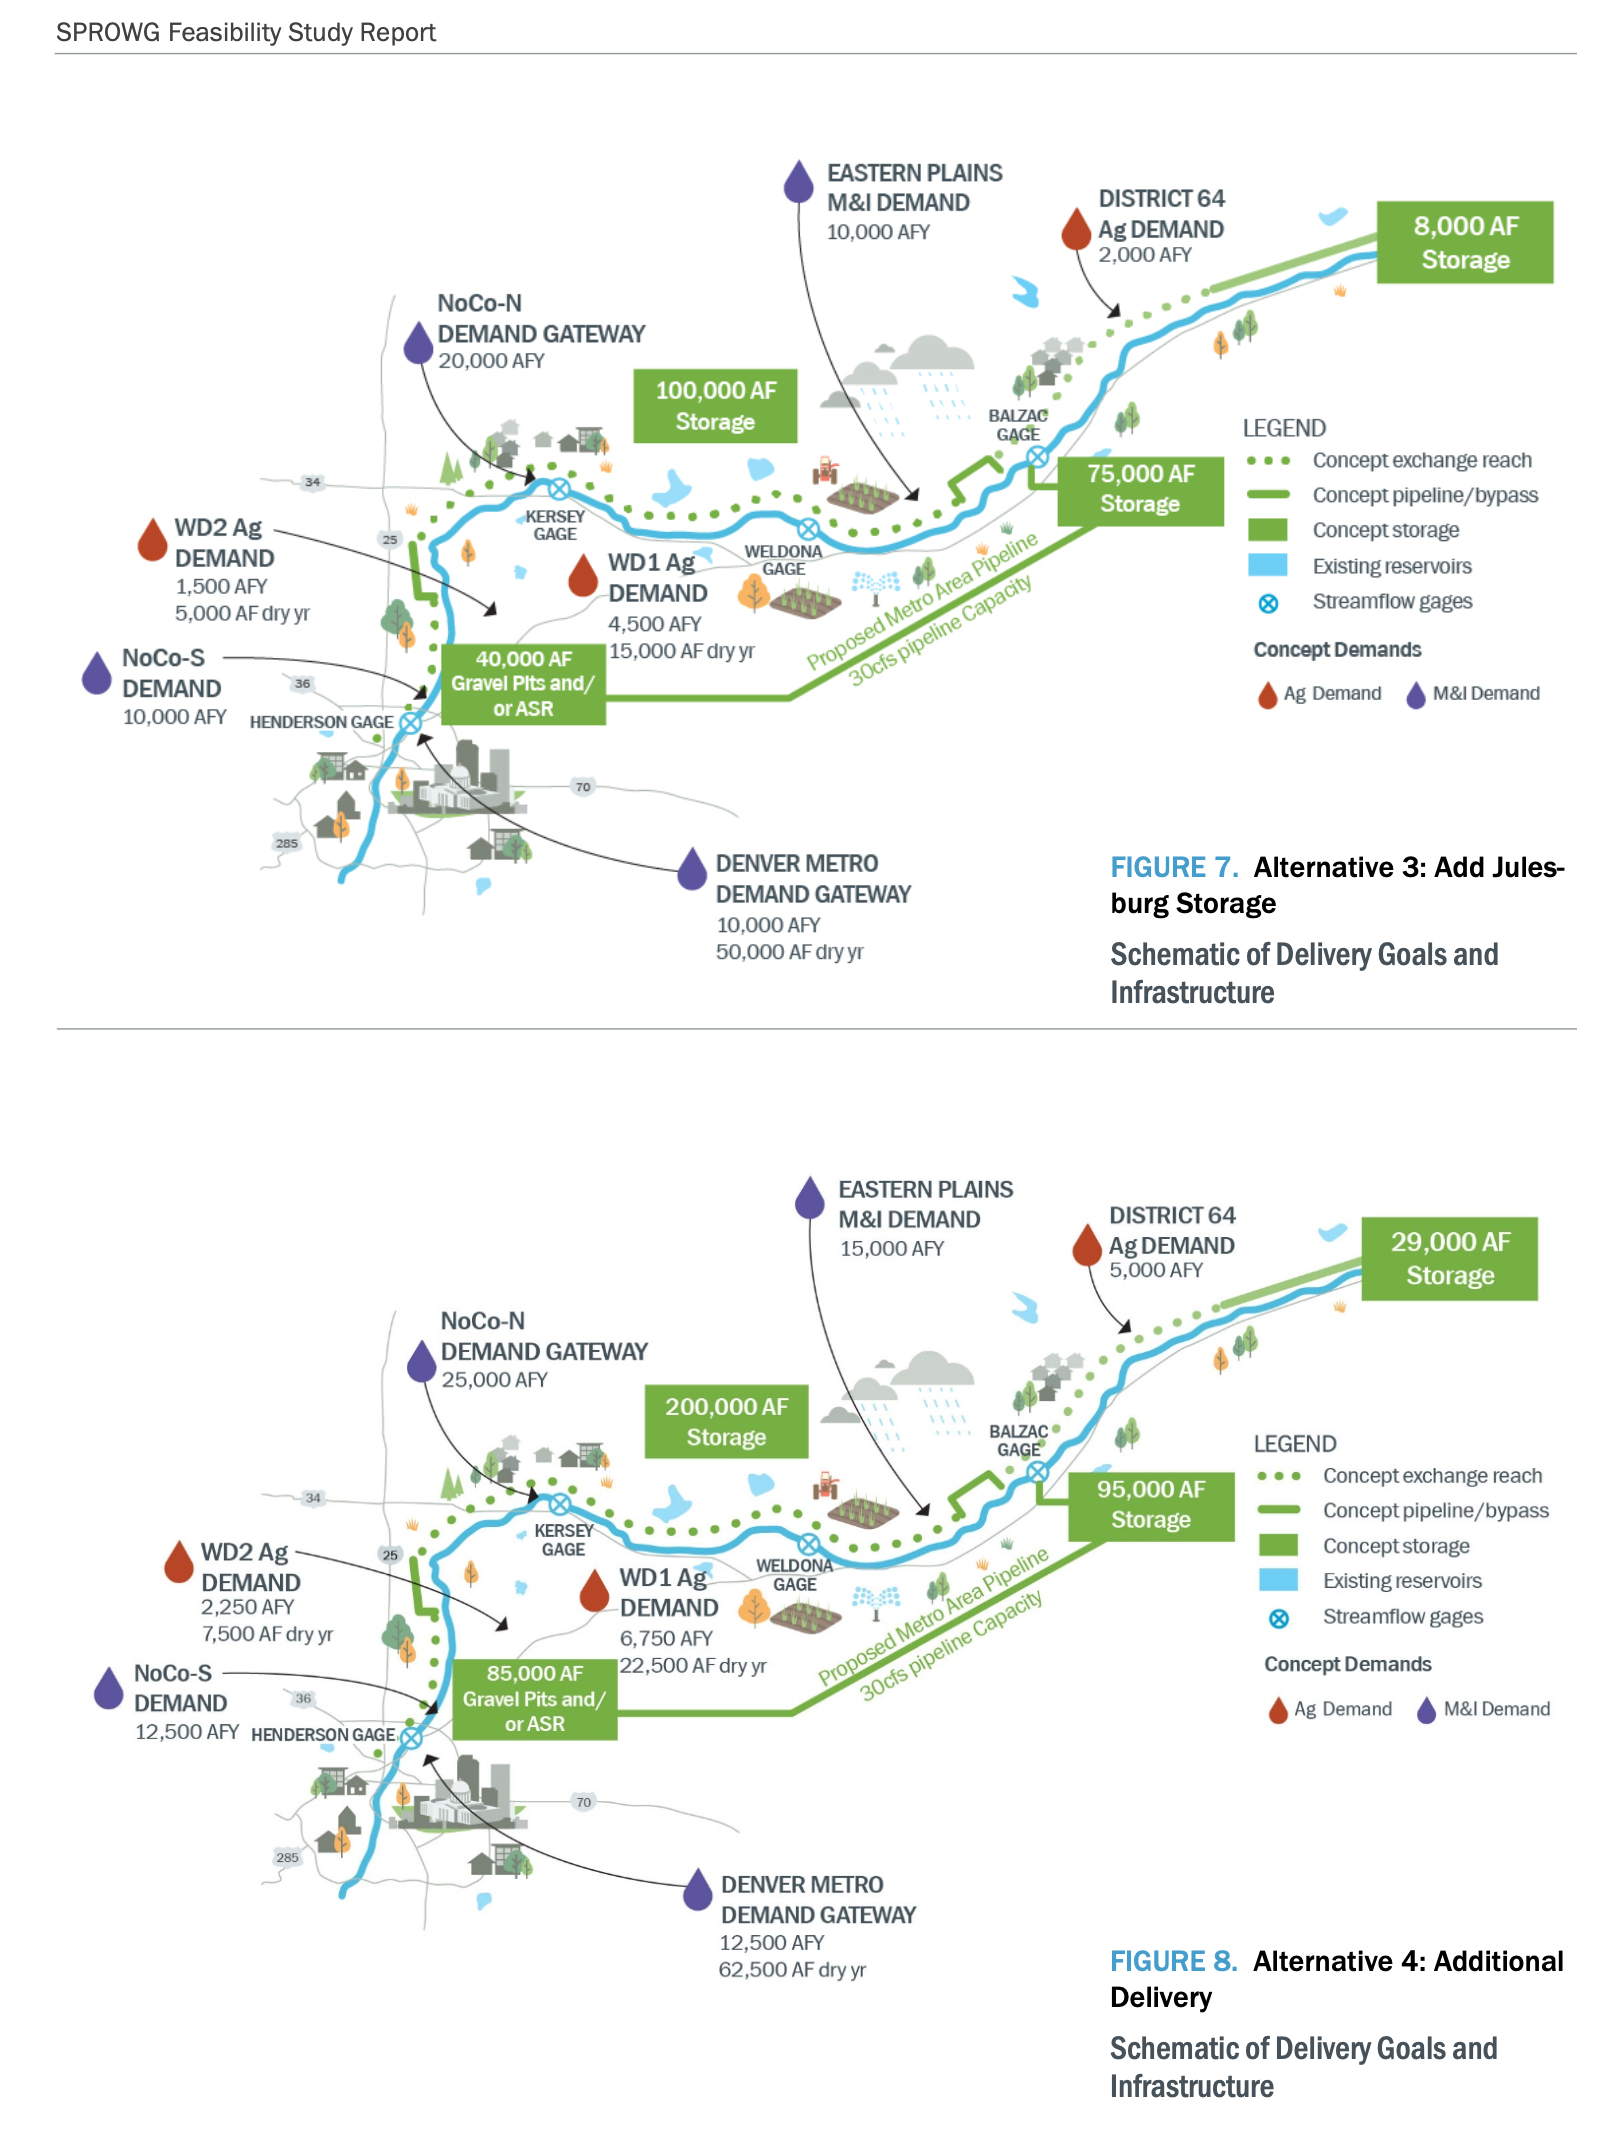
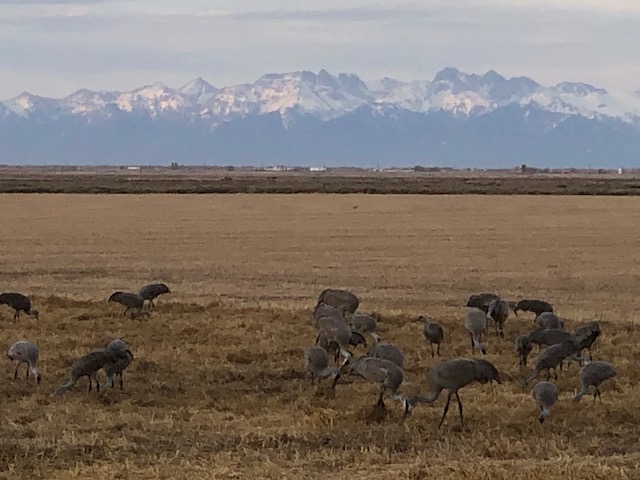


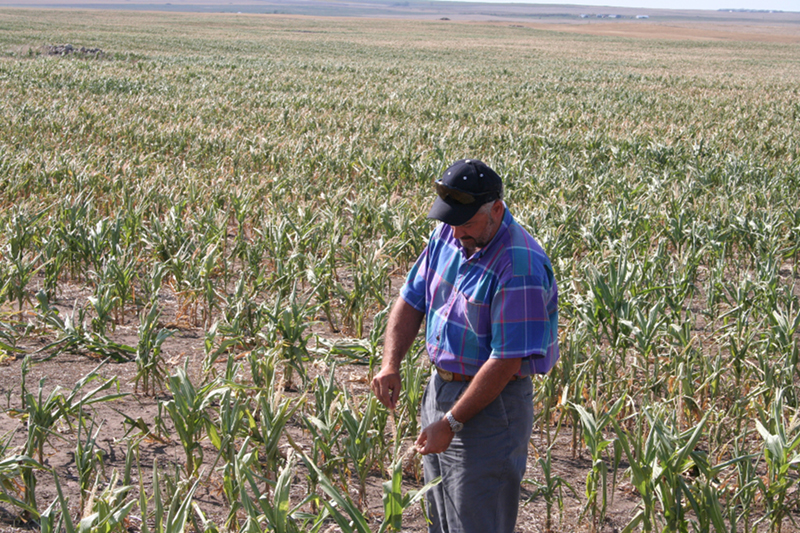


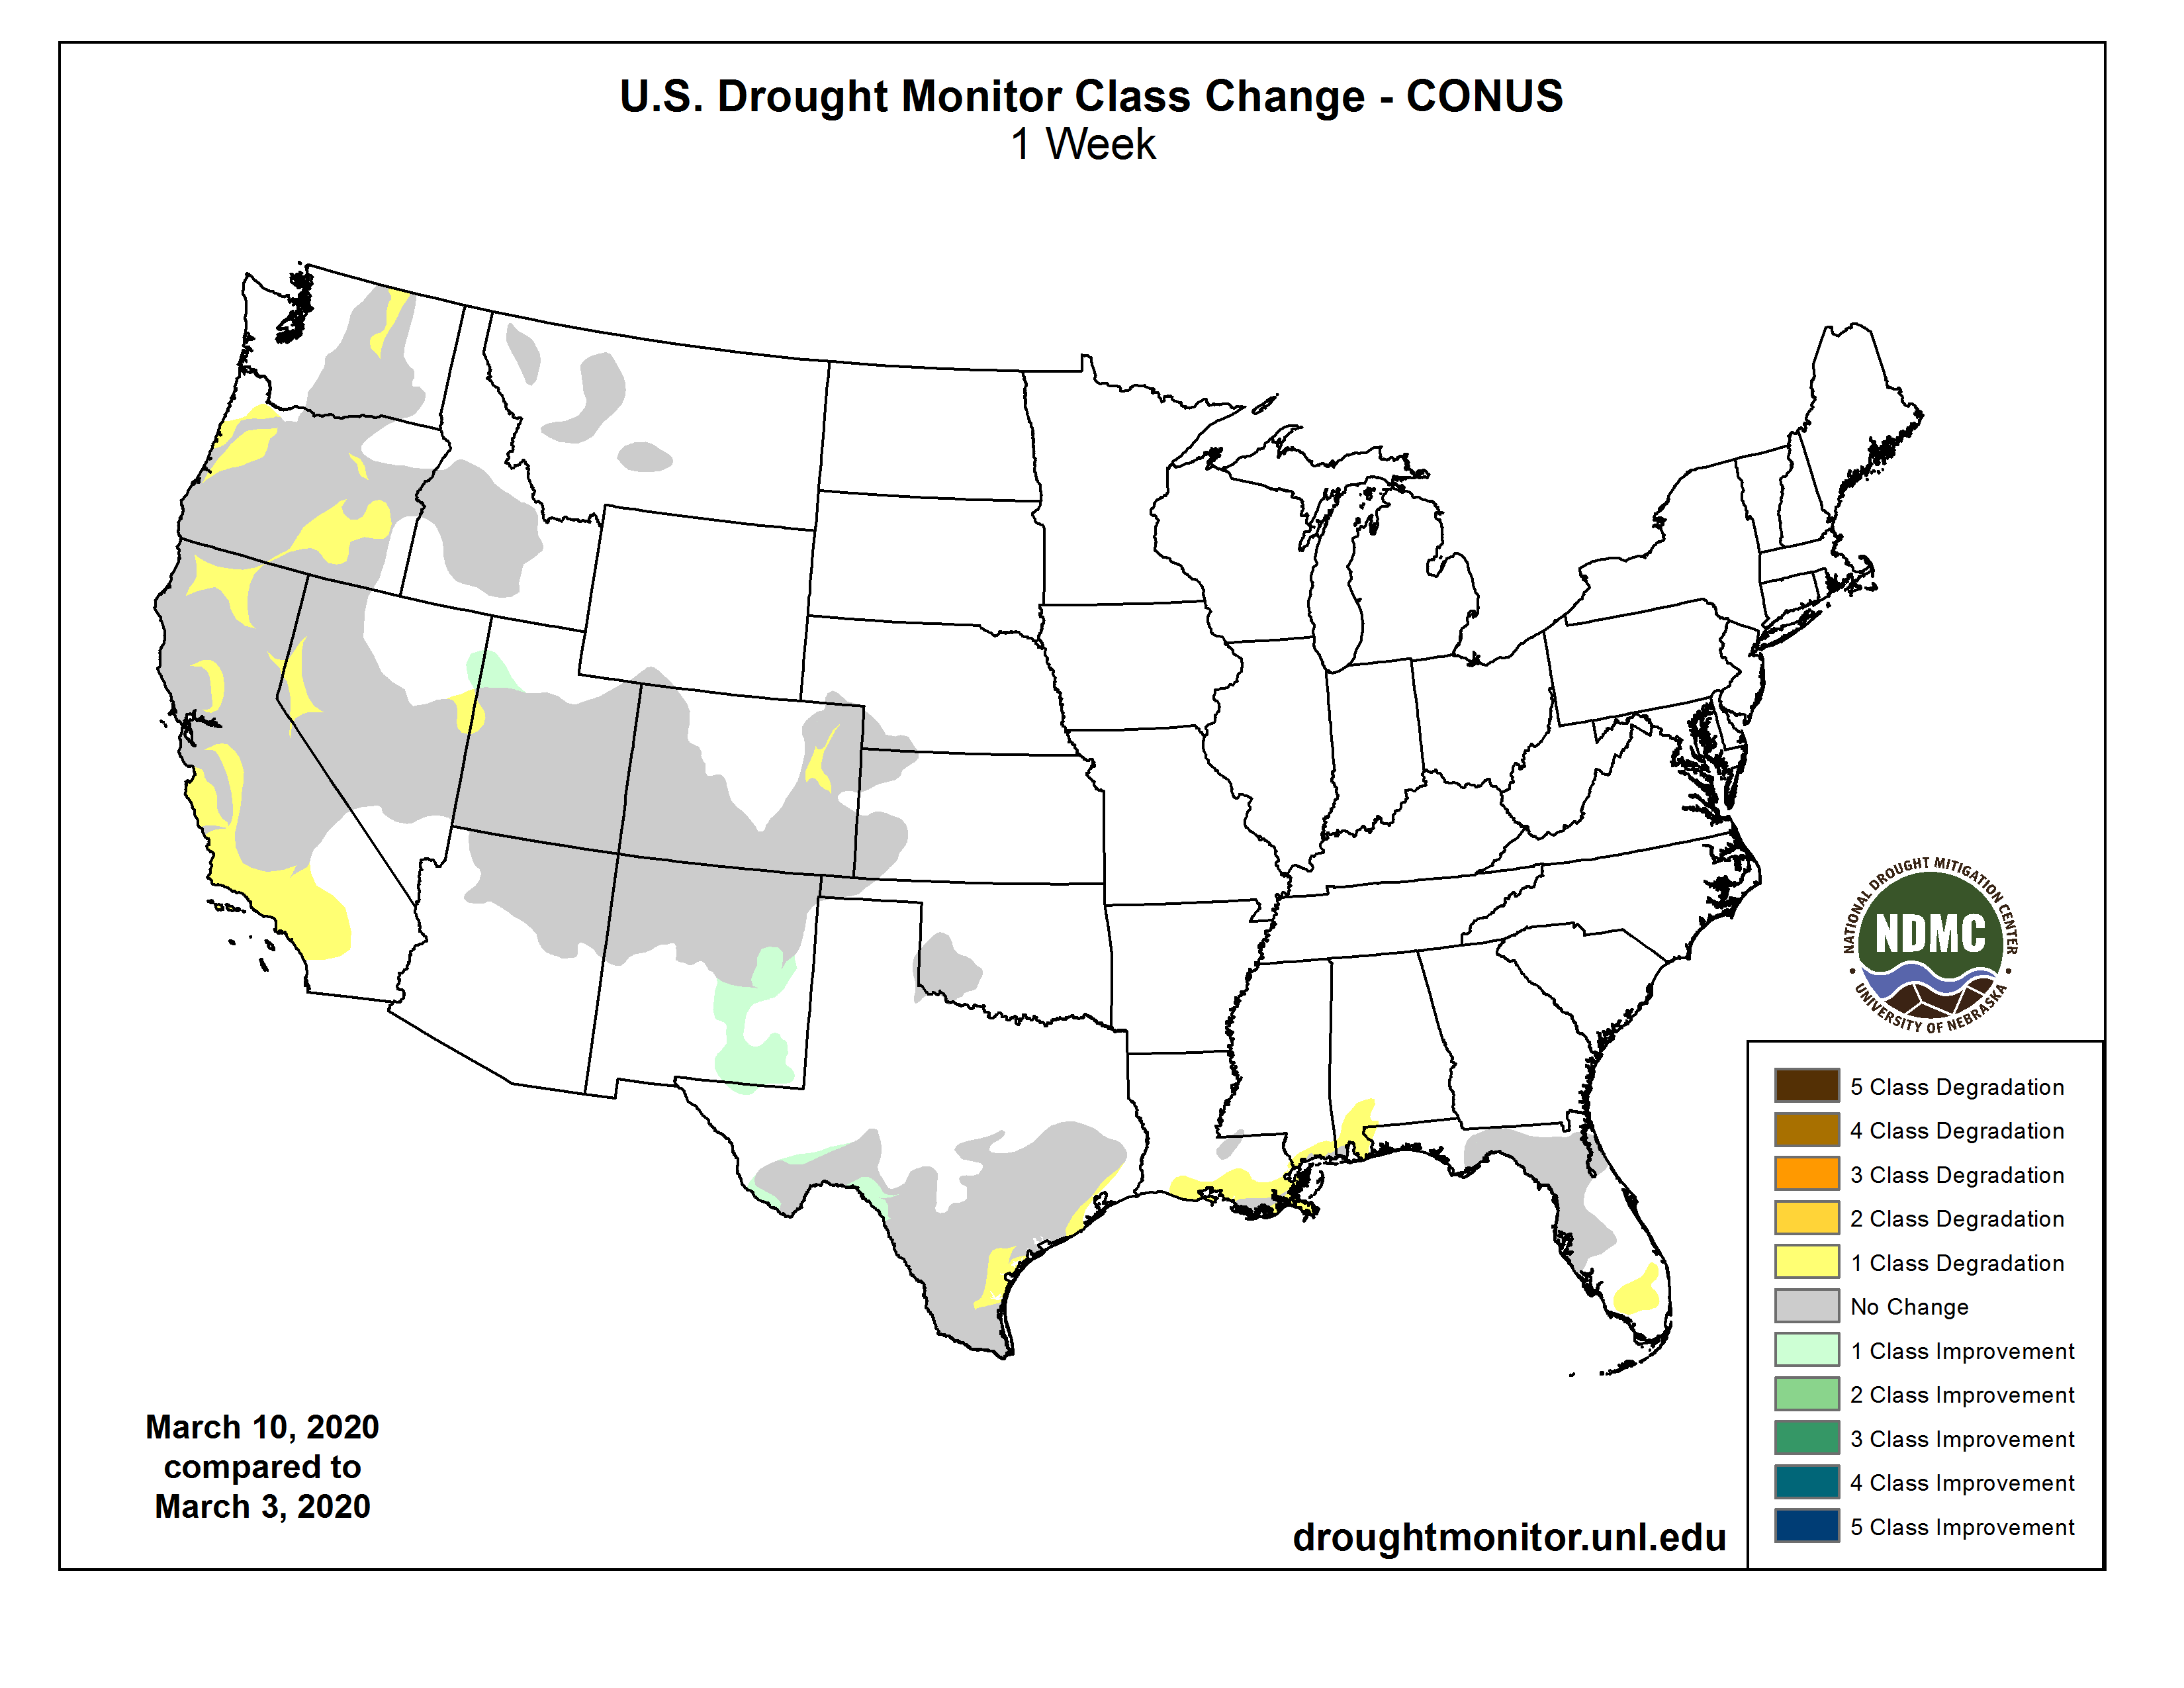
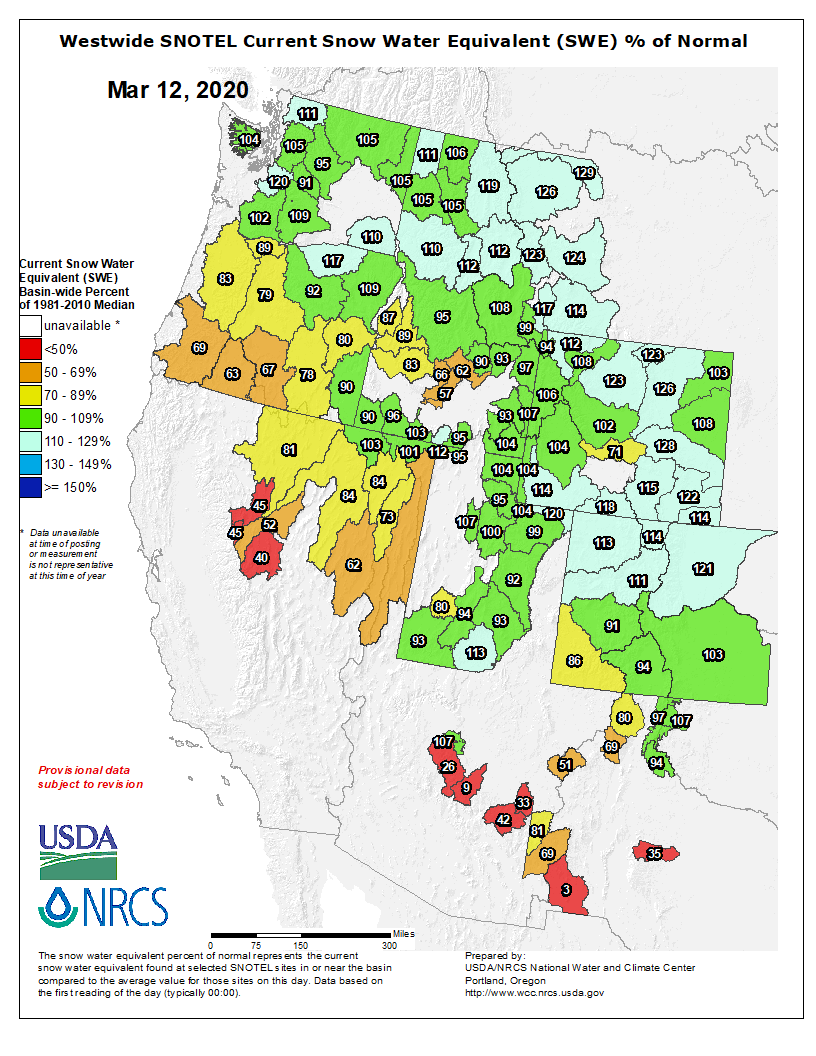
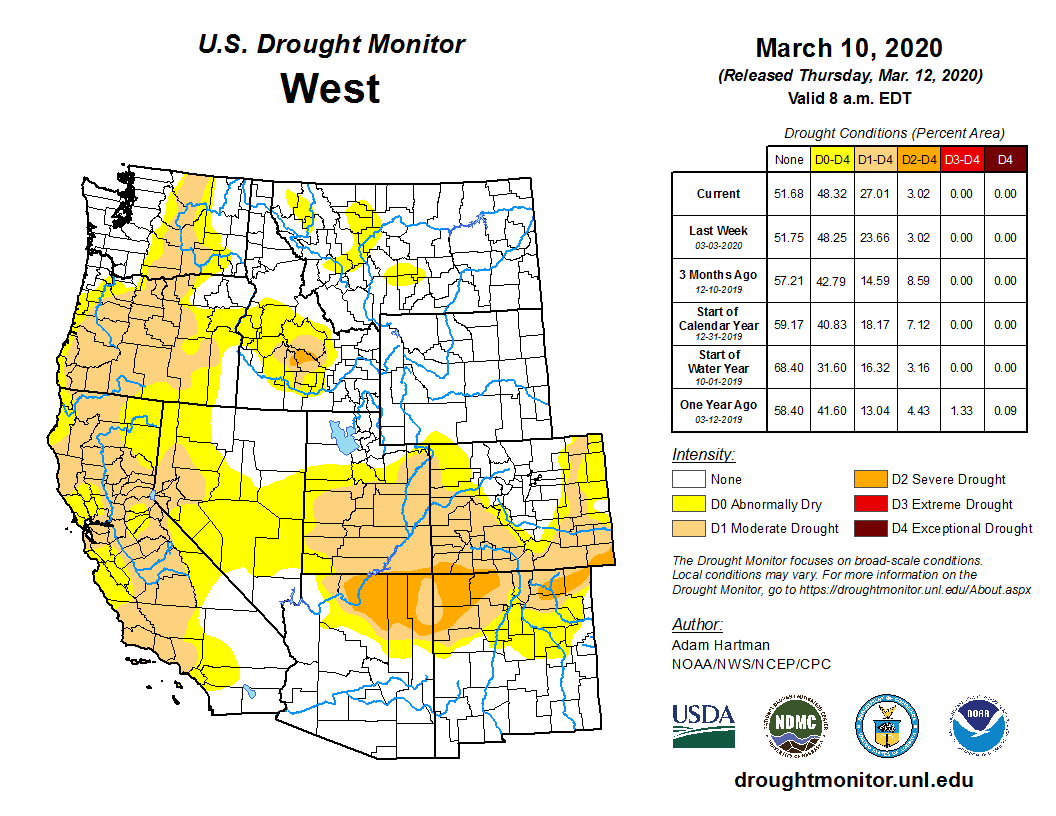
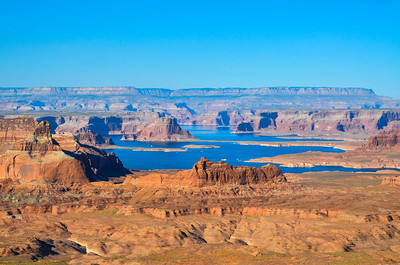
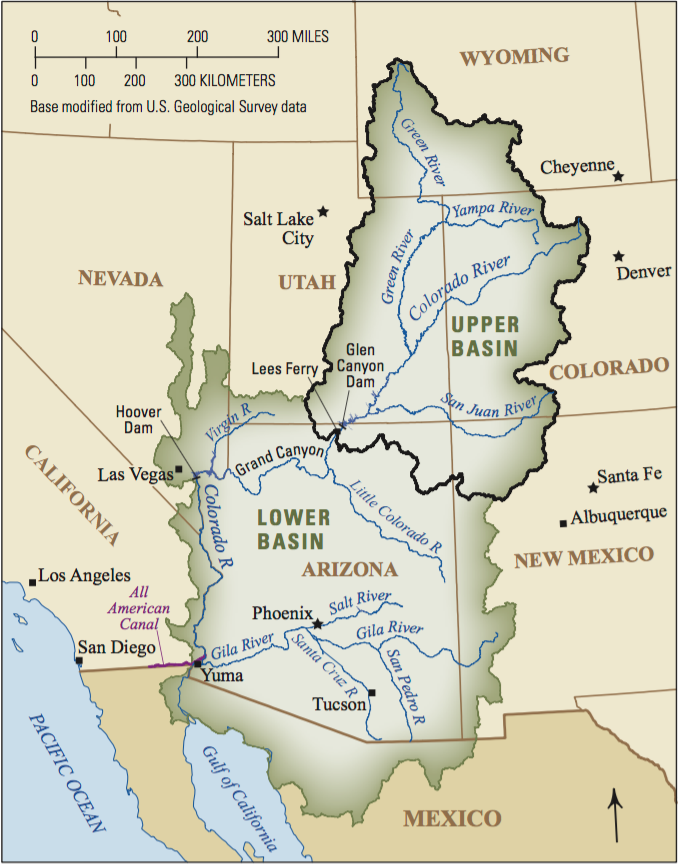

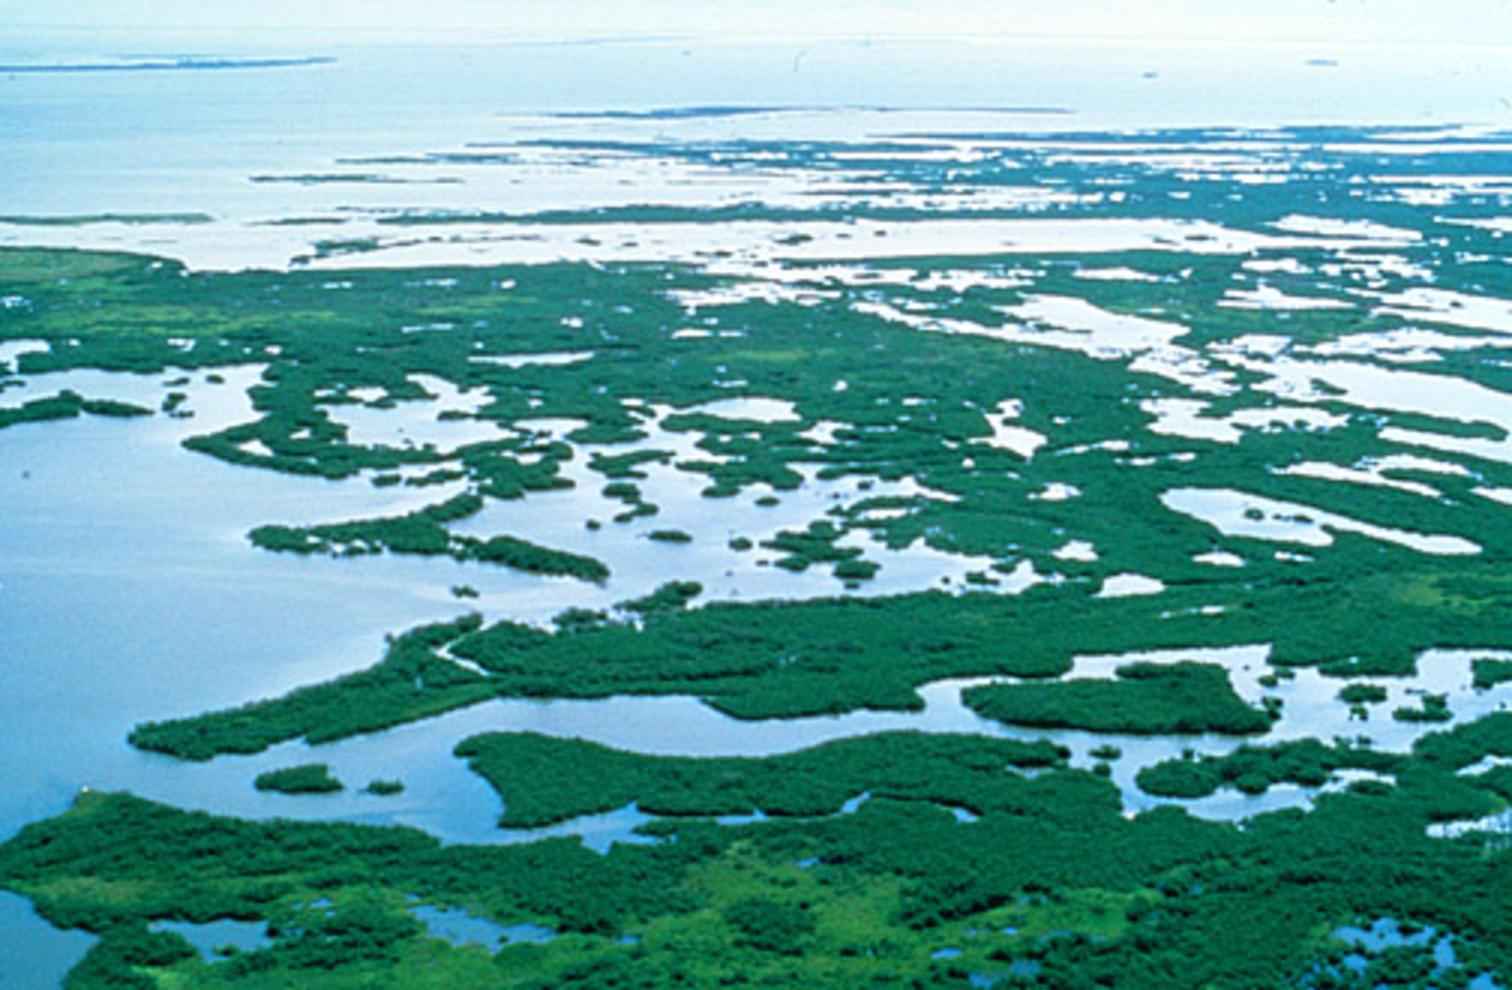
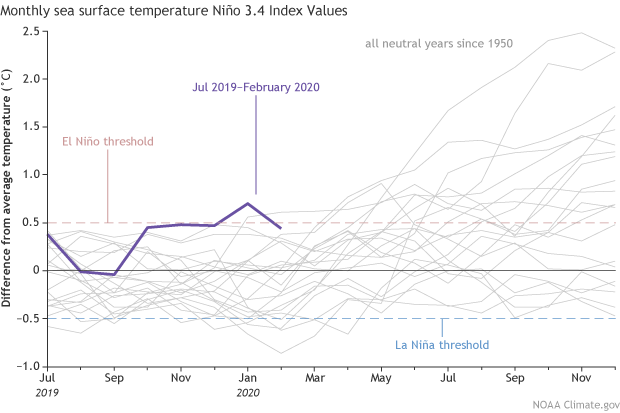
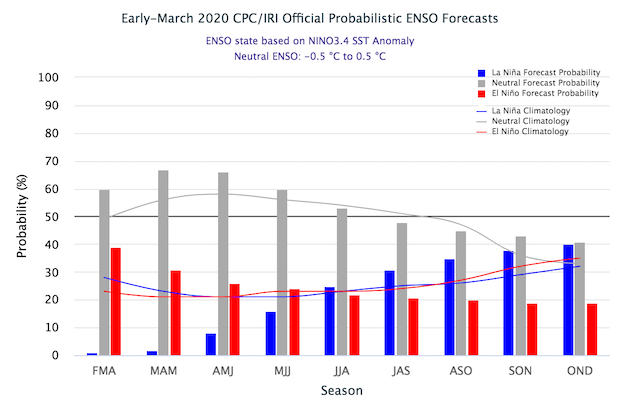
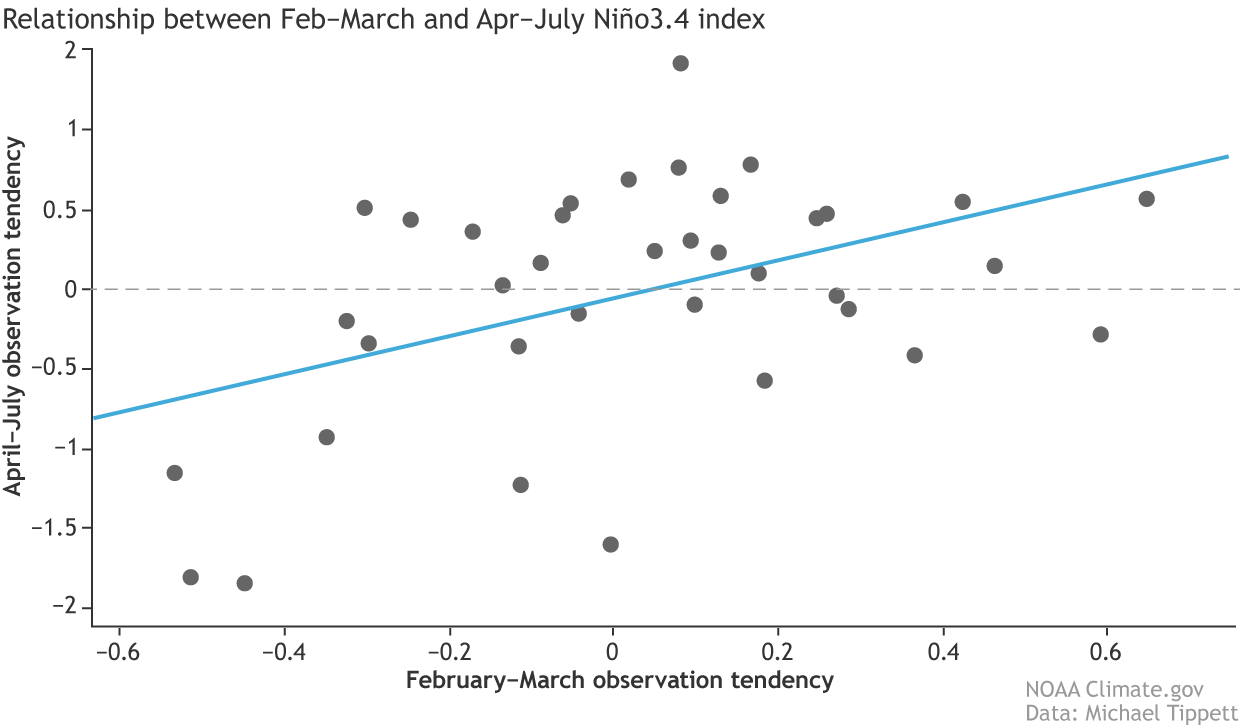

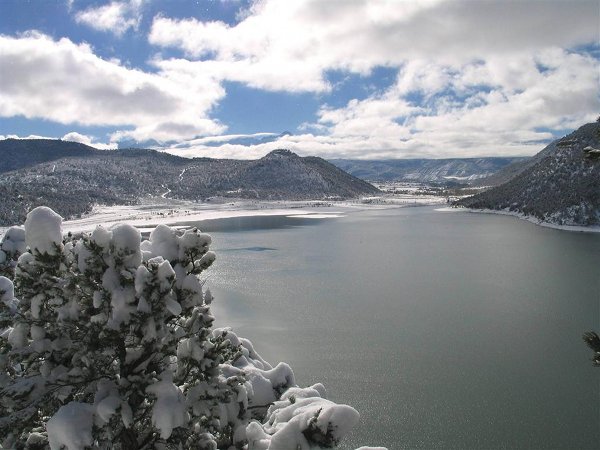


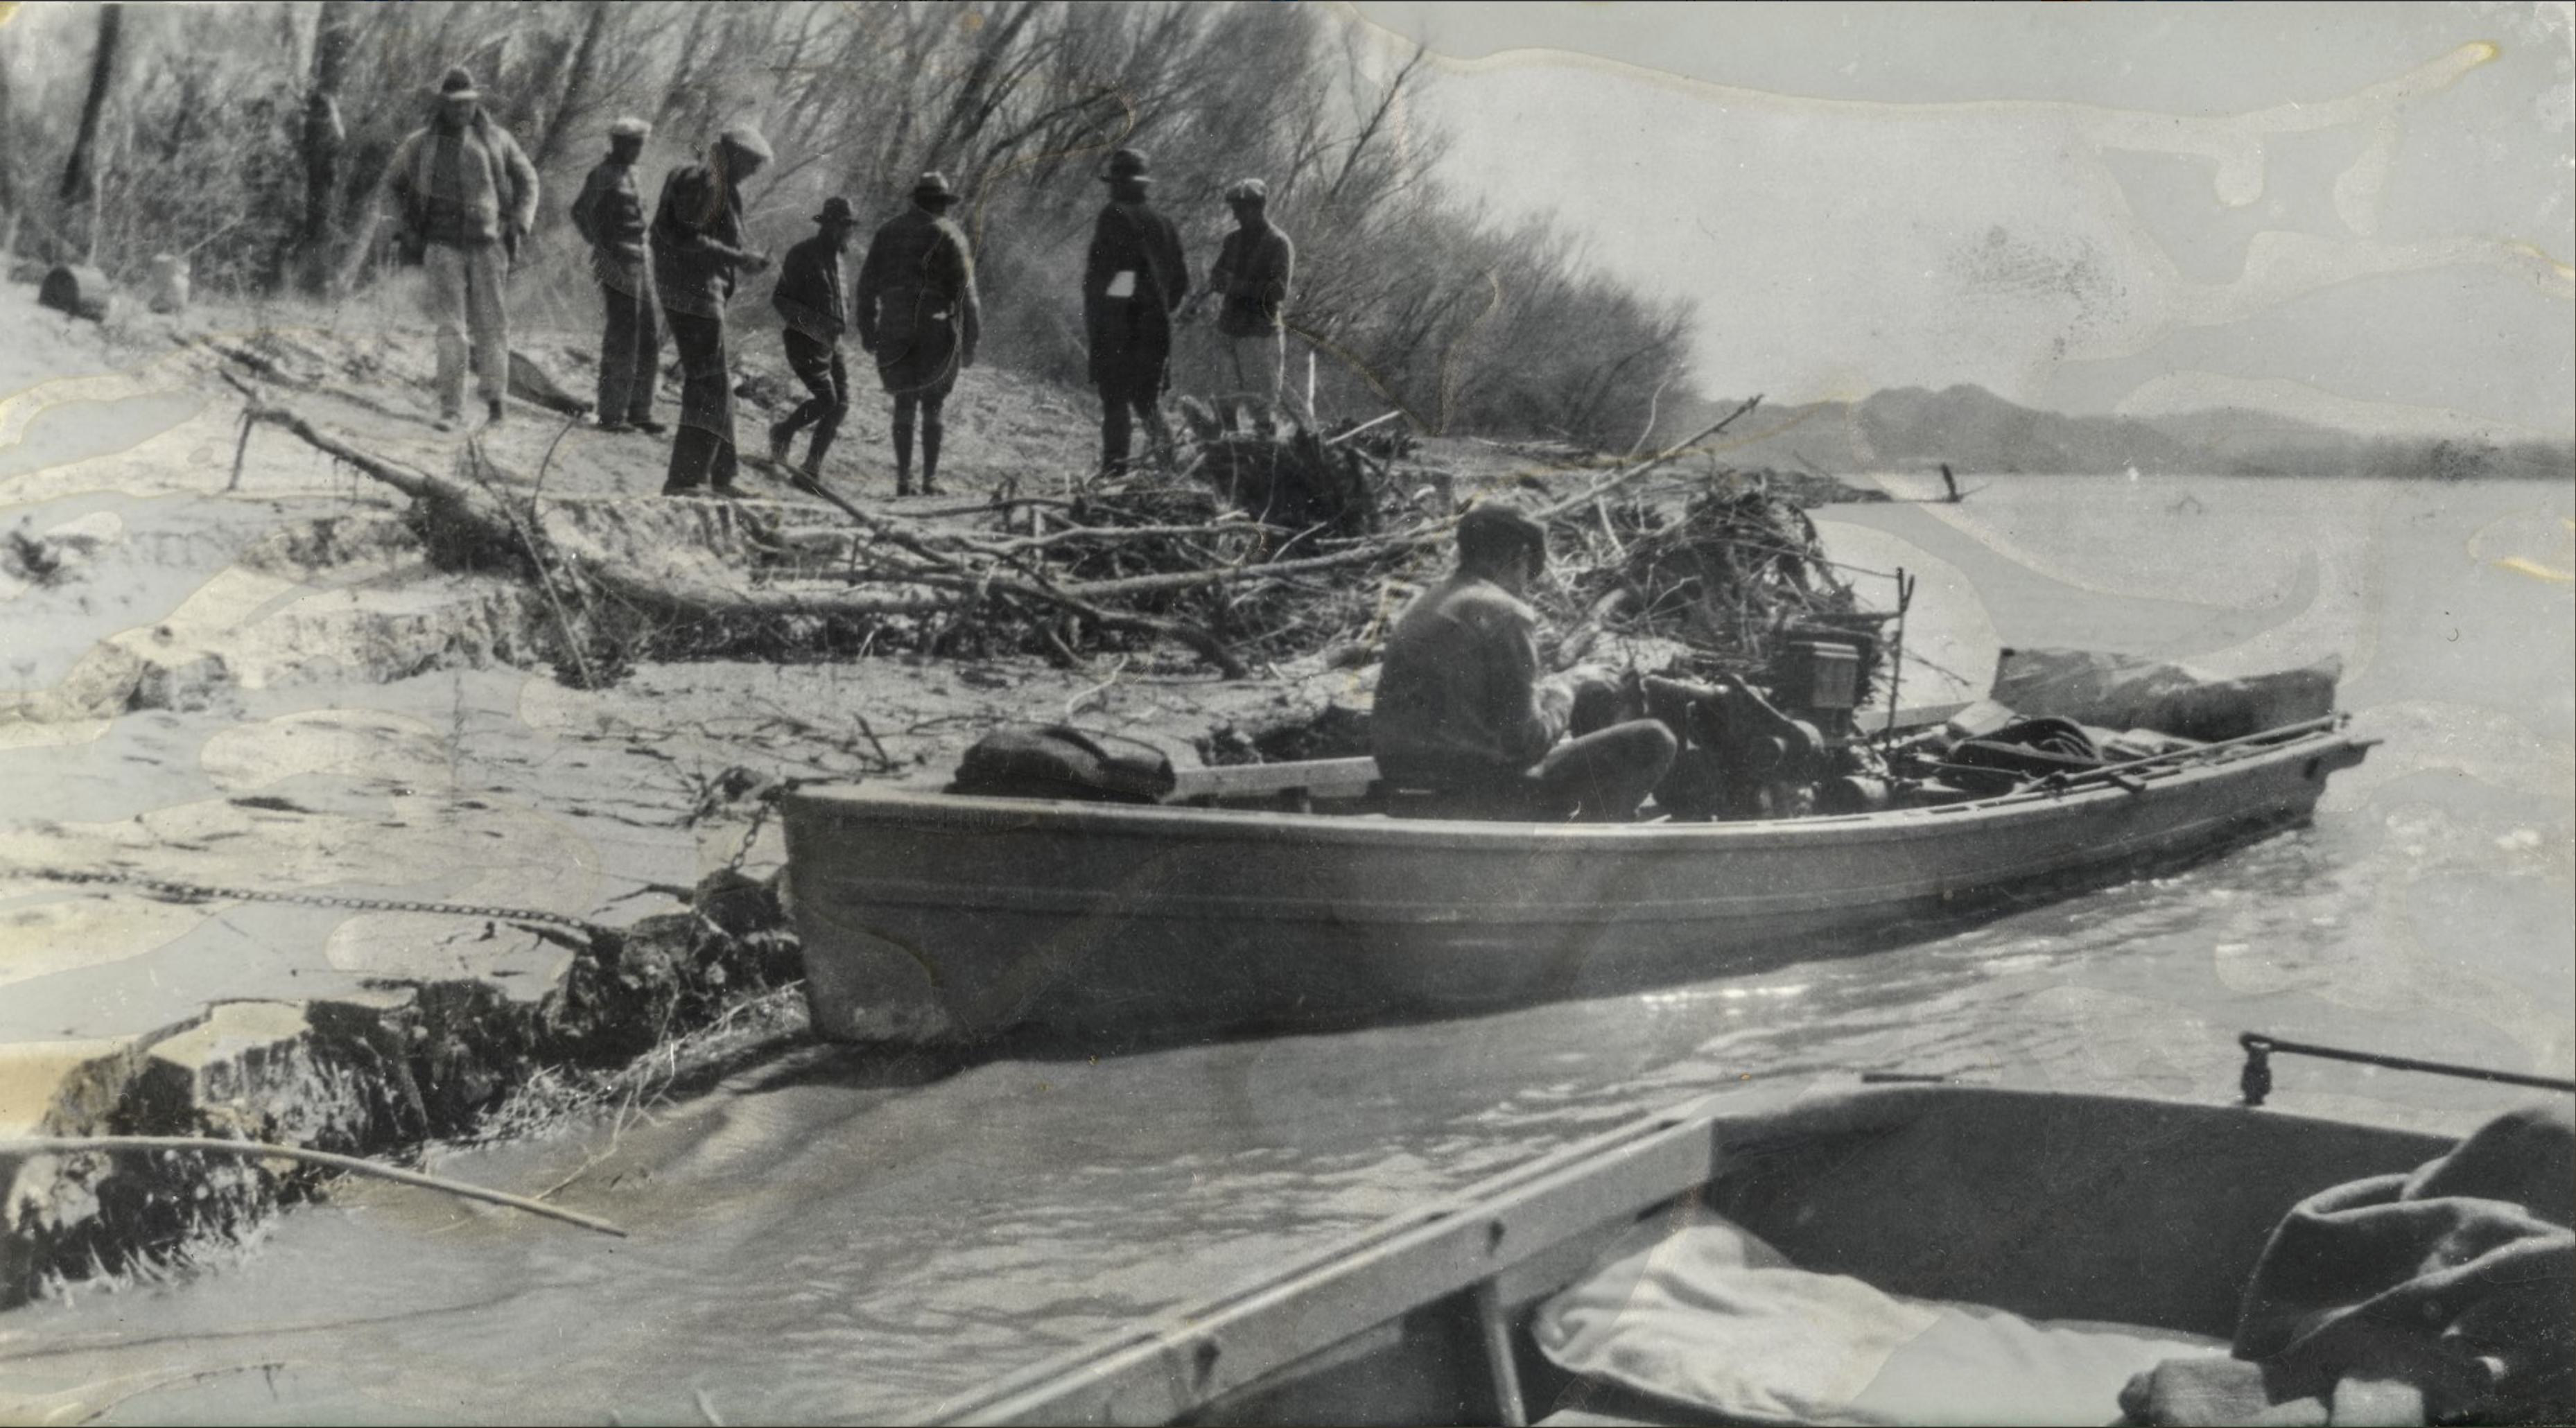


.jpg)