Click on a thumbnail graphic to view a gallery of snowpack data. The Basin High/Low graphs are from Friday morning, March 12, 2021.

Colorado snowpack basin -filled map March 14, 2021 via the NRCS.

Statewide Basin High/Low graph March 12, 2021 via the NRCS.

Arkansas River Basin High/Low graph March 12, 2021 via the NRCS.

Upper Colorado River Basin High/Low graph March 12, 2021 via the NRCS.

Gunnison River Basin High/Low graph March 12, 2021 via the NRCS.

Laramie and North Platte Basin High/Low graph March 12, 2021 via the NRCS.

Upper Rio Grande River Basin High/Low graph March 12, 2021 via the NRCS.

San Miguel, Dolores, Animas, and San Juan Basin High/Low graph March 12, 2021 via the NRCS.

South Platte River Basin High/Low graph March 12, 2021 via the NRCS.

Yampa and White Basin High/Low graph March 12, 2021 via the NRCS.
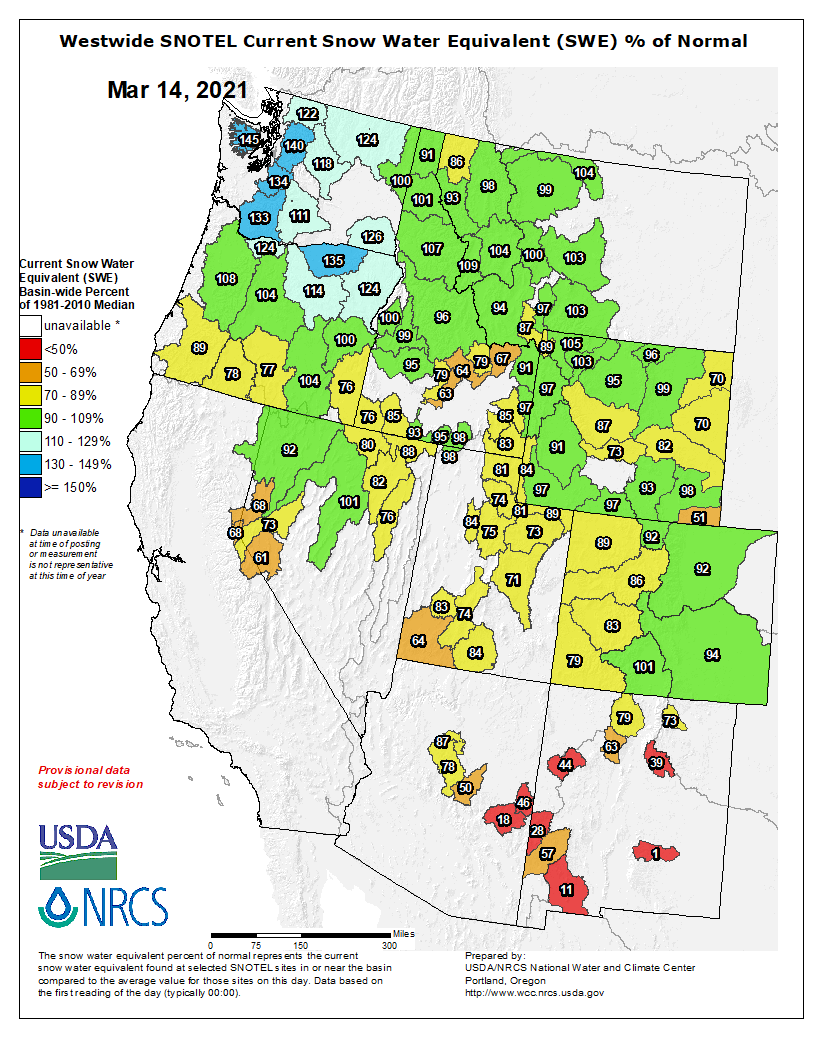
Here’s the Westwide SNOTEL basin-filled map for March 14, 2021 via the NRCS.