Last week, our team at NOAA National Centers for Environmental Information (NCEI) released the final update to its 2021 Billion-dollar disaster report (http://www.ncdc.noaa.gov/billions), confirming what much of the nation experienced throughout 2021: another year of frequent and costly extremes. The year came in second to 2020 in terms of number of disasters (20 versus 22) and third in total costs (behind 2017 and 2005), with a price tag of $145 billion.
2021 Highlights
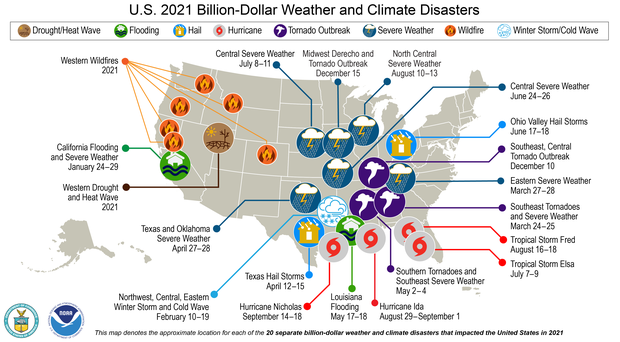
In 2021, the U.S. experienced 20 separate billion-dollar weather and climate disasters, putting 2021 in second place for the most disasters in a calendar year, behind the record 22 separate billion-dollar events in 2020. What really made 2021 stand out was the diversity of disasters:
1 winter storm/cold wave event (focused across the deep south and Texas);
1 wildfire event (combined impacts of wildfires across Arizona, California, Colorado, Idaho, Montana, Oregon and Washington);
1 drought and heat wave event (summer/fall across western U.S.);
2 flood events (in California and Louisiana);
3 tornado outbreaks (including the December tornado outbreaks);
4 tropical cyclones (Elsa, Fred, Ida and Nicholas); and
8 severe weather events (across many parts of the country, including the December Midwest derecho).
In 2021, the United States experienced record-smashing 20 weather or climate disasters that each resulted in at least $1 billion in damages. NOAA map by NCEI.
2021 was also unusually deadly, in that the 20 events of 2021 caused at least 688 direct or indirect fatalities—the most disaster-related fatalities for the contiguous U.S. since 2011 and more than double last year’s number of 262. In addition, these U.S. disasters also went late into the year, as December produced the Southeast, Central Tornado Outbreak (December 10); the Midwest Derecho and Tornado Outbreak (December 15); and the Marshall Fire in Boulder County, Colorado, on December 30.
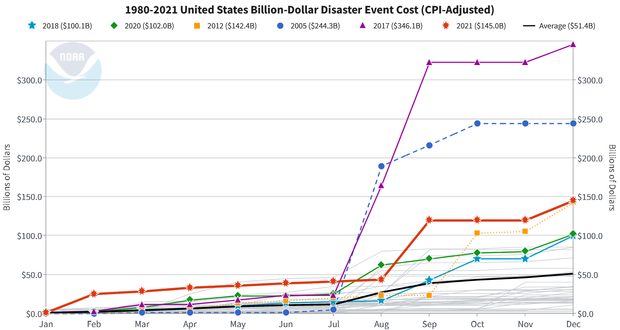
Month-by-month accumulation of estimated costs of each year’s billion-dollar disasters, with colored lines showing 2021 (red) and the previous top-5 costliest years. Other years are light gray. 2021 finished the year in third place for annual costs.
Damages from the 2021 disasters totaled approximately $145 billion. (All cost estimates are adjusted based on the Consumer Price Index, 2021). The costliest 2021 events were Hurricane Ida ($75 billion), the mid-February Winter Storm / Cold Wave ($24.0 billion), and the Western wildfires ($10.9 billion). Adding the 2021 events to the record that began in 1980, the U.S. has sustained 310 weather and climate disasters where the overall damage costs reached or exceeded $1 billion. The cumulative cost for these 310 events exceeds $2.15 trillion.
2021 costs in historical context
In broader context, the total cost of U.S. billion-dollar disasters over the last 5 years (2017-2021) is $742.1 billion, with a 5-year annual cost average of $148.4 billion, both of which are new records and nearly triple the 42-year inflation adjusted annual average cost. The U.S. billion-dollar disaster damage costs over the last 10-years (2012-2021) were also historically large: at least $1.0 trillion from 142 separate billion-dollar events.
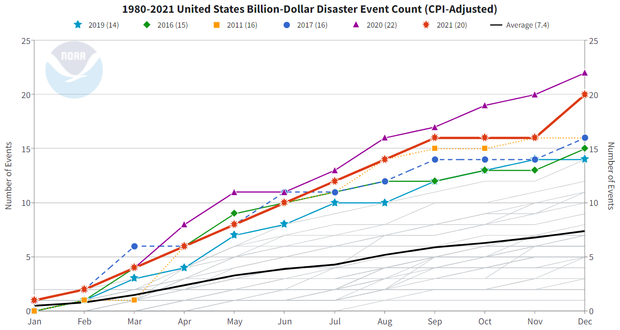
It is concerning that 2021 was another year in a series of years where we had a high frequency, a high cost, and large diversity of extreme events that affect people’s lives and livelihoods—concerning because it hints that the extremely high activity of recent years is becoming the new normal. 2021 (red line) marks the seventh consecutive year (2015-21) in which 10 or more separate billion-dollar disaster events have impacted the U.S. The 1980–2021 annual average (black line) is 7.4 events (CPI-adjusted); the annual average for the most recent 5 years (2017–2021) is 17.2 events (CPI-adjusted).
Month-by-month accumulation of billion-dollar disasters for each year on record. The colored lines represent the top 6 years for most billion-dollar disasters. All other years are colored light gray. NOAA image by NCEI.
Increasing trend of high-cost disasters: exposure, vulnerability and climate change influence on extremes
The number and cost of weather and climate disasters are increasing in the United States due to a combination of increased exposure (i.e., more assets at risk), vulnerability (i.e., how much damage a hazard of given intensity—wind speed, or flood depth, for example—causes at a location), and the fact that climate change is increasing the frequency of some types of extremes that lead to billion-dollar disasters (NCA 2018, Chapter 2).
It is important to keep in mind that these estimates do not reflect the total cost of U.S. weather and climate disasters, only those associated with events more than $1 billion in damages. That means they are a conservative estimate of how much extreme weather costs the U.S. each year. However, these billion-dollar events do account for the majority (>80%) of the damage from all recorded U.S. weather and climate events (NCEI; Munich Re), and they are becoming an increasingly larger percentage of the total damage costs from weather-related events at all scales and loss levels.
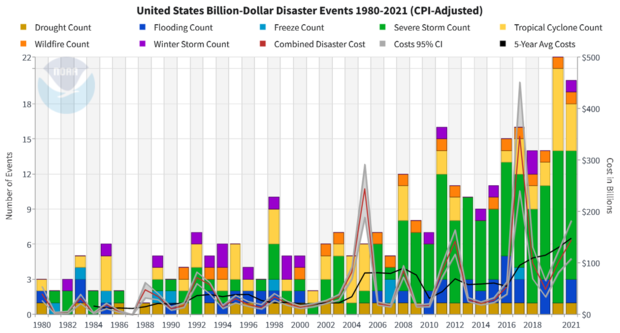
The history of billion-dollar disasters in the United States each year from 1980 to 2021, showing event type (colors), frequency (left-hand vertical axis), and cost (right-hand vertical axis.) The number and cost of weather and climate disasters is rising due to a combination of population growth and development along with the influence of human-caused climate change on some type of extreme events that lead to billion-dollar disasters. NOAA NCEI.
The historically large U.S. losses from hurricanes and wildfires over the last five years (2017-2021) have further skewed the total distribution of extreme weather costs. From 1980-2000, about 75% of all disaster-related costs were due to billion-dollar disasters, and by 2010, the percentage had risen to about 80%. By 2021, it had risen again to about 85% of all disaster-related costs, or $2.15 trillion out of $2.5 trillion.
The increase in population and material wealth over the last several decades, are an important cause for the rising costs. These trends are further complicated by the fact that much of the growth has taken place in vulnerable areas like coasts, the wildland urban interface or river floodplains. Vulnerability is especially high where building codes are insufficient for reducing damage from extreme events. This is part of the reason that the 2010s decade is far costlier than the 2000s, 1990s or 1980s (all inflation adjusted to 2021 dollars).
Screenshot of a table of summary statistics of billion-dollar disasters by decade and by latest 1, 3-, and 5-year periods.
However, climate change is also supercharging the increasing frequency and intensity of certain types of extreme weather that lead to billion-dollar disasters—most notably the rise in vulnerability to drought, lengthening wildfire seasons in the Western states, and the potential for extremely heavy rainfall becoming more common in the eastern states. Sea level rise is worsening hurricane storm surge flooding. (Read more about changes in climate and weather extremes in the U.S. National Climate Assessment.) Given all these compounding hazard risks, there is an increased need to focus on where we build, how we build, and investing in infrastructure updates that are designed for a 21st century climate.
Notable U.S. billion-dollar disasters of 2021
Among the many weather and climate-related disasters to affect the U.S. in 2021, the following caused the most damaging impacts and broke numerous records.
Hurricane Ida (August 2021): $75.0 billion, 96 deaths
Category 4 Hurricane Ida made landfall near Port Fourchon, Louisiana, with maximum sustained winds of 150 mph (240km/h) and a minimum central pressure of 930 millibars. Ida was one of three hurricanes in recorded history to make landfall in Louisiana with 150 mph winds, along with Hurricane Laura in 2020 and the ‘Last Island’ hurricane of 1856. Grand Isle, Louisiana took a direct hit with 100% of its homes damaged and nearly 40% were destroyed. There was heavy damage to the energy infrastructure across southern Louisiana causing widespread, long-duration power outages to millions of people. Parts of New Orleans were without power for nearly a week.
As the remnants of Ida moved into the Northeast it merged with a second weather system, creating severe weather and flash flooding across a wide region from eastern Pennsylvania to New York. Flash flood emergencies were declared in New Jersey and New York for the first time. The floods caused dozens of fatalities, and damaged homes, businesses, vehicles, and infrastructure. 2021 was the fifth consecutive year (2017-2021) that the U.S. has been impacted by a slow-moving tropical cyclone that produced extreme rainfall and damaging floods: Harvey, Florence, Imelda, Sally, and Ida.
An historic cold wave and winter storm impacted many northwest, central, and eastern states in February 2021. Temperature departures exceeding 40.0 degrees F (22.2 degrees C) below normal occurred from Nebraska southward to Texas. The prolonged Arctic air caused widespread power outages in Texas, as well as other southern states, with multiple days of sustained below-freezing temperatures. At the peak of the outage, nearly 10 million people were without power. Additional impacts were frozen water pipes, which burst upon thawing causing water damage to buildings.
These extreme conditions also caused or contributed to the direct and indirect deaths of more than 210 people in Texas alone. There were also snow and ice impacts across numerous states including Oklahoma, Arkansas, Missouri, Illinois, Kentucky, Tennessee, Louisiana, Mississippi, Colorado, Oregon, and Washington. The February event is now the costliest U.S. winter storm event on record, more than doubling the inflation-adjusted cost of the ‘Storm of the Century’ that occurred in March 1993.
Western Wildfire Season (2021): $10.6 billion, 8 deaths
Severe drought conditions and periods of extreme heat provided conditions favorable for another demanding western wildfire season, most focused across California, Oregon, Washington, Idaho, and Montana. The Dixie Fire consumed over 960,000 acres making it the second-largest wildfire on record in California, while also destroying more than 1,000 structures. California’s Caldor Fire grew rapidly during August, threatening South Lake Tahoe communities and burned over 220,000 acres.
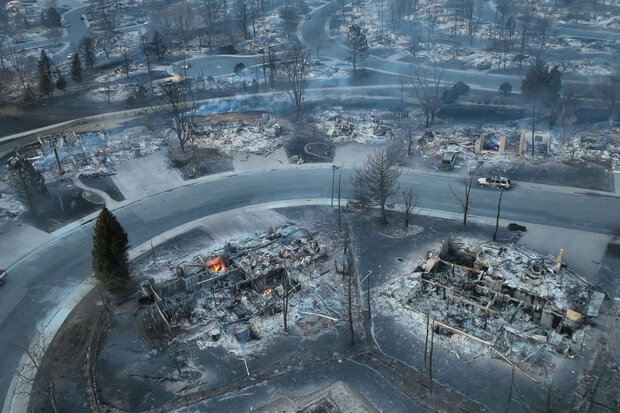
The Marshall Fire left smoldering ruins in a Louisville, Colorado, neighborhood, at the end of December 2021. Photo courtesy WXChasing. Used with permission.
Other large wildfires include the Ford Corkscrew Fire (Washington), the Bootleg Fire (Oregon), the Boundary Fire (Idaho), the Trail Creek Fire (Montana) and the Telegraph Fire (Arizona), among many others. There was also the Marshall Fire in Boulder County, Colorado on December 30 that damaged or destroyed more than 1,000 homes and businesses. This wildfire is the most destructive on record in Colorado. Throughout the wildfire season, air quality was also a concern across numerous states, as ash and fine particulates from many wildfires hid the skies and made outdoor activities more hazardous. Over 7.1 million acres have burned nationally during the 2021 wildfire season.
Historic Heat Wave (June-July 2021) and Persistent Western Drought: $8.9 billion, 229 deaths
Western drought conditions were persistent throughout 2021, as the drought expanded and intensified across many Western states. A historic heat wave also developed for many days across the Pacific Northwest shattering numerous all-time high temperature records across the region. This prolonged heat dome was maximized over the states of Oregon and Washington and extended well into Canada.
Daytime high temperatures across the western United States on June 23-28, 2021, according to data from NOAA’s Real-Time Mesoscale Analysis/URMA. Climate.gov animation based on NOAA URMA data.
hese extreme temperatures impacted several major cities and millions of people. For example, Portland reached a high of 116 degrees F while Seattle reached 108 degrees F. These extreme temperatures caused hundreds of direct and indirect heat-related fatalities across Oregon and Washington. This combined drought and heat rapidly dried out vegetation across the West, impacting agriculture. Low water levels also forced the hydroelectric power plant at Lake Oroville in California to shut down for the first time since it opened in 1967.
1980-2021 costs and fatalities by disaster type
The distribution of damage from U.S. billion-dollar disaster events from 1980 to 2021 is dominated by tropical cyclone losses. Tropical cyclones have caused the most damage ($1,148.0 billion) and have the highest average event cost ($20.5 billion per event). Drought ($285.4 billion), severe storms ($330.7 billion), and inland flooding ($164.2 billion) have also caused considerable damage based on the list of billion-dollar events.
Severe storms have caused the highest number of billion-dollar disaster events (143), but they have the lowest average event cost ($2.3 billion). Tropical cyclones and flooding represent the second and third most frequent event types (56 and 35), respectively. Tropical cyclones are responsible for the highest number of deaths (6,697), followed by drought/heatwave events (4,139) and severe storms (1,880).
This table shows the breakdown, by hazard type, of the 310 billion-dollar weather and climate disasters assessed since 1980. Screenshot from the NOAA NCEI Billion-dollar Disasters webpage.
Climatology of billion-dollar disasters
Disasters by region
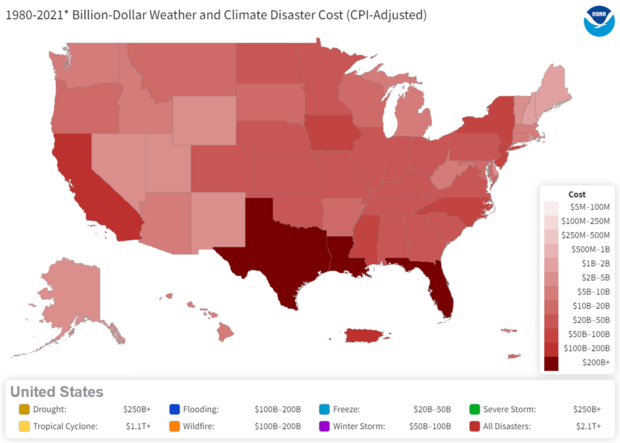
The South, Central and Southeast regions of the U.S., including the Caribbean U.S. territories, have suffered the highest cumulative damage costs, reflecting the severity and widespread vulnerability of those regions to a variety of weather and climate events. In addition to the highest number of billion-dollar disasters experienced, Texas also leads the U.S. in total cumulative costs (~$343 billion) from billion-dollar disasters since 1980. Florida is the third-leading state in total costs since 1980 (~$248 billion), largely the result of destructive hurricane impacts.
This map depicts the total estimated cost borne by each state from billion-dollar weather and climate events from 1980-2021.
Louisiana’s total costs passed Florida’s in 2021 and are now the 2nd highest total costs (~$270 billion) from billion-dollar disasters–eclipsing Florida this year with the impacts from Ida. Louisiana, like Texas, also suffers from a high frequency of disaster events, which often leads to a compounding, cascading series of socioeconomic impacts. 2021 is no exception as Louisiana was impacted by another category 4 hurricane (Ida) one year after category 4 Hurricane Laura. Louisiana also continues to recover from several different tropical cyclones that caused widespread damage during the 2020 hurricane season. It is also important to note that Louisiana has a much smaller population and economy than either Texas or Florida. Therefore, the relative cost and impact from extremes in Louisiana are more severe and recovery is more difficult.
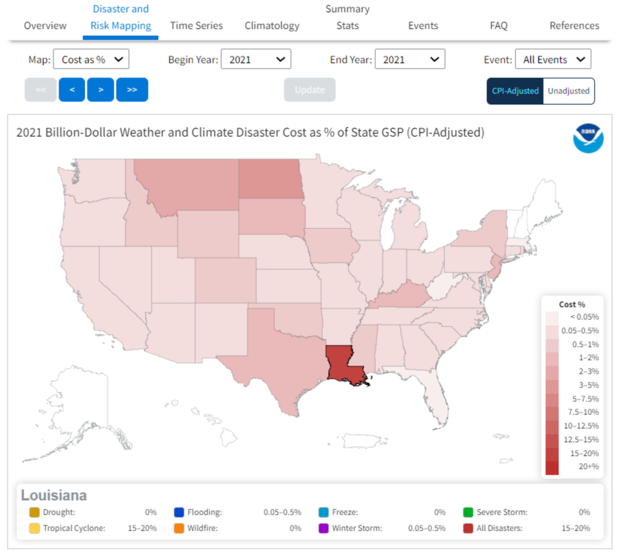
Screenshot of a map the US showing billion-dollar disasters costs as a percentage of each state’s gross domestic product (GDP) over the historical record from 1980-2021.
Another way to examine damage is to compare each state’s annual disaster losses relative to their Gross State Product (GSP), which represents economic output. The damage costs from Hurricane Ida across Louisiana were impactful during 2021 reflecting 15-20% of Louisiana’s 2021 economic output (GSP). Several other states across the Nation also sustained relatively large hazard impacts from other extremes including drought, wildfire, flooding and tornadoes.
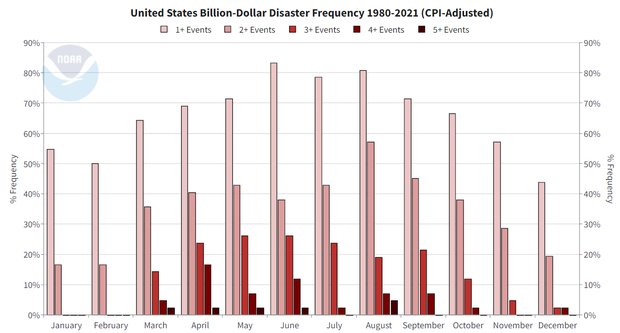
Billion-dollar disasters by month
The 42-year climatology of U.S. billion-dollar disasters offers a view of risk from extreme events, which are often seasonal in nature. For example, during the spring months (March-May) severe storms including tornadoes, hail, and high winds often occur in many Central and Southeast states. During the spring months there is also potential for major river flooding (i.e., deep blue events in chart above). U.S. springtime flooding from snowmelt and/or heavy rainfall is a persistent hazard that affects many towns and agriculture regions within the Missouri and Mississippi River basins, among others.
During the fall season, Gulf and Atlantic coast states must be vigilant about hurricane season particularly during August and September (i.e., yellow events in chart above). Hurricanes are the most destructive and costly of these events totaling damage losses exceeding $1 trillion since 1980. For example, in 2016-2018, the U.S. was impacted by 6 separate billion-dollar hurricanes (i.e., Matthew, Harvey, Irma, Maria, Florence, Michael) with 3,318 fatalities and an inflation-adjusted loss total of $365.1 billion. As a comparison, the U.S. also experienced a series of active hurricane seasons from 2003-2005 where 9 separate billion-dollar hurricanes (e.g., Charley, Ivan, Katrina, Rita, Wilma, etc.) made landfall, with 2,225 fatalities and an inflation-adjusted loss total of $329.9 billion.
The monthly climatology of U.S. billion-dollar weather and climate disasters from 1980 to 2021, showing which months have the greater frequency of disasters (height of bar) and which types of events (colors) are most likely to occur in a given month. NOAA NCEI
Also, the peak of the Western U.S. wildfire season occurs during the fall months of September, October and November (i.e., orange events in chart above). California, Oregon, Washington, Idaho, Montana and Colorado often experience enhanced wildfire risk and related poor air quality for weeks to months. Western wildfire risk is also becoming more hazardous, as 17 of the 20 largest California wildfires by acreage and 18 of the 20 most destructive wildfires by # of buildings destroyed have occurred since the year 2000. In four of the last five years (2017, 2018, 2020 and 2021) California has experienced historically large and costly wildfires with losses well exceeding $50.0 billion.
In total, each region of the U.S. faces a unique combination of recurring hazards, as billion-dollar disaster events have affected every state since 1980. The chart above highlights how the frequency of billion-dollar disasters differs across both time and space. The combined historical risk of U.S. severe storms and river flooding events places the spring and summer seasons in the high-risk category for simultaneous extreme weather and climate events. Hurricane, wildfire and drought impacts dominate the Fall season. The Winter months are also sometimes active with the potential for many types of extreme events and impacts, as we saw in 2021.
Billion-dollar weather and climate disasters occur in all months, but the spring and summer (March–Aug) are the time when multiple, concurrent disasters are likely. A second maximum occurs in the Fall driving by tropical cyclones. Screenshot from the NCEI Billion-dollar Disasters webpage.
he increase in disasters create ‘compound extremes’ (e.g., billion-dollar disaster events that occur at the same time or in sequence), which are also an increasing problem for recovery. As noted in National Climate Assessment (2017) “the physical and socioeconomic impacts of compound extreme events (such as simultaneous heat and drought, wildfires associated with hot and dry conditions, or flooding associated with high precipitation on top of snow or waterlogged ground) can be greater than the sum of the parts.” For example, in 2021 California experienced drought-enhanced wildfire seasons that produced wildfires and mountain-side burn scars, followed by atmospheric rivers of heavy rainfall that enhanced landslides and flooding.
Mapping County Level Hazard Risk, Vulnerability, and Projected Future Impacts
To better reflect multi-hazard risk – the Billion-dollar disaster site now provides a mapping tool that provides county-level information on natural disaster hazards across the United States. This interactive NOAA mapping tool provides detailed information on a location’s susceptibility to weather and climate hazards that can lead to billion-dollar disasters—such as wildfires, floods, drought and heat waves, tornado outbreaks, and hurricanes. The tool expands upon FEMA’s National Risk Index to provide a view of a location’s risk for, and vulnerability to, single or multiple combinations of weather and climate hazards for every county and county-equivalent in all 50 states, and the District of Columbia: https://www.ncdc.noaa.gov/billions/mapping
Federal forest management dates back to 1876 when Congress created the office of Special Agent in the U.S. Department of Agriculture to assess the quality and conditions of forests in the United States. In 1881 the Department expanded the office into the Division of Forestry. A decade later Congress passed the Forest Reserve Act of 1891 authorizing the President to designate public lands in the West into what were then called “forest reserves.” Responsibility for these reserves fell under the Department of the Interior until 1905 when President Theodore Roosevelt transferred their care to the Department of Agriculture’s new U.S. Forest Service. Gifford Pinchot led this new agency as its first Chief, charged with caring for the newly renamed national forests.
From The University of Colorado (Kelsey Simpkins):
When the 2022 Winter Olympics kick off in and around Beijing, China, this Friday it will mark the first time in the history of the Winter Games that outdoor events rely almost entirely on artificial snow.
The mountains 100 miles north of the city, where ski and snowboarding events will be held, only receive about 7 to 8 inches of snow annually, so reliance on artificial snow was part of the picture when Beijing was selected to host. But recent estimates that it will take 49 million gallons of water to support snowmaking for the two-week event have some criticizing its environmental impacts. Meanwhile, a new 2022 report asserts that conditions created by artificial snow can be unpredictable and dangerous for athletes.
Noah Molotch, associate professor of geography and co-director of the Mountain Hydrology Group at the Institute of Arctic and Alpine Research (INSTAAR), studies the distribution of snow in mountains around the world. CU Boulder Today spoke with Molotch about the science of human-made snow, its use at the Olympics, and how climate change may impact the future of snow sports around the world and right here in Colorado.
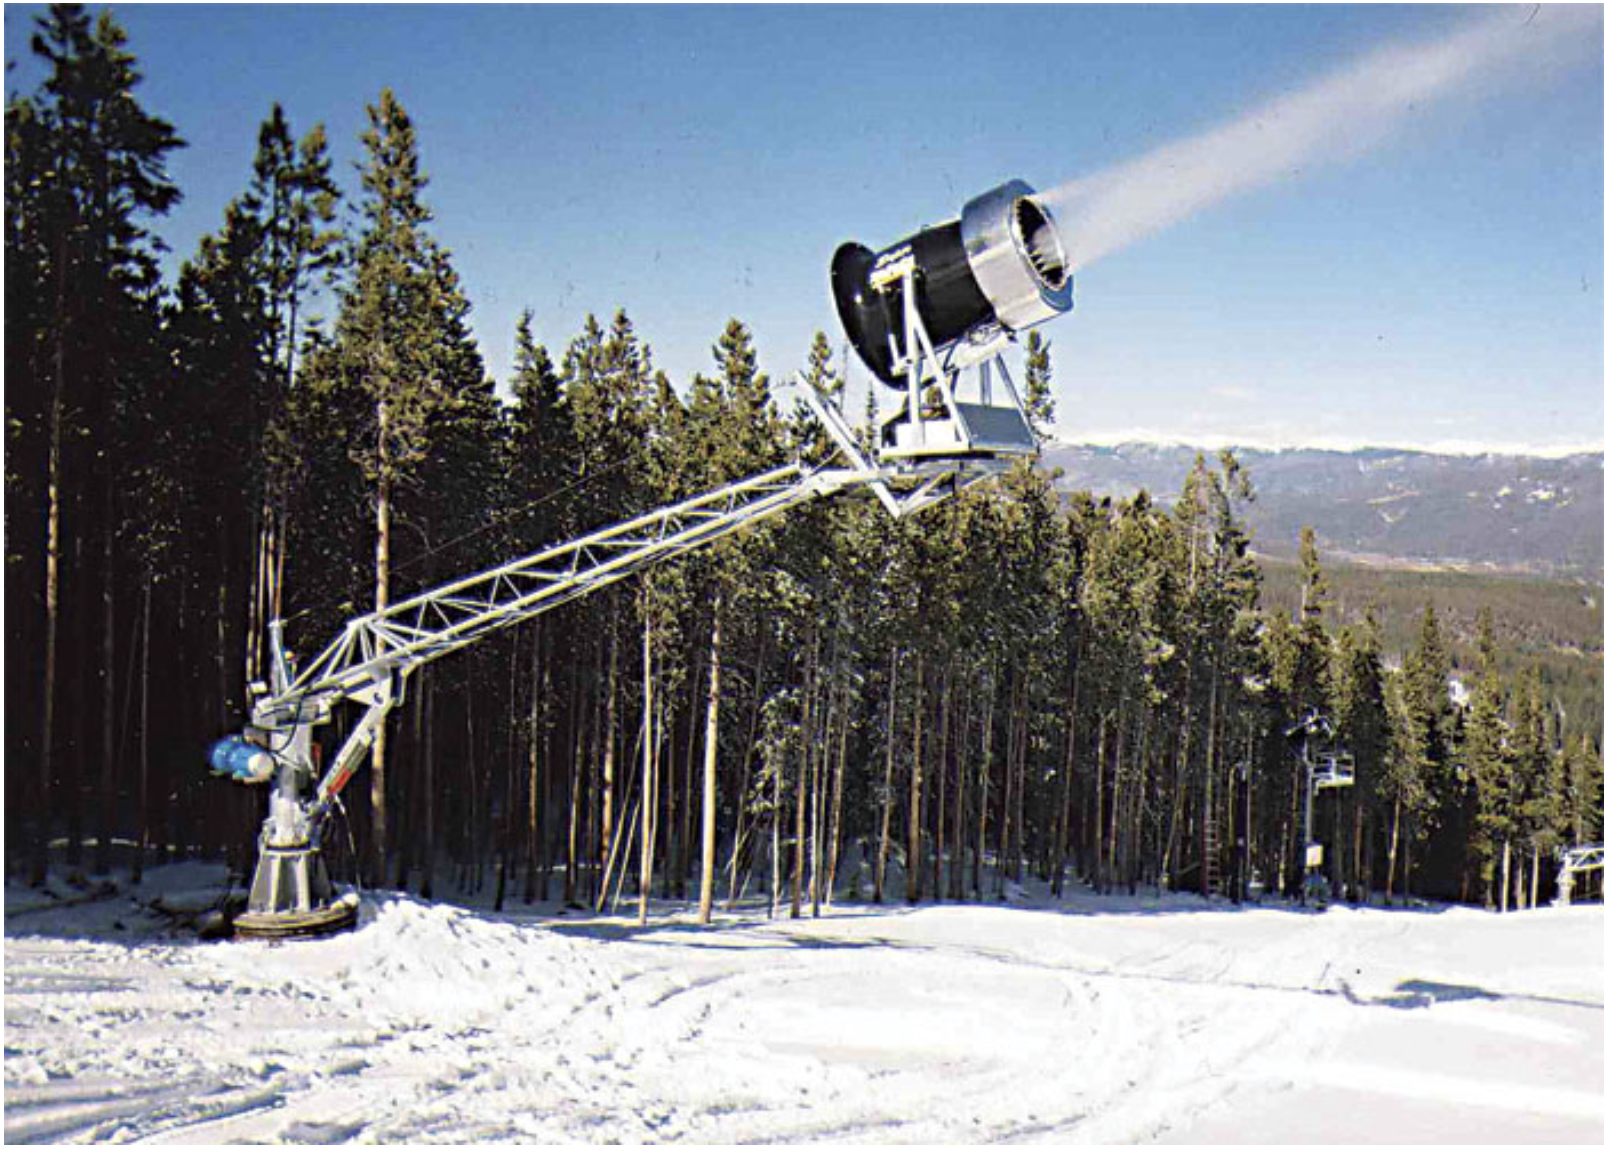
Snowmaking. Photo credit: Allen Best
What is artificial snow made of?
Human-made snow is a replication of how snow forms naturally in the atmosphere. It requires compressed air, water and some type of small particle, known as a nucleating agent, for the ice crystal to form on, similar to how natural snow is formed. Other than that, the only weather conditions needed are relatively cold air temperatures, right around the freezing point (32 degrees Fahrenheit).
Why is artificial snow useful for ski resorts?
Ski resorts use it to augment natural snowfall. It’s denser than natural snowfall and it’s more cohesive, so it sticks together more effectively than natural snow once it’s on the ground. As a result, it creates pretty firm snow on ski runs, and that can be good for ski resorts that want to cover all the obstacles on the mountain. Then the natural snow that falls on top has a nice solid base to accumulate on. But it’s expensive to make: So most of the resorts in Colorado primarily do their snow making in the fall, or only until they get all the terrain open.
Do people like skiing on human-made snow?
In general, most recreational skiers don’t really like to ski on human-made snow because it’s so firm and icy. But because of that firmness and how icy it is, it’s actually really good for ski racing.
How is snow a factor in who gets to host the Winter Olympics?
It has to take place near a metropolitan area because of ice skating and all the other events that need the infrastructure of a metro area. Depending on what country the Olympics are in, that can put it at odds with proximity to mountains that get a lot of natural snowfall.
The last time the Winter Olympics were in the United States it was in Salt Lake City, which is famous for its natural snowfall. But when you look at places like Sochi, which hosted the Olympics in 2014, and the locations near Beijing [Zhangjiakou and Yanqing] that are going to host the alpine skiing events this winter, they are actually famous for their lack of snowfall. So the criteria is not natural snowfall, but guaranteed conditions that are conducive for snowmaking. The most important thing is that you know that the temperatures will be cold enough to make snow.
Is climate change affecting snowfall and snowpack here in Colorado?
Looking solely at the amount of snow that we get each year, Colorado stands out as being a little less sensitive to the warming that’s occurred over the last 30 to 40 years. But when you look at how much that snow melts during the winter period over that same 30 to 40 years, in Colorado we see an increase in the amount of snow melt over time.
That doesn’t mean the ski seasons have gotten shorter yet, but it means snow might get a bit slushier and icier. Depending on the kind of snow you like to ski on, I think of it as a deterioration in the quality of the skiing experience.
How might climate change affect the Winter Games?
It is inevitable that at some point in the future, the ski resorts that we currently ski on will not be viable. Whether or not that occurs in my lifetime is an open question, but within the lifetime of my grandchildren it is probable. That means we may be skiing somewhere else in the future. We’re going to have to start thinking higher in elevation when it comes to winter recreation, and we’ll fly longer distances than we’ve historically flown to go skiing.
The same is likely true when you think about the Winter Olympics: Some of the locations that are viable now will not be viable in 30 to 50 years.
Justice Greg Hobbs and Governor Richard Lamm. Lamm led the opposition to the 1976 Winter Olympic Games in Colorado. Photo credit: Greg and Bobbie Hobbs
What are Denver’s chances of hosting the Winter Games?
I think it would be interesting to consider Denver as a location for the Winter Olympics! As the climate changes, Denver actually may become increasingly more viable as a place to host the Winter Olympics, compared with other places that aren’t quite naturally as cold and snowy.
Wetlands, which are havens of biodiversity, offer priceless ecological benefits. As wetlands are lost to development nationwide, critics of the dam project worry about its local impact. (Photo Credit: John Fielder via Writers on the Range)
Click here to go to the World Wetlands Day website.
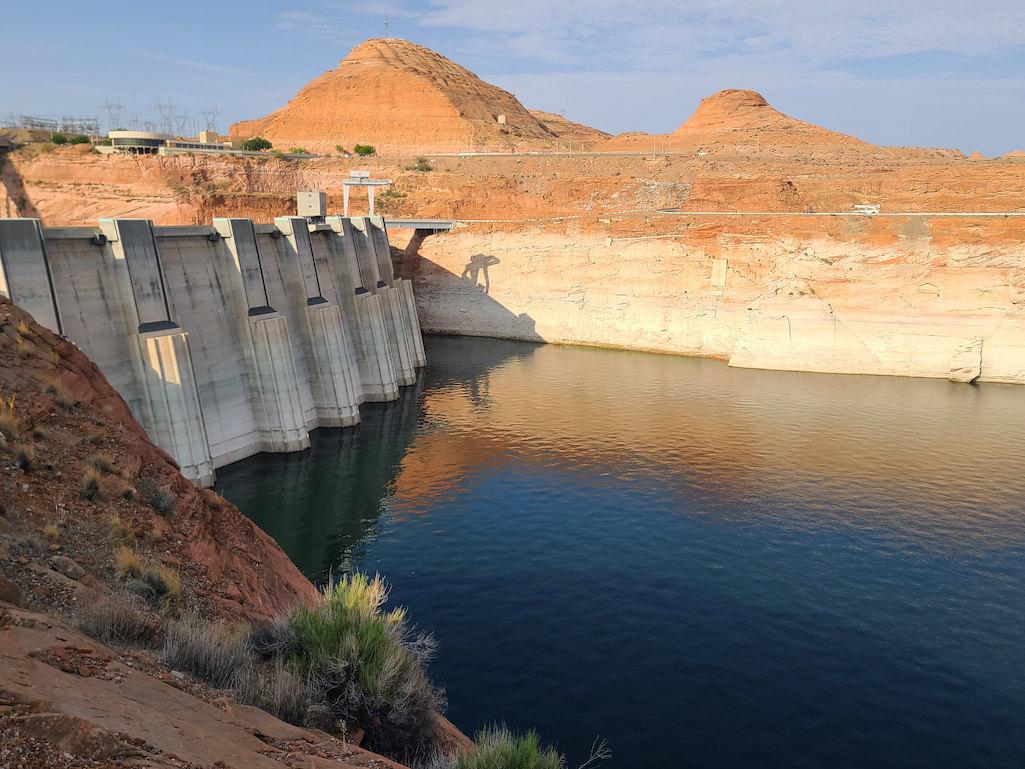
Glen Canyon Dam August 2021. The white on the sandstone reflects where the water level once was. Dropping levels at Lake Powell are forcing a reduction in outflows from the Glen Canyon Dam. Photo credit: USBR
The four Upper Basin states, Colorado, Utah, Wyoming and New Mexico, are working with federal agencies to keep Lake Powell above critical levels. The drought response plan is triggered when Lake Powell’s elevation hits 3,525 feet. Just 35 feet below that is the lowest water level that still allows the Glen Canyon Dam to generate hydropower…
Boaters at Cedar Springs Marina on Flaming Gorge Reservoir. The reservoir’s levels are expected to drop 2 feet a month under an emergency release of water designed to keep Lake Powell’s hydropower system operating. July 22, 2021 Credit: Jerd Smith
The plan will be modified yearly depending on the water levels in the Colorado River Basin. It could include releases from reservoirs in the Upper Basin, including Flaming Gorge on the border of Utah and Wyoming.
Rod Smith, an attorney with the U.S. Department of the Interior, said this has been in the works since the Drought Response Operations Agreement was signed in 2019. He said they thought they’d have more time to lay out the framework, but last year sped up the process.
“What we saw instead were some particularly dry springtime numbers in 2021,” he said during a virtual presentation Friday afternoon. “We did not have as much time at that point relative to when we were projected to 3,525 [feet]. So it accelerated things a lot.”
[…]
The plan released Friday is a framework for how things will operate. It doesn’t include specifics because officials are waiting to see the totals for winter and spring precipitation…
The draft plan is open for public comment until Feb. 17. It’s expected to be completed in April.
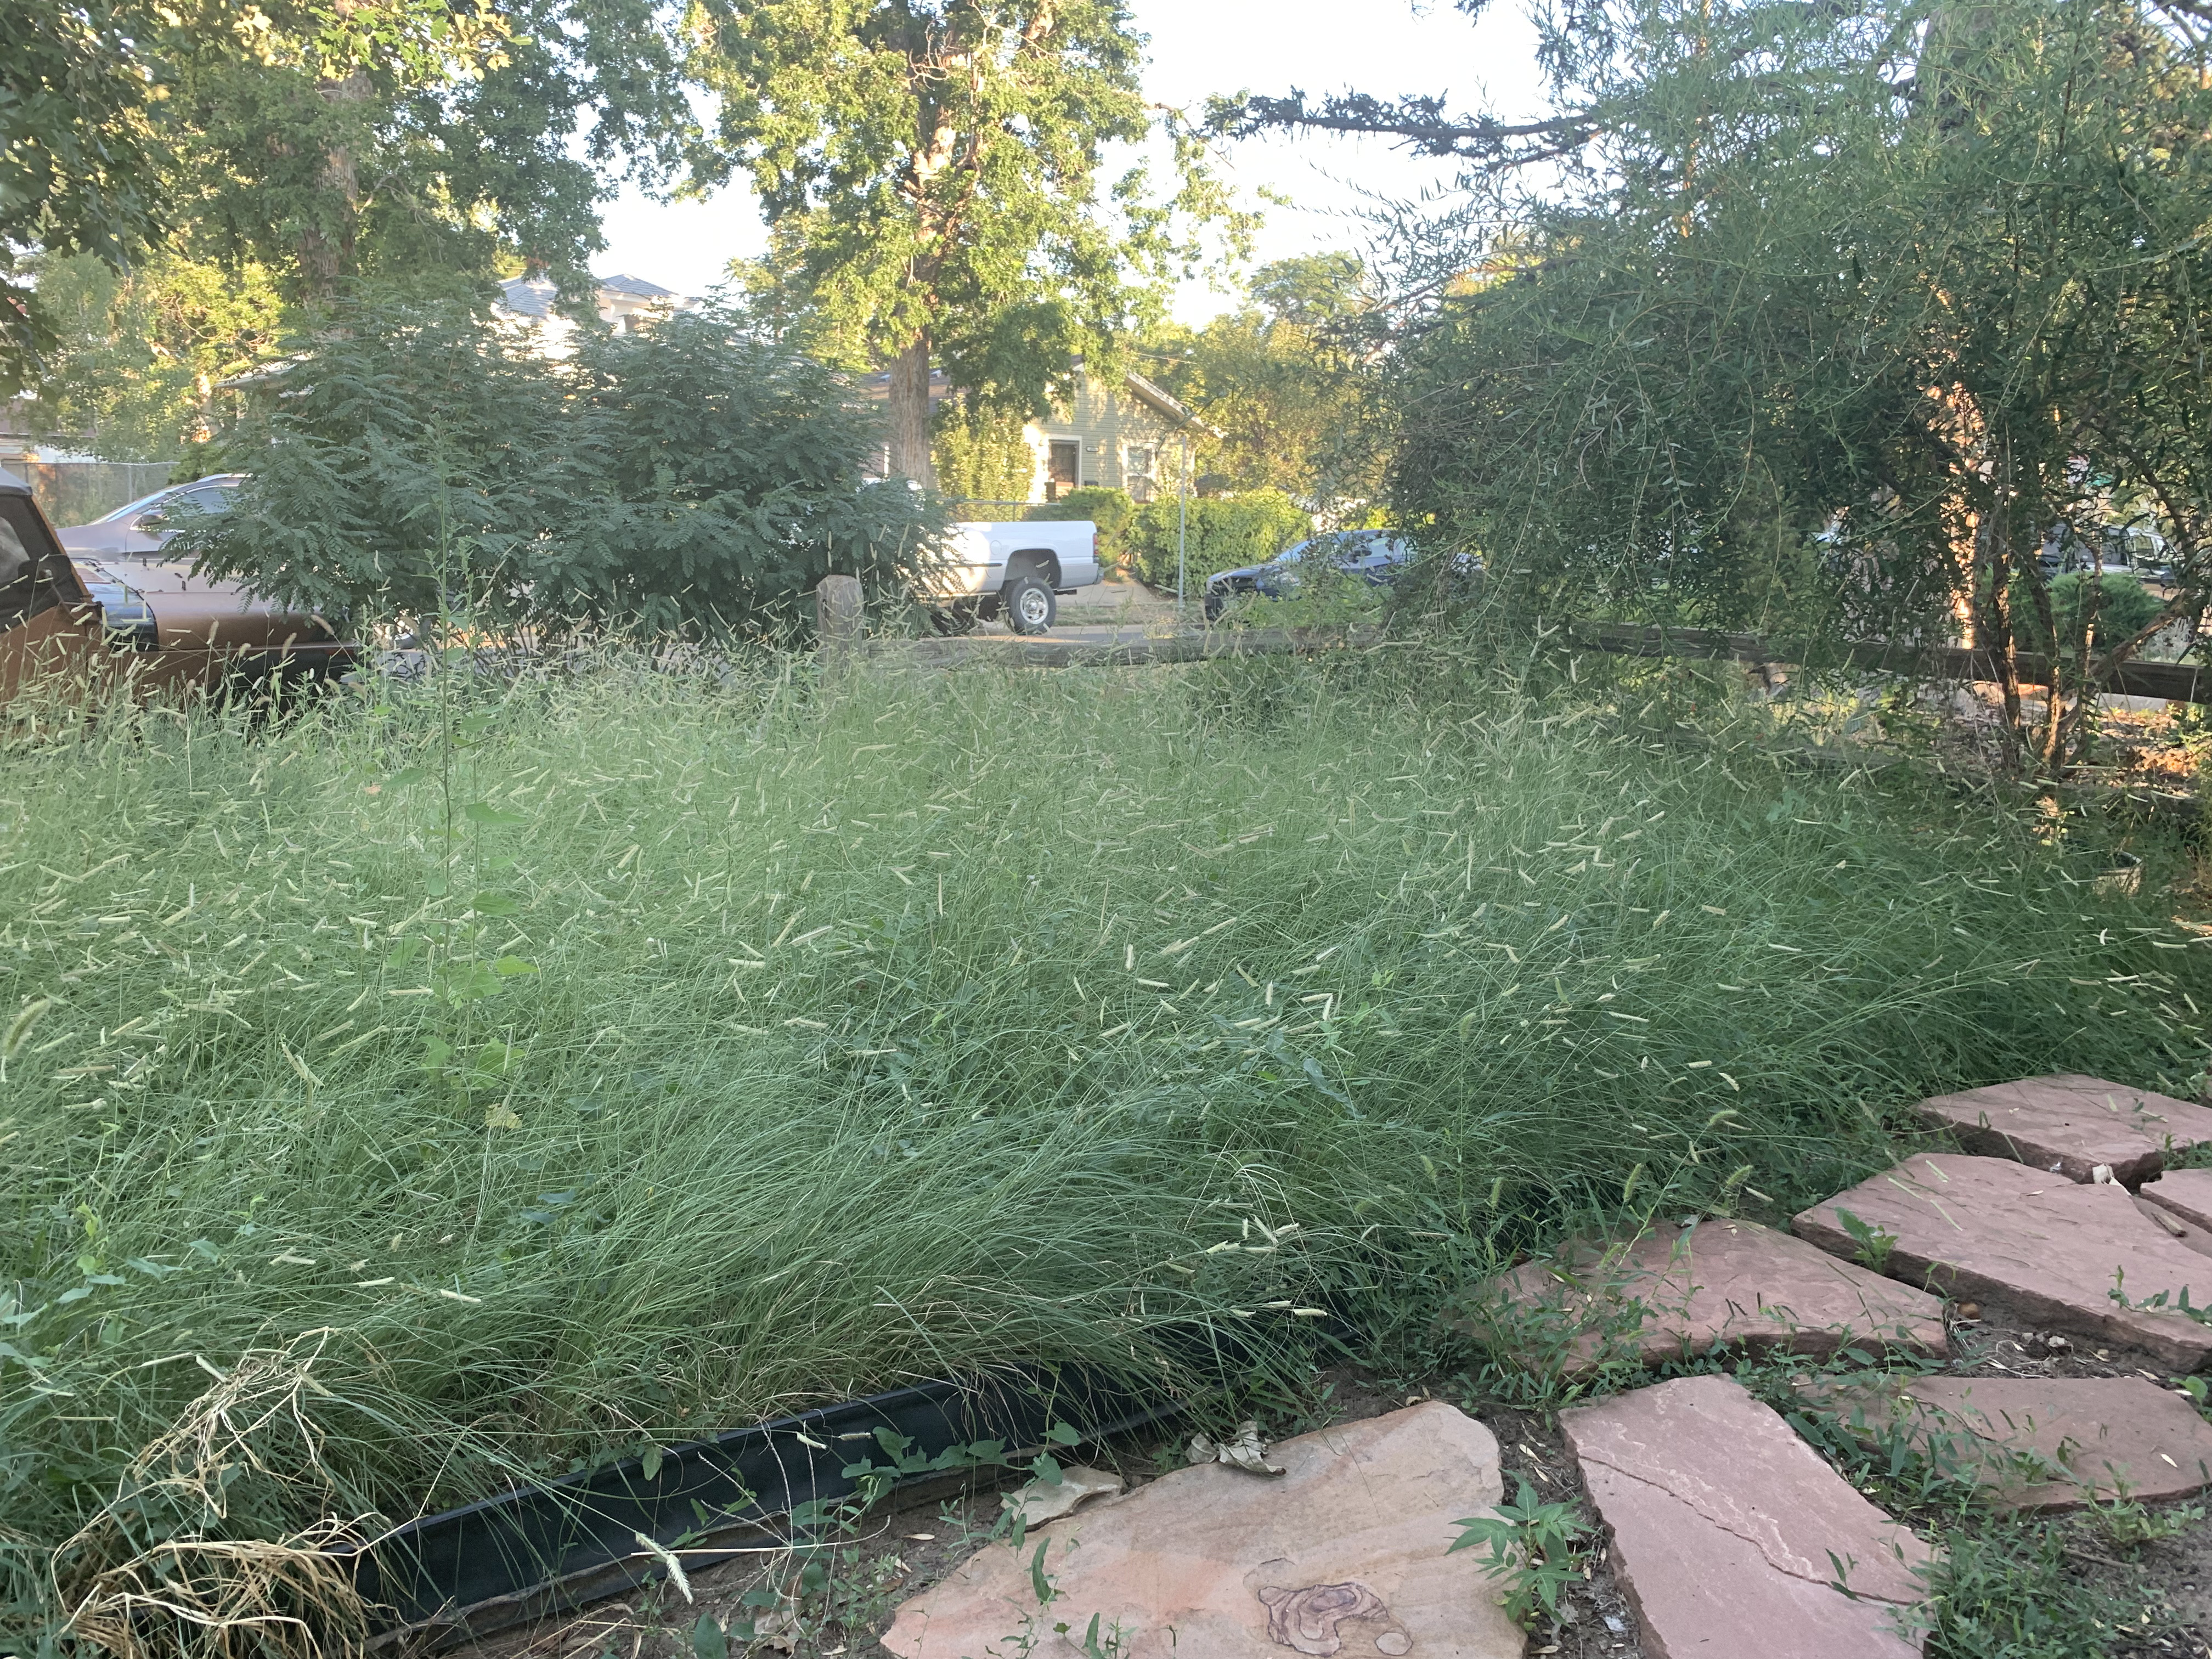
New Colorado Springs homes could be surrounded by far more native grasses and flowers like penstemons and coneflowers, rather than endless seas of Kentucky bluegrass, to help preserve water.
The proposed Colorado Springs zoning code could limit the amount of grass irrigated with sprinklers around new homes to 25% of the yard, excluding areas where plants can’t grow, such as a driveway, patio or deck. The code would also encourage drought resistant and native plants. The limits on lawns would not apply to existing homes.
Putting in native plants rather than lawns would not only help conserve water but also help support native insects and birds, said Judith Rice-Jones, co-manager of the Mid Shooks Run Community Garden and a local conservation advocate…
As the U.S. urbanizes and new neighborhoods spring up with nonnative grass planted around every home it cuts into habitat and many species have to look elsewhere for food, she said. Lawns are the No. 1 irrigated crop in the country, according to NASA. In 2005, three times as many acres were dedicated to lawns compared to corn.
Instead of trying to replicate what grows easily in the Midwest, the new standards could better fit what grows naturally in town, Rice-Jones said…
Moving away from water-hungry grass is also key for the community as hundreds of thousands of new people move to the area and Colorado Springs Utilities seeks to bring in additional water from other basins to serve them. The city is already heavily dependent on outside watersheds, with up to 70% of the city’s water coming from the Colorado River basin. The river has been hit hard by drought in recent years with Lake Powell, a major reservoir for the western U.S., hitting a record low.
About 40% of total water use in Colorado Springs is used for outdoor irrigation, depending on weather. In the summer months, irrigation can make up about 60% of consumption, said Scott Winter, project manager for Utilities Water Resources and Demand Management.
The proposed landscaping rules that encourage native, drought tolerant plants are expected to be a “significant component” of future water conservation efforts, in part because the city has so much land yet to be developed, he said. For example, the 21,000-acre Banning Lewis Ranch on the city’s eastern edge that accounts for one-third of the community is largely undeveloped.
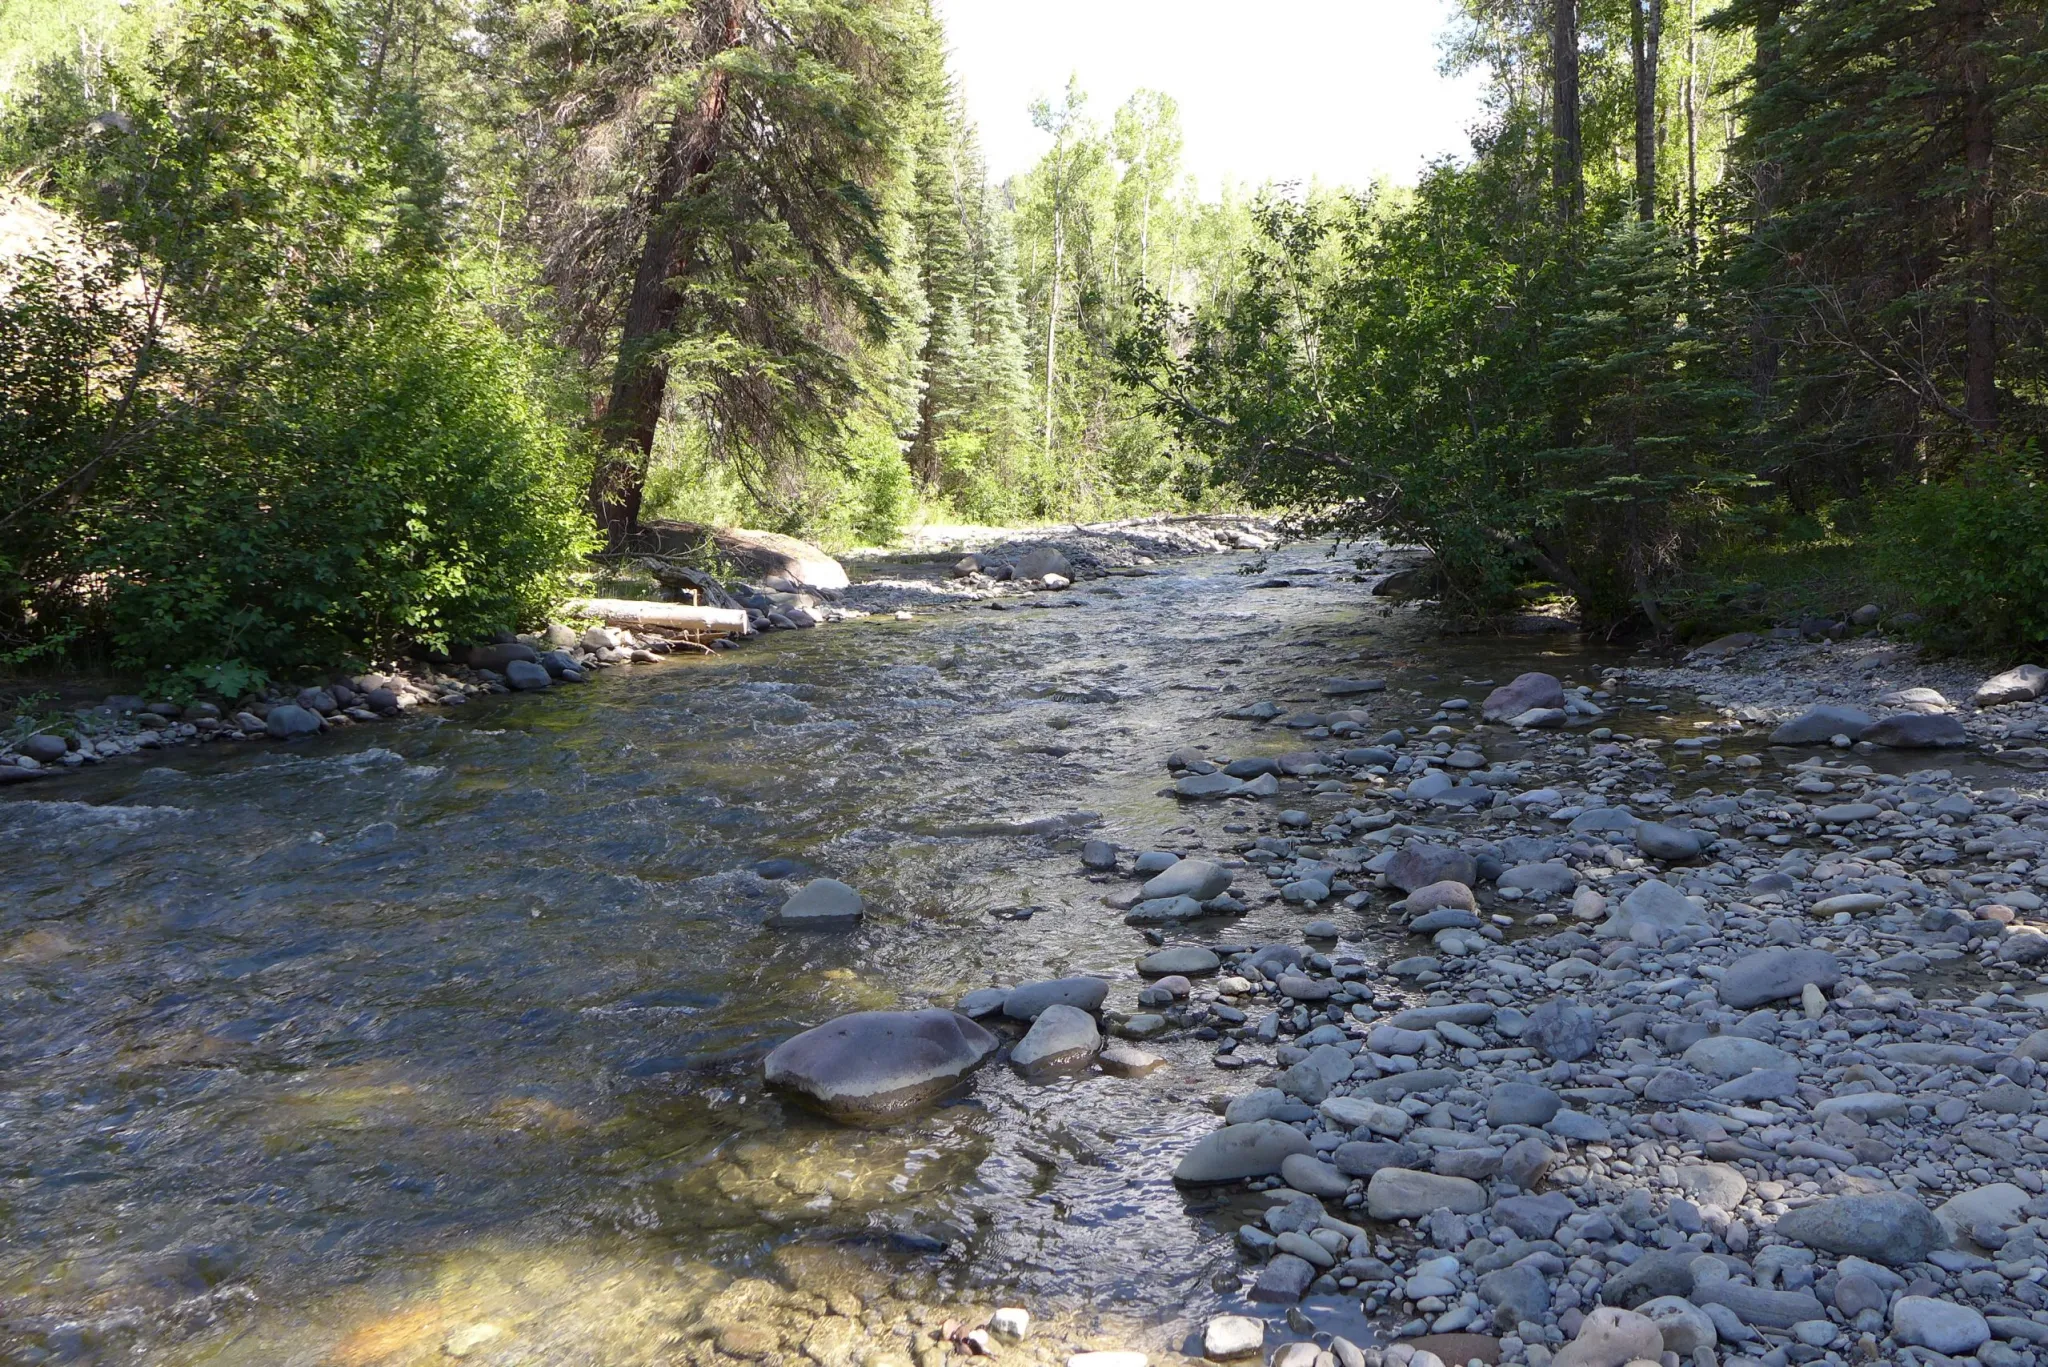
Ouray County Water Users Association wants to build Ram’s Horn Reservoir on the upper reach of Cow Creek, shown here. Ouray County has requested that the CWCB delay a filing for an instream flow water right below this reach. CREDIT: HEATHER SACKETT/ASPEN JOURNALISM
Water scarcity is occurring in some of the US’ biggest freshwater reserves, as per a new study. Not only the crisis is evident in the US but also to other parts of the world.
Amid a growing human population, US and other government policymakers, water specialists, and water conservators are left with the task to help alleviate the water scarcity.
The crisis surrounding water scarcity in the US’ freshwater reserves is also evident in other parts of the planet, according to a research study published in the journal Nature on May 16, 2018.
The research study was conducted by Xander Huggins, a PhD candidate at the University of Victoria and Global Institute for Water Security at the University of Saskatchewan, and his fellow researchers.
The Earth has less than 3% freshwater with only 1% is accessible to the growing human population. Both natural freshwater reserves and freshwater in reservoirs may be at risk if their amount continues to drop and the population continues to increase. In 2021, there are approximately 7.9 billion people as of January 31, as per the United States Census Bureau.
The research study found 34 trends in terrestrial water reserves observed by the Gravity Recovery and Climate Experiment (GRACE) satellites from 2002 to 2016.
Time is Running Out on Freshwater Resources
Based on the observation, the changing availability of freshwater worldwide are affected by various factors such as: natural interannual variability, unsustainable groundwater consumption, or climate change.
These trends were acquired when the researchers examined 1,024 basins across the world with the objective of understanding how water availability is related with social processes in the community.
According to Huggins, the main factor they studied were freshwater stress, which pertains to the amount of H2O that naturally leaves the watershed or basin per year. The higher the stress or exit of water from the watershed or basin means that there will be less water available for ecosystems and for people’s demands, Huggins explains.
The relevance of the study can be of interest not only to water specialists and water conservators but also to government policymakers. Huggins stated that after mapping the most high-risk freshwater sources and creating a framework to identify hotspot basins, policy makers will be able to prioritize a specific location.
Water Scarcity on Freshwater Reserves in the US
Huggins shows that while the US score highly in terms of social adaptiveness based on the study’s freshwater stress factor, the country has many freshwater issues that goes beyond between freshwater stress and freshwater storage. In Huggin’s work, water scarcity affects some of the US biggest freshwater reserves such as the Great Lakes, Colorado River, and Rio Grande River basins.
The states of Illinois and Ohio have the highest levels of lead pipes carrying water from freshwater basins to residential households, as per the Natural Resources Defense Council (NRDC).
Meanwhile in Colorado, an estimate from the Colorado Water Center predicts there will be a 20% to 30% less water of the Colorado River Basin by 2050.
The biggest issues surrounding water scarcity and equal distribution of water are water contamination and cost, according to Jill Ryan, the executive director of Freshwater Future, an advocacy group which protests drinking reservoirs in the Great Lakes region of the US.
In addition to human-related challenges discussed by Ryan, the water scarcity are also mainly affected by human-induced climate change and overallocation, says Michael Fiebig, director of the Southwest River Protection program for American Rivers.
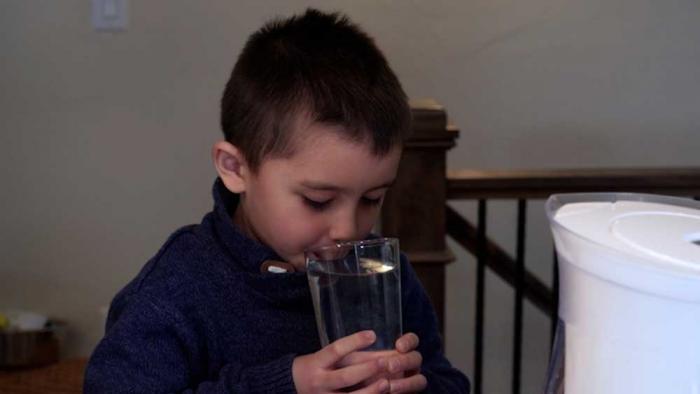
Nearly 3 in 4 Colorado kids have detectable levels of lead in their bloodstream, according to a peer-reviewed study published in September.
The September analysis — published in the medical journal JAMA Pediatrics — found that nationwide, slightly more than half of children tested positive for lead, making Colorado’s rate above average.
GET THE MORNING HEADLINES DELIVERED TO YOUR INBOX
Some state lawmakers and public health advocates want to address Colorado’s lead problem by installing water filters in every K-12 public and charter school in the state. They plan to introduce a bill that would leverage federal funds to pay for the water filter installation.
Colorado People’s Alliance, a racial justice organization with offices in Denver and Aurora, and Natural Resources Defense Council, a national environmental advocacy group, are backing the bill, which has yet to be officially introduced. Sponsors include three Democrats: Sen. Rhonda Fields of Aurora along with Reps. Emily Sirota of Denver and Barbara McLachlan of Durango.
“Lead is a problem in Colorado schools,” said Cori Bell, an attorney at Natural Resources Defense Council who advocates for healthy and affordable water. Bell spoke during a virtual news conference Monday to announce the upcoming bill.
“Schools and child care centers may have older plumbing materials, such as pipes and faucets, which are more likely to contain high levels of lead,” Bell continued. “There are so many times when pipes at schools sit unused. Think about the weekends, school breaks and summer vacation. During these times, lead can dissolve in the water that’s sitting in the pipes. No one would hand a child a lead straw for their glass, so why would we allow lead contamination in school drinking water?”
The Centers for Disease Control and Prevention warns that exposure to lead can cause serious health effects for children, including brain and nervous system damage, slowed growth and development, learning and behavior problems, and hearing and speech problems.
Lead exposure is most common among children who live in communities with older housing and high poverty rates, according to the September study, which also found higher-than-average lead exposure in children from predominantly Black and Hispanic ZIP codes.
Rachel Lehman, a member of Colorado People’s Alliance, said she didn’t trust the drinking water in Denver’s Montbello neighborhood where her family lives. She buys water filters for her home once a month, and her daughter lugs water from home in a Hydro Flask when she goes to class.
“Water is life,” Lehman said during the news conference. “I don’t see how this is a political issue at all, and I urge the state of Colorado to do some kind of action in this matter to support clean drinking water for all of our children.”
Dr. PJ Parmar, whose clinic serves refugees in the East Colfax neighborhood, pointed out the difficulty of testing individual kids for lead.
“If anyone has tried to test the blood of a 1- or 2-year-old, it’s impractical,” Parmar said. But his clients would be on board with the broader filter proposal, he said, because “many of them come from places where they don’t trust the drinking water anyway.”
Under the upcoming bill, the $26.7 million filter installation cost would be paid for using existing federal funds.
Advocates say President Joe Biden’s social spending plan, which remains stalled in the U.S. Senate, would cover annual filter maintenance costs totaling $12.7 million for Colorado schools. But if Congress doesn’t pass the social spending plan, or some version of it, it’s unclear who would pay for maintenance. State funding for K-12 education already falls more than $500 million short of the amount that lawmakers are required to pay school districts under a formula in state law.
SUPPORT NEWS YOU TRUST.
Colorado Newsline is part of States Newsroom, a network of news bureaus supported by grants and a coalition of donors as a 501c(3) public charity. Colorado Newsline maintains editorial independence. Contact Editor Quentin Young for questions: info@coloradonewsline.com. Follow Colorado Newsline on Facebook and Twitter.
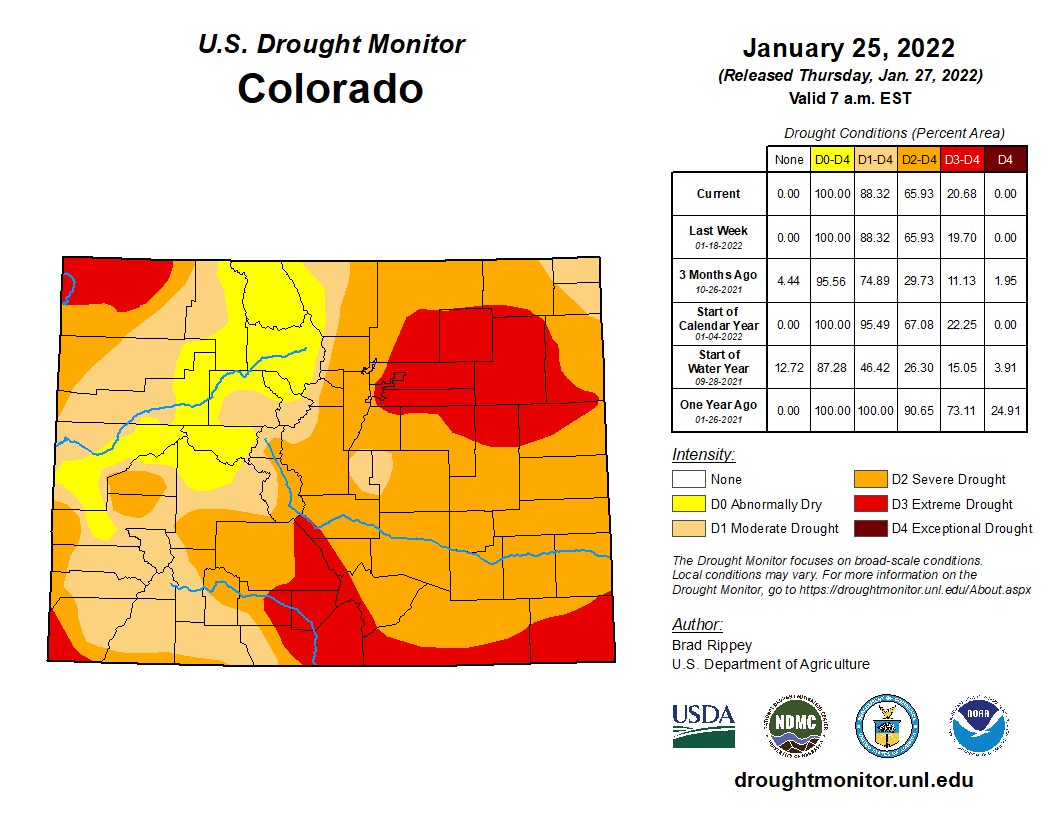
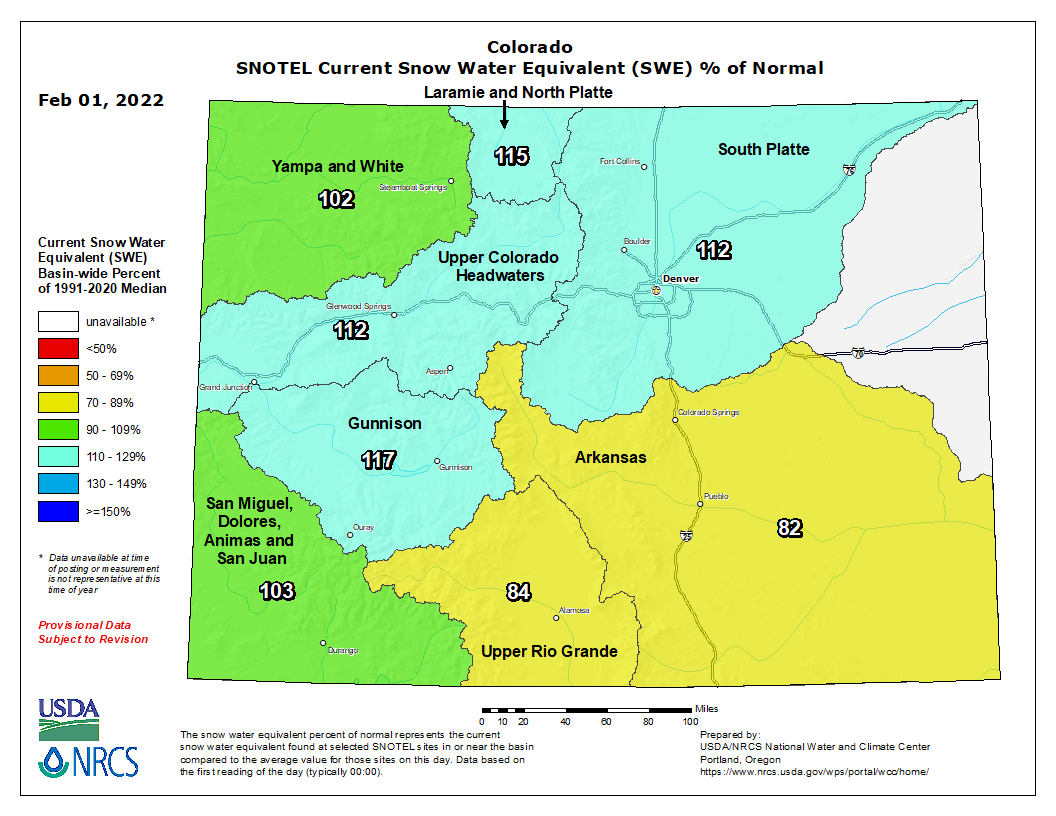
Current statewide drought conditions for Colorado have improved since October 2021. The first quarter of water year 2022 was above normal in terms of temperature. As of mid-January a rough divide appeared in Colorado with regard to precipitation, with western slope generally experiencing wetter conditions, while the eastern slope generally continues in drought conditions. La Niña is currently in effect and projections show somewhat equal chances for above or below average precipitation moving into the spring. La Niña years in Colorado tend to result in smaller, drier storms overall.
Colorado Snowpack basin-filled map February 1, 2022 via the NRCS.
Statewide snowpack as of January 16 is 119% of median, setting the state up well going into the spring. A significant and much-needed increase in snowpack occurred from Dec 1 – Jan 6, which translated to a 7.1 inch increase in water. Precipitation in December was 193% of average. Statewide, year-to-date (Jan 16) precipitation is currently at 112% of average. Overall, conditions are some of the best we have seen at this point in the year, especially when compared to the last few years. All major river basins show above normal snow water equivalent, with the exception of the Arkansas (89% of normal) and the Upper Rio Grande (90% of normal).
State drought response remains in Phase 3 activation though both agricultural and municipal water provider task forces have reduced their meeting frequency to monitor conditions through the winter season. Learn more about these coordination groups, outlined in the Colorado Drought Plan at cwcb.colorado.gov/drought.
The January 18 U.S. Drought Monitor recorded extreme (D3) drought conditions across 19.7% of the state, primarily on the eastern slope and Rio Grande Basin. Severe (D2) drought covers about 46% of the state, while moderate (D1) drought holds in 22% of the state. About 11% of the state is experiencing abnormally dry (D0) conditions.
The 90-day Standardized Precipitation Index (SPI) values from Oct 23 to Jan 20 highlight dry conditions in the southeastern and eastern parts of the state.
The NOAA Climate Prediction Center three month outlook maps indicate increased chances for above average temperatures into February, March, and April with below average precipitation probabilities.
Statewide reservoir storage is currently at 74% of normal. Streamflow forecasts are generally near to or slightly above normal come spring and summer. East of the divide, streamflow forecasts are projecting about 100% of average and the forecasts improve to the west.
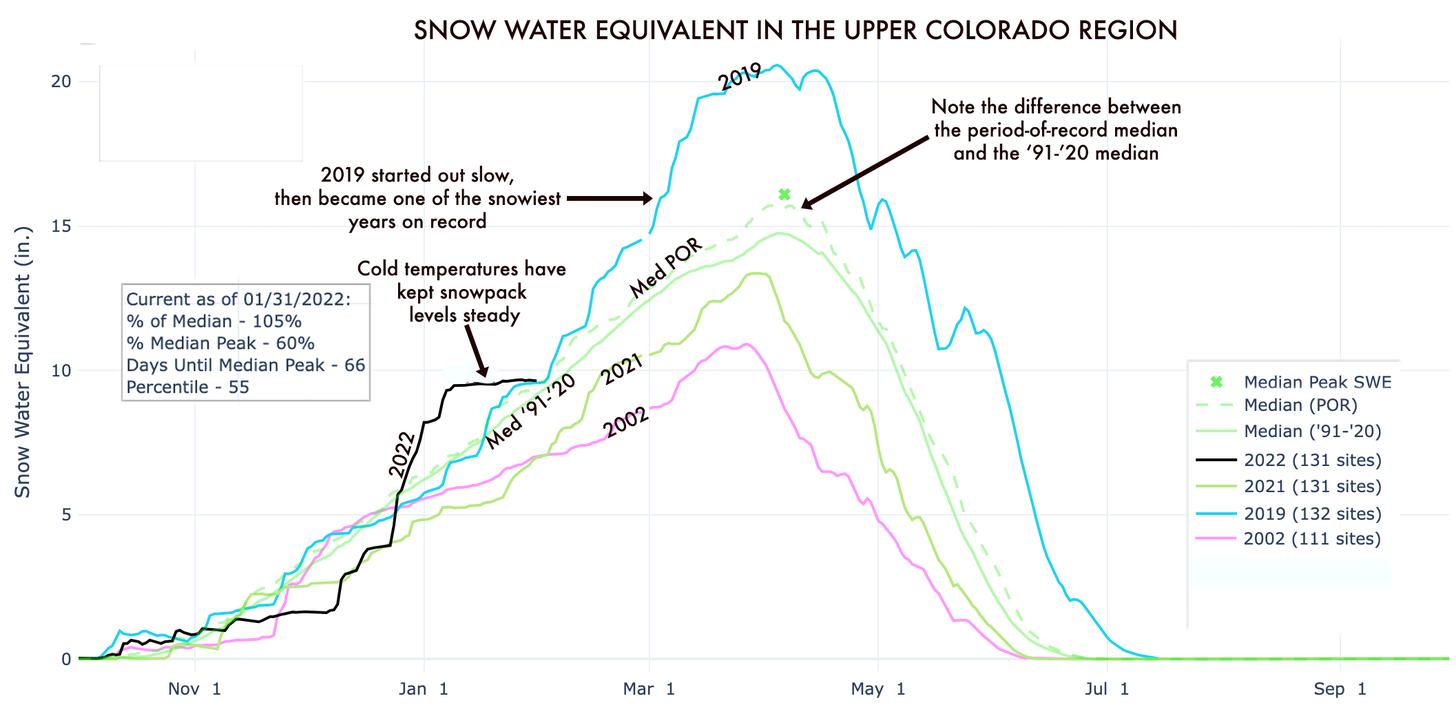
The Western U.S. 2022 winter has been a bit manic so far, swinging from a snow-sad October and November to jubilant late December storms that cranked snowpack levels from about 30 percent of normal to 150 percent of normal over a few weeks’ time. And then it just stopped. A relentless blue sky has hovered over most of the region for weeks. The high altitude sun has baked south-facing slopes daily and plummeting nighttime temperatures freeze it solid, setting the stage for a nasty avalanche cycle when—or if—big February snows arrive.
This has left the snowpack levels across the Upper Colorado River Basin close to average for this time of year. Levels are healthier to the north—the North Fork of the Gunnison is sitting at 125 percent of median—and thinner in southern zones such as the Rio Grande Headwaters, which are only at 86 percent of normal. While ski slopes are icy, the snow generally is holding up for skiing and nordic (and kick-sledding) conditions are super fast. Folks in the snow-removal business, however, are hating it, and water managers are on edge once again.
This graph shows not only the manic nature of this year’s snowfall, but also illustrates the decline in median snowpack over time, seen by comparing the period-of-record (POR) median with the median level over the last two decades. Source: USDA NRCS via The Land Desk
To prepare for what thus-far promises to be a mediocre spring runoff, federal Bureau of Reclamation officials are getting ready to implement a drought response plan which will kick in when (not if) Lake Powell’s surface level drops below 3,525 feet above sea level. It is currently sitting at 3,531 feet, 45 feet lower than a year ago. Officials have already nearly drained upstream reservoirs and then decreased release flows from Glen Canyon Dam in hopes of keeping levels above the minimum needed to produce hydropower. Yet the decline continues nevertheless: The Reservoir has lost 371,840 acre feet (12 billion gallons) of water in the last month.
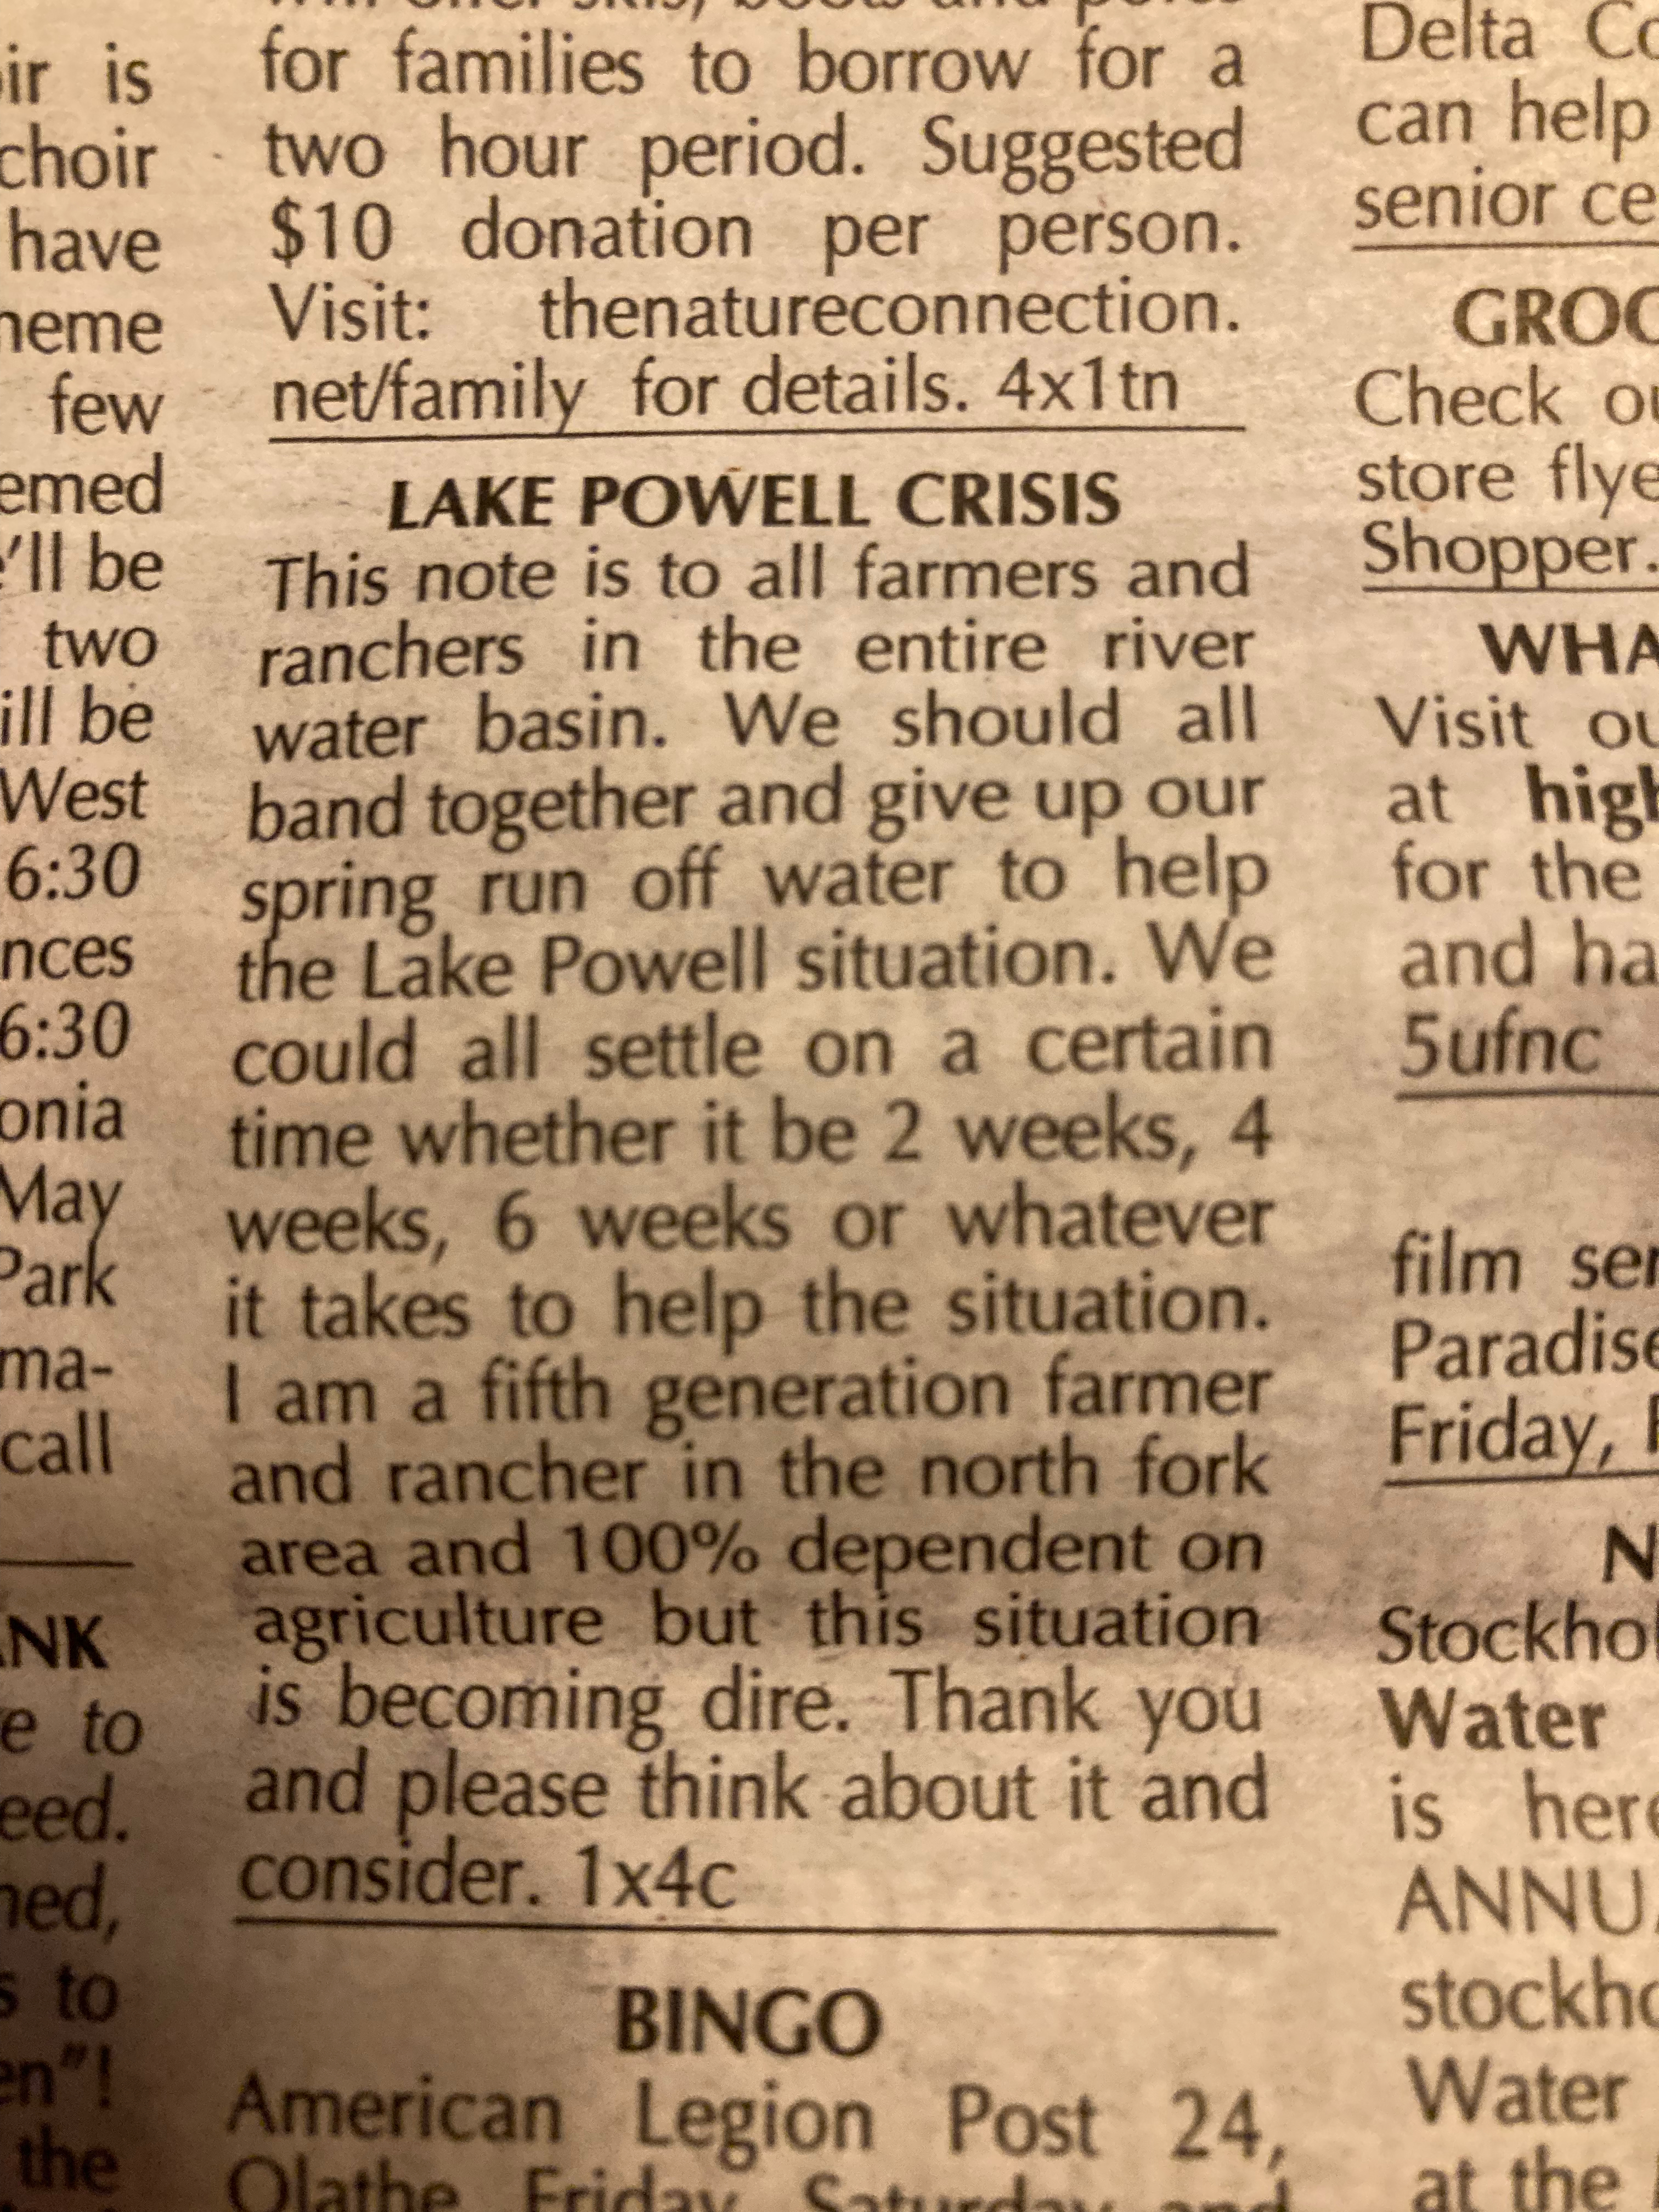
Maybe if a bunch of upstream farmers got together and stopped irrigating for a few weeks this summer they could solve Powell’s Problem? That seems to be what this advertisement I stumbled across in the High Country Shopper out of Delta County, Colorado, is proposing:
It is for content like this that I religiously read the High Country Shopper whenever I’m in Delta County. Photo credit: Jonathan Thompson/The Land Desk
If you know about Western water and the feelings it inspires, then you’ll realize how magnanimous this offer really is. No one in the arid West wants to give up their water. Ever. Which is why it’s highly unlikely that this person can convince enough farmers to shut off their ditches for long enough to make a difference. And you also have to wonder what they’re trying to save. Do they hope to bolster lake levels enough to get the boat ramps back open? Or do they simply want to preserve hydropower generating capacity for as long as possible?
Whatever the case, I’d encourage them to go forward with the plan. It may not mean much to Lake Powell, but a bit of extra water in the rivers sure would be nice for downstream boaters and fish.
Here’s the release from the Department of Interior:
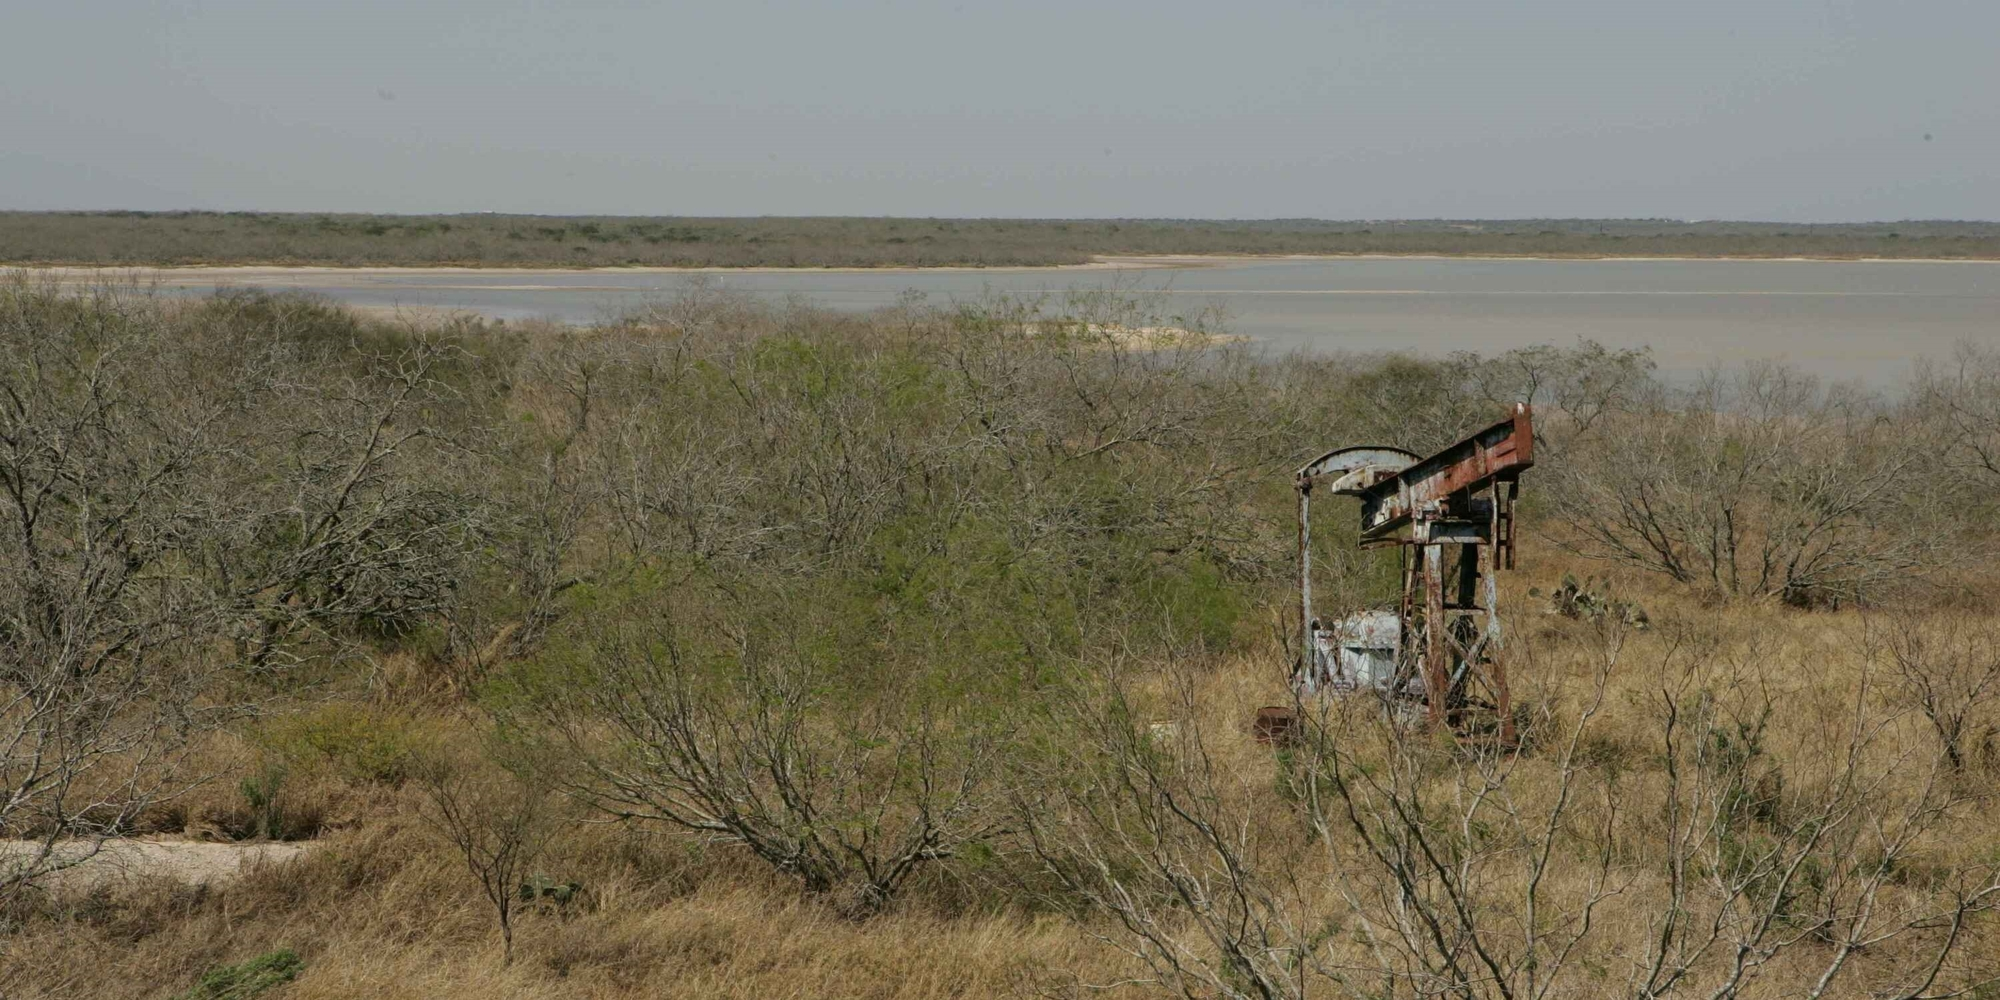
The Department of the Interior today announced $1.15 billion in funding is available to states from the Bipartisan Infrastructure Law to create jobs cleaning up orphaned oil and gas wells across the country. This is a key initiative of President Biden’s Bipartisan Infrastructure Law, which allocated a total of $4.7 billion to create a new federal program to address orphan wells. Millions of Americans across the country live within a mile of an orphaned oil and gas well.
Orphaned wells are polluting backyards, recreation areas, and public spaces across the country. The historic investments to clean up these hazardous sites will create good-paying, union jobs, catalyze economic growth and revitalization, and reduce dangerous methane leaks.
“President Biden’s Bipartisan Infrastructure Law is enabling us to confront the legacy pollution and long-standing environmental injustices that for too long have plagued underrepresented communities,” said Secretary Deb Haaland. “We must act with urgency to address the more than one hundred thousand documented orphaned wells across the country and leave no community behind. This is good for our climate, for the health of our communities, and for American workers.”
Plugging orphaned wells will also help advance the goals of the U.S. Methane Emissions Reduction Action Plan, as well as the Interagency Working Group on Coal and Power Plant Communities and Economic Revitalization, which focuses on spurring economic revitalization in the hard-hit energy communities.
Nearly every state with documented orphaned wells submitted a Notice of Intent (NOI) indicating interest in applying for a formula grant to fund the proper closure and cleanup of orphaned wells and well sites.
The Department today released the amount of funding that states are eligible to apply for in Phase One, which includes up to $25 million in Initial Grant funding and a quarter of the total Formula Grant money available for the 26 states that submitted NOIs. These allocations were determined using the data provided by states from the NOIs and equally considers the following factors required by the Bipartisan Infrastructure Law: job losses in each state from March 2020 through November 2021; the number of documented orphaned oil and gas wells in each state; and the estimated cost of cleaning up orphaned wells in each state.
“The Department is taking a thoughtful and methodical approach to implementing the orphaned oil and gas well program that aims to get money to states as quickly as possible while being responsible stewards of taxpayer dollars. We are committed to ensuring states receive investments equitably and based on data-driven needs,” added Secretary Haaland.
In the coming weeks, the Department will release detailed guidance for states to apply for the Initial Grants. These resources will allow state officials to begin building out their plugging programs, remediating high-priority wells, and collecting additional data regarding the number of orphaned wells in their states. Improvements in the state data, combined with more accurate Bureau of Labor Statistics job loss data that will be released in upcoming months, will allow the Department to ensure that the final formula funding for states is based on the best information available.
Application guidance will also be released in the coming months for states to access the Formula Grant funding they are eligible for, followed by further instructions to apply for the $1.5 billion in state Performance Grants, the third type of state grant program set up in the Bipartisan Infrastructure Law. The Tribal orphaned well grant program, a $150 million component of the broader orphaned well program, is being informed by ongoing Tribal consultations and listening sessions. The law also provides for a separate $250 million program for remediation of orphan wells on federal land, which will be implemented through Interior’s Bureau of Land Management.
Yellowstone Caldera Chronicles is a weekly column written by scientists and collaborators of the Yellowstone Volcano Observatory. This week’s contribution is from Michael Poland, geophysicist with the U.S. Geological Survey and Scientist-in-Charge of the Yellowstone Volcano Observatory.
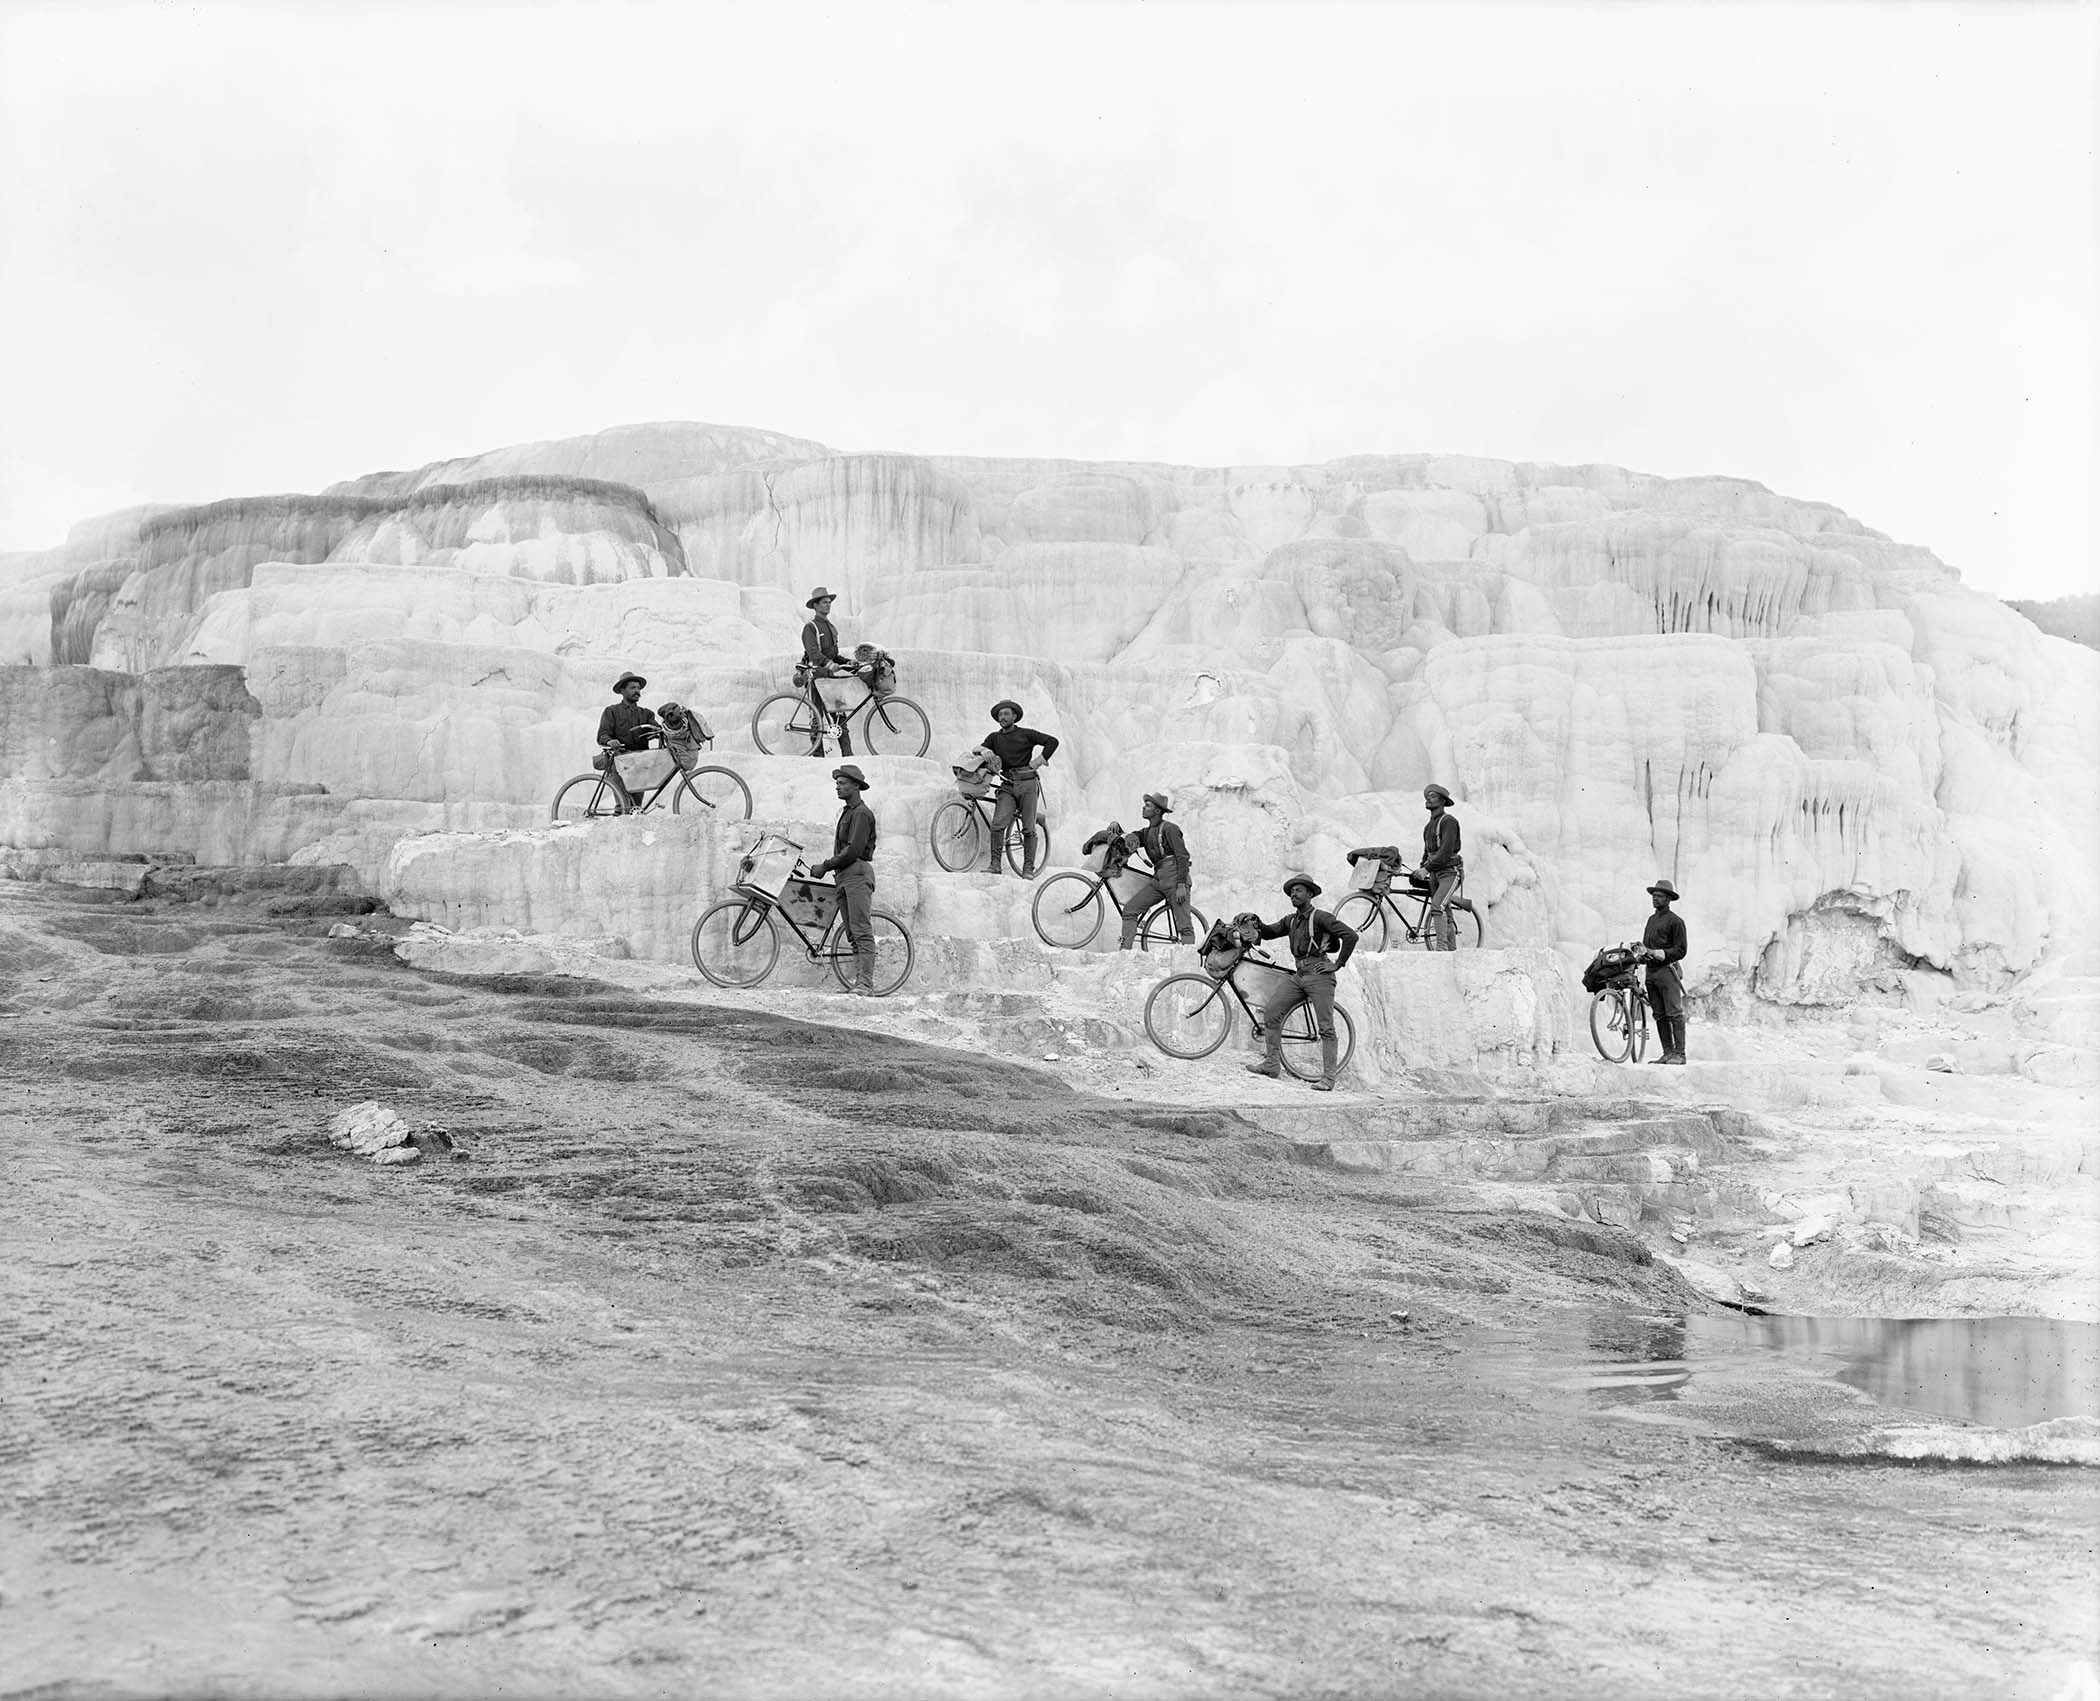
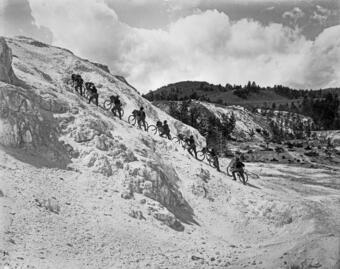
The Buffalo Soldiers of the 25th Infantry Regiment Bicycle Corps pose on Minerva Terrace, Mammoth Hot Springs, Yellowstone National Park. Pvt. John Findley, front left, was the primary bicycle mechanic for the unit, and so carried a heavy toolbox attached to his handlebars. Photo by F. Jay Haynes, 1896. Montana Historical Society Research Center, Haynes Foundation Photograph Collection, H-3614. Used with permission from the Montana Historical Society.
Bicycles as a means of military transport in the U.S. Army was suggested by Lt. James Moss, an officer in the 25th Infantry, following the example of some European armies. Bicycles offered several advantages over horses—they didn’t require food or water, didn’t make as much noise, and could be repaired if they broke down. His proposal to test the concept was approved by Army leadership, so Lt. Moss began training volunteers from the 25th Infantry Regiment.
The Buffalo Soldiers of the 25th Infantry Regiment Bicycle Corps walk their cycles up Minerva Terrace, Mammoth Hot Springs, Yellowstone National Park. Photo by F. Jay Haynes, 1896. Montana Historical Society Research Center, Haynes Foundation Photograph Collection, H-3615. Used with permission from the Montana Historical Society.
The Bicycle Corps pedaled into action for the first time in early August 1896, starting with a four-day, 126-mile ride in the vicinity of Missoula, Montana. This might not sound spectacular, given that Ironman Triathlon bicycle legs cover about the same distance, but remember, this was 1896. The roads were not paved, and the one-speed bicycles, custom built by A.G. Spalding & Co. of Chicopee Falls, Massachusetts, each weighted over 30 pounds. Importantly, unlike the Ironman, the soldiers also had to carry food, utensils, weapons, ammunition, clothes, repair parts and tools, bedrolls, and tents—well over 100 pounds all told!
After a few days of rest, the Bicycle Corps began their next expedition on August 15—to Yellowstone National Park and Fort Yellowstone, a journey of over 300 miles that took just over 8 days.
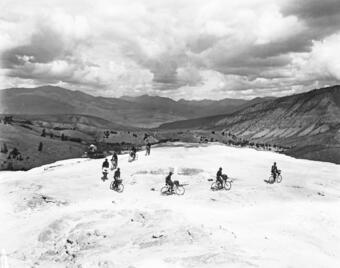
After 2 days of rest and reprovisioning at Fort Yellowstone, the Corps set out on a tour of the Park on August 25, stopping at Lower Geyser Basin, Upper Geyser Basin (where they observed Old Faithful, Giantess, and Castle Geysers all erupting at the same time), West Thumb, and the Grand Canyon of the Yellowstone and its waterfalls, returning to Mammoth Hot Springs on August 29. After 2 additional days of rest, during which the iconic photo and several others were taken, the soldiers headed back to Fort Missoula, riding in on September 8—a total journey of nearly 800 miles.
As part of his official report, Lt. Moss recorded that the trip through Yellowstone included 132 miles completed in 19 hours of actual bicycling. The slowest pace was between Upper Geyser Basin and West Thumb, when the soldiers had to cross the Continental Divide—twice! The fastest time was between Fort Yellowstone and Norris Geyser Basin.
The Buffalo Soldiers of the 25th Infantry Regiment Bicycle Corps ride on an inactive portion of Minerva Terrace, Mammoth Hot Springs, Yellowstone National Park. Photo by F. Jay Haynes, 1896. Montana Historical Society Research Center, Haynes Foundation Photograph Collection, H-3616. Used with permission from the Montana Historical Society.Ft. Missoula, Montana. Yellowstone National Park.” 25th Infantry. October 7, 1896 [August 1896 per Moss’s diary]
Although there are no records of what the soldiers themselves thought, Lt. Moss recorded that “The soldiers were delighted with the trip…thought the sights grand…and seemed to be in the best of spirits the whole time.” Moss also remarked on “the moral effect of the seething water, the roaring of the geysers and the sulphuric fumes.”
Even the Yellowstone journey was just a warmup. In 1897, Moss organized 20 soldiers of the 25th Infantry on a 40-day, 1,900-mile ride from Fort Missoula to St. Louis. A planned ride to San Francisco the following year was canceled owing to the outbreak of the Spanish-American War, and the 25th Infantry was deployed to the Philippines.
Although never based in Yellowstone National Park, Buffalo Soldiers had a profound and lasting impact on the early national parks. Serving under perhaps the first Black officer, Charles Young, they were rangers and interpreters in places like Yosemite and Sequoia National Parks, helping tourists and even blazing trails—for example, to the summit of Mount Whitney.
The next time you drive—or cycle!—around Yellowstone National Park, think of the challenging conditions that faced the intrepid Buffalo Soldier bicyclists of the 25th Infantry Regiment, who completed a tour of the park after riding from Missoula and carrying their own provisions, spare parts, and equipment. And the challenges were not purely physical and logistical—of course, they also faced discrimination and were paid less than their white counterparts. But wherever they went, the men of the 25th distinguished themselves, with one Montana newspaper editor remarking, “The prejudice against the…soldiers seems to be without foundation for if the 25th Infantry is an example of the [Black] regiments there is no exaggeration in the statement that there are no better troops in the service.”
The 8 cyclists of the Yellowstone expedition were Sgt. Dalbert P. Green, Cpl. John G. Williams, Pvt. John Findley, Pvt. Frank L. Johnson, Pvt. William Proctor, Pvt. William Haynes, Pvt. Elwood Forman, and Musician William W. Brown.
For more information on the exploits of the 25th Infantry Regiment Bicycle Corps, see:
[1] Following the Civil War, Congress passed legislation to reorganize the military and included these regiments of Afro-Americans, many of whom were among the approximately 180,000 African Americans who previously served in the Union Army. From 1867 to the early 1890s, these regiments served at a variety of posts in the southwestern United States and the Great Plains regions. It was from one of these regiments, the 10th Cavalry, that the nickname Buffalo Soldier was born. Indigenous tribes of the American plains who fought against these soldiers allegedly referred to the black cavalry troops as “buffalo soldiers” because of their dark, curly hair, which resembled a bison’s coat, and because of their fierce nature of fighting. The nickname soon became synonymous with all African-American regiments formed in 1866.
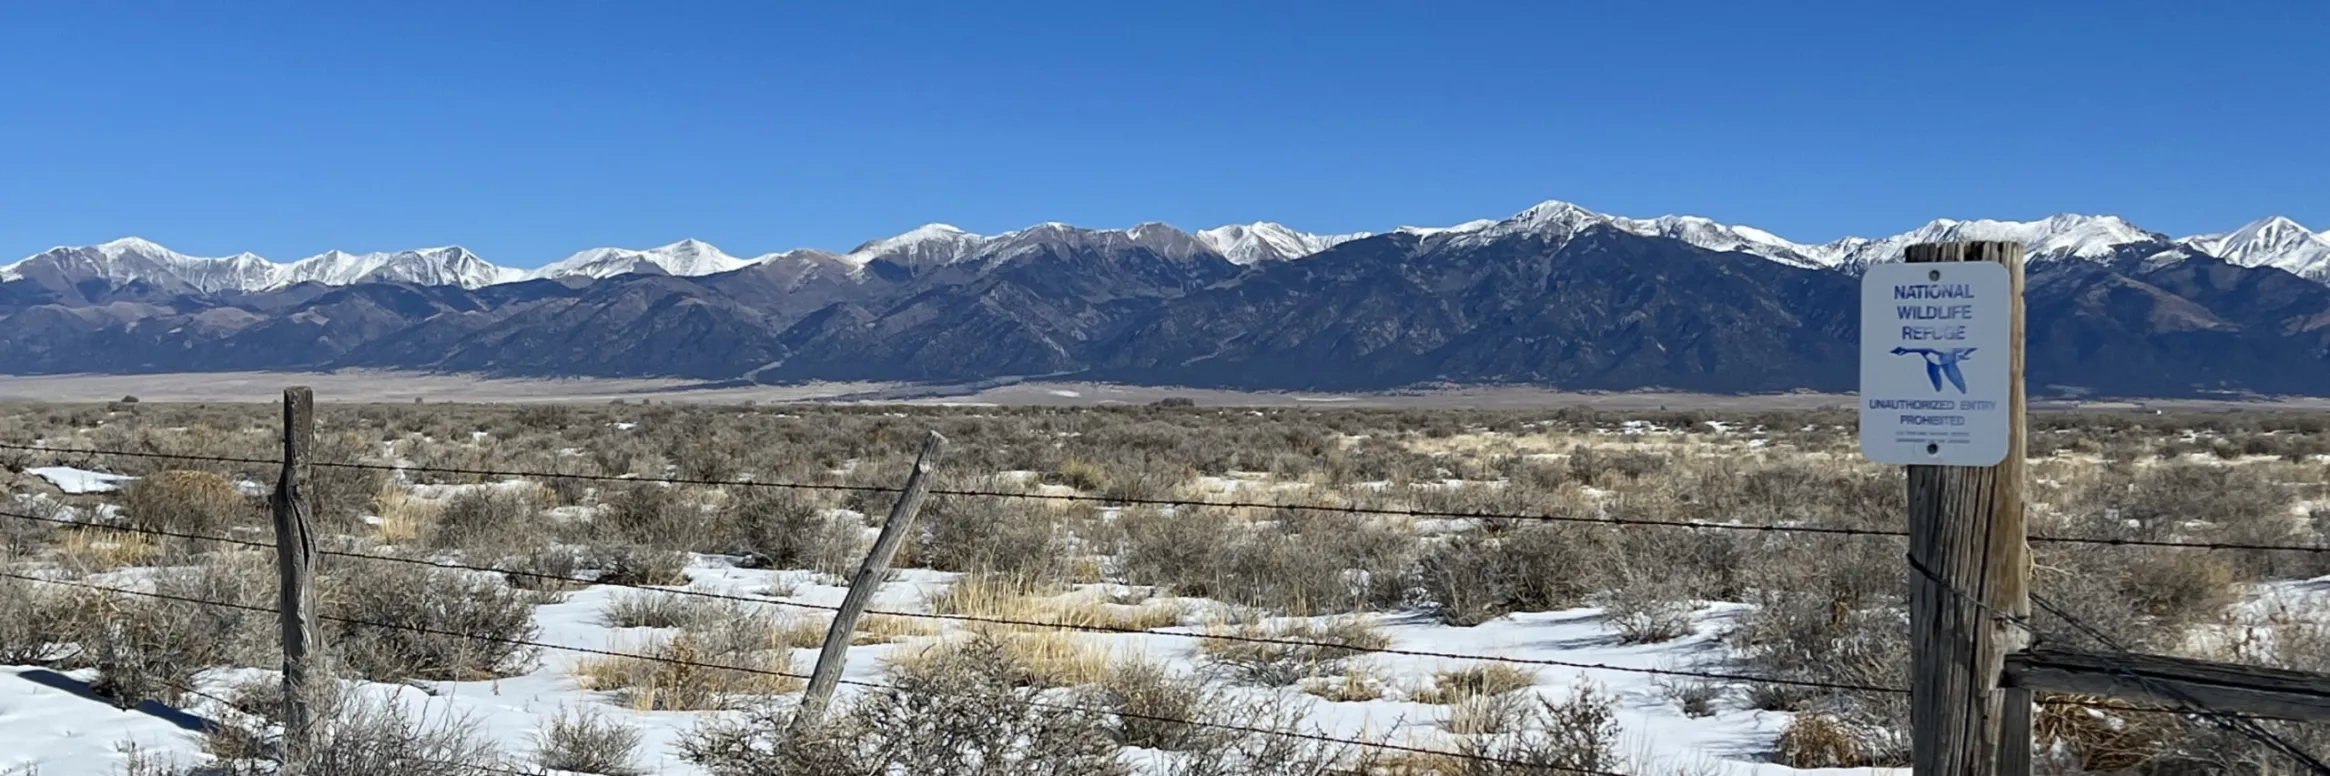
A view of public lands around the Sangre de Cristo Mountains and just south from the area Renewable Water Resources has proposed a wellfield for water exportation. Photo credit: Alamosa Citizen
CALLING it a “carefully crafted plan,” former Colorado Gov. Bill Owens defended efforts by Renewable Water Resources to export water from the San Luis Valley in a pointed opinion published Sunday.
Owens is leading the RWR plan and called out “status-quo politicians who are stoking fear doubling down on one valid reality: the San Luis Valley is one of the most economically challenged areas of our state.”
“When the attorney general and state Sen. Cleave Simpson claim they will do all they can to stop the voluntary selling of water rights, they are saying to Coloradans that they know better than you do what to do with your private property,” Owens penned in the op/ed published in ColoradoPolitics.com.
Simpson responded during Monday’s Douglas County commissioners work session on the RWR plan. Douglas County is vetting the proposal for a $20 million investment, using its federal COVID relief money to potentially buy into the RWR plan and pump groundwater in perpetuity to Douglas County from the Valley.
“Myself and the Rio Grande Water Conservation District very intentionally have not tried to implement any type of rule or legislation that would interfere with private property rights,” Simpson said. “If folks are interested in selling water rights to Renewable Water Resources we’ve not stood in the way. We certainly would challenge that a change in the water right and the proposal as crafted isn’t good for the community, and likely our position would be ‘I’m not sure you can do it without injuring other water rights.’”
Simpson was joined by other Valley water managers who briefed Douglas County commissioners on the most current groundwater withdrawals and condition of the unconfined and confined aquifers in the Upper Rio Grande Basin. The RWR groundwater pumping and exportation plan draws from the confined aquifer in Saguache County and is in a part of the Rio Grande Basin considered not sustainable due to current withdrawals.
Owens, making a point in his opinion piece that there is water in the San Luis Valley available for exportation, said “the San Luis Valley pumps over 600,000 acre-feet of water from the aquifers every year.” Actual water flow meter readings show Valley farmers pumped 458,000 acre-feet in 2020, according to data presented to Douglas County commissioners.
The commissioners also saw figures that show the Rio Grande with an average flow of 550,000 acre-feet over the past 20 years, down 15 percent from the Rio Grande’s historical average going back to 1890 when water flows on the Rio Grande started to be measured.
“We’re not guessing at the numbers that we pump. We’re not guessing at the amount of water we’re withdrawing, and we’re not guessing at what it takes to farm in the San Luis Valley,” said Conejos County farmer Nathan Coombs. He is on the board of the Rio Grande Water Conservation District’s Subdistrict 3.
San Luis garden. Photo credit: The Alamosa Citizen
“We don’t have different points of view on the same subject, we have different interests on the same subject,” Coombs said. “The San Luis Valley, we’re needing just to survive in our agriculture economy and with our neighbors. The Renewable Water proposal is just about money. It’s about an exportation of a cash commodity.
“We are struggling to keep our ship correct and to try to recover our aquifer, and then here comes this seemingly predatory-natured entity to exacerbate our problem when we’re in the middle of a hardship.”
Coombs showed Douglas County commissioners where he farms in Conejos County and how it’s 53 miles away from Renewable Water Resources’ proposed wellfield. He said it’s incomprehensible to think the RWR groundwater pumping and exportation of water to Douglas County wouldn’t impact his operations and farming operations in the Valley as a whole.
Denver Basin Aquifer System graphic credit USGS.
“Those of us who have voluntarily worked our tails off to become sustainable, it’s a slap in the face. Who am I? I’m expendable? Denver Basin aquifer should be sustained, San Luis Valley should not? We should import water so unsustained growth on the Front Range continues to expand, where I have to limit the size of my operation because I have to live within my means?
“Why are we trading one aquifer for the other? I think we all matter don’t we? Why can’t agriculture interests in the San Luis Valley matter as much as the Denver aquifer?”
For Owens, the former governor of Colorado, it’s a “false assertion that there is ‘no water’ available in the SLV.”
FromThe Fort Collins Coloradoan (Miles Blumhardt):
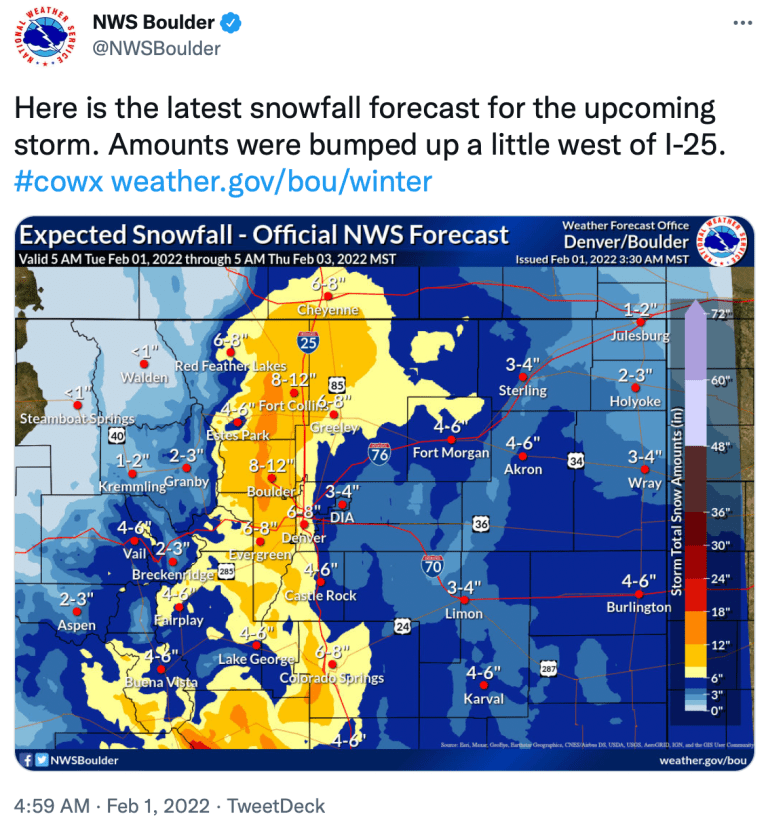
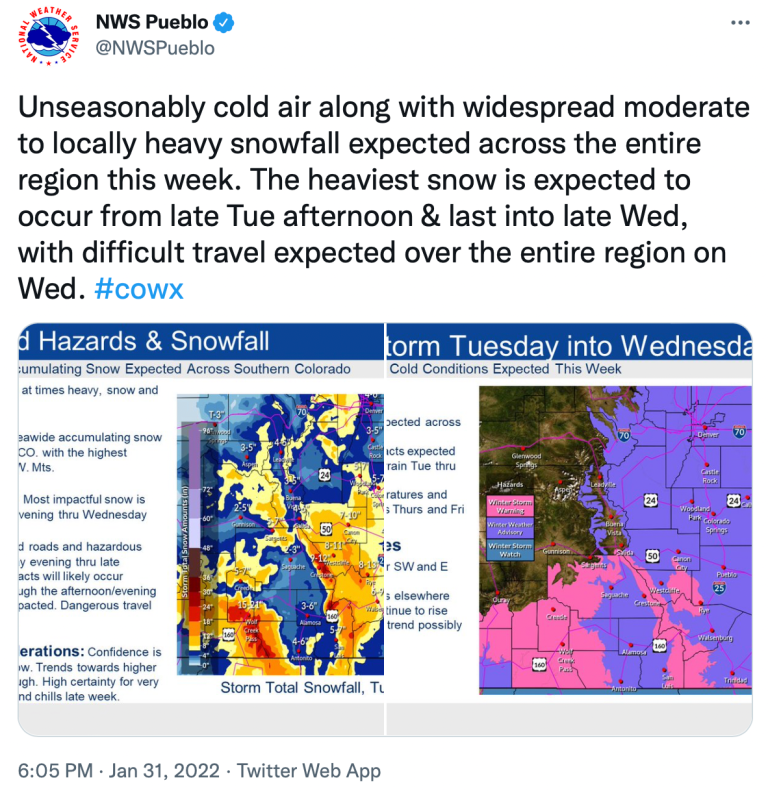
NWS issued a winter weather advisory for 5 p.m. Tuesday to late Wednesday night for a large swath of the northern mountains, foothills, I-25 corridor and stretching onto the Eastern Plains…
The slow-moving storm will mostly center on the foothills, Interstate 25 corridor and Eastern Plains, according to the National Weather Service.
Snow will first develop over the mountains and foothills Tuesday afternoon and spread east across the I-25 corridor in the late afternoon and early evening. It’ll be onto the Eastern Plains by Tuesday night.
Snow will continue throughout Wednesday, leaving behind bitter cold…
The higher snow totals are expected in the foothills and just west of I-25.
The forecast calls for an 80% chance of snow Tuesday night and 90% during the day on Wednesday in Fort Collins, resulting in 6 to 8 inches of snow…
Cheyenne, Boulder, Estes Park and Red Feather Lakes could see similar snowfall as Fort Collins, while Greeley, Denver and most of the Eastern Plains are forecast to see 4 to 6 inches…
[Fort Collins] has had 19.1 inches of snow this season, compared with the average of 26.6 inches, according to the Colorado Climate Center.
At the end of January last year, the city had 33.4 inches of snow, on its way to 80 inches for the season, which is nearly 30 inches above average.
The city has had 11.9 inches of snow this January, compared with the average of 6.5 inches. The city would have had more, but most of the New Year’s Eve snowfall total went into December because the Colorado State University campus weather station records that day’s totals only through 7 p.m.
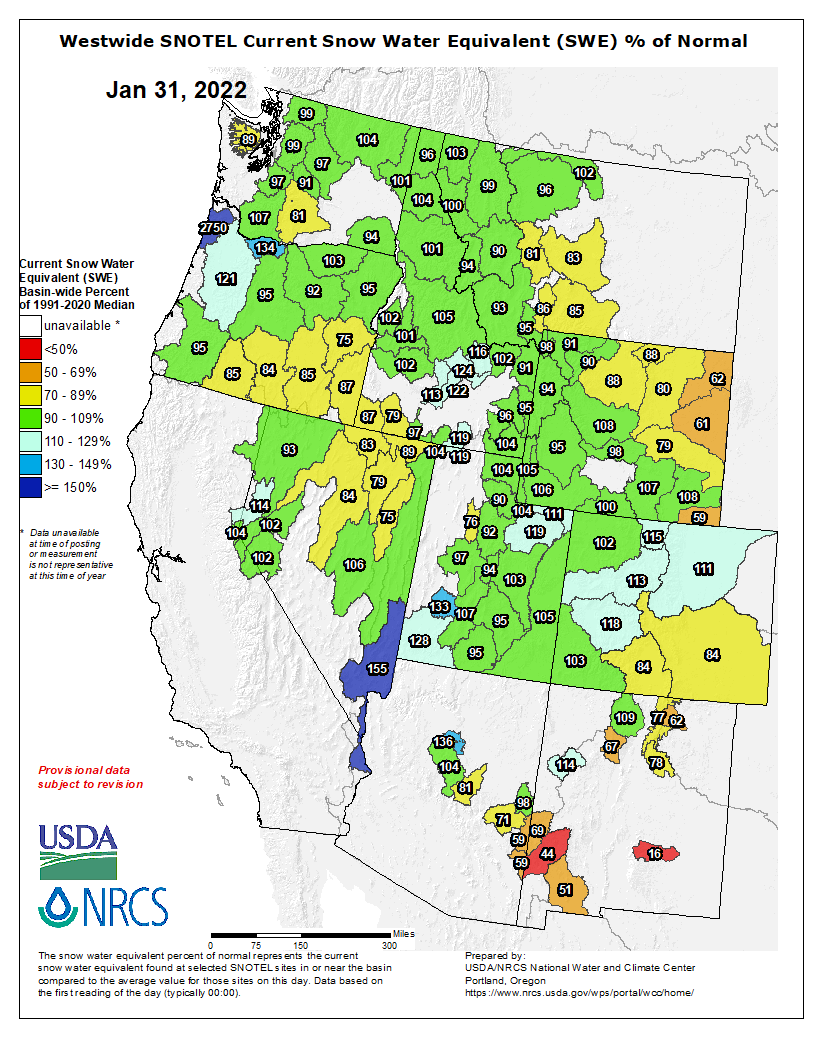
The statewide snowpack is at 104% of median, including 114% in the South Platte Basin in which Fort Collins is located, according to the National Resources Conservation Service.
Westwide SNOTEL basin-filled map January 31, 2022 via the NRCS.