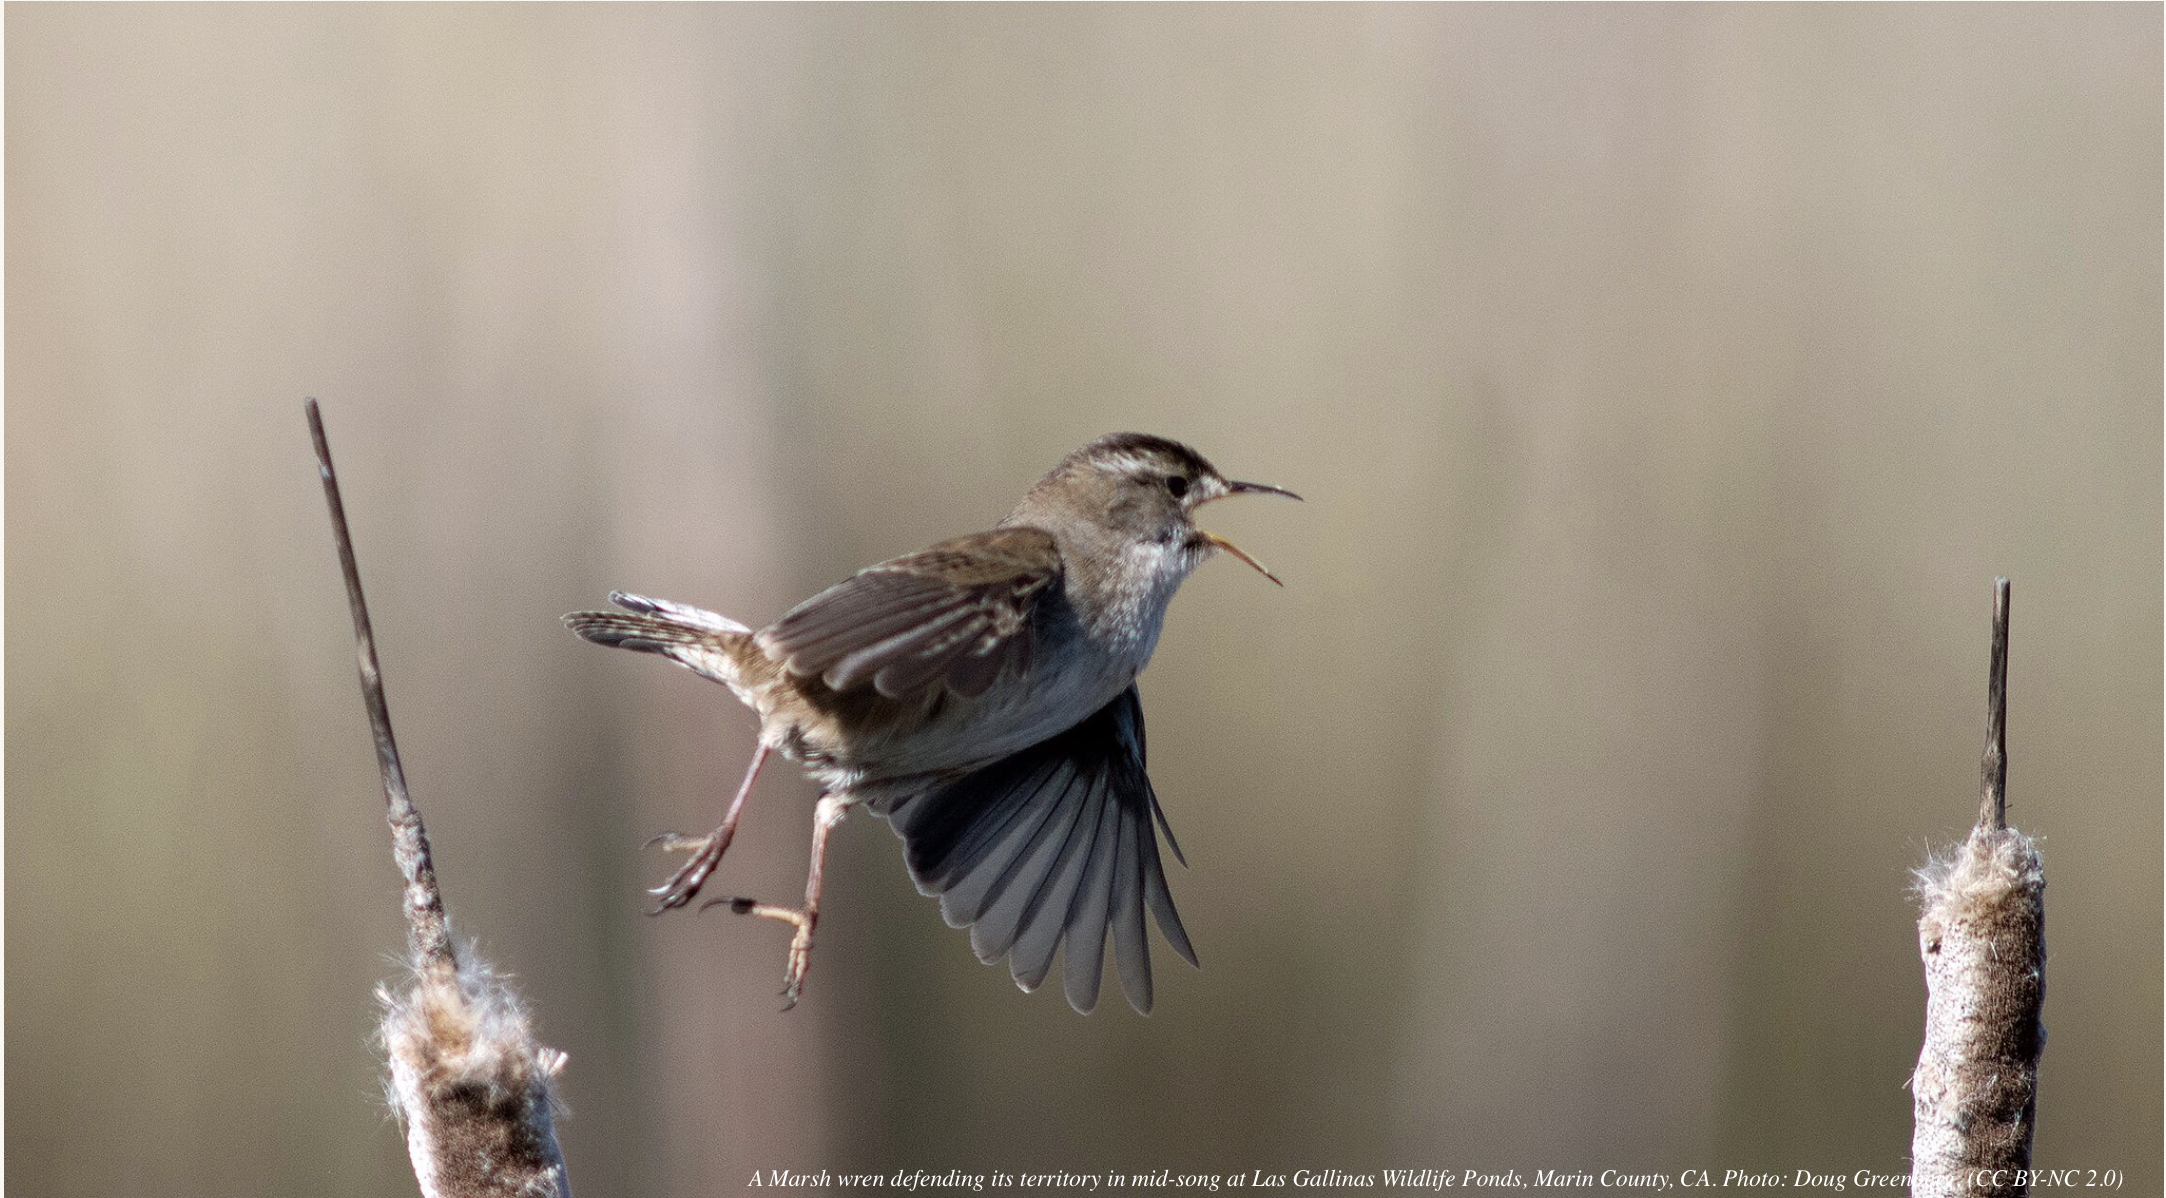
And with all that loss comes an unsettling silence.
“Unless the world acts to stop extinctions, I will write my last nature essay on a planet that is less than half as song-graced and life-drenched as the one where I began to write,” she explains in the book’s preface. “My grandchildren will tear out half the pages in their field guides. They won’t need them.”
Her book uses sound as a reference point to better understand what we stand to lose as extinction rates climb higher. But the essays are also a celebration of the natural world’s chorus and the joy of learning to hear what’s still there.
The essays are also being set to music in a series for Oregon State’s Spring Creek Project that will feature 20 4-minute-long concerts combining live musical performance with excerpts from Earth’s Wild Music.
“I’ve never been so excited about a project in my life,” Moore tells us. “It combines everything I care about with the cause that I believe in more than anything else.”
The Revelator spoke to Moore about the moral stakes of our environmental crisis, what it’s like to find a truly quiet place to listen, and what we lose as wild songs disappear.
You’ve been writing about nature for 50 years. During that time our environmental problems have become graver. Has this changed how you approach your work?
At first I was a celebrant. I believed Mary Oliver when she said, “My work is loving the world … which is mostly standing still and learning to be astonished.” And that went along fine for years and years, but then it became clear that what I was writing celebrations of were disappearing.
I was right in the midst of an essay on frog song, and bulldozers came and took away the marsh and put in a condominium. I was writing about a bald eagle nest, and the nest — and the tree it was in — burned to the ground in a forest fire. So it was starting to become clear to me that I was going to have to do more than celebrate. I was going to have to demonstrate. I was going to have to protect. I was going to have to defend the natural world.
Why did you decide to focus this collection on sound?
I started thinking about how I could open people’s hearts without breaking them. How I could point to the onrushing extinctions and not force people to turn away in absolute grief. I decided that I was going to have to write in a way that was like a wave — I would lift people and smash them at the same time.
What is it that reaches people without breaking them? What is it that goes straight into people’s hearts? What do they love about the world and will call them to action?
I decided that of all the things I loved about the world, what I loved the most was the music. What I loved the most was the sound. I’ve been writing about this for quite some time, so I had a couple of essays already under my belt, and I couldn’t think of a more wonderful writing assignment for myself then to go outside and listen.
Nature may be getting quieter. But people are getting louder. How is our noise affecting wildlife?
We are deafening. Noise that we create is causing extraordinary harm to the creatures. Think about the pain caused to the whales from the exploratory thudding of those machines that go through the ocean and stamp to try to find oil.
Think about the meadowlarks that lived in the fracking fields and had to endure endless noise of drilling and trucks. And as a result, the songs of the meadowlarks are fractured and abbreviated. They haven’t been able to hear their parents well enough to imitate them.
Many of us may be out of practice at listening. In fact, a lot of folks walk around with earphones on so we can’t hear what’s around us. How do we get better at both listening to and understanding the sounds of nature?
Listening is an art that we should practice because it does two things. It makes us shut up and it makes us open up. We stop listening just to the songs of “me, me, me”. When we set aside our own stories, it opens us up so we can listen to the stories of other beings. It’s a skill of empathy, isn’t it? Listening to other people’s stories and other creatures’ sounds is a way of understanding the world from their point of view. It’s a moral training.
When it comes to understanding what we hear, Rachel Carson, who wrote Silent Spring, and cared so much about bird song, took pains to tell us that it doesn’t matter if we know the names of what we see. That comes later. But the first thing that has to happen is love.
So I’m not so concerned about knowing which bird is calling. I’m surrounded by people who could do that in a majestic way. My husband can identify birds by their call. My neighbor can. I think it’s a beautiful skill that I don’t have.
But I do have the ability to catch a song. To hear it, which isn’t nothing. It can catch my attention and I can seek it out and I can listen to it. Knowing its name — maybe that’s not so important as knowing its tune.
How are people affected by this loss of nature’s song, and what’s the importance of preserving silent places where we can still experience what’s left?
We lose joy. Let’s face it — the sounds of the natural world are beautiful and they make us happy. I think we also lose a connection to the world around us.
In the book, I write about going with acoustic ecologist Gordon Hempton to One Square Inch of Silence, a small spot in Olympic National Park [possibly the quietest place in the United States]. It was a wonderful experience. At the time, we were in pouring rain. Nature itself was cacophonous, but we didn’t hear a human sound for 20 minutes, which is the definition in Gordon’s mind of a quiet place.
Gordon now is recording in a jungle somewhere that can only be reached by canoeing down a wild river, because it’s one of the last places on Earth he can find that’s silent.
He’s famous for these recordings called the Dawn Chorus that captured the outpouring of bird song that’s triggered by morning light. But he couldn’t do that anymore, because that music box is broken. We’re in the process of wrecking what we should be treasuring.
It’s hard to find a balance between grief and celebration. But you know, people often ask me, “What can one person do?” And I say, “Stop being one person.”
You don’t have to do it all. Other people are working all around the world on the same causes you believe in. Find them, join up with them. You’ll find your place in the choir. [Author and teacher] Joanna Macy says to choose what you love and devote yourself to it. That, she says, is enough.
A study by MIT researchers confirms that the planet harbors a “stabilizing feedback” mechanism that acts over hundreds of thousands of years to pull the climate back from the brink, keeping global temperatures within a steady, habitable range. Credits: Image: Christine Daniloff, MIT; NASA
Click the link to read the release on the MIT News website (Jennifer Chu):
The Earth’s climate has undergone some big changes, from global volcanism to planet-cooling ice ages and dramatic shifts in solar radiation. And yet life, for the last 3.7 billion years, has kept on beating.
Now, a study by MIT researchers in Science Advances confirms that the planet harbors a “stabilizing feedback” mechanism that acts over hundreds of thousands of years to pull the climate back from the brink, keeping global temperatures within a steady, habitable range.
Just how does it accomplish this? A likely mechanism is “silicate weathering” — a geological process by which the slow and steady weathering of silicate rocks involves chemical reactions that ultimately draw carbon dioxide out of the atmosphere and into ocean sediments, trapping the gas in rocks.
Scientists have long suspected that silicate weathering plays a major role in regulating the Earth’s carbon cycle. The mechanism of silicate weathering could provide a geologically constant force in keeping carbon dioxide — and global temperatures — in check. But there’s never been direct evidence for the continual operation of such a feedback, until now.
The new findings are based on a study of paleoclimate data that record changes in average global temperatures over the last 66 million years. The MIT team applied a mathematical analysis to see whether the data revealed any patterns characteristic of stabilizing phenomena that reined in global temperatures on a geologic timescale.
They found that indeed there appears to be a consistent pattern in which the Earth’s temperature swings are dampened over timescales of hundreds of thousands of years. The duration of this effect is similar to the timescales over which silicate weathering is predicted to act.
The results are the first to use actual data to confirm the existence of a stabilizing feedback, the mechanism of which is likely silicate weathering. This stabilizing feedback would explain how the Earth has remained habitable through dramatic climate events in the geologic past.
“On the one hand, it’s good because we know that today’s global warming will eventually be canceled out through this stabilizing feedback,” says Constantin Arnscheidt, a graduate student in MIT’s Department of Earth, Atmospheric and Planetary Sciences (EAPS). “But on the other hand, it will take hundreds of thousands of years to happen, so not fast enough to solve our present-day issues.”
The study is co-authored by Arnscheidt and Daniel Rothman, professor of geophysics at MIT.
Stability in data
Scientists have previously seen hints of a climate-stabilizing effect in the Earth’s carbon cycle: Chemical analyses of ancient rocks have shown that the flux of carbon in and out of Earth’s surface environment has remained relatively balanced, even through dramatic swings in global temperature. Furthermore, models of silicate weathering predict that the process should have some stabilizing effect on the global climate. And finally, the fact of the Earth’s enduring habitability points to some inherent, geologic check on extreme temperature swings.
“You have a planet whose climate was subjected to so many dramatic external changes. Why did life survive all this time? One argument is that we need some sort of stabilizing mechanism to keep temperatures suitable for life,” Arnscheidt says. “But it’s never been demonstrated from data that such a mechanism has consistently controlled Earth’s climate.”
Arnscheidt and Rothman sought to confirm whether a stabilizing feedback has indeed been at work, by looking at data of global temperature fluctuations through geologic history. They worked with a range of global temperature records compiled by other scientists, from the chemical composition of ancient marine fossils and shells, as well as preserved Antarctic ice cores.
“This whole study is only possible because there have been great advances in improving the resolution of these deep-sea temperature records,” Arnscheidt notes. “Now we have data going back 66 million years, with data points at most thousands of years apart.”
Speeding to a stop
To the data, the team applied the mathematical theory of stochastic differential equations, which is commonly used to reveal patterns in widely fluctuating datasets.
“We realized this theory makes predictions for what you would expect Earth’s temperature history to look like if there had been feedbacks acting on certain timescales,” Arnscheidt explains.
Using this approach, the team analyzed the history of average global temperatures over the last 66 million years, considering the entire period over different timescales, such as tens of thousands of years versus hundreds of thousands, to see whether any patterns of stabilizing feedback emerged within each timescale.
“To some extent, it’s like your car is speeding down the street, and when you put on the brakes, you slide for a long time before you stop,” Rothman says. “There’s a timescale over which frictional resistance, or a stabilizing feedback, kicks in, when the system returns to a steady state.”
Without stabilizing feedbacks, fluctuations of global temperature should grow with timescale. But the team’s analysis revealed a regime in which fluctuations did not grow, implying that a stabilizing mechanism reigned in the climate before fluctuations grew too extreme. The timescale for this stabilizing effect — hundreds of thousands of years — coincides with what scientists predict for silicate weathering.
Interestingly, Arnscheidt and Rothman found that on longer timescales, the data did not reveal any stabilizing feedbacks. That is, there doesn’t appear to be any recurring pull-back of global temperatures on timescales longer than a million years. Over these longer timescales, then, what has kept global temperatures in check?
“There’s an idea that chance may have played a major role in determining why, after more than 3 billion years, life still exists,” Rothman offers.
In other words, as the Earth’s temperatures fluctuate over longer stretches, these fluctuations may just happen to be small enough in the geologic sense, to be within a range that a stabilizing feedback, such as silicate weathering, could periodically keep the climate in check, and more to the point, within a habitable zone.
“There are two camps: Some say random chance is a good enough explanation, and others say there must be a stabilizing feedback,” Arnscheidt says. “We’re able to show, directly from data, that the answer is probably somewhere in between. In other words, there was some stabilization, but pure luck likely also played a role in keeping Earth continuously habitable.”
This research was supported, in part, by a MathWorks fellowship and the National Science Foundation.
The global energy crisis is driving a sharp acceleration in installations of renewable power, with total capacity growth worldwide set to almost double in the next five years, overtaking coal as the largest source of electricity generation along the way and helping keep alive the possibility of limiting global warming to 1.5 °C, the IEA says in a new report.
Energy security concerns caused by Russia’s invasion of Ukraine have motivated countries to increasingly turn to renewables such as solar and wind to reduce reliance on imported fossil fuels, whose prices have spiked dramatically. Global renewable power capacity is now expected to grow by 2 400 gigawatts (GW) over the 2022-2027 period, an amount equal to the entire power capacity of China today, according to Renewables 2022, the latest edition of the IEA’s annual report on the sector.
This massive expected increase is 30% higher than the amount of growth that was forecast just a year ago, highlighting how quickly governments have thrown additional policy weight behind renewables. The report finds that renewables are set to account for over 90% of global electricity expansion over the next five years, overtaking coal to become the largest source of global electricity by early 2025.
“Renewables were already expanding quickly, but the global energy crisis has kicked them into an extraordinary new phase of even faster growth as countries seek to capitalise on their energy security benefits. The world is set to add as much renewable power in the next 5 years as it did in the previous 20 years,” said IEA Executive Director Fatih Birol. “This is a clear example of how the current energy crisis can be a historic turning point towards a cleaner and more secure energy system. Renewables’ continued acceleration is critical to help keep the door open to limiting global warming to 1.5 °C.”
The war in Ukraine is a decisive moment for renewables in Europe where governments and businesses are looking to rapidly replace Russian gas with alternatives. The amount of renewable power capacity added in Europe in the 2022-27 period is forecast to be twice as high as in the previous five-year period, driven by a combination of energy security concerns and climate ambitions. An even faster deployment of wind and solar PV could be achieved if EU member states were to rapidly implement a number of policies, including streamlining and reducing permitting timelines, improving auction designs and providing better visibility on auction schedules, as well as improving incentive schemes to support rooftop solar.
Beyond Europe, the upward revision in renewable power growth for the next five years is also driven by China, the United States and India, which are all implementing policies and introducing regulatory and market reforms more quickly than previously planned to combat the energy crisis. As a result of its recent 14th Five-Year Plan, China is expected to account for almost half of new global renewable power capacity additions over the 2022-2027 period. Meanwhile, the US Inflation Reduction Act has provided new support and long-term visibility for the expansion of renewables in the United States.
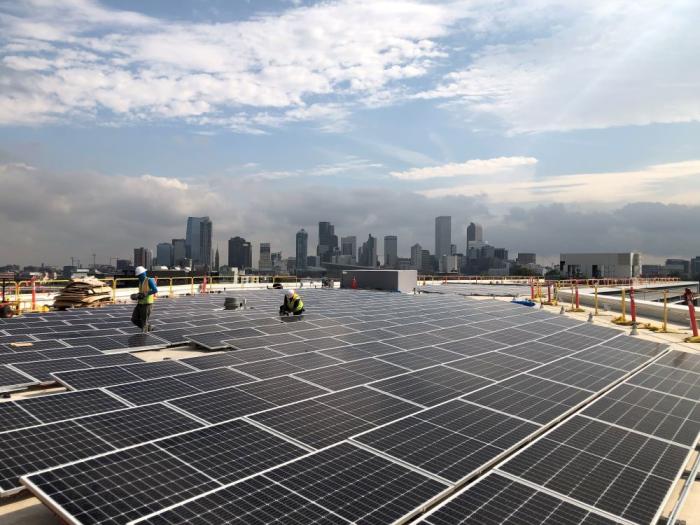
Crews install solar panels on top of Denver Water’s administration building in 2019. Photo credit: Denver Water
Utility-scale solar PV and onshore wind are the cheapest options for new electricity generation in a significant majority of countries worldwide. Global solar PV capacity is set to almost triple over the 2022-2027 period, surpassing coal and becoming the largest source of power capacity in the world. The report also forecasts an acceleration of installations of solar panels on residential and commercial rooftops, which help consumers reduce energy bills. Global wind capacity almost doubles in the forecast period, with offshore projects accounting for one-fifth of the growth. Together, wind and solar will account for over 90% of the renewable power capacity that is added over the next five years.
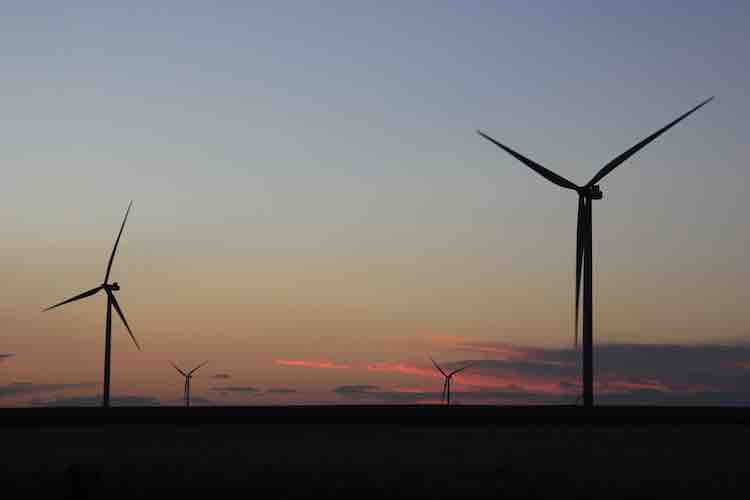
Cheyenne Ridge, located between Burlington and Cheyenne Wells, near the Kansas border, is one of many wind projects on Colorado’s eastern plains. Soon, new transmission will enable far more wind and solar projects. Photos/Allen Best Photo credit: Allen Best/The Mountain Town News
The report sees emerging signs of diversification in global PV supply chains, with new policies in the United States and India expected to boost investment in solar manufacturing by as much as USD 25 billion over the 2022-2027 period. While China remains the dominant player, its share in global manufacturing capacity could decrease from 90% today to 75% by 2027.
Total global biofuel demand is set to expand by 22% over the 2022-2027 period. The United States, Canada, Brazil, Indonesia and India make up 80% of the expected global expansion in biofuel use, with all five countries having comprehensive policies to support growth.
The report also lays out an accelerated case in which renewable power capacity grows a further 25% on top of the main forecast. In advanced economies, this faster growth would require various regulatory and permitting challenges to be tackled and a more rapid penetration of renewable electricity in the heating and transport sectors. In emerging and developing economies, it would mean addressing policy and regulatory uncertainties, weak grid infrastructure and a lack of access to affordable financing that are hampering new projects.
Worldwide, the accelerated case requires efforts to resolve supply chain issues, expand grids and deploy more flexibility resources to securely manage larger shares of variable renewables. The accelerated case’s faster renewables growth would move the world closer to a pathway consistent with reaching net zero emissions by 2050, which offers an even chance of limiting global warming to 1.5 °C.
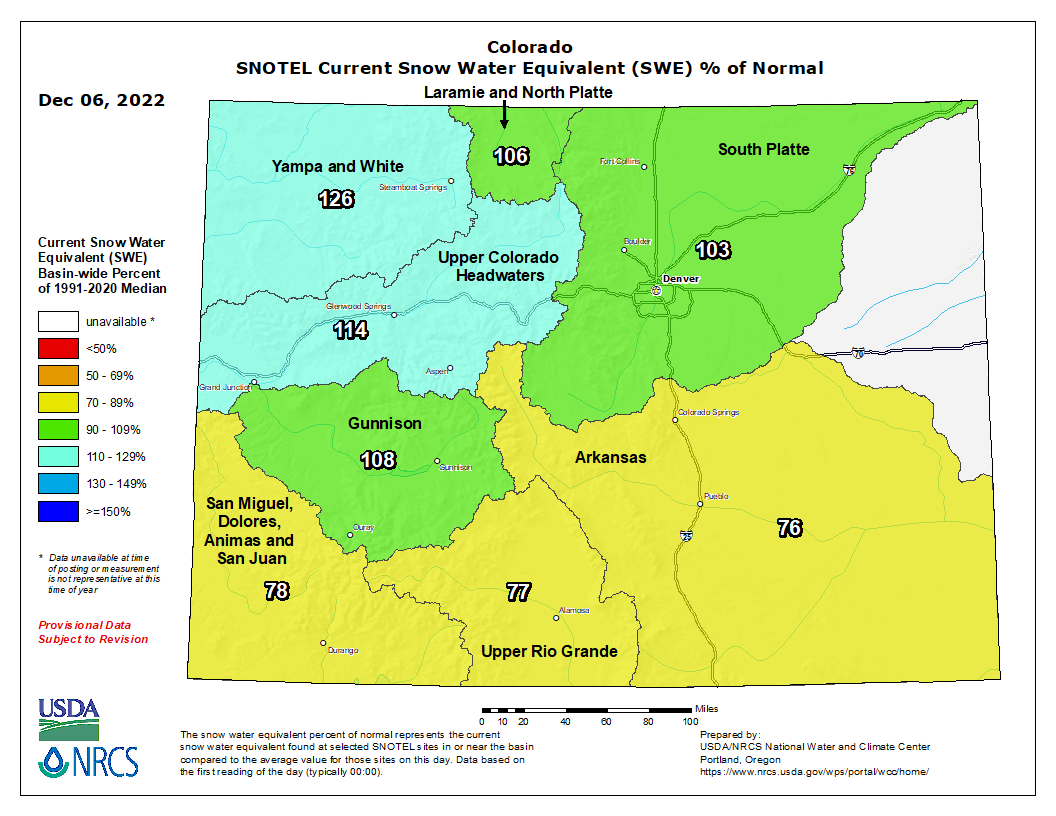
Snowpack at Indy Pass has increased by 45% since last week
Snowpack in the Roaring Fork basin reached 120.5% of average for Dec. 4 with 4.7 inches of snow-water equivalent, according to NOAA.
SNOTEL sites that monitor snowfall throughout the winter measured the snowpack at Independence Pass at 93.6% of average on Dec. 4, with a “snow water equivalent” (SWE) of 4.21 inches, up from 2.91 inches on Nov. 27. Last year on Dec. 4, the SNOTEL station up the pass (located at elevation 10,600 feet) recorded an SWE of 3.19 inches, or 70.9% of average.
The monitoring station at McClure Pass located at elevation 9,500 feet recorded a SWE of 4.29 inches on Dec. 4, or 130% of average. That’s up from a SWE of 3.5 inches on Nov. 27. Last year, on Dec. 4, the station also measured a snowpack holding 0.39 inches of water.
On the northeast side of the Roaring Fork Basin, snowpack at Ivanhoe, which sits at an elevation of 10,400 feet, reached 4.8 inches on Dec. 4, or 126.1% of average.
Snowpack at Schofield Pass reached 8.31 inches on Dec. 4, which represents 109.3% of average. Schofield Pass sits at an elevation of 10,700 feet between Marble and Crested Butte.
Snow water equivalent — the metric used to track snowpack — is the amount of water contained within the snowpack, which will become our future water supply running in local rivers and streams…
Most streams keep running close to the average
The Roaring Fork River below Maroon Creek flowed at 95 cfs on Dec. 4, or 93.3% of average, according to the USGS gauge. That’s down from Nov. 27, when the river was flowing at 101 cfs, or 103.1% of average.
At Stillwater, located upstream of Aspen, the Fork on Dec. 4 ran at 15.2 cfs or 52.4% of average, down from 15.4 cfs but up from 51.3% of average on Nov. 27.
The upper Fork’s flow is impacted by the Independence Pass transbasin diversion system that sends Roaring Fork headwaters to Front Range cities. Water flowing through the tunnel under the Continental Divide between Grizzly Reservoir on Lincoln Creek and the South Fork of Lake Creek measured 12.2 cfs on Dec. 4.
The Roaring Fork at Emma, below the confluence with the dam-controlled Fryingpan, saw on Dec. 4 streamflow of 263 cfs, or about 96% of average. That’s down from 270 cfs, but up from 94.4% of average, on Nov. 27.
Meanwhile, the Crystal River above Avalanche Creek, which is not impacted by dams or transbasin diversions, flowed at 65 cfs, or 110.7% of average, on Dec. 4. Last week, the river ran at 66 cfs, or 104.6% of average.
Letter puts kibosh on Westminster’s efforts to bring boating back
Northglenn Mayor Meredith Leighty sent a letter, signed by the eight other council members, declining Westminster’s request to meet regarding bringing boating back to Standley Lake.
“Northglenn’s water in Standley Lake is irreplaceable, valued at more than $209 million dollars. There is no level of risk that our community is willing to accept when it comes to protecting our drinking water supply,” the letter reads.
That means unless Northglenn changes their minds, Westminster will have to wait until 2030 to renegotiate the Intergovernmental Agreement. According to Thornton Spokesperson Todd Barnes, the agreement needs all three cities to agree to amend it. The move comes after Westminster held a study session on Nov. 21 discussing the possibility of reallowing boating on the lake. At the meeting, Mayor Pro Tem David DeMott, City Councilor Rich Seymour and City Councilor Lindsey Emmons said they wanted to make sure all councilors — for Northglenn and Thornton — understand the entire issue. DeMott emphasized that the decision comes down to risk and the threshold each council is comfortable accepting. Seymour said it’s a complicated subject and takes a long time to understand. In response to the letter, DeMott said he was disappointed.
In many semi-arid, snow-fed river systems, climate change is shifting the timing and quantity of streamflow; at the same time, changing water use priorities are introducing additional demands on water supplies. These dynamics challenge water security across the globe. Water markets – economic instruments used to reallocate water via voluntary trade – may be used to adapt to these changes, though their implementation remains limited. To understand how water markets may enhance water security in the western United States, we assess diverse actors’ perceptions of water allocation institutions broadly, as well as their preferences for different water market designs, in the empirical context of the Walker River Basin. This 4,200-square mile watershed, located on the California-Nevada border, exemplifies many key regional water management challenges. Through an analysis of 30 in-depth interviews, we find that actors across sectors desire changes to traditional water allocation institutions, preferably at the local level, and view markets as an acceptable tool for reallocation. Despite identified legal and social challenges, markets that facilitate temporary water trading are generally preferred. While limited to the context of a single basin, these findings provide lessons for designing water markets to enhance water security in basins regionally and beyond.
Click the link to read the article on the NOAA website:
Climate research has revealed dramatic increases in temperatures since the late 19th century, but our analysis is limited by how long temperatures have been consistently sampled around the world, providing data that lasts for only a negligible fraction of the Earth’s lifespan. How can researchers compare modern temperatures to past centuries and millennia?
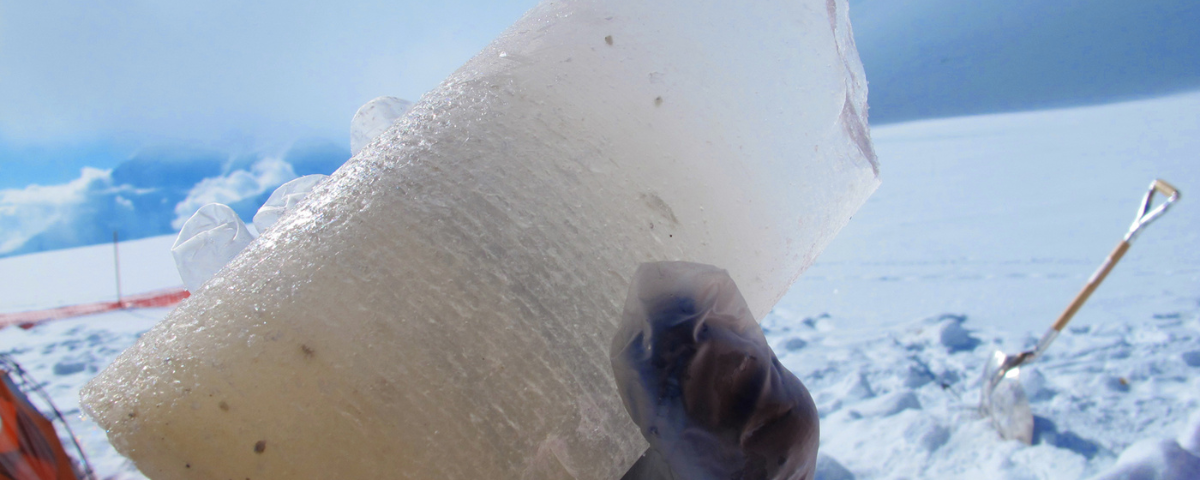
The answer is paleoclimate research. By using various proxies, scientists can infer climate information from thousands or even millions of years ago. Tree rings and ice cores contain physical or chemical evidence that can be reliably traced to certain time periods. For instance, scientists can observe the width of annual tree rings in temperature-sensitive (as opposed to moisture-sensitive) trees or the relative concentrations of oxygen isotopes in ice cores (at high latitudes, precipitation in colder conditions has a lower O-18/O-16 ratio as compared to warmer conditions).
Paleoclimate data allows us to better understand current trends in the context of centuries of climate variability.
Temperature and Carbon Dioxide Change
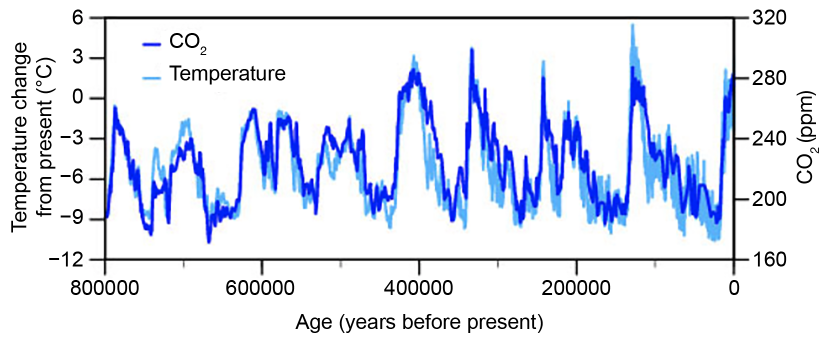
When broadly viewing the paleoclimate record, one clear trend emerges: when the concentration of carbon dioxide in the atmosphere increases, temperature increases along with it—and vice versa. These values may rise and fall over 100,000 year periods, but they do so at similar rates. This trend is consistent with the role of greenhouse gases in climate change.
Temperature change (light blue) and carbon dioxide change (dark blue) measured from the EPICA Dome C ice core in Antarctica. (Jouzel et al. 2007; Luthi et al. 2008).
Carbon dioxide is coupled to temperature in other ways. For instance, warmer temperatures release more carbon from soils and permafrost, warmer oceans absorb less carbon from the atmosphere, and warmer periods prevent the fertilization of marine phytoplankton that can take up excess carbon dioxide.
Paleoclimate data also reveals that climate change is about more than temperature. During times with lowest temperatures, snow lines were lower, continents were drier, and tropical monsoons were weaker. While some of these changes may be independent, some could be tied to changing levels of carbon dioxide. Understanding what changes may occur in the future and to what extent remains a topic of vigorous research.
Paleoclimatic Data for the Last 2,000 Years
Since the 1970s, paleoclimatologists have developed methods for reconstructing temperatures over the last 2,000 years based on a broad range of proxy data types. While some differences between these records may be due to their using diverse statistical methods, they show similar patterns of temperature variability over the last 2,000 years.
These paleoclimate reconstructions reveal three important conclusions:
Temperatures have increased over the last 50 years at an unprecedented rate.
Warmer than average temperatures are more widespread across the Northern Hemisphere since the mid-20th century than in any previous time.
Prior to 1850 CE, there was a millennial-scale cooling trend including a multi-century period with relatively cooler temperatures beginning in the 15th century.
Climate Model Simulations of the Last 1,000 Years
Paleoclimate records indicate that natural climate variations are a result of “forcings,” factors that drive the climate system to change. These forcings include solar and volcanic activity. Some theorize that these forcings are behind global warming, rather than human-caused greenhouse gas emissions. We can test this using another tool: the climate model.
Climate models are computer programs that use physical laws to determine how climate has changed in the past and may change in the future. Models range from simple ones tracking only the most essential processes to complex ones which incorporate additional important interactions between the atmosphere, ocean, sea ice, and land surface. Through modeling studies, researchers have examined the contribution of greenhouse gas concentrations to global warming.
These climate model simulations have revealed that:
Solar and volcanic activities have been responsible for some variations in Northern Hemisphere temperature over the past 1,000 years.
Neither solar nor volcanic forcing can explain the dramatic warming of the 20th century. Natural changes in these forcings would actually have resulted in a small cooling since 1960 under a normal emissions pathway.
Only by adding the human-caused increase in greenhouse gas concentrations are the models able to explain the unprecedented warmth we are experiencing.
Paleoclimate Data Before 2,000 Years Ago
Studying data from well beyond 2,000 years ago, paleoclimatologists have discovered several periods of unusually high warmth. The Mid-Holocene Warm Period, observed about 6,000 years ago, was generally warmer than today during summer in the Northern Hemisphere.
This natural warming was caused by slow changes in the Earth’s orbit, which caused shifts in the amount of solar radiation reaching each latitudinal band of the planet. Changes in the Earth’s orbit also caused warming in the Penultimate Interglacial Period about 125,000 years ago. Based on proxy evidence, the global mean annual surface temperature appeared to be higher than pre-industrial by about 1° to 2°C, but this warming was not uniform across the globe. However, this slowly varying climate forcing mechanism cannot be responsible for warming over the last 100 years.
The Early Eocene Period, about 54 to 48 million years ago, stands out as distinctly warmer than today, particularly at high latitudes. The global surface temperature was 9° to 14°C higher than today, and carbon dioxide levels were very high, between 1,000 to 2,000 parts per million (levels in 2021 were 414.27 parts per million). Scientists think that increased volcanic activity was an important cause of these high levels of carbon dioxide. Model simulations support the hypothesis that carbon dioxide concentrations maintained high temperatures in the early Eocene.
The Crystal River runs low outside of Carbondale on September 1, 2020. With average temperatures warming in summer months by as much as 3.5 degrees since the 1950s in Garfield County, streamflows are trending down as peak runoff comes earlier and more water is sucked up by evaporation and dry soils, stressing available water supplies in late summer and fall. Photo credit: Dan Bayer/Aspen Journalism
A study of a water replacement plan on the Crystal River is looking at nature-based solutions, but experts say some type of storage will also probably need to be built to solve shortages in dry years.
Wendy Ryan, an engineer with Colorado River Engineering who is heading up an analysis of a basin-wide backup water-supply plan, gave a progress update at the Colorado Basin Roundtable meeting this week. The study was funded largely by a state grant and undertaken by the Colorado River Water Conservation District and the West Divide Conservancy District.
“We have a couple landowners near Marble we are working with to see if we can put storage supplies on their properties,” Ryan said in response to a question asking her what solutions she had found. “We don’t have any shovel-ready projects. We did a lot of work upfront, and now it’s simply trying to find what we can build.”
During the hot, dry summer of 2018, the Ella Ditch, which pulls water from the Crystal River and irrigates hayfields south of Carbondale, placed a call for the first time. That means the Ella Ditch wasn’t getting the full amount to which it is entitled and upstream junior water users had to stop taking water so that the Ella could get its full amount.
The Ella Ditch has water rights that date to 1902, and any water rights younger than that — including those held by the town of Carbondale, the Marble Water Company and several residential subdivisions along the Crystal River — were technically supposed to be shut off under a strict administration of the river by the state Division of Water Resources. Under Colorado’s system of water law known as prior appropriation, those with the oldest water rights have first use of the river.
Most junior water rights holders have what’s known as an augmentation plan, which allows them to continue using water during a call by releasing water from a backup source, such as a nearby reservoir. The problem on the Crystal is that several of these residential subdivisions don’t have an augmentation plan.
Engineers from Division 5 of the Colorado Division of Water Resources have said that if water users work together to find solutions and come up with an augmentation plan, they won’t shut off indoor residential water use if the call happens again. Outdoor watering could still be shut off.
The first phase of the study, which River District representatives presented to Pitkin County commissioners in June 2021, was a demand quantification, which put numbers on the amount of water needed at different times of year.
Engineers found 90 structures — many of them wells for in-house water use — that take water from the river system and which would need to be included in the augmentation plan. These structures deliver water to 197 homes; 80 service connections in Marble; about 23 irrigated acres; Beaver Lake and Orlosky Reservoir in Marble; 16,925 square-feet of commercial space; and livestock.
In order for these water users to keep taking water during a downstream call by an irrigator, they would have to replace about 113 acre-feet in the Crystal River per year. (An acre-foot is the amount of water needed to cover an acre of land to a depth of 1 foot and can typically meet the annual needs of one or two families.) The amount of extra flow that would need to be added to the river is small — just .58 cubic feet per second during July, the peak replacement month.
The Ella Ditch, in the Crystal River Valley, placed a call for the first time ever during the drought-stricken summer of 2018. That meant the Town of Carbondale had to borrow water from the East Mesa Ditch under an emergency water supply plan. Photo credit: Brent Gardner-Smith/Aspen Journalism
Wild & Scenic jeopardized?
Ryan and staff from the River District have said they are not considering storage on the mainstem of the Crystal River, which could jeopardize a federal Wild & Scenic designation, a long-sought-after goal of Pitkin County, local environmental groups and some residents. A Wild & Scenic standing would mean no dams or out-of-basin diversions.
“We were never going to consider any mainstem storage on the Crystal River,” Ryan said. “We don’t want to do anything to jeopardize that potential designation on the Crystal, and what we are looking at shouldn’t.”
But Pitkin County Commissioner Kelly McNicholas Kury said it’s hard to see how upstream storage and a Wild & Scenic designation won’t conflict.
“It troubles me to hear the engineers say it’s hard to envision a solution that doesn’t involve storage,” she said. “So that’s just a red flag. It’s always been a red flag for Pitkin County.”
McNicholas Kury and two other roundtable members voted in 2019 against funding the study unless storage was off the table.
The Crystal River at the fish hatchery just south of Carbondale was running at about 10 cubic feet per second on Oct. 13, 2020, much lower than the state’s instream flow standard of 60 cfs. Rivers in the Roaring Fork watershed have seen below-average streamflows in water year 2020, which ended Oct. 1, despite a slightly above-average snowpack. Dry soil conditions threaten to bring a similar scenario in water year 2021. Photo credit: Heather Sackett/Aspen Journalism
Nature-based solutions
A parallel study, undertaken by the River District and environmental-and-recreation advocacy group American Rivers, is looking at nature-based solutions. The idea is that by keeping water on the landscape higher in the basin, it could recharge aquifers and boost river flows in late summer.
“We have been analyzing whether the reconnection of floodplains can assist with aquifer recharge and natural water storage while also improving the resilience of watersheds and potentially contributing to later-season flows,” said Fay Hartman, American Rivers conservation director for the Southwest region.
According to Zane Kessler, the River District’s director of government relations, there are four potential areas for nature-based projects: the Coal Basin area; Avalanche Creek upstream of its confluence with the Crystal; the Janeway area, downstream of the confluence of Avalanche Creek and the Crystal; and the confluence of Thompson Creek and the Crystal. But none of the sites are perfect, Kessler said.
“The River District and American Rivers are partners in this effort investigating whether turning back the clock on past alterations that have degraded the Crystal River can help recapture some of the climate resilience we have lost,” he said. “Improving the storage in floodplains and wetlands I think we see as an innovative and lower-impact approach to meeting late-season water needs than dams or storage in the headwaters.”
Findings and recommendations from the nature-based solutions analysis are expected by the end of the month. But Ryan said some kind of storage is still needed because nature-based solutions will still not be enough to meet the supply-demand gap in dry years, according to her analysis.
“It might meet a portion of our demands, but it’s not going to meet all our demands,” she said.
Twenty-two sanitary pads, panty liners and incontinence pads have detectable levels of fluorine, an indicator of the group of chemicals known as PFAS, according to a new report from Mamavation.
Partnering with EHN.org, the environmental wellness blog and community had 46 pads products tested by a U.S.-Environmental-Protection-Agency-certified lab and found levels of fluorine ranging from 11 parts per million, or ppm, to 154 ppm in 22 of the brands, including 13 advertised as “organic,” “natural,” “non-toxic,” “sustainable” or using “no harmful chemicals.”
Fluorine is a strong indicator of “forever chemicals”— which have been linked to everything from cancer to birth defects to lower vaccine effectiveness.
EHN.org partially funded the testing and Pete Myers, chief scientist of Environmental Health Sciences, which publishes Environmental Health News, reviewed the findings. The report comes just a month after Mamavation found PFAS evidence in popular tampon brands. A past investigation also looked at PFAS indicators in period underwear and found 11 of 17 tested pairs had detectable levels of fluorine.
But it’s not just feminine care products — earlier this year an EHN.org investigation on PFAS found the chemicals in foods, sports clothes, makeup and other products.
While the health impacts of PFAS exposure via skin contact are still somewhat unclear, Linda S. Birnbaum, scientist emeritus and former director of the National Institute of Environmental Health Sciences and National Toxicology Program, told Mamavation “Dermal exposure to PFAS from your menstrual products can be a big problem. Because vaginal skin is so vascular, we can anticipate the internal exposure could be a bit worse. This is a category of products that should NOT have any detectable fluorine.”
Why is fluorine in sanitary products?
It’s not clear how fluorine ends up in sanitary products. However, it’s possibly from trying to achieve moisture-wicking fabric, as PFAS are stain- and water-resistant. Or the contamination could be unintended via lubricants used in production, or manufacturers omitting data on — or simply not knowing — the raw materials.
The testing is part of an ongoing effort by Mamavation and EHN.org to identify PFAS in common consumer products. Follow our PFAS testing project with Mamavationat the series landing page.
San Luis garden. Photo credit: The Alamosa Citizen
Click the link to read the article on the Rocky Mountain PBS website (Sonia Gutierrez, Julio Sandoval). Here’s an excerpt:
The Colorado Department of Agriculture is aiming to address the disadvantages people like [Roberto] Meza face with a pilot lending program. Meza specializes in micro-greens. He says banks didn’t know much about the economics or profitability of said market, so they were denied loans.
“It was really, really hard for us to gain funding as first-time entrepreneurs who had very little collateral and very little business experience,” explained Meza.
To address this need, the Colorado Department of Agriculture launched their first-ever revolving loan program. Colorado’s Commissioner of Agriculture, Kate Greenberg, said the program is a $30 million fund that came out of the state’s recovery efforts. “So, over the last two years Colorado has been successful in getting $96 million for Colorado agriculture. This is a part of that package,” she said. Greenberg said the intention is for the program to live on well beyond this initial loan fund. “As we lend money and get dollars paid back through those loans, we’ll be able to initiate more loans in the future.” This program is meant to be financially inclusive. It targets people in agriculture who have historically been left out of conventional lending…
This loan can be used for conservation efforts, equipment investments and processors. “We also have terms around re-payment schedules,” explained Greenberg. “Knowing that the cashflow bottlenecks within agriculture can make it very difficult to have monthly payments. Because often times during harvest is when you’ll get your cash.”
Greenberg also said the program was perfect for families who want to continue the traditions of farming.
Many of the companies promising “net-zero” emissions to protect the climate are relying on vast swaths of forests and what are known as carbon offsets to meet that goal.
On paper, carbon offsets appear to balance out a company’s carbon emissions: The company pays to protect trees, which absorb carbon dioxide from the air. The company can then claim the absorbed carbon dioxide as an offset that reduces its net impact on the climate.
However, our new satellite analysis reveals what researchers have suspected for years: Forest offsets might not actually be doing much for the climate.
When we looked at satellite tracking of carbon levels and logging activity in California forests, we found that carbon isn’t increasing in the state’s 37 offset project sites any more than in other areas, and timber companies aren’t logging less than they did before.
The findings send a pretty grim message about efforts to control climate change, and they add to a growing list of concerns about forest offsets. Studies have already shown that projects are often overcredited at the beginning and might not last as long as expected. In this case we’re finding a bigger issue: a lack of real climate benefit over the 10 years of the program so far.
But we also see ways to fix the problem.
How forest carbon offsets work
Forest carbon offsets work like this: Trees capture carbon dioxide from the air and use it to build mass, effectively locking the carbon away in their wood for the life of the tree.
In California, landowners can receive carbon credits for keeping carbon stocks above a minimum required “baseline” level. Third-party verifiers help the landowners take inventory by manually measuring a sample of trees. So far, this process has only involved measuring carbon levels relative to baseline and has not leveraged the emerging satellite technologies that we explored.
Forest owners can then sell the carbon credits to private companies, with the idea that they have protected trees that would otherwise be cut down. These include large oil and gas companies that use offsets to meet up to 8% of their state-mandated reductions in emissions.
It’s clear that offsets are playing a large and growing role in climate policy, from the individual to the international level. In our view, they need to be backed by the best available science.
Satellites offer a more complete record than on-the-ground reports collected at offset projects. That allowed us to assess all of California since 1986.
Using satellite data, we can track carbon changes and harvest rates in offset projects (red) compared with other private forests (black and gray). The highlighted example project started in 2014 (dashed vertical line). Adapted from Coffield et al., 2022, Global Change Biology
Carbon isn’t being added to these projects faster than before the projects began or faster than in non-offset areas.
Many of the projects are owned and operated by large timber companies, which manage to meet requirements for offset credits by keeping carbon above the minimum baseline level. However, these lands have been heavily harvested and continue to be harvested.
In some regions, projects are being put on lands with lower-value tree species that aren’t at risk from logging. For example, at one large timber company in the redwood forests of northwestern California, the offset project is only 4% redwood, compared with 25% redwood on the rest of the company’s property. Instead, the offset project’s area is overgrown with tanoak, which is not marketable timber and doesn’t need to be protected from logging.
Our research points to a set of recommendations for California to improve its offsets protocols.
One recommendation is to begin using satellite data to monitor forests and confirm that they are indeed being managed to protect or store more carbon. For example, it could help foresters create more realistic baselines to compare offsets against. Publicly available satellite data is improving and can help make carbon offsetting more transparent and reliable.
California can also avoid putting offset projects on lands that are already being conserved. We found several projects owned by conservation groups on land that already had low harvest rates.
Additionally, California could improve its offset contract protocols to make sure landowners can’t withdraw from an offset program in the future and cut down those trees. Currently there is a penalty for doing so, but it might not be high enough. Landowners may be able to begin a project, receive a huge profit from the initial credits, cut down the trees in 20 to 30 years, pay back their credits plus penalty, and still come out ahead if inflation exceeds the liability.
Ironically, while intended to help mitigate climate change, forest offsets are also vulnerable to it – particularly in wildfire-prone California. Research suggests that California is hugely underestimating the climate risks to forest offset projects in the state.
The state protocol requires only 2% or 4% of carbon credits be set aside in an insurance pool against wildfires, even though multiple projects have been damaged by recent fires. When wildfires occur, the lost carbon can be accounted for by the insurance pool. However, the pool may soon be depleted as yearly burned area increases in a warming climate. The insurance pool must be large enough to cover the worsening droughts, wildfires and disease and beetle infestations.
Considering our findings around the challenges of forest carbon offsets, focusing on other options, such as investing in solar and electrification projects in low-income urban areas, may provide more cost-effective, reliable and just outcomes.
Without improvements to the current system, we may be underestimating our net emissions, contributing to the profits of large emitters and landowners and distracting from the real solutions of transitioning to a clean-energy economy.
A solar farm off CO 17 in Alamosa County. Photo by Owen Woods via The Alamosa Citizen
Click the link to read the article on the Alamosa Citizen website (Chris Lopez):
WHEN you drive across the expansive high mountain desert that is the San Luis Valley, you see acreage once irrigated through groundwater pumping wells now lying fallow. It’s a sight particularly evident in the central and western end of the Valley through Alamosa, Rio Grande and Saguache Counties, where the unconfined aquifer of the Upper Rio Grande Basin struggles from depletion due to overpumping of groundwater and decades of drought.
It’s one reality of the changing landscape that is on the minds of county officials and state leaders who represent the Valley and are trying to address ways the six-county region can at least partially replace some of its lost agricultural economy.
Another reality on the minds of local leaders is the fact that the San Luis Valley remains vulnerable to natural disasters and large-scale emergencies because there is no redundant power source to keep the Valley moving.
The vulnerabilities were demonstrated most recently both during the Spring Creek Fire in 2018 and the Boulder County fire of last December. In both situations the Valley lost critical power transmission and had no redundant system for backup power generation.
These realities are pushing local leaders to step before the Colorado Public Utilities Commission (CPUC) this month to say the San Luis Valley is interested in joining efforts of utility companies and the state to generate more renewable energy.
The clock to get involved is running, with the CPUC setting a Dec. 30 deadline to hear from interested parties on renewable energy and transmission development. Alamosa County, for one, is planning to step forward and raise its hand to let the Colorado Public Utilities Commission know that it has an interest in renewable solar generation and transmission development in the San Luis Valley.
“If we miss this and don’t act now, we will no longer be in the discussion and that’s actually what’s happened in the past,” said Alamosa County Commissioner Lori Laske.
“My concern is the redundancy and the safety of our Valley,” Laske said. “Second is with a larger (transmission) line to export our solar because right now we are maxed out with what we have.”
State Sen. Cleave Simpson and the local office of U.S. Sen. Michael Bennet have been convening local leaders this fall to work through initial conversations and to understand the opportunity the CPUC has created through what is known in the bureaucracy as a miscellaneous docket proceeding.
“The PUC is saying there’s value in evaluating the potential for solar generation and transmission in the Valley,” Simpson said.
The business case to be made is that from a solar perspective, the San Luis Valley produces 10 percent more power per solar panel than anywhere else in the state due to its base elevation of 7,500 feet and more days of sun than the Front Range and anywhere else in Colorado.
That’s according to Mike Krueger, president and CEO of the Colorado Solar and Storage Association, a nonprofit that is working with Valley leaders to get in front of the Colorado Public Utilities Commission.
“The Valley is the single best place in the state to produce those electrons,” Krueger said.
“If you had the ability to export the generation from the Valley, you’d see I would suggest thousands of acres across the six counties that would be able to support solar down there. Literally the only thing stopping people is you can’t get the power out.”
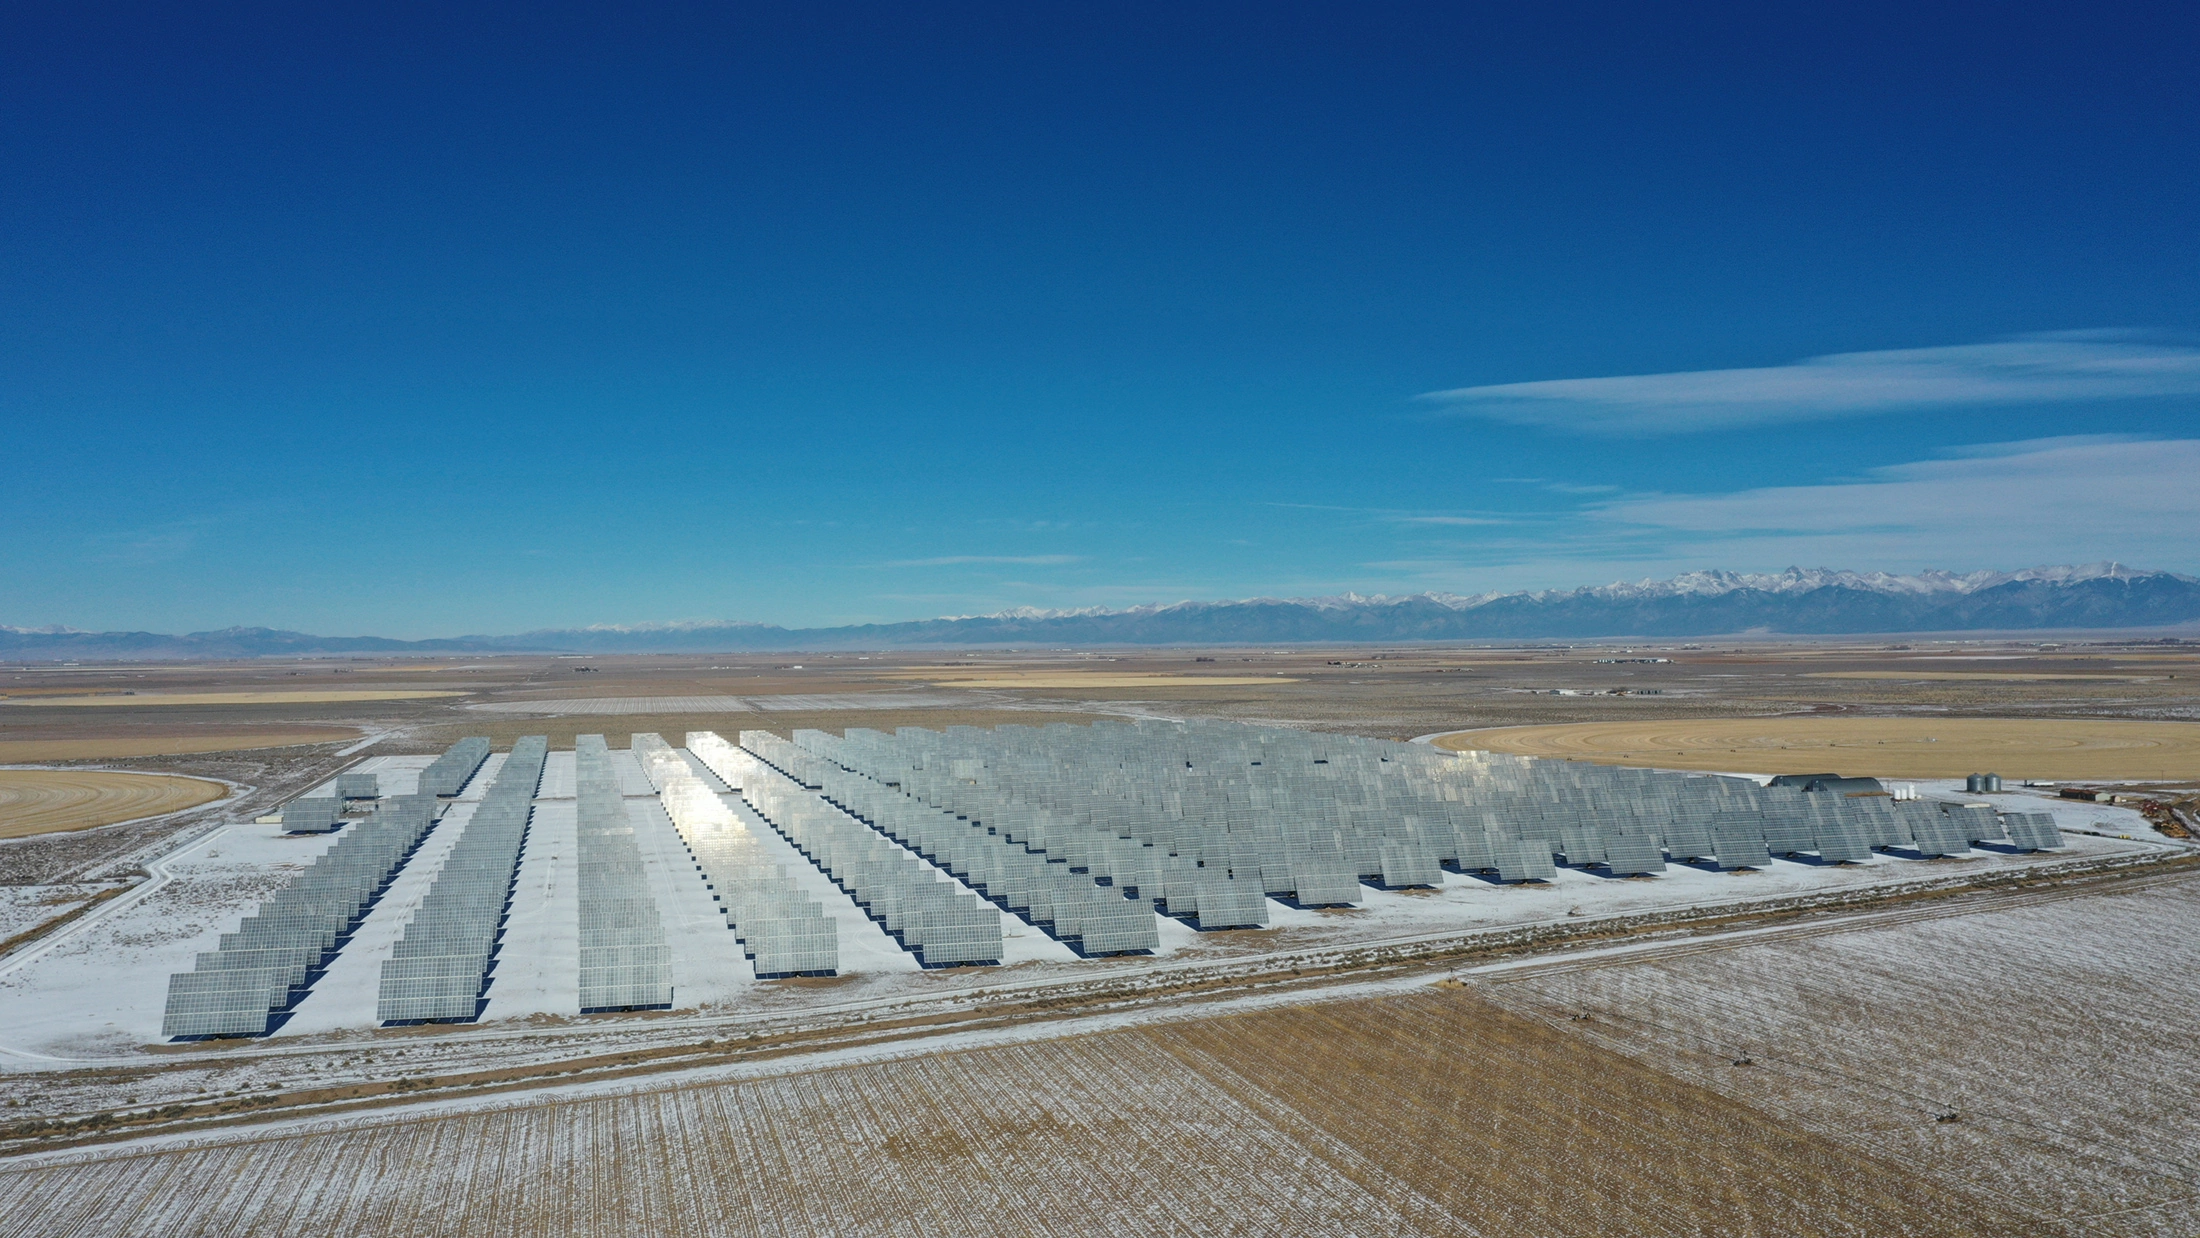
A solar farm off CO 17 in Alamosa County. The San Luis Valley produces 10 percent more power per solar panel than anywhere else in the state due to its base elevation of 7,500 feet and more days of sun than the Front Range and anywhere else in Colorado. Photo by Owen Woods via The Alamosa Citizen
KRUEGER figures landowners could command lease payments anywhere from $500 to $1,000 per acre for solar development. Simpson said at that price, there would be a market in the Valley to generate more solar power.
In the Valley there is plenty of nonproductive ag land as a result of groundwater wells being permanently shut down in recent years, and more on the way.
Valley irrigators are expecting to tap into $30 million set aside through the state Groundwater Compliance Fund that could retire another 10,000 to 20,000 acres of irrigated farm land. It’s the need to permanently retire groundwater wells and continue to reduce the amount of crops produced in the San Luis Valley that has Simpson and others searching for alternatives.
“This community should come together and say to the PUC ‘This is a huge resource, we want this resource to be developed, you decide where it should go. Where’s the most benefit to the state of Colorado and the (power) system?’” Simpson said.
It’s a consensus that he and the local staff to Sen. Bennet have been working to build. Alamosa County is expected to formally get involved and take the Valley’s case to the CPUC.
“The cards are all lined up to go ‘Colorado has this expectation of being carbon-free, so does Tri-State, so does Xcel, and you have this resource here, we just don’t have any place to go with it,” Simpson said. “I think this is a window of opportunity that isn’t going to be here forever.”
Once you generate and store the solar, and you’ve established a redundant system of power for the San Luis Valley itself, it’s then transmitting the renewable solar energy for Xcel and Tri-State to use that makes the proposition tricky and challenging.
That’s a battle for down the road. For now it’s signaling to the Colorado Public Utilities Commission that the San Luis Valley wants to be involved in generating renewable energy and new transmission routes out of the Valley.
Krueger calls it YIMBY: A move to say “Yes In My Back Yard.”
San Luis Valley. Photo credit: The Alamosa Citizen
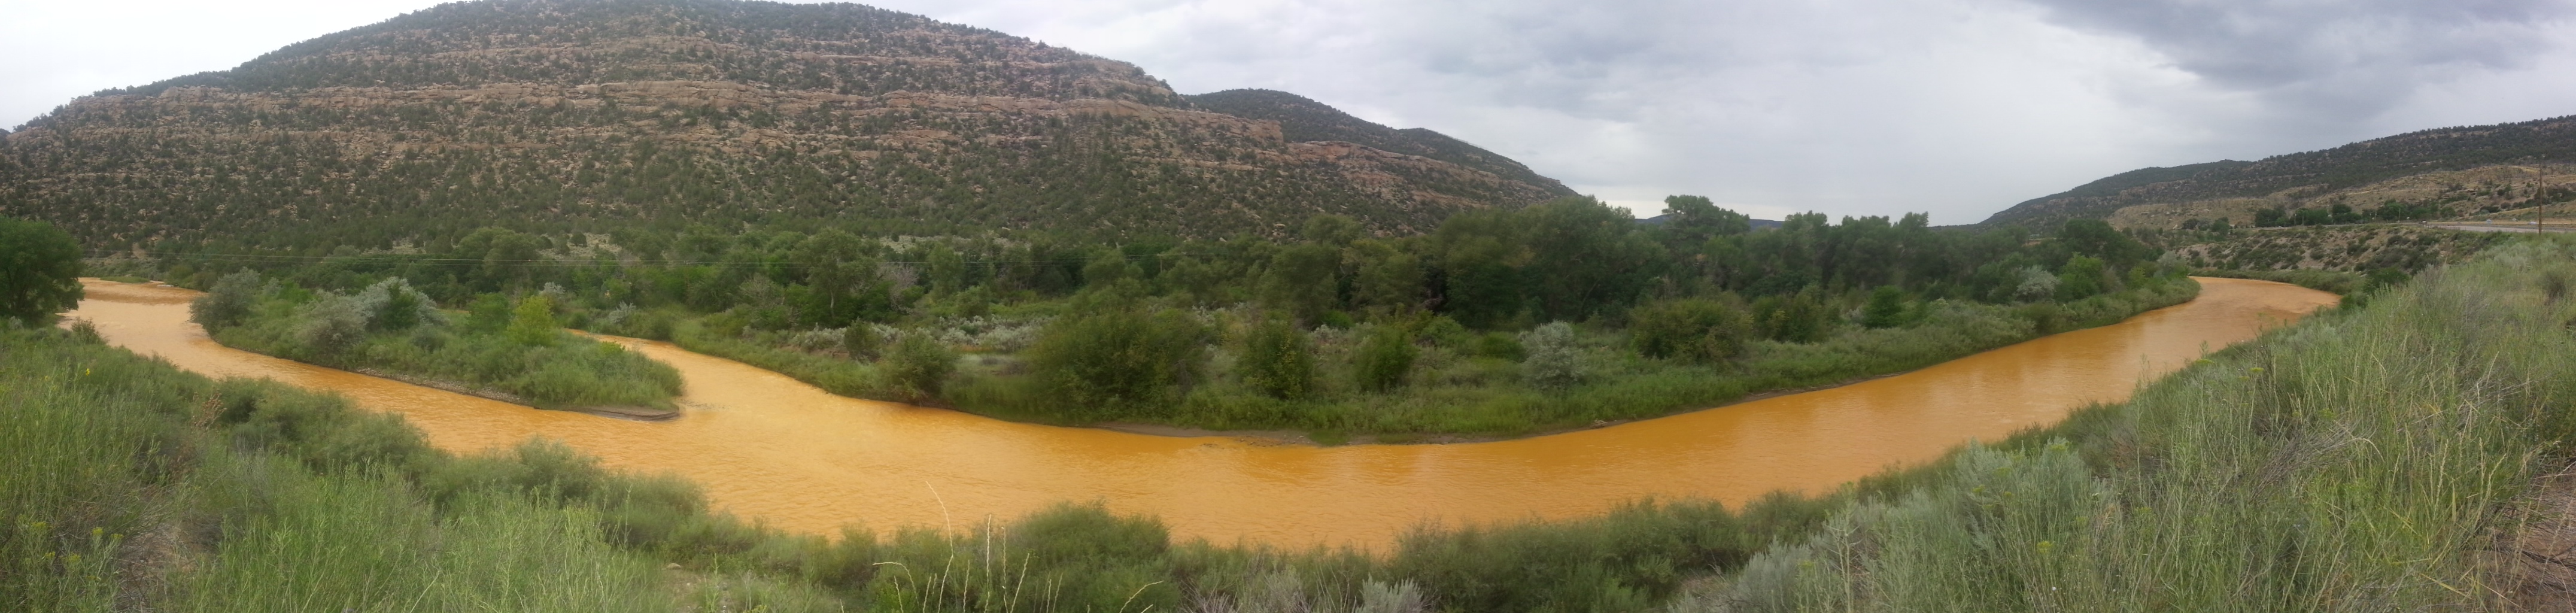
The orange plume flows through the Animas across the Colorado/New Mexico state line the afternoon of Aug. 7, 2015. (Photo by Melissa May, San Juan Soil and Conservation District)
New Mexico officials received 17 proposals totaling more than $28 million for the $10 million in Gold King Mine spill settlement money between the state and the U.S. Environmental Protection Agency that has been set aside for restoration projects. The deadline for submitting proposals for the settlement money was Oct. 28, a date that was extended from its original deadline of Sept. 30 by the New Mexico Office of the Natural Resources Trustee, the state agency that is coordinating the process. Maggie Hart Stebbins, the New Mexico natural resources trustee, said her agency has begun the process of vetting the proposals and will be analyzing them to determine if additional information is needed from any of the entities seeking the funding…
The $10 million is part of a $32 million settlement the state reached with the EPA earlier this year to compensate New Mexico for damages related to the August 2015 incident, during which millions of gallons of toxic waste were released from the abandoned Gold King Mine near Silverton, Colorado, eventually winding up in the Animas and San Juan rivers. A total of $18.1 million from that settlement was designated for response costs, while $3.5 million was set aside for water quality and cleanup activities through Clean Water Act and Superfund grants. The remaining $10 million has been earmarked for restoration of injured natural resources, much of which state officials said would be used to fund outdoor recreation opportunities in northwest New Mexico…
The list of proposals includes several projects submitted by government entities in San Juan County, as well as those associated with the Navajo Nation and the state of New Mexico. San Juan County submitted three proposals, while the City of Aztec submitted two, and the cities of Bloomfield and Farmington submitted one each. New Mexico State Parks led the way with four proposals, while the New Mexico Tourism Department submitted one.
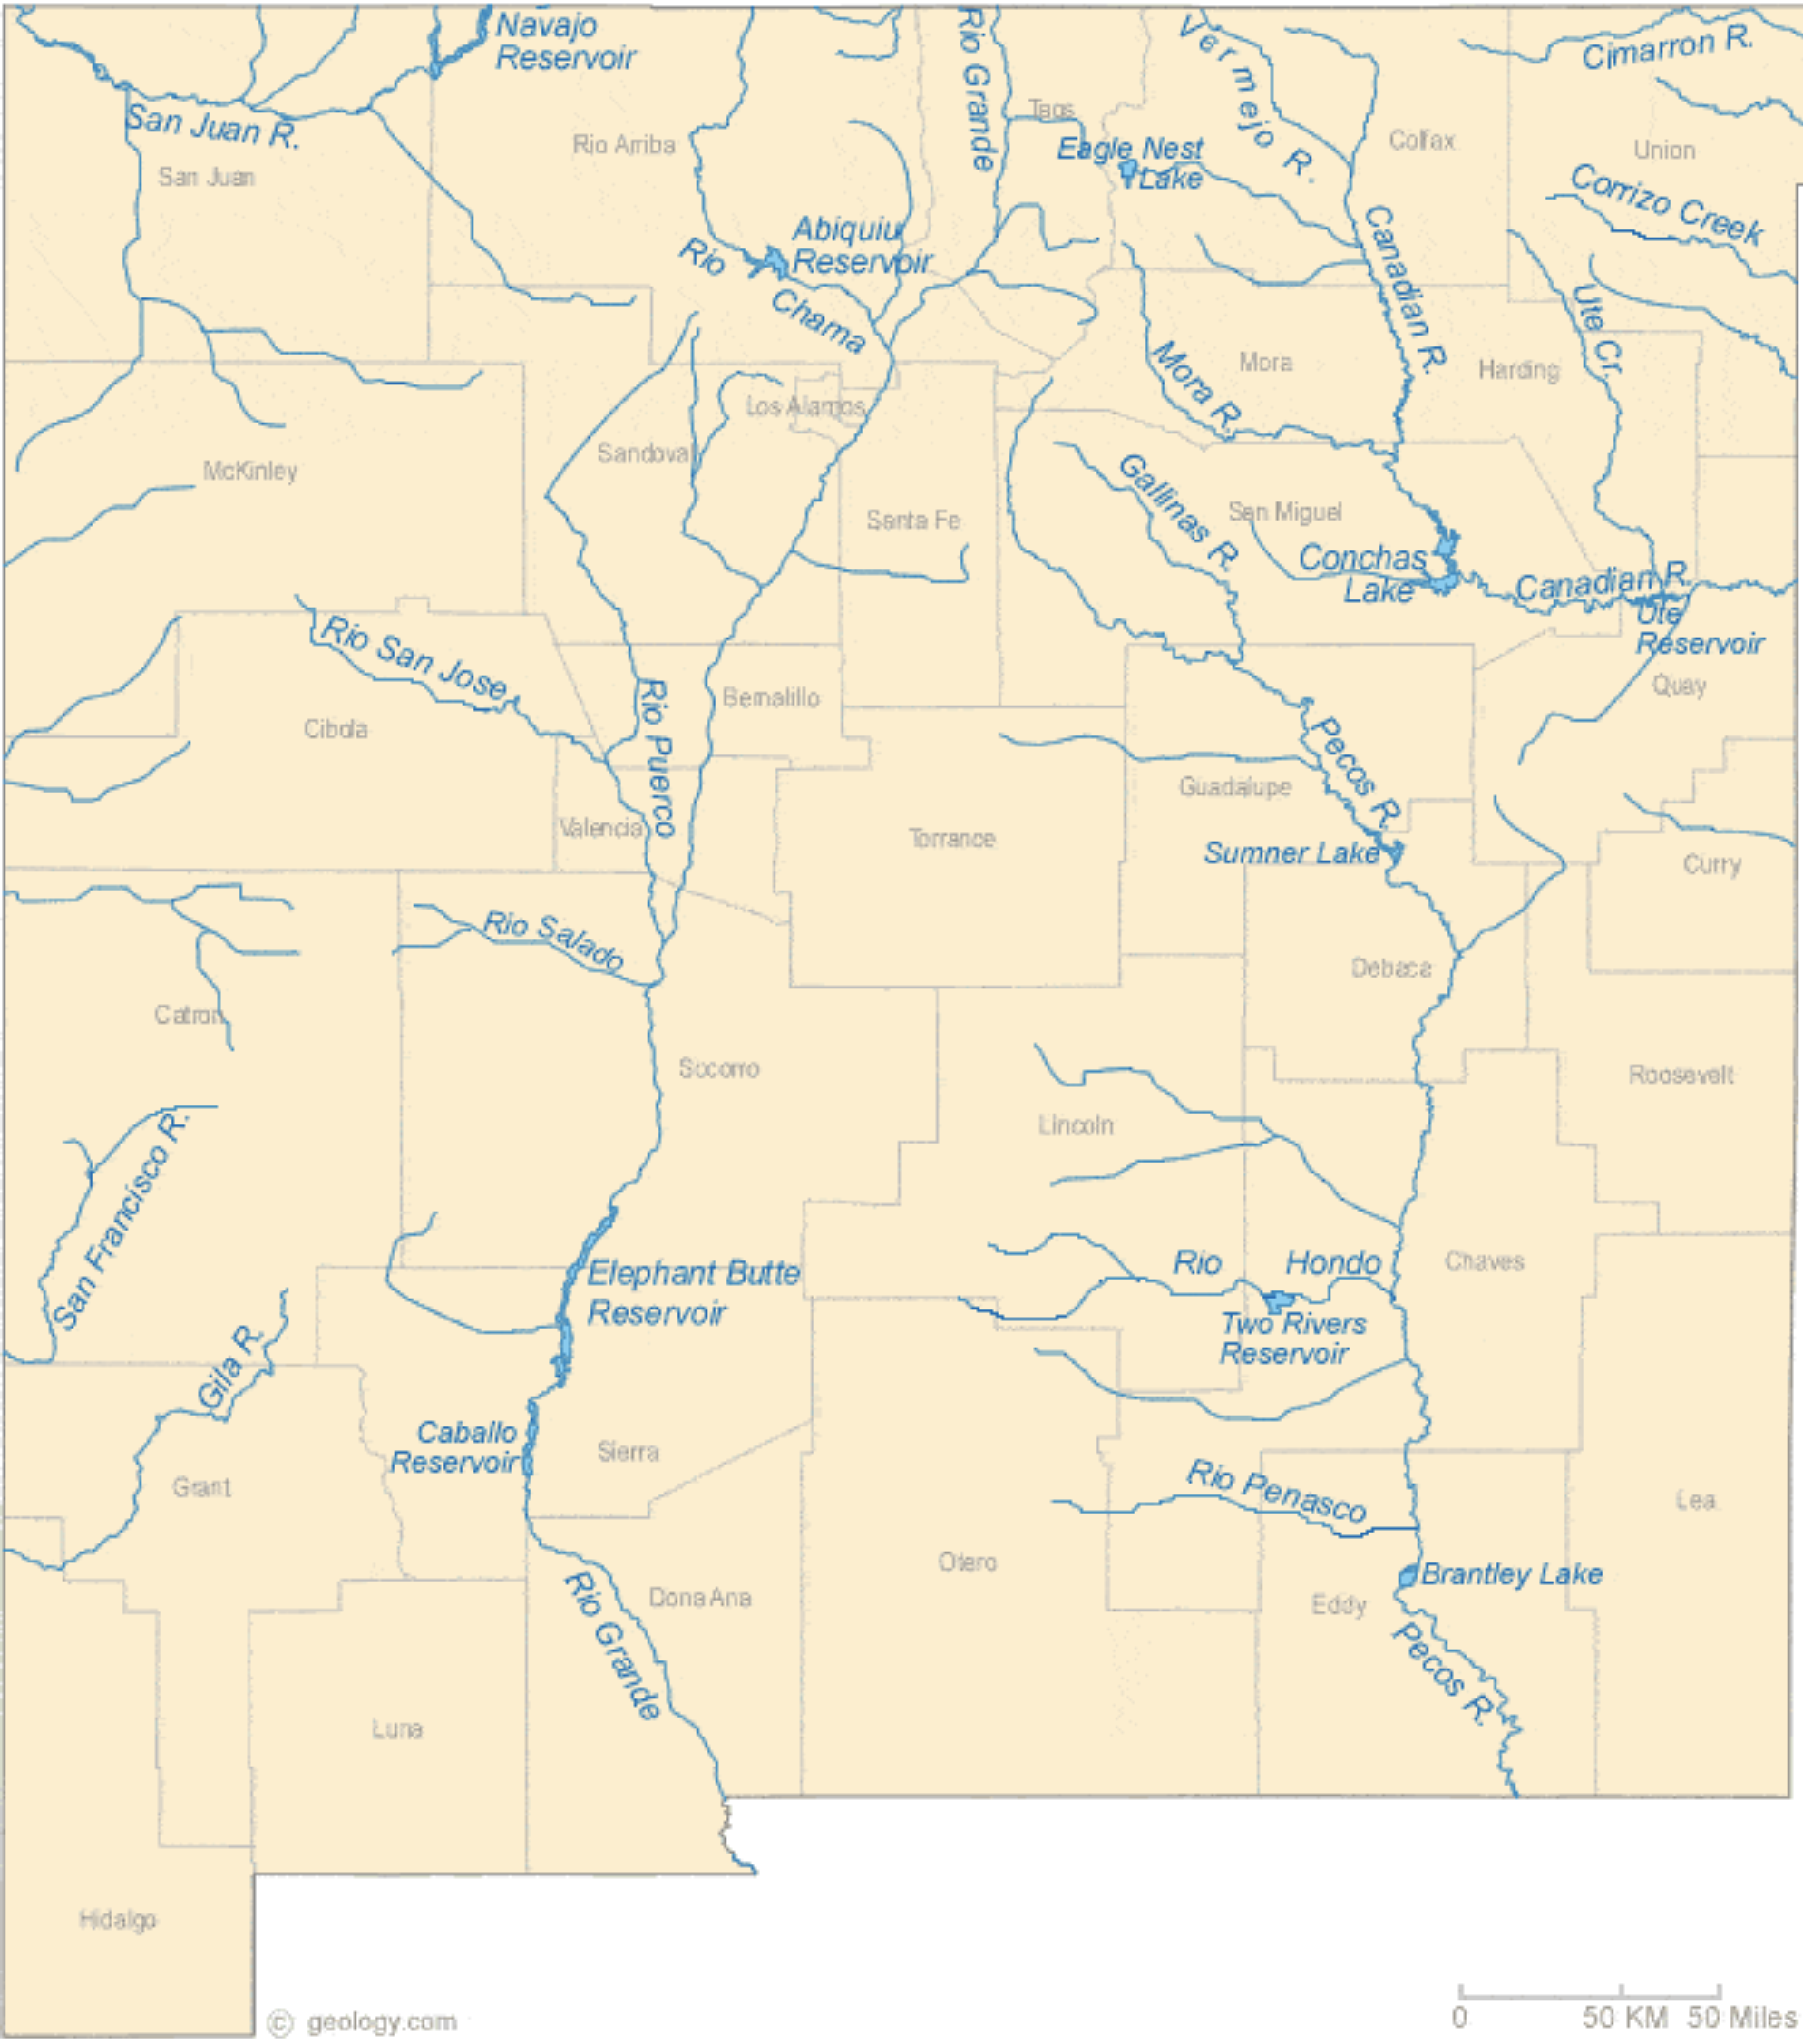
New Mexico Lakes, Rivers and Water Resources via Geology.com.
Click the link to read the article on the InkStain website (John Fleck):
The Bureau of Reclamation folks haven’t posted the slides yet from last week’s Supplemental Environmental Impact Statement briefings. In the meantime, some of us in the Colorado River nerd world have been passing around our screenshotted copies like some sort of precious mimeographed ’60s ‘zine.
It was a remarkable affair.
Buried in the tables and graphs was a sobering message: If we are to take climate change seriously, we need to be prepared for the possibility of:
driving Lake Mead to “dead pool” in order to protect the structural integrity of Glen Canyon Dam
driving Lake Powell below the critical power pool threshold, where Reclamation is forced to use Glen Canyon Dam’s dicey outlet works, in order to protect Lake Mead from reaching dead pool
releases from Lake Mead of as low as 3.8 million acre feet in a single near future year – a ~5 million acre foot reduction from current levels
Lake Powell releases dropping below the 10 year-by-75 million acre foot benchmark set by the Colorado River Compact. Not merely the 10×82.5 maf number that includes the Upper Basin’s share of the U.S. Mexican treaty obligation. Below 10x75maf.
To be clear, Reclamation is not projecting those numbers. Rather, this is the no-holds-barred reality check being offered by Reclamation’s technical team of a plausible scenario for which we need to be prepared.
Given the context in which these numbers are being offered – new operating rules under a revised version of the 2007 Interim Guidelines – it seems clear where this is headed.
REFILLING
First and foremost, if we have a wet year this year, we need to hold water back now. I can imagine, for example, a new rule that constrains releases from Glen Canyon Dam indexed to inflows – perhaps “don’t release any more water from Glen this year than last year’s unregulated inflow”. If my hypothetical rule takes evaporation into account, that would mean something around a 6maf Powell release in 2023.
Just hypothetically.
One of the flaws we can now clearly see in the ’07 guidelines is that they were keyed to reservoir elevations rather than the actual flow of the river, in a way that allowed us to drain Mead and Powell. We have a chance for a tweak to save us from the worst of that over the next few years. [ed. emphasis mine]
LOWER BASIN USE
Cutting Powell’s releases, as we must do, quickly crashes Lake Mead, pushing it well down into the ’07 guidelines shortage tiers. But the model runs presented by reclamation show those current shortage tiers won’t be enough.
So a new set of rules, to get us through the next few years, has to offer up much deeper Lower Basin cuts than the current rules in the ’07 guidelines and Drought Contingency Plan. It also seems clear, after staring at Reclamation’s slides from last week’s briefing, that we need the cuts to kick in sooner, at higher Mead levels, if we are to be prepared for the possibilities contemplated in the briefing. I’m intrigued by a “double DCP” notion that’s been kicking around the basin community, because it’s based on ratios for shortages among the Lower Basin states that have already been negotiated.
My back-of-the-envelope look at those numbers suggests to me that Double DCP at higher Mead elevations might be going a little harsh on Arizona and easy on California. Dunno. Thinking about equities, “present perfected rights”, Tribal water, environmental flows, and my friends in the Lower Basin gives me a headache.
But I’ve got plenty of aspirin and 16 days until Interior’s deadline for comments, so perhaps I’ll make it.
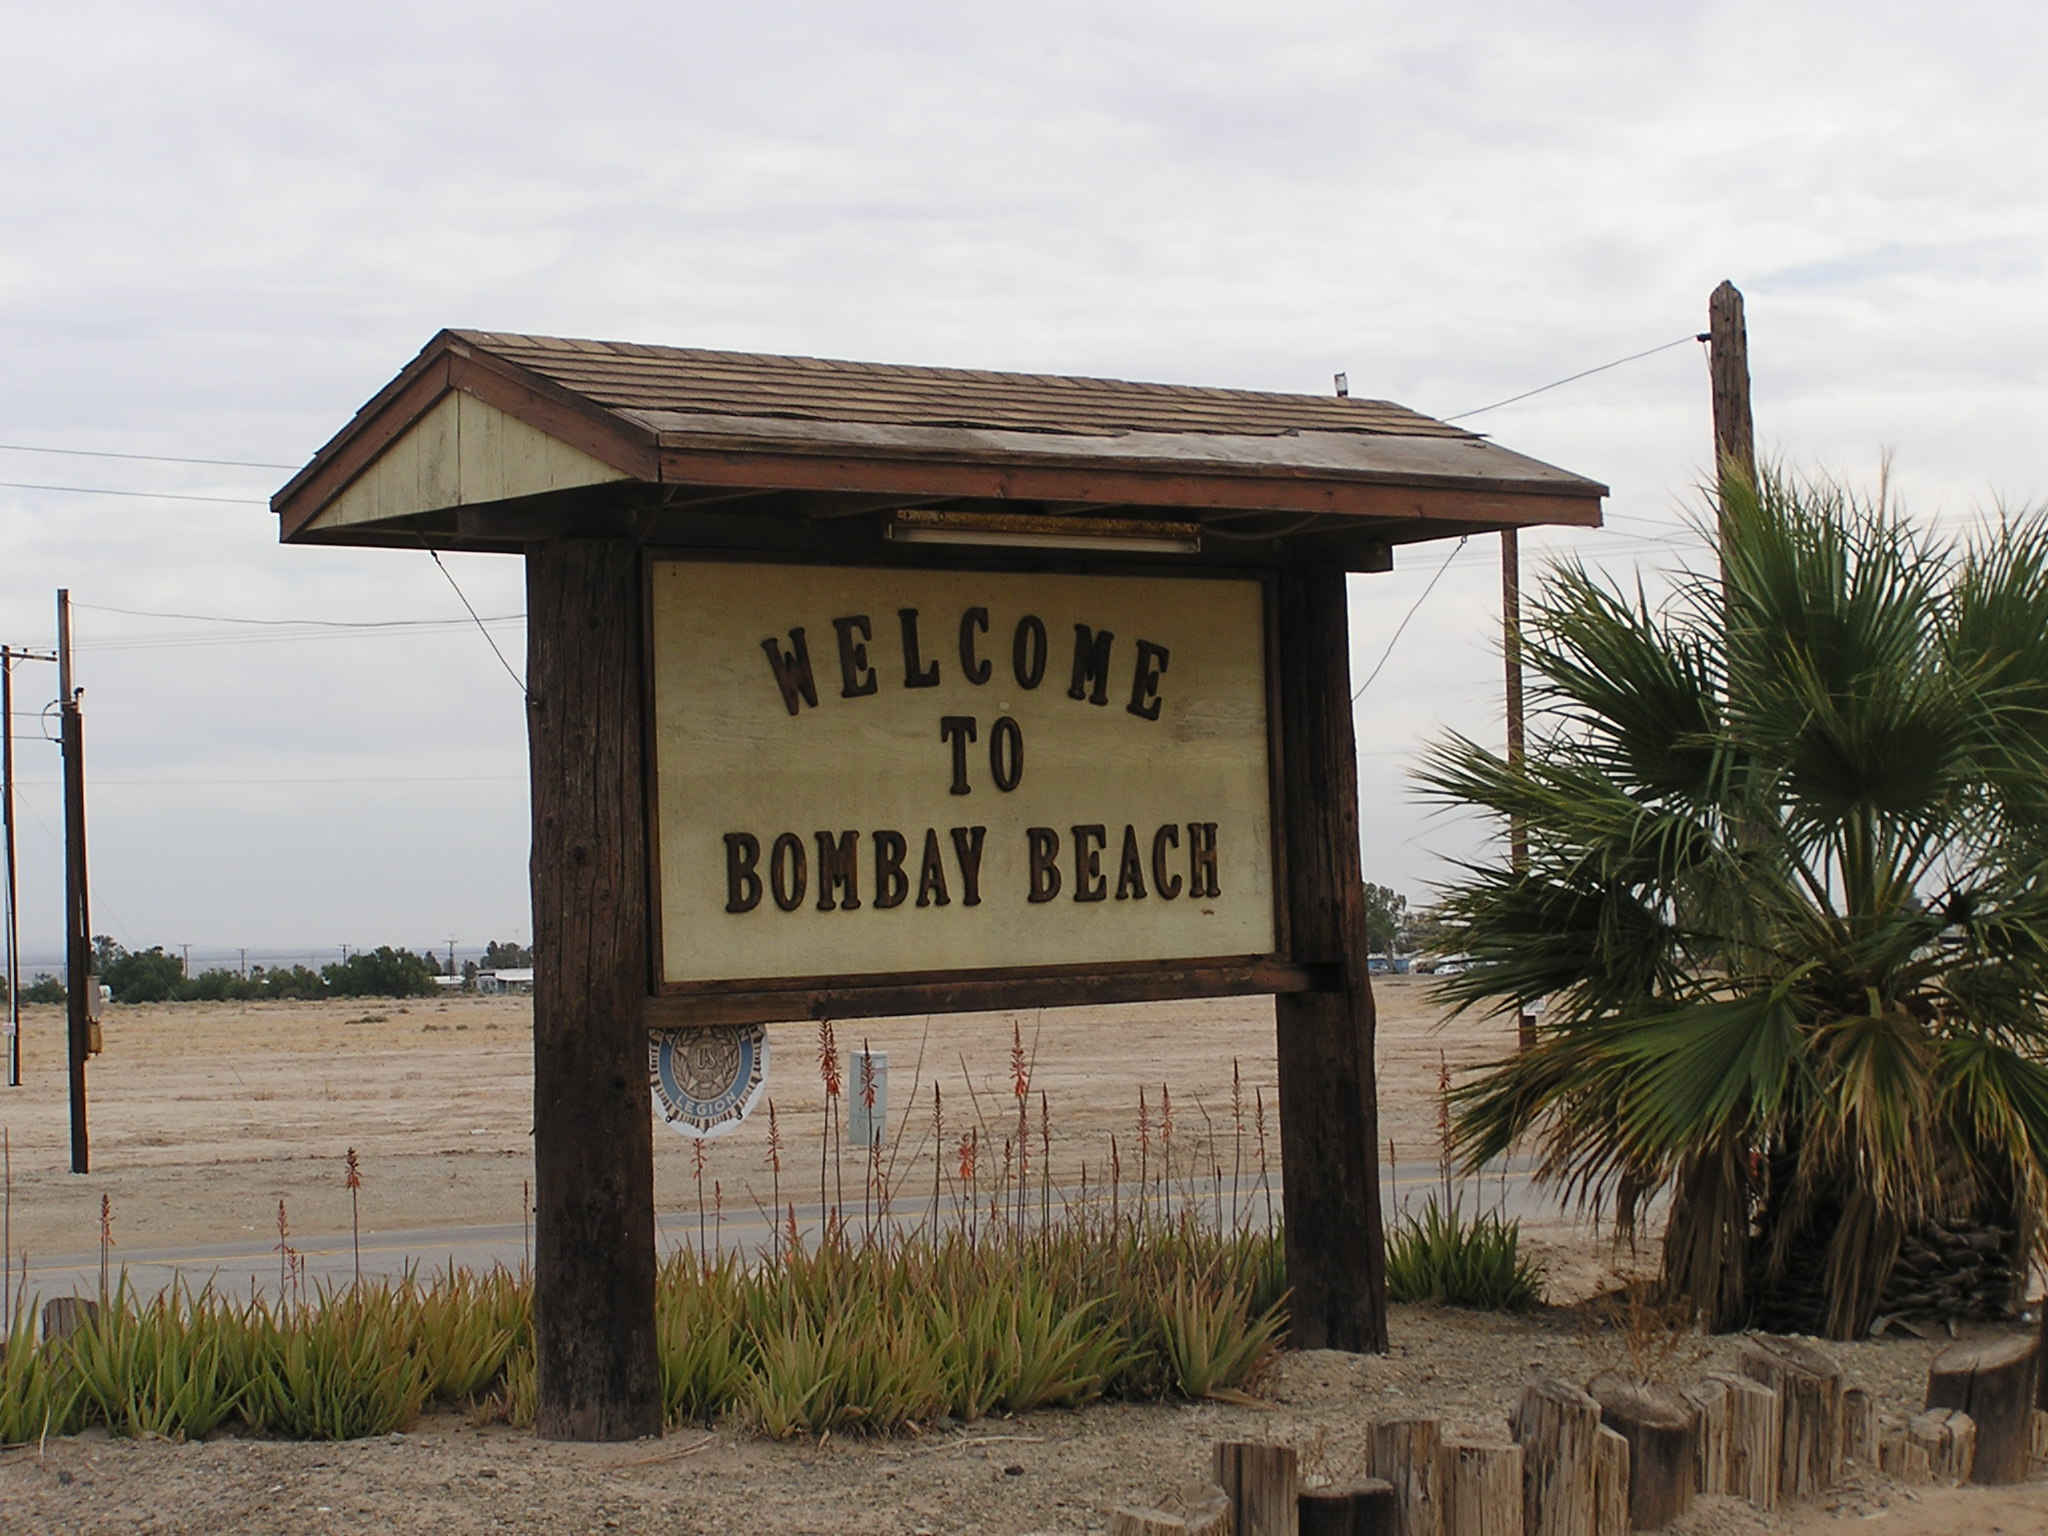
Audubon California has received $500,000 from General Motors to help support its work on the fast-dwindling Salton Sea. Audubon will use the funds toward the design of public recreational facilities at its 900-acre Bombay Beach wetland restoration site; to conduct research into the lake’s biofilm, or bacterial species; to assess its overall ecosystem health; and to engage local communities on the future of the huge water body…
“The Salton Sea is an enormous resource to California, to the western United States, and the entire Western Hemisphere,” said Frank Ruiz, director of Audubon California’s Salton Sea Program. “That means more than just lithium extraction: The sea should provide recreational opportunities and badly needed access to the outdoors for residents of park-poor surrounding communities, as well as continue its role as a stopover of hemispheric importance to millions of migrating birds. We’re grateful to GM for this grant and its commitment to helping halt the sea’s decline.”
In a news release about the GM funding, Audubon California said the grant will help fund planning for infrastructure at Bombay Beach that will provide habitat for birds and threatened Desert Pupfish, control wind-blown dust off of drying, exposed lakebed, and provide educational features for visitors. The award also will help fund Audubon’s Salton Sea science staff, working with local environmental youth leaders, to take water and soil samples, survey bird populations and conduct other research, including the hiring of a local graduate student to investigate food availability for migratory shorebirds. In addition, Audubon will conduct outreach to and engage with local residents on issues pertaining to the sea.
The Colorado River has long been regarded as the “lifeline of the Southwest.” It supplies water to 40 million people in seven states, 29 Native American tribes and parts of Mexico. Farmers use it to irrigate nearly 5.5 million acres of agricultural land.
One hundred years ago this month, the signing of the Colorado River Compact laid the foundation for how water from the river is used today. But the signers of the 1922 agreement had no way of knowing what the future would bring. Decades of overuse because of faulty science and population growth—along with climate change—have all reduced the river’s flow and the water levels in the nation’s largest reservoirs, Lake Mead and Lake Powell. Now, the basin is facing a crisis.
“The conditions that we’re experiencing now are far worse than anyone anticipated them to ever be,” Crystal Tulley-Cordova, principal hydrologist at the Navajo Nation Department of Water Resources, tells Smithsonian magazine.
So, how did the situation evolve into what it is today? And what comes next for the basin? Here are five things you should know about the 1922 agreement for its 100th anniversary.
Where is the Colorado River?
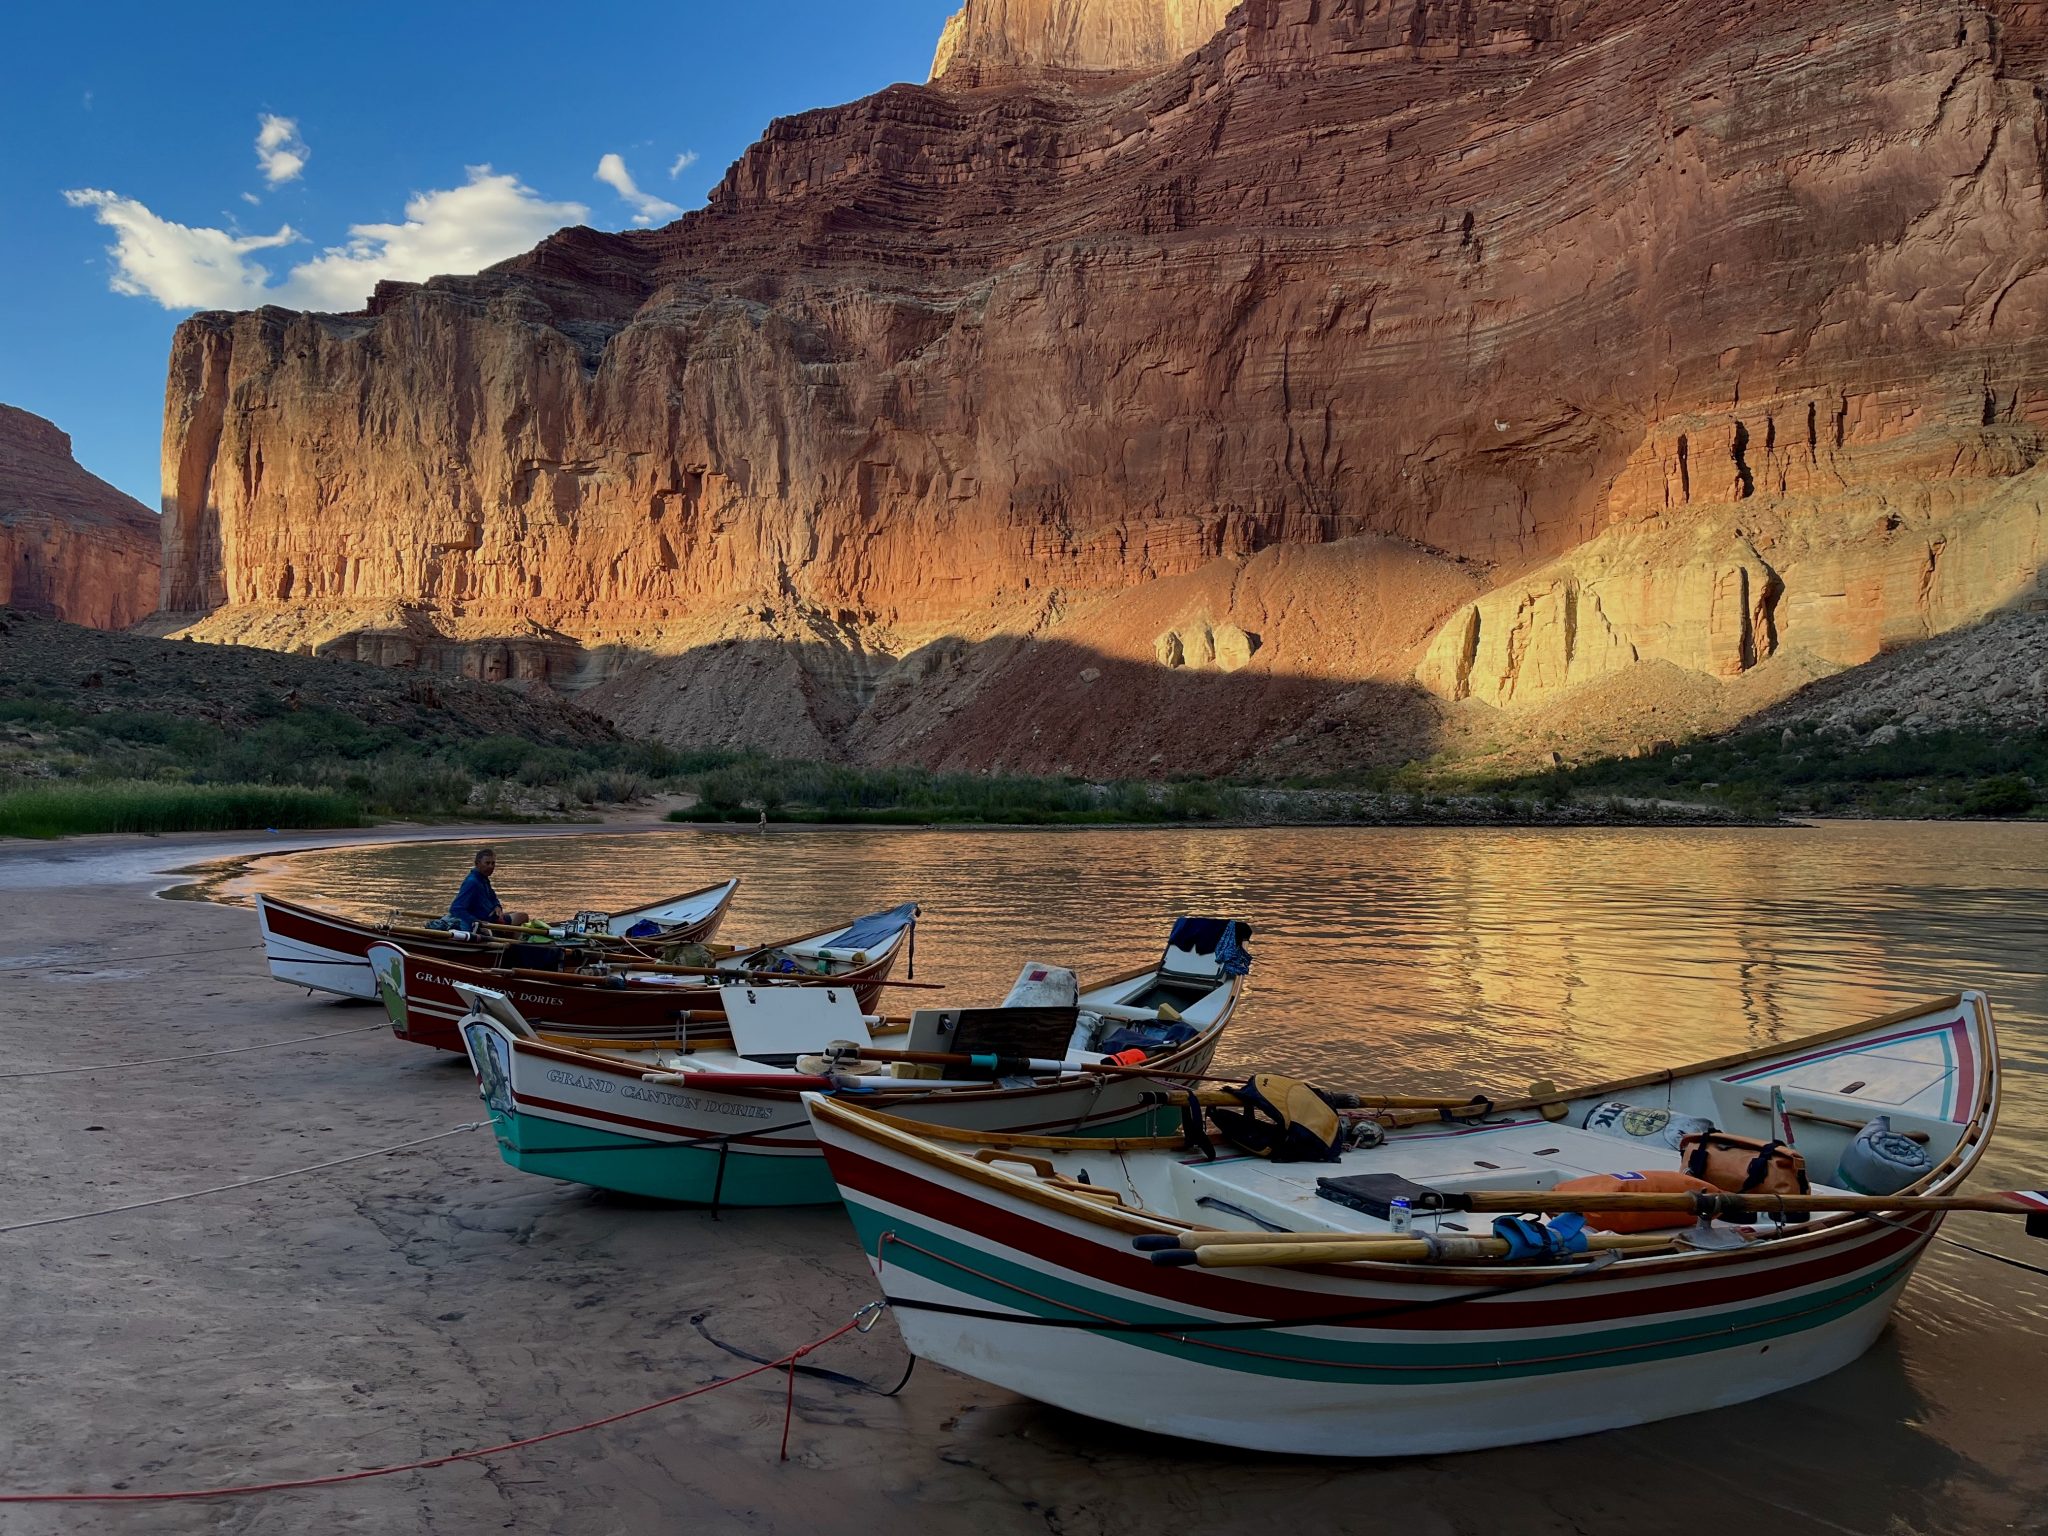
The 1,450-mile-long river begins in the Rocky Mountains of Colorado. It passes through Lake Powell, the Grand Canyon and Lake Mead before ending in Mexico’s Sonoran Desert. Altogether, its drainage basin spans about 246,000 square miles, representing 8 percent of the land in the continental United States.
While the river historically stretched all the way to the Gulf of California, damming and overuse have prevented the water from regularly flowing into the gulf since the 1960s.
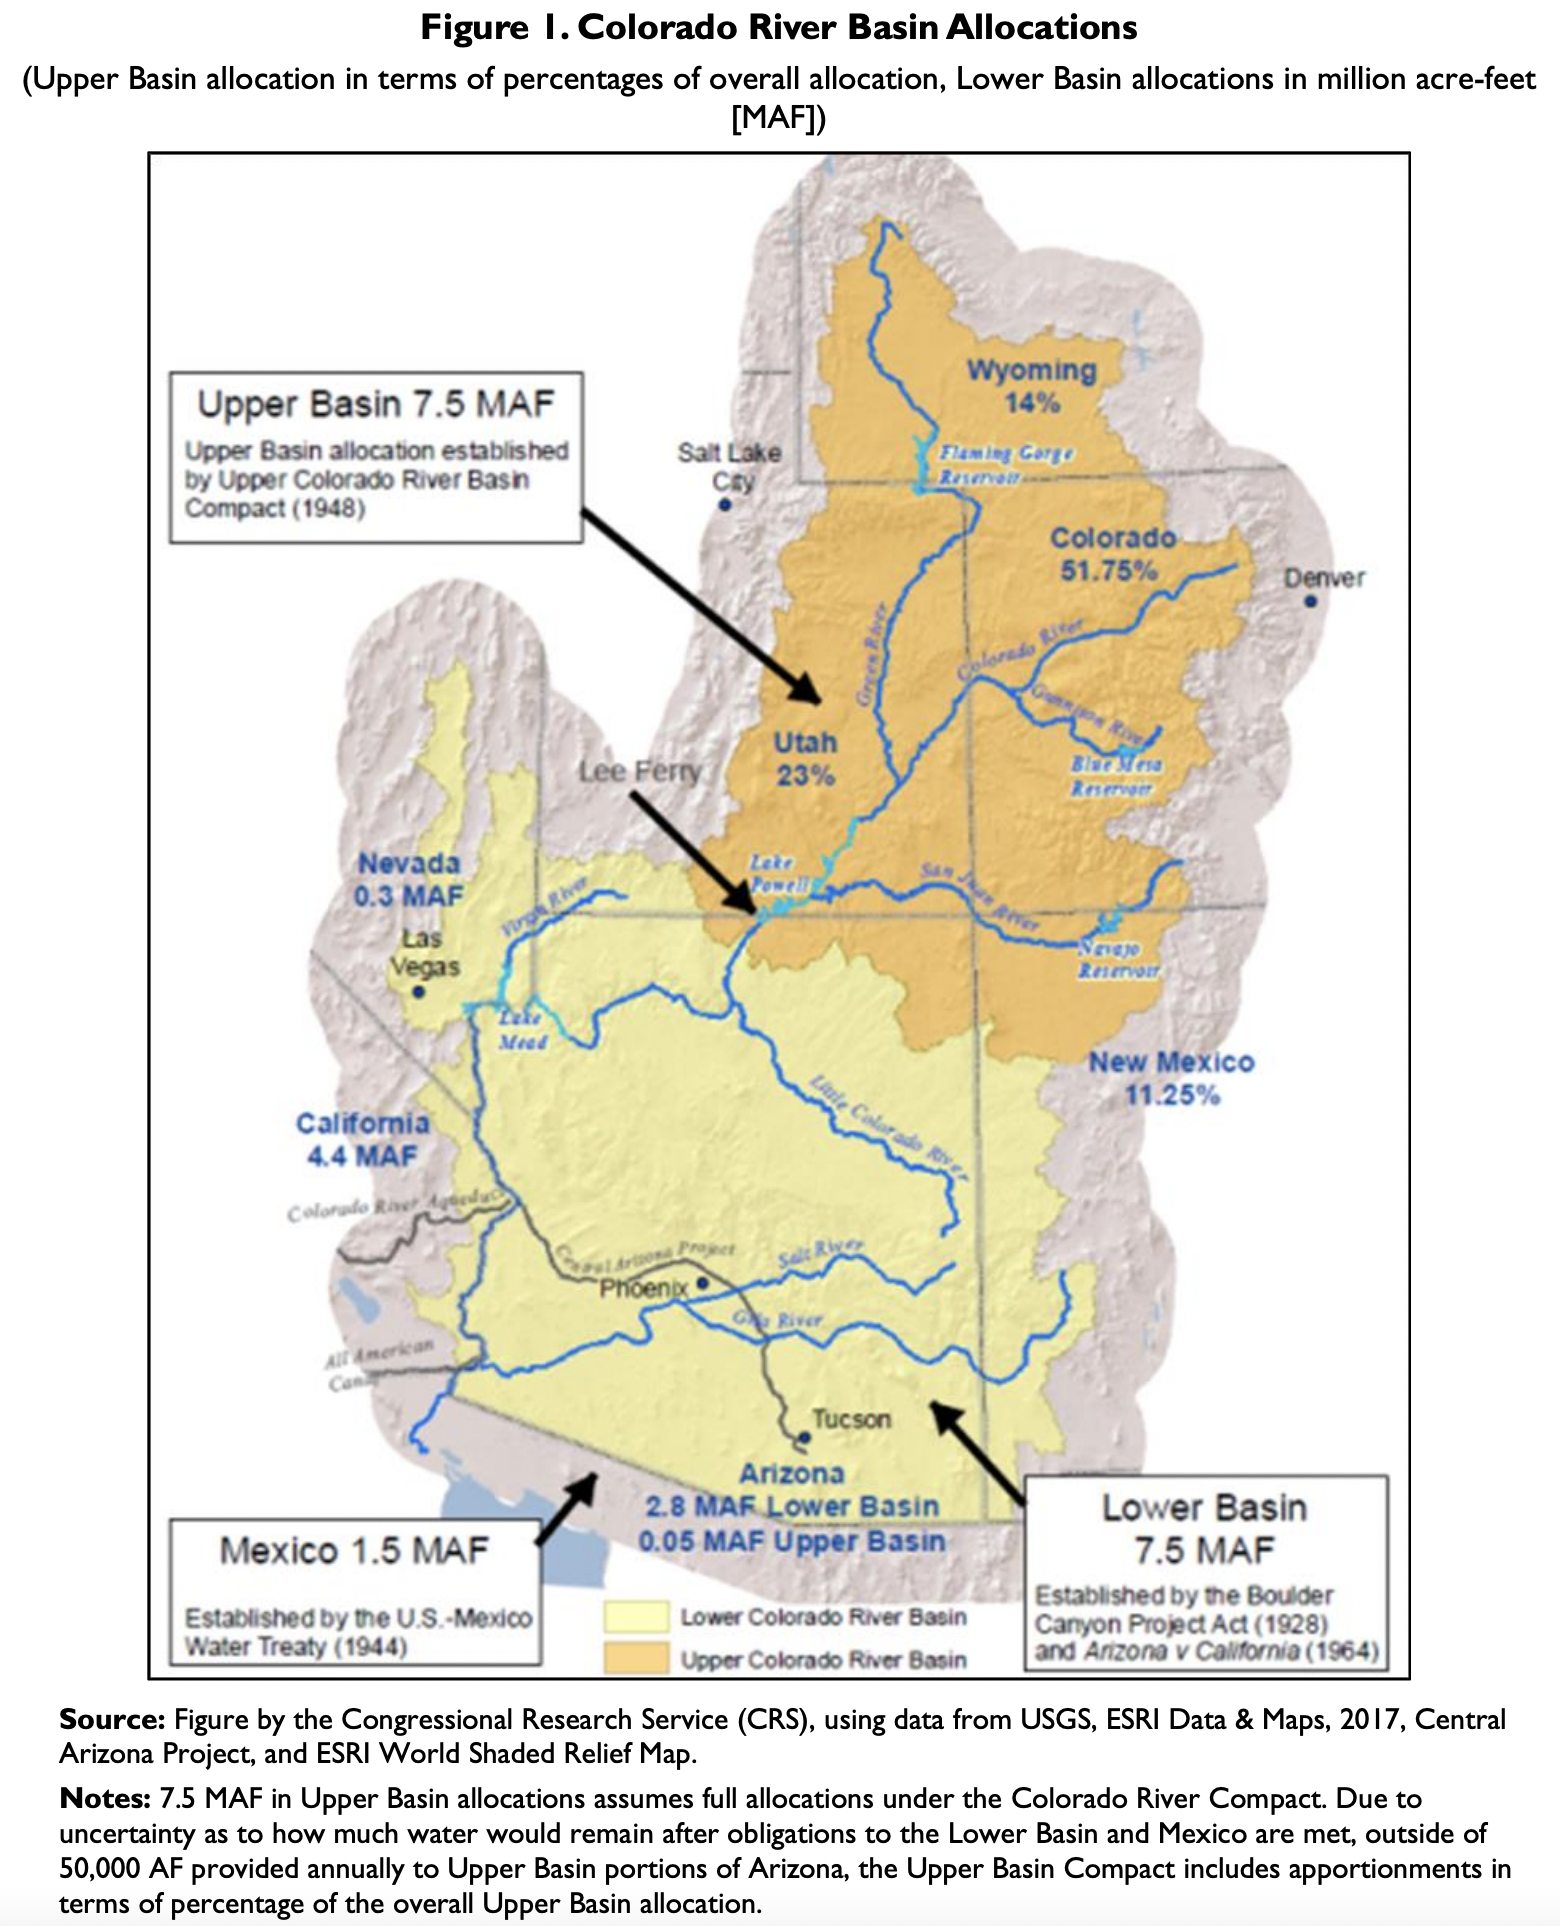
Colorado River Allocations: Credit: The Congressional Research Service
What is the Colorado River Compact?
In the early 1920s, states in the Colorado River Basin grew concerned about their shares of water in the river. California was growing rapidly, and some feared it would establish priority access to the water.
Delph Carpenter, an attorney in Colorado, proposed that the states should come together to negotiate river water allocation. The states took 11 months to reach an agreement: the Colorado River Compact. It divided states in the watershed into an Upper Basin and a Lower Basin, which would each receive 7.5 million acre-feet of water per year. From there, the basins were left to figure out how to split up the water among themselves.
In the decades following the compact, subsequent court cases, treaties and agreements hammered out exactly how the water would be distributed. Together, these are called the “Law of the River.”
From the 2018 Tribal Water Study, this graphic shows the location of the 29 federally-recognized tribes in the Colorado River Basin. Map credit: USBR
Who was involved, and who was not?
The compact was signed by delegates from seven states—Arizona, California, Colorado, Nevada, New Mexico, Utah and Wyoming—as well as a representative from the federal government, Secretary of Commerce Herbert Hoover. It was the first time so many states had come together to make an agreement—a momentous occasion in U.S. history.
But while Native Americans had been using water in the river for millennia and had legal rights to it, per a 1908 Supreme Court case, they were left out of the agreement, as was Mexico.
All states ratified the compact except for Arizona. Its then-governor said the compact put Arizona at a disadvantage, because it would be forced to compete directly with California for water. Arizona later joined the agreement in the early 1940s, and the two states still face bitterdisputes over water today.
A March 31, 1922 photo of the Colorado River Commission. Standing left to right: Delph E. Carpenter (Colorado), James G. Scrugham (Nevada), R. E. Caldwell (Utah), Frank C. Emerson (Wyoming), Stephen B. Davis, Jr. (New Mexico), W. F. McClure (California) and W. S. Norviel (Arizona). Seated: Gov. Emmet D. Boyle (Nevada), Gov. Oliver H. Shoup (Colorado), Herbert Hoover (federal representative and chair) and Gov. Merritt C. Mecham (New Mexico). The governors were not members of the Commission. Photo: Colorado State University Library
One century later, what has changed?
While the Law of the River still governs water use, conditions have shifted drastically in the 100 years since the compact was signed. Hoover predicted the basin’s population, which was about 457,000 in 1915, would quadruple. Today, the river serves 40 million people—more than 20 times his prediction.
And states are now using more water than is sustainable. The 1922 negotiations allocated water use based on data from an unusually wet period in history, Brad Udall, a senior water and climate research scientist at the Colorado Water Institute at Colorado State University, tells Smithsonian magazine. Now, with reduced water in the river and its reservoirs, these allocations are outdated. The signers likely knew their agreement would create a long-term problem, some experts say, but they ignored the research and forged ahead anyway.
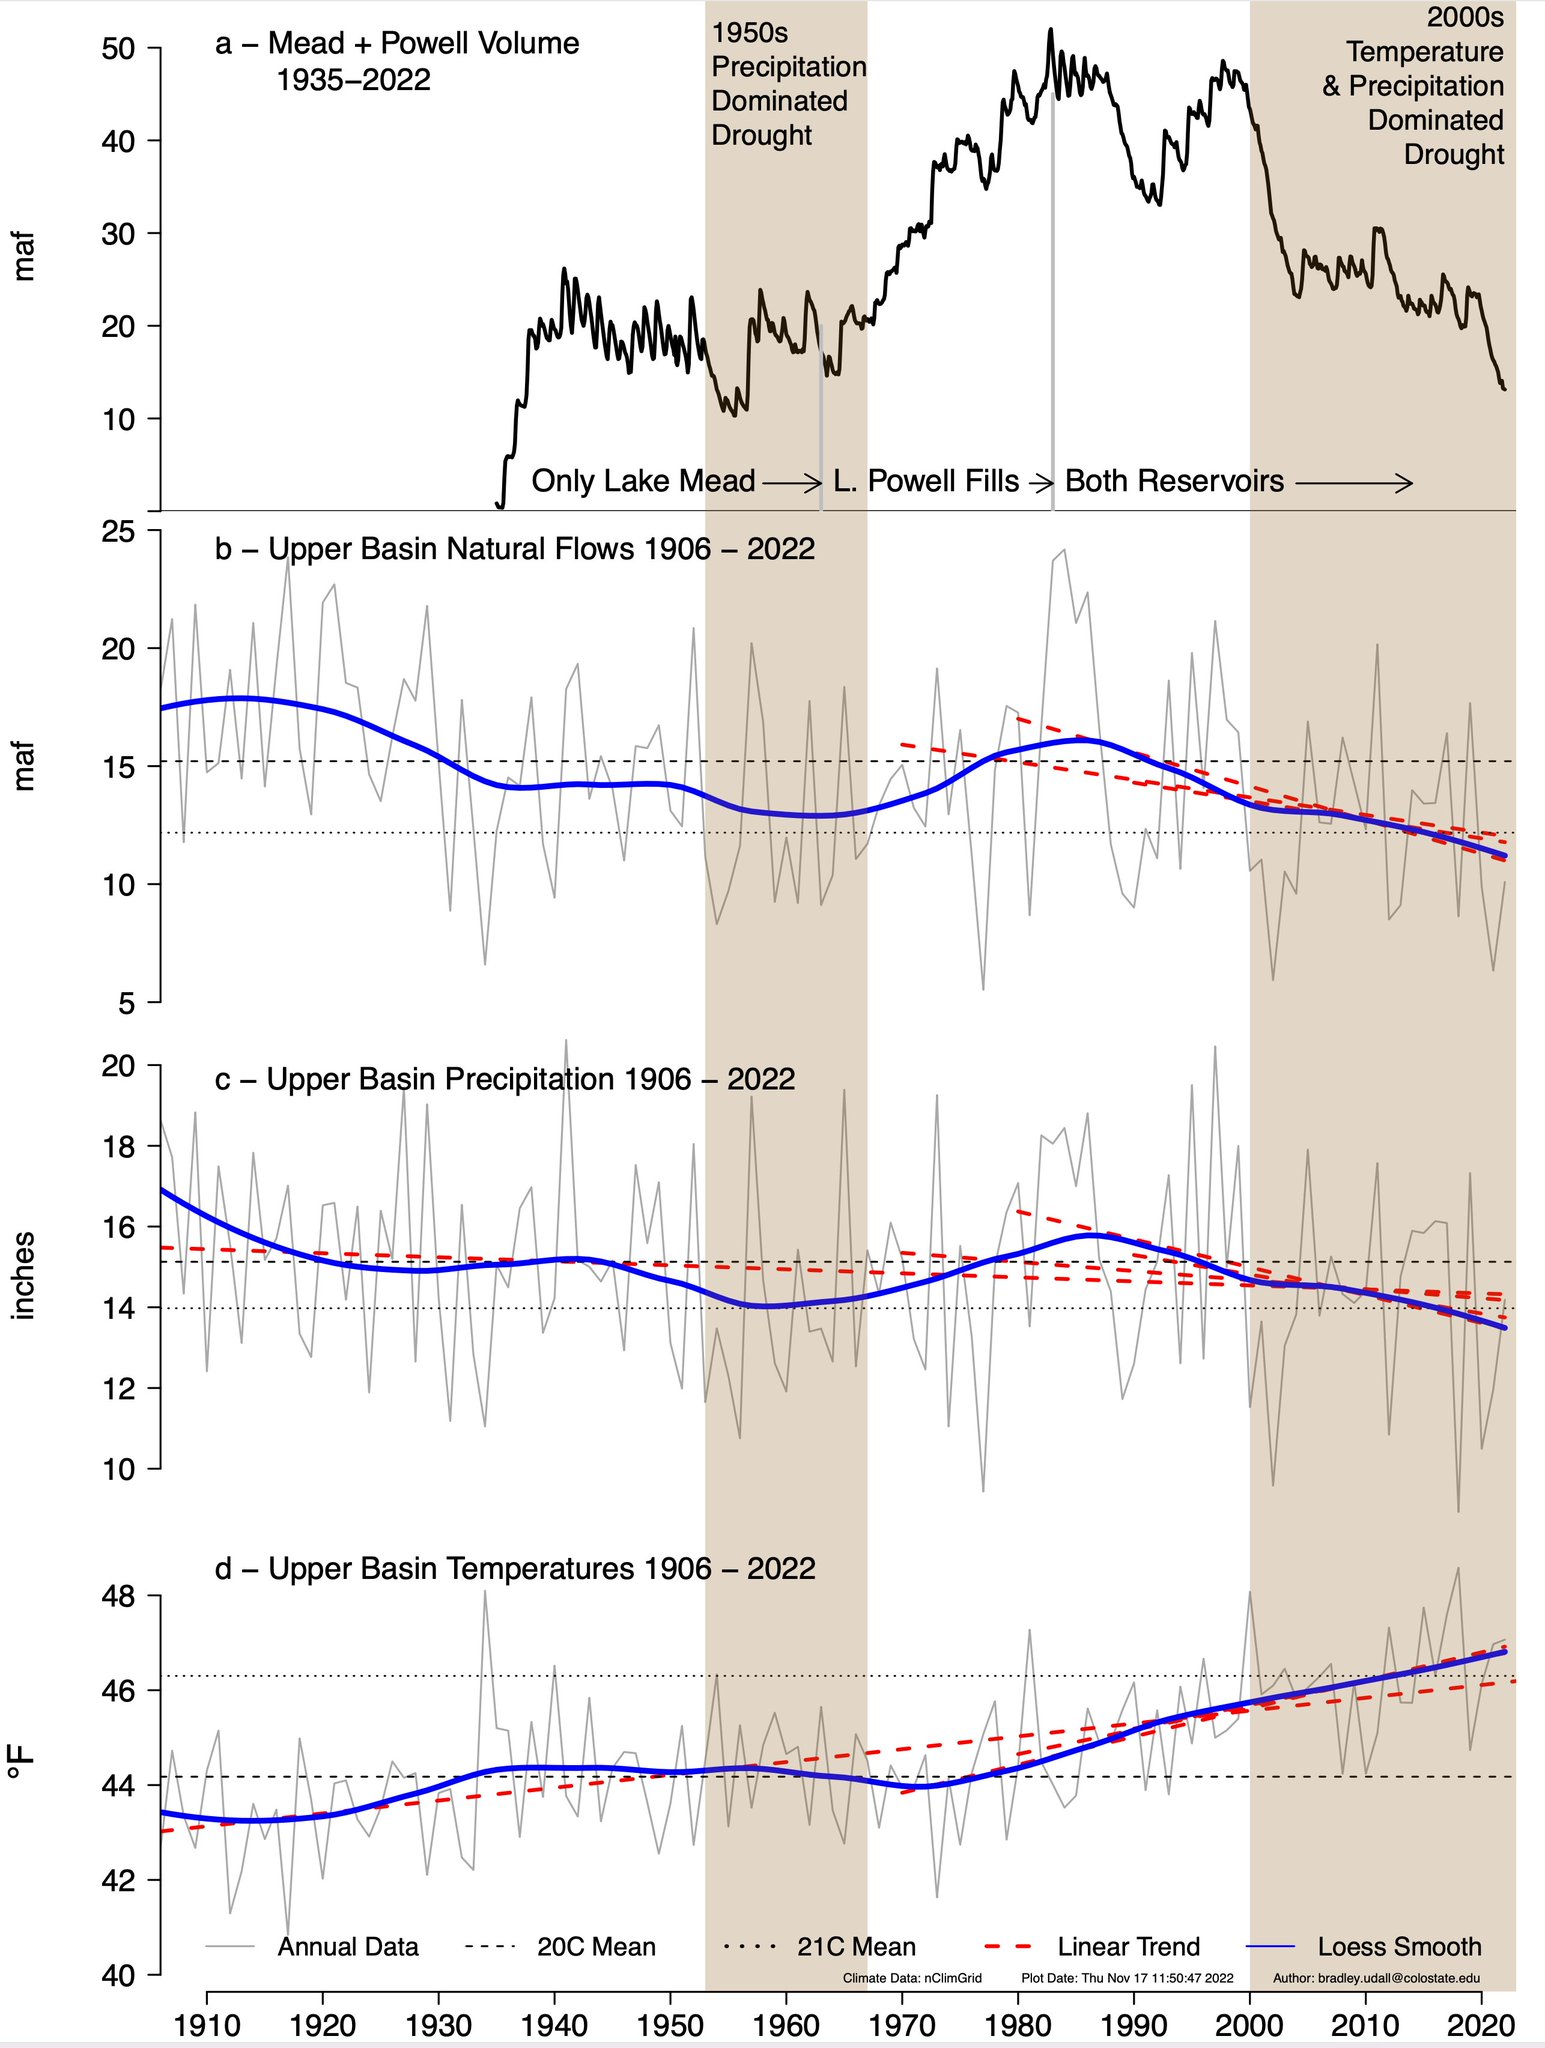
Updated Colorado River 4-Panel plot thru Water Year 2022 showing reservoirs, flows, temperatures and precipitation. All trends are in the wrong direction. Since original 2017 plot, conditions have deteriorated significantly. Brad Udall via Twitter: https://twitter.com/bradudall/status/1593316262041436160
“Uses are somewhere on the order of about 15 million acre-feet. The historical flow since 2000 is around 12 million acre-feet,” Udall says. “We’ve got a 3 million acre-foot imbalance.”
Meanwhile, climate change is reducing the mountain snowpack that feeds the river, and it’s also causing more evaporation. Warmer, drier conditions have thrown the entire basin into a 23-year-long drought that is ongoing. But Udall and other scientists argue the word “aridification” is a more accurate term, since the conditions are unlikely to change.
“Since 2000, the basin has been in a state of profound imbalance,” Udall says. “As a result, the Colorado River reservoirs, the nation’s two largest reservoirs, have declined by roughly 70 percent.”
The water shortage has forced the federalgovernment to take drastic action—it has ordered cuts to water usage and reduced downstream releases from the Glen Canyon and Hoover dams, which form Lake Powell and Lake Mead, respectively. But even these measures haven’t been enough.
Native American tribes, which were excluded from the original 20th-century negotiations, have inherent rights to the diminishing water supply—a combined total of about 20 percent of the river’s historical flow. But many tribes are still fighting for these rights to be recognized.
“While people are conserving, we’re trying to develop our water,” Tulley-Cordova says. “A large population of our nation still don’t have running water.”
Jack Schmidt, director of the Center for Colorado River Studies at Utah State University, tells Smithsonian magazine the situation is dire. One more extremely dry winter—on par with the record-breaking dry conditions that occurred in 2002—will either drain Lake Powell or force the government to take unprecedented emergency action, he says.
“We’re in abject crisis right now,” Schmidt says. “We’re on the edge of that cliff. We’re about to fall off.”
What’s next for the basin?
The basin faces an immediate crisis of dry conditions this winter. But it also faces the long-term crisis of overuse, says Schmidt.
“We must, as a nation, reduce our long-term use rates to be consistent with the supply,” he says. “That’s just basic checkbook accounting.”
In 2026, several current agreements regarding water usage will expire, forcing new compromises to be made about water allocation. So far, though, no one has decided what those new rules will look like.
“I don’t know where we’re going. I don’t know that anybody would tell you where we’re going. But if we don’t make decisions fast, nature’s going to make them for us,” Udall says. “The real threat here is that we empty these two reservoirs and then become reliant on an annual allocation that nature provides, instead of an annual allocation that we humans decide what’s best for us.”
But Udall says one reason to remain optimistic is that relationships between states and entities in the basin are good. And moving forward, Tulley-Cordova says that continuing to forge these relationships will be key.
“It’s not to say that we all agree on the way things should be done,” she says. “But the best [strategy for] talking about a complicated subject is not assuming what the other person’s priorities, needs, and challenges and opportunities are.”
Still, scientists say action must be taken—and soon. With Lake Mead and Lake Powell at historic lows and the states failing to cut back their water use, it’s only a matter of time before nature forces the states to make uncomfortable decisions.
“It’s going to be a wild ride. That much, I can tell you,” Udall says. “We’re in a deep hole here.”
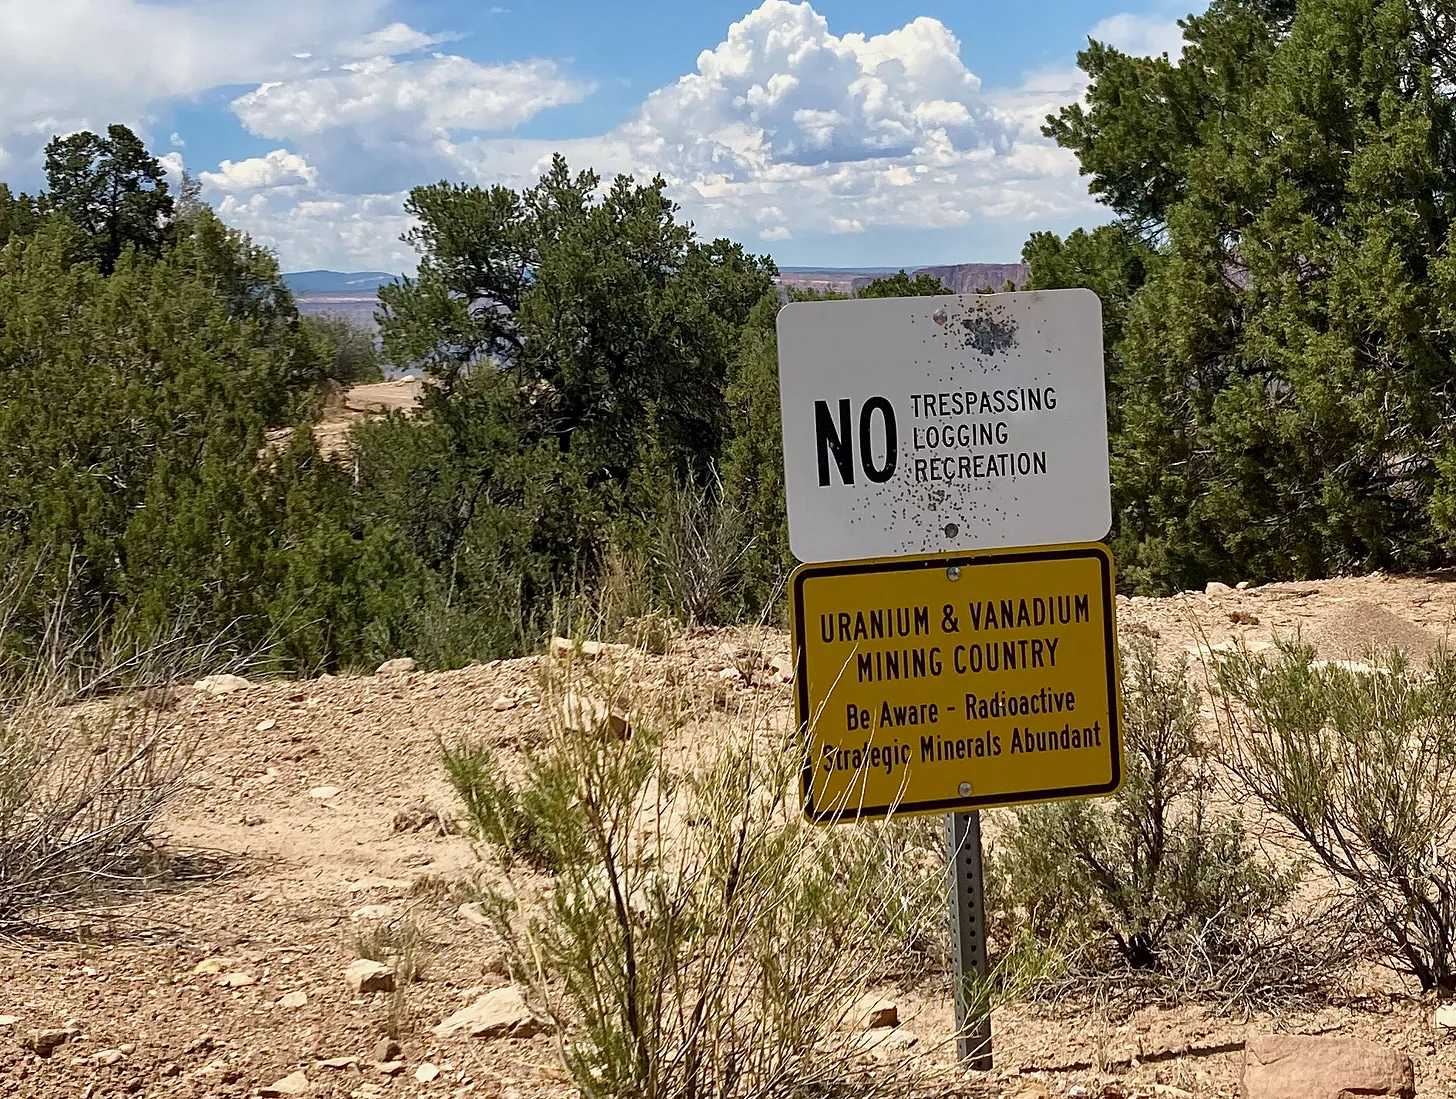
Uranium and vanadium radioactive warning sign. Photo credit: Jonathan P Thompson
Click the link to read the article on the PropPublica website Mark Olalde, Mollie Simon and Alex Mierjeski, video by Gerardo del Valle, Liz Moughon and Mauricio Rodríguez Pons
ProPublica is a Pulitzer Prize-winning investigative newsroom. Sign up for The Big Story newsletter to receive stories like this one in your inbox.
In America’s rush to build the nuclear arsenal that won the Cold War, safety was sacrificed for speed.
Uranium mills that helped fuel the weapons also dumped radioactive and toxic waste into rivers like the Cheyenne in South Dakota and the Animas in Colorado. Thousands of sheep turned blue and died after foraging on land tainted by processing sites in North Dakota. And cancer wards across the West swelled with sick uranium workers.
The U.S. government bankrolled the industry, and mining companies rushed to profit, building more than 50 mills and processing sites to refine uranium ore.
But the government didn’t have a plan for the toxic byproducts of this nuclear assembly line. Some of the more than 250 million tons of toxic and radioactive detritus, known as tailings, scattered into nearby communities, some spilled into streams and some leaked into aquifers.
Congress finally created the agency that now oversees uranium mill waste cleanup in 1974 and enacted the law governing that process in 1978, but the industry would soon collapse due to falling uranium prices and rising safety concerns. Most mills closed by the mid-1980s.
When cleanup began, federal regulators first focused on the most immediate public health threat, radiation exposure. Agencies or companies completely covered waste at most mills to halt leaks of the carcinogenic gas radon and moved some waste by truck and train to impoundments specially designed to encapsulate it.
But the government has fallen down in addressing another lingering threat from the industry’s byproducts: widespread water pollution.
Creating a balance of water that’s taken from aquifers and water that replenishes aquifers is an important aspect of making sure water will be available when it’s needed.
Image from “Getting down to facts: A Visual Guide to Water in the Pinal Active Management Area,” courtesy of Ashley Hullinger and the University of Arizona Water Resources Research Center
Regulators haven’t made a full accounting of whether they properly addressed groundwater contamination. So, for the first time, ProPublica cataloged cleanup efforts at the country’s 48 uranium mills, seven related processing sites and numerous tailings piles.
At least 84% of the sites have polluted groundwater. And nearly 75% still have either no liner or only a partial liner between mill waste and the ground, leaving them susceptible to leaking pollution into groundwater. In the arid West, where most of the sites are located, climate change is drying up surface water, making underground reserves increasingly important.
ProPublica’s review of thousands of pages of government and corporate documents, accompanied by interviews with 100 people, also found that cleanup has been hampered by infighting among regulatory agencies and the frequency with which regulators grant exemptions to their own water quality standards.
The result: a long history of water pollution and sickness.
Reports by government agencies found high concentrations of cancer near a mill in Utah and elevated cancer risks from mill waste in New Mexico that can persist until cleanup is complete. Residents near those sites and others have seen so many cases of cancer and thyroid disease that they believe the mills and waste piles are to blame, although epidemiological studies to prove such a link have rarely been done.
“The government didn’t pay attention up front and make sure it was done right. They just said, ‘Go get uranium,’” said Bill Dixon, who spent decades cleaning up uranium and nuclear sites with the state of Oregon and in the private sector.
Tom Hanrahan grew up near uranium mills in Colorado and New Mexico and watched three of his three brothers contract cancer. He believes his siblings were “casualties” of the war effort.
“Somebody knew that this was a ticking atomic bomb,” Hanrahan said. “But, in military terms, this was the cost of fighting a war.”
A Flawed System
When a uranium mill shuts down, here is what’s supposed to happen: The company demolishes the buildings, decontaminates the surrounding soil and water, and encases the waste to stop it from leaking cancer-causing pollution. The company then asks the Nuclear Regulatory Commission, the lead agency monitoring America’s radioactive infrastructure, to approve the handoff of the property and its associated liability to the Department of Energy’s Office of Legacy Management for monitoring and maintenance.
ProPublica’s analysis found that half of the country’s former mills haven’t made it through this process and even many that did have never fully addressed pollution concerns. This is despite the federal government spending billions of dollars on cleanup, in addition to the several hundred million dollars that have been spent by companies.
Often, companies or agencies tasked with cleanup are unable to meet water quality standards, so they request exemptions to bypass them. The NRC or state agencies almost always approve these requests, allowing contaminants like uranium and selenium to be left in the groundwater. When ingested in high quantities, those elements can cause cancer and damage the nervous system, respectively.
Bill Dam, who spent decades regulating and researching uranium mill cleanup with the NRC, at the DOE and in the private sector, said water pollution won’t be controlled until all the waste and contaminated material is moved. “The federal government’s taken a Band-Aid approach to groundwater contamination,” he said.
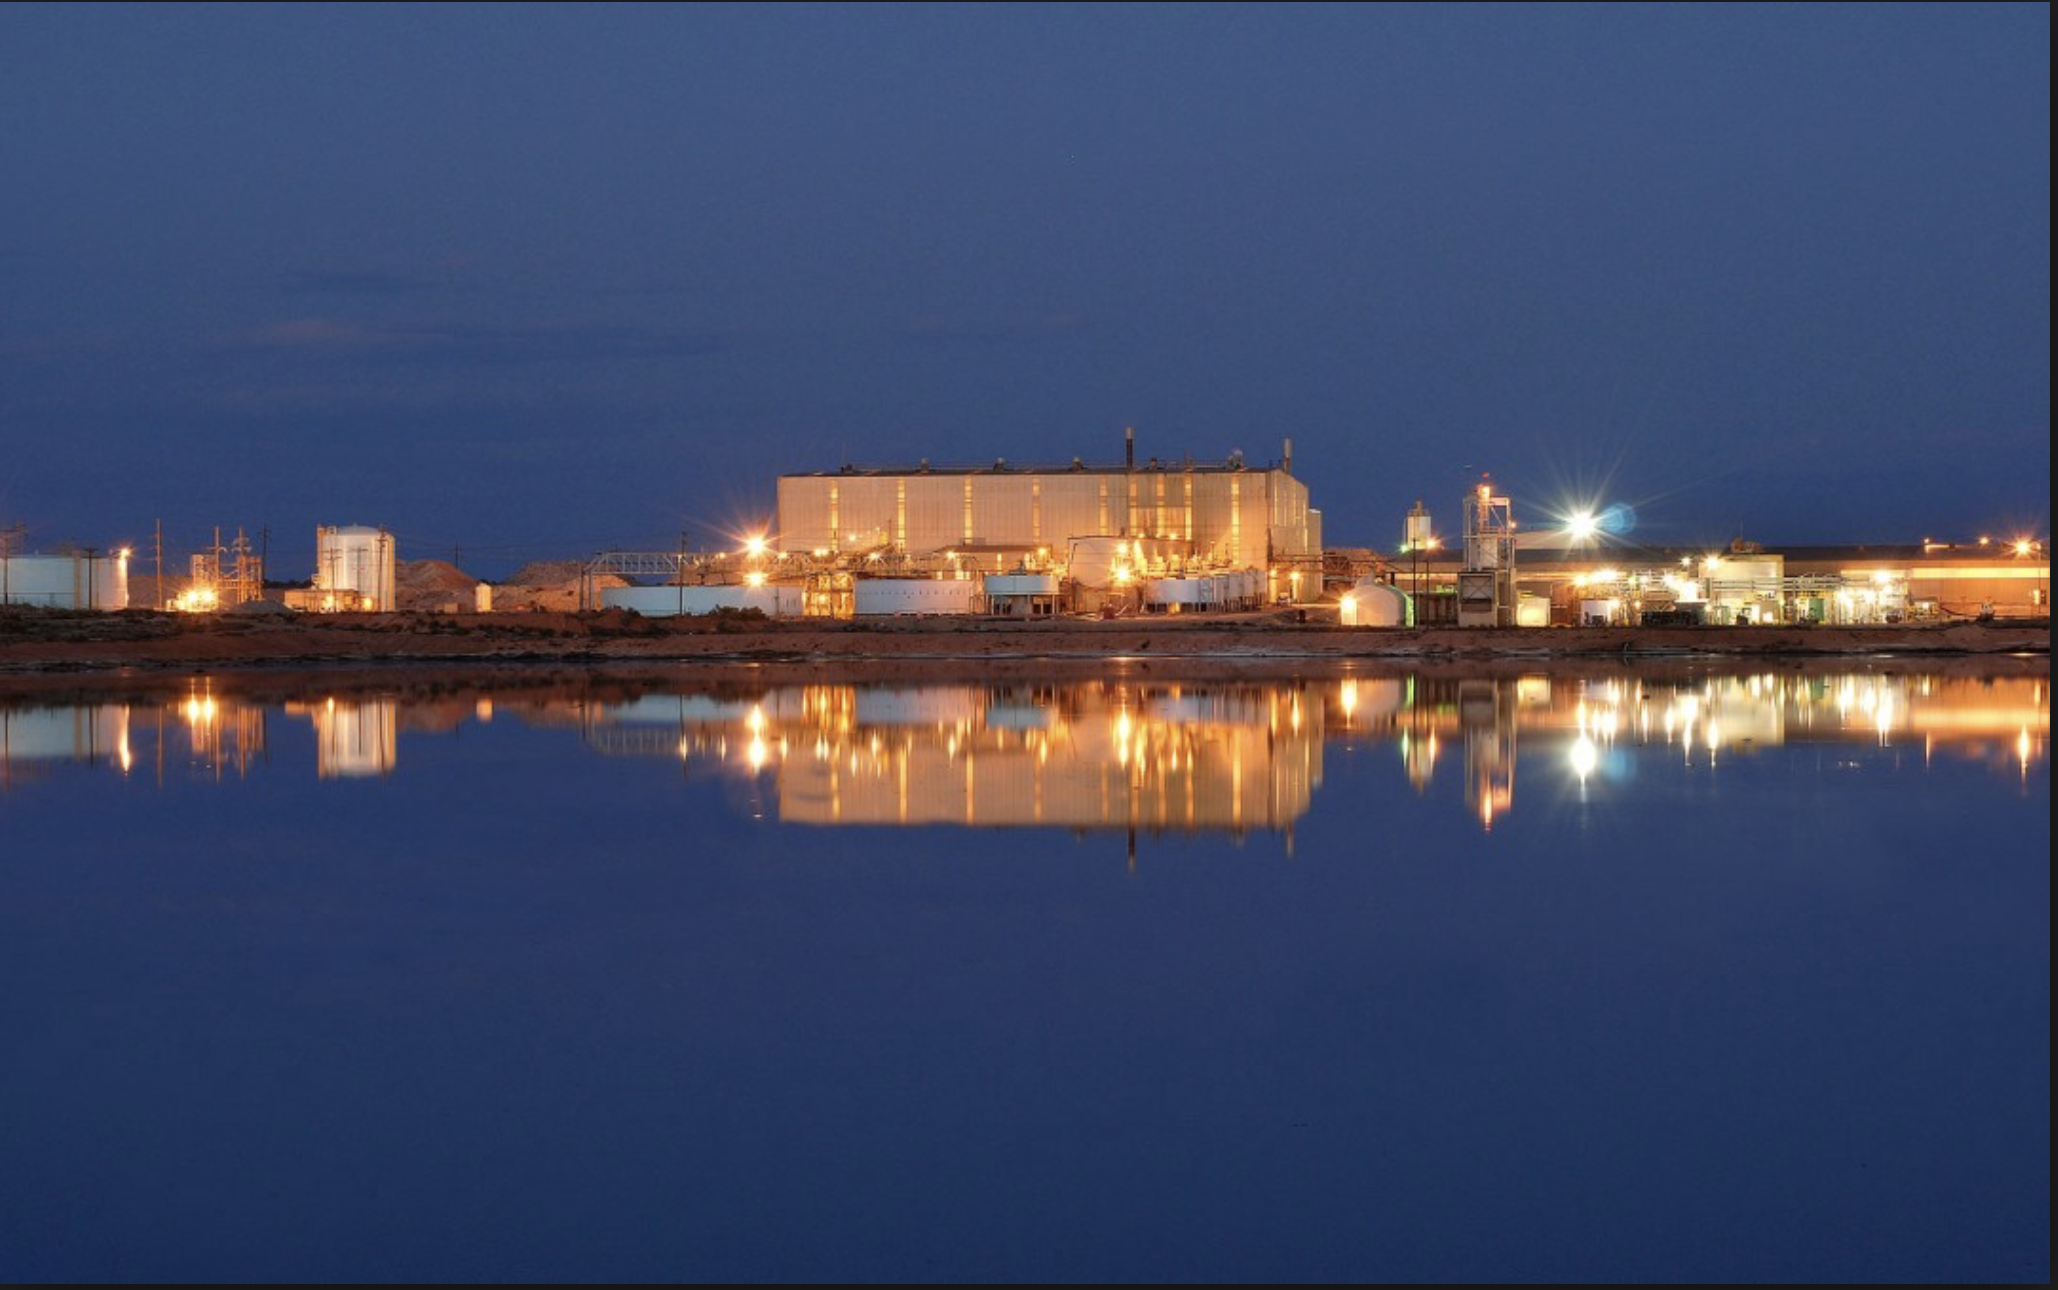
White Mesa Mill. Photo credit: Energy Fuels
The pollution has disproportionately harmed Indian Country.
Six of the mills were built on reservations, and another eight mills are within 5 miles of one, some polluting aquifers used by tribes. And the country’s last conventional uranium mill still in operation — the White Mesa Mill in Utah — sits adjacent to a Ute Mountain Ute community.
So many uranium mines, mills and waste piles pockmark the Navajo Nation that the Environmental Protection Agency created a comic book superhero, Gamma Goat, to warn Diné children away from the sites.
NRC staff acknowledged that the process of cleaning up America’s uranium mills can be slow but said that the agency prioritizes thoroughness over speed, that each site’s groundwater conditions are complex and unique, and that cleanup exemptions are granted only after gathering input from regulators and the public.
“The NRC’s actions provide reasonable assurance of adequate protection of public health and safety and the environment,” David McIntyre, an NRC spokesperson, said in a statement to ProPublica.
“Cleanup Standards Might Suddenly Change”
For all the government’s success in demolishing mills and isolating waste aboveground, regulators failed to protect groundwater.
Between 1958 and 1962, a mill near Gunnison, Colorado, churned through 540,000 tons of ore. The process, one step in concentrating the ore into weapons-grade uranium, leaked uranium and manganese into groundwater, and in 1990, regulators found that residents had been drawing that contaminated water from 22 wells.
The DOE moved the waste and connected residents to clean water. But pollution lingered in the aquifer beneath the growing town where some residents still get their water from private wells. The DOE finally devised a plan in 2000, which the NRC later approved, settling on a strategy called “natural flushing,” essentially waiting for groundwater to dilute the contamination until it reached safe levels.
In 2015, the agency acknowledged that the plan had failed. Sediments absorb and release uranium, so waiting for contamination to be diluted doesn’t solve the problem, said Dam, the former NRC and DOE regulator.
In Wyoming, state regulators wrote to the NRC in 2006 to lambast the agency’s “inadequate” analysis of natural flushing compared to other cleanup options. “Unfortunately, the citizens of Wyoming may likely have to deal with both the consequences and the indirect costs of the NRC’s decisions for generations to come,” the state’s letter said.
ProPublica identified mills in six states — including eight former mill sites in Colorado — where regulators greenlit the strategy as part of a cleanup plan.
When neither water treatment nor nature solves the problem, federal and state regulators can simply relax their water quality standards, allowing harmful levels of pollutants to be left in aquifers.
County officials made a small area near the Gunnison mill off-limits to new wells, and the DOE suggested changing water quality standards to allow uranium concentrations as much as 475 times what naturally occurred in the area. It wouldn’t endanger human health, the agency said, because people wouldn’t come into contact with the water.
ProPublica found that regulators granted groundwater cleanup exemptions at 18 of the 28 sites where cleanup has been deemed complete and liability has been handed over to the DOE’s Office of Legacy Management. Across all former uranium mills, the NRC or state agencies granted at least 34 requests for water quality exemptions while denying as few as three.
“They’re cutting standards, so we’re getting weak cleanup that future generations may not find acceptable,” said Paul Robinson, who spent four decades researching the cleanup of the uranium industry with the Southwest Research and Information Center, an Albuquerque-based nonprofit. “These great mining companies of the world, they got away cheap.”
NRC staffers examine studies that are submitted by companies’ consultants and other agencies to show how cleanup plans will adequately address water contamination. Some companies change their approach in response to feedback from regulators, and the public can view parts of the process in open meetings. Still, the data and groundwater modeling that underpin these requests for water cleanup exemptions are often wrong.
One reason: When mining companies built the mills, they rarely sampled groundwater to determine how much contamination occurred naturally, leaving it open to debate how clean groundwater should be when the companies leave, according to Roberta Hoy, a former uranium program specialist with the Wyoming Department of Environmental Quality. She said federal regulators also haven’t done enough to understand certain contaminants at uranium mills.
In one recent case, the NRC fined a mining company $14,500 for incomplete and inaccurate groundwater modeling data. Companies use such data to prove that pollution won’t spread in the future. Freeport-McMoRan, the corporation that owns the fined mining company, did not respond to a request for comment.
At a 2013 conference co-hosted by the NRC and a mining trade group, a presentation from two consultants compared groundwater modeling to a sorcerer peering at a crystal ball.
ProPublica identified at least seven sites where regulators granted cleanup exemptions based on incorrect groundwater modeling. At these sites, uranium, lead, nitrates, radium and other substances were found at levels higher than models had predicted and regulators had allowed.
McIntyre, the NRC spokesperson, said that groundwater models “inherently include uncertainty,” and the government typically requires sites to be monitored. “The NRC requires conservatism in the review process and groundwater monitoring to verify a model’s accuracy,” he said.
Water quality standards impose specific limits on the allowable concentration of contaminants — for example, the number of micrograms of uranium per liter of water. But ProPublica found that the NRC granted exemptions in at least five states that were so vague they didn’t even include numbers and were instead labeled as “narrative.” The agency justified this by saying the groundwater was not near towns or was naturally unfit for human consumption.
Lincoln Park/Cotter Mill superfund site
This system worries residents of Cañon City, Colorado. Emily Tracy, who serves on the City Council, has lived a few miles from the area’s now-demolished uranium mill since the late 1970s and remembers floods and winds carrying mill waste into neighborhoods from the 15.3-million-ton pile, which is now partially covered.
Uranium and other contaminants had for decades tainted private wells that some residents used for drinking water and agriculture, according to the Department of Health and Human Services. The company that operated the mill, Cotter Corp., finally connected residents to clean water by the early 1990s and completed cleanup work such as decontaminating soil after the EPA got involved. But the site remains without a final cleanup plan — which the company that now owns the site is drafting — and the state has eased water quality standards for molybdenum, a metal that uranium mining and milling releases into the environment.
“We have great concerns about what it might look like or whether cleanup standards might suddenly change before our eyes,” Tracy said.
Jim Harrington, managing director of the site’s current owner, Colorado Legacy Land, said that a final cleanup strategy has not been selected and that any proposal would need to be approved by both the EPA and the state.
Layers of Regulation
It typically takes 35 years from the day a mill shuts down until the NRC approves or estimates it will approve cleanup as being complete, ProPublica found. Two former mills aren’t expected to finish this process until 2047.
Chad Smith, a DOE spokesperson, said mills that were previously transferred to the government have polluted groundwater more than expected, so regulators are more cautious now.
The involvement of so many regulators can also slow cleanup.
Five sites were so contaminated that the EPA stepped in via its Superfund program, which aims to clean up the most polluted places in the country.
At the Homestake mill in New Mexico, where cleanup is jointly overseen by the NRC and the EPA, Larry Camper, a now-retired NRC division director, acknowledged in a 2011 meeting “that having multiple regulators for the site is not good government” and had complicated the cleanup, according to meeting minutes.
Homestake Mining Company of California did not comment on Camper’s view of the process.
Only one site where the EPA is involved in cleanup has been successfully handed off to the DOE, and even there, uranium may still persist above regulatory limits in groundwater and surface water, according to the agency. An EPA spokesperson said the agency has requested additional safety studies at that site.
“A lot of people make money in the bureaucratic system just pontificating over these things,” said William Turner, a geologist who at different times has worked for mining companies, for the U.S. Geological Survey and as the New Mexico Natural Resources Trustee.
If the waste is on tribal land, it adds another layer of government.
The federal government and the Navajo Nation have long argued over the source of some groundwater contamination at the former Navajo Mill built by Kerr-McGee Corp. in Shiprock, New Mexico, with the tribe pointing to the mill as the key source. Smith of the DOE said the department is guided by water monitoring results “to minimize opportunities for disagreement.”
Tronox, which acquired parts of Kerr-McGee, did not respond to requests for comment.
San Juan River Basin. Graphic credit Wikipedia.
All the while, 2.5 million tons of waste sit adjacent to the San Juan River in the town of 8,000 people. Monitoring wells situated between the unlined waste pile and the river have shown nitrate levels as high as 80 times the limit set by regulators to protect human health, uranium levels 30 times the limit and selenium levels 20 times the limit.
“I can’t seem to get the federal agencies to acknowledge the positions of the Navajo Nation,” said Dariel Yazzie, who formerly managed the Navajo Nation Environmental Protection Agency’s Superfund Program.
At some sites, overlapping jurisdictions mean even less cleanup gets done.
Such was the case near Griffin, North Dakota, where six cows and 2,500 sheep died in 1973; their bodies emitted a blue glow in the morning light. The animals lay near kilns that once served as rudimentary uranium mills operated by Kerr-McGee. To isolate the element, piles of uranium-laden coal at the kilns were “covered with old tires, doused in diesel fuel, ignited, and left to smolder for a couple of months,” according to the North Dakota Geological Survey.
The flock is believed to have been poisoned by land contaminated with high levels of molybdenum. The danger extended beyond livestock. In a 1989 draft environmental assessment, the DOE found that “fatal cancer from exposure to residual radioactive materials” from the Griffin kilns and another site less than a mile from a town of 1,000 people called Belfield was eight times as high as it would have been if the sites had been decontaminated.
But after agreeing to work with the federal government, North Dakota did an about-face. State officials balked at a requirement to pay 10% of the cleanup cost — the federal government would cover the rest — and in 1995 asked that the sites no longer be regulated under the federal law. The DOE had already issued a report that said doing nothing “would not be consistent” with the law, but the department approved the state’s request and walked away, saying it could only clean a site if the state paid its share.
“North Dakota determined there was minimal risk to public health at that time and disturbing the grounds further would create a potential for increased public health risk,” said David Stradinger, manager of the Radiation Control Program in the North Dakota Department of Environmental Quality. Contaminated equipment was removed, and the state is reevaluating one of the sites, he said.
“A Problem for the Better Part of 50 Years”
While the process for cleaning up former mills is lengthy and laid out in regulations, regulators and corporations have made questionable and contradictory decisions in their handling of toxic waste and tainted water.
More than 40 million people rely on drinking water from the Colorado River, but the NRC and DOE allowed companies to leak contamination from mill waste directly into the river, arguing that the waterway quickly dilutes it.
Federal regulators relocated tailings at two former mills that processed uranium and vanadium, another heavy metal, on the banks of the Colorado River in Rifle, Colorado, because radiation levels there were deemed too high. Yet they left some waste at one former processing site in a shallow aquifer connected to the river and granted an exemption that allowed cleanup to end and uranium to continue leaking into the waterway.
For a former mill built by the Anaconda Copper Company in Bluewater, New Mexico, the NRC approved the company’s request to hand the site off to the DOE in 1997. About a decade later, the state raised concerns about uranium that had spread several miles in an aquifer that provides drinking water for more than 15,000 people.
The contamination hasn’t reached the wells used by nearby communities, and Smith, the DOE spokesperson, said the department has no plans to treat the uranium in the aquifer. It’s too late for much more cleanup, since the DOE’s Office of Legacy Management’s mission is to monitor and maintain decommissioned sites, not clean them. Flawed cleanup efforts caused problems at several former mills after they were handed off to the agency, according to a 2020 Government Accountability Office report.
“Uranium has been overplayed as a boom,” said Travis Stills, an environmental attorney in Colorado who has sued over the cleanup of old uranium infrastructure. “The boom was a firecracker, and it left a problem for the better part of 50 years now.”
“No Way in Hell We’re Going to Leave This Stuff Here”
Mining companies can’t remove every atom of uranium from groundwater, experts said, but they can do a better job of decommissioning uranium mills. With the federal government yet to take control of half the country’s former mills, regulators still have time to compel some companies to do more cleanup.
Between 1958 and 1961, the Lakeview Mining Company generated 736,000 tons of tailings at a uranium mill in southern Oregon. Like at most sites, uranium and other pollution leaked into an aquifer.
“There’s no way in hell we’re going to leave this stuff here,” Dixon, the nuclear cleanup specialist, remembered thinking. He represented the state of Oregon at the former mill, which was one of the first sites to relocate its waste to a specially engineered disposal cell.
A local advisory committee at the Lakeview site allowed residents and local politicians to offer input to federal regulators. By the end of the process, the government had paid to connect residents to a clean drinking water system and the waste was moved away from the town, where it was contained by a 2-foot-thick clay liner and covered with 3 feet of rocks, soil and vegetation. Local labor got priority for cleanup contracts, and a 170-acre solar farm now stands on the former mill site.
But relocation isn’t required. At some sites, companies and regulators saw a big price tag and either moved residents away or merely left the waste where it was.
“I recognize Lakeview is easy and it’s a drop in the bucket compared to New Mexico,” Dixon said, referring to the nation’s largest waste piles. “But it’s just so sad to see that this hasn’t been taken care of.”
We solicited feedback on our findings from 10 experts who worked or work at the NRC, the Environmental Protection Agency, the Wyoming Department of Environmental Quality, the Southwest Research and Information Center, the University of New Mexico and elsewhere. Additionally, we interviewed dozens of current and former regulators, residents of communities adjacent to mills, representatives of tribes, academics, politicians and activists to better understand the positive and negative impacts of the uranium industry and the bureaucracy that oversees uranium mill cleanup.
We also traveled to observe mill sites in New Mexico, Utah and Colorado.
After additional funds were approved by Pueblo City Council on Monday night, a total of $3 million in American Rescue Plan Act funds will be allocated to a 6,200-foot sanitary sewer line on Pueblo’s west side…Funded by ARPA and the Pueblo Wastewater Department, the project will cost an estimated $6.8 million, according to the city of Pueblo.
“We have been in the process of designing that sewer line,” Pueblo Mayor Nick Gradisar said. “There are a couple of arroyos. Some of that sewer line is going to be 13 to 30 feet deep. It turns out to be much more expensive.”
The multi-million dollar project is expected to benefit several developments, including Southern Colorado Clinic, the Pueblo YMCA, the Wildhorse Annexation, the proposed WL Annexation and the incoming Pueblo County detention center.
“This really is a major trunk line that will collect waste from a number of areas,” said Andrew Hayes, the city’s director of public works. “As the rest of the West Side develops in the vicinity of Southern Colorado Clinic, the YMCA— those areas will also feed into this very same line.”
Upper Colorado River basin study area. Graphic credit: USGS
Click the link to read the article on the USGS website (Fred D. Tillman, Natalie K. Day, Matthew P. Miller, Olivia L. Miller, Christine Rumsey, Daniel Wise, Patrick Cullen Longley, and Morgan C. McDonnell). Here’s the abstract:
The Colorado River is a critical water resource in the southwestern United States, supplying drinking water for 40 million people in the region and water for irrigation of 2.2 million hectares of land. Extended drought in the Upper Colorado River Basin (UCOL) and the prospect of a warmer climate in the future pose water availability challenges for those charged with managing the river. Limited water availability in the future also may negatively affect aquatic ecosystems and wildlife that depend upon them. Water availability components of special importance in the UCOL include streamflow, salinity in groundwater and surface water, groundwater levels and storage, and the role of snow in the UCOL water cycle. This manuscript provides a review of current “state of the science” for these UCOL water availability components with a focus on identifying gaps in data, modeling, and trends in the basin. Trends provide context for evaluations of current conditions and motivation for further investigation and modeling, models allow for investigation of processes and projections of future water availability, and data support both efforts. Information summarized in this manuscript will be valuable in planning integrated assessments of water availability in the UCOL.
In late September, Gov. Polis visited the geo-exchange heating and cooling system at Colorado Mesa University (CMU) with officials from the U.S. Department of Energy, the National Renewable Energy Laboratory, and the Bureau of Land Management. Photo credit: Western Governors’ Association
As part of Colorado Gov. Jared Polis’ WGA Chair Initiative, The Heat Beneath Our Feet, the Western Governors’ Association will be conducting tours of geothermal facilities throughout the region to explore the various market and policy factors that affect the development and deployment of geothermal technologies, and evaluate strategies to scale those technologies across the West.
In late September, Gov. Polis visited the geo-exchange heating and cooling system at Colorado Mesa University (CMU) with officials from the U.S. Department of Energy, the National Renewable Energy Laboratory, and the Bureau of Land Management.
In late September, Gov. Polis visited the geo-exchange heating and cooling system at Colorado Mesa University (CMU) with officials from the U.S. Department of Energy, the National Renewable Energy Laboratory, and the Bureau of Land Management.
On Oct. 6, Will Toor, the Executive Director of the Colorado Energy Office, and Kent Marsh, the Vice President for Capital Planning Sustainability and Campus Operations at CMU, joined WGA Policy Advisor Steven Emmen for a webinar where they discussed the benefits of the system, and identified opportunities for its expansion throughout the region.
“One of the things that I think is really appealing about this system from an overall system level,” Toor said, “is as we use more electric heat pumps to heat buildings, those are going to increase the peak demand for electricity on cold days in the winter and that potentially poses challenges that we’re going to need to solve on the electric generation side. But, because these ground source heat pumps are always working with a constant temperature, the peak demand on the coldest days is much, much lower than air source heat pumps.”
Using less than half of the electricity required by a traditional HVAC system, the geo-exchange system at CMU currently heats and cools 70% of the buildings on campus (1.2 million square feet), reducing the University’s carbon footprint by nearly 18 metric tons per year, and saving $1.5 million a year on energy costs – savings that are passed on to the students.
According to CMU President, John Marshall, every student’s tuition was discounted by 2% this year due to the system’s efficiencies. With extremely minimal maintenance required to operate the system and a useful service life of over 60 years, those savings will continue long into the future.
It’s been so successful, the University is not only expanding the system to all of the new construction on campus, but it’s also working with the city of Grand Junction to explore options for expanding the system into the surrounding community.
“This is an exciting example of community-scale geothermal,” Gov. Polis said. “Once we build this great geothermal heating and cooling system, we can leverage it to help extend the benefits and savings to the community.”
To aid in the expansion of geothermal energy use, Toor outlined a new $12 million grant program with the Colorado Energy Office that supports individual buildings adding geothermal heat pumps, as well as the planning and implementation of larger district heating geothermal systems similar to the systems at Colorado Mesa University.
“The Inflation Reduction Act,” Toor added, “is, for the first time, treating geothermal on an even basis with other renewables on the electricity side. It’s also creating tax credits that may be very useful for geothermal heat pump deployment.”
Geothermal heating and cooling systems, of course, are just one way to take advantage of the West’s vast geothermal potential. Over the next eight months, several Western Governors will be hosting webinars to showcase the capabilities of different geothermal technologies at:
On September 27th, Western Governors’ Association kicked off Colorado Gov. Jared Polis’ WGA Chair Initiative, Heat Beneath Our Feet, with a tour of Colorado Mesa University’s geo-exchange heating system. This system heats and cools 19 buildings covering more than 1.2 million sq ft and saves Colorado Mesa University $1.2 million each year. On Oct. 6 WGA hosted a webinar with geothermal experts to discuss how the system works, what opportunities exist for replicating this technology throughout the West, and the challenges to implementation.
A reminder of the choices that global society has to make about the climate:
Delaying action on reducing emissions commits the world to live with severe consequences.
Rapid action now means a more habitable world for all.
There is no going back. Choose wisely. Credit: Ed Hawkins via via his Twitter feed
IT’S THE WORLD’S MOST IMPORTANT CLIMATE GOAL: limiting the Earth’s warming to 1.5 degrees Celsius (2.7 Fahrenheit). It’s the aspiration of global agreements,and to inhabitants ofsome small island nations, the marker of whether their homes will continue to exist. Keeping warming this low will help save the world’s coral reefs, preserve the Arctic’s protective sea ice layer and could avoid further destabilizing Antarctica and Greenland, staving off dramatic sea level rise. But with the world having already warmed by more than 1.1 degrees Celsius (2 degrees Fahrenheit) above preindustrial temperatures, achieving the goal is in grave doubt.
TO SEE WHAT HOPE REMAINS,The Washington Post examined over 1,200 different scenarios for climate change over the coming century, based on the models produced by the world’s leading climate scientists and considered in a key 2022 report of the U.N. Intergovernmental Panel on Climate Change…
In the end, these are simply well-informed models of how the world will work. What’s more, we still have a limited understanding of how the climate system will respond to emissions. At the U.N. Climate Change Conference late last month, world leaders reaffirmed the 1.5C goal. But these scenarios show that without dramatic action — action the leaders did not commit to taking — it most likely will not be possible. Or at least, not without a major overshoot first.That is where the world is currently heading.
Observed temperature Water year 2022 was the sixth warmest and 35th driest on record going back to 1896. At a national scale, Colorado was part of a southern and central plains drought over the Water Year 2022. The South Platte basin was much drier than normal, while parts of the state west of the continental divide experienced wetter conditions. 2022 was a “warm dry” year as compared to historical average temperatures and precipitation data. However, this temperature data was heavily impacted by a very mild early season period from October through November 2021. As in recent years, February 2022 was the coldest month of the year.
Observed precipitation and drought conditions Precipitation for the 2022 water year started dry, then was impacted by about 15 days of strong moisture in late 2021. April was dry and also recorded as the windiest month on record. The state had a wet July and monsoonal moisture in the central and southern parts of the state was very impactful on overall precipitation trends. In the October/November timeframe the state experienced wetter conditions in the Northwestern/Western parts of the state, while it has remained very dry on eastern plains. The 30-Day Standardized precipitation Indices (SPI) shows dry conditions over the last month, but the longer term 24-month SPI indicates wetter than normal conditions throughout the central part of the state. Abnormally dry and moderate drought remains across much of the west slope. The Drought Monitor reflects few or no changes because changes move slowly this time of year, however drought doesn’t stop. Precipitation has been very low in Baca, Bent, and Prowers counties. Overall, the country is suffering from extensive drought, and Colorado is no exception.
Credit: Colorado Climate Center
Observed streamflows Going into Water Year 2023 Colorado has some of the best antecedent soil moisture in years. This is good news but not the only variable that matters. Vegetative health shows decent conditions west of the divide, but on the eastern side of the divide conditions are a lot drier than normal. Precipitation is near normal at 95% of median WYD precipitation.
Westwide SNOTEL basin-filled map December 4, 2022 via the NRCS.
Snowpack and reservoir storage Statewide snowpack is at 118% above median for this time of year, but that number is skewed a bit by higher than average low elevation snowpack for this time of year. Snowpack on the western slope is generally above average, while the eastern slope is generally below average. All basins are above average except South Platte and Laramie. Statewide reservoir storage is at 77% of normal. Releases from Blue Mesa are driving low reservoir storage in Gunnison Basin. There is a human element to low storage in Gunnison and Southwest basins due to water being sent downstream.
Seasonal outlook La Niña looks likely to continue through early winter and possibly beyond. On average, the Northern Rockies are wetter during La Niña and with colder temperatures that can result in good snowpack conditions . Drier conditions may impact the southern part of the state.
Illustration of how a denitrifying bioreactor fits in with drainage water management. Credit: NRCS
Click the link to read the article on the NRCS website (Kari Cohen):
Walk to the edge of certain crop fields in Iowa and look down. You might not notice anything unusual, but just beneath the surface hordes of woodchip-dwelling microorganisms are busy removing excess nitrates from water before it leaves the field. By filtering nitrates, this organic gauntlet safeguards local streams and, eventually, the Gulf of Mexico.
Hungry microorganisms and woodchips are the key components of denitrifying bioreactors, a conservation practice that USDA’s Natural Resources Conservation Service (NRCS) made eligible for financial assistance last year with the publication of a Denitrifying Bioreactor conservation practice standard. Progressive farmers in the Midwest have been experimenting with bioreactors for about a decade, and NRCS has piloted the practice in a handful of states including Iowa, Minnesota and Illinois.
“We’re really excited about the potential to spread this technology across the Mississippi River Basin,” said Dr. Wayne Honeycutt, deputy chief for science and technology at NRCS. “When paired with nutrient management, cover crops and no-till practices, denitrifying bioreactors are a fantastic line of defense for subsurface nitrates.”
Water control structures (in the large white circles) route water running through tile lines into the denitrifying bioreactor, which lies underground at the edge of a field. Image by John Peterson via the NRCS
A bioreactor is basically a buried trench filled with a carbon source – usually wood chips – installed at the edge of a field. Tile drains from the field carry excess water from the plant root zone, and divert a portion of the drainage water into the bioreactor. Microorganisms on the wood chips consume the nitrates in the water and expel it as nitrogen gas. Performance varies based on size, location, and a variety of other factors, but the average bioreactor can be expected to remove 35-50 percent of nitrates from the water flowing through it. Bioreactors have no adverse effects on crop production and do not restrict drainage.
In 2011, the Iowa Soybean Association was awarded a Conservation Innovation Grant from NRCS to increase farmer awareness and accelerate implementation of denitrifying bioreactors. Project leaders monitored and analyzed the performance of new and existing bioreactors, and explored ways to limit buildup of harmful contaminants in the woodchip pile.
“One thing we learned is that it’s important not to build bioreactors too large,” said Keegan Kult, environmental projects manager with the Iowa Soybeans Association. “If they’re too large, it becomes hard to control the flow of water through the bioreactor.”
The project also provided outreach and training to NRCS field staff and drainage contractors to build confidence and familiarity with the new practice. Kult said that the Iowa Soybean Association has been involved in the installation of 22 bioreactors in Iowa, and estimates that there are probably another 10-15 beyond that.
Installation costs of a bioreactor vary, but the average model costs $8,000-$12,000. NRCS, through the new conservation practice standard, may provide partial financial assistance for the cost of implementation. Nabbing Nitrates Before Water Leaves the Farm: Bioreactors, a short video by the Missouri & Mississippi Divide Resource Conservation and Development with support from NRCS, provides a nice overview of a bioreactor from start to finish.
NRCS promotes coordinated conservation practices that help producers avoid loss, and control and trap nutrients and sediment at the edge of farm fields. Denitrifying bioreactors hold great promise as a nutrient trap, reducing the flow of excess nitrates into local bodies of water, a significant water quality concern throughout the Mississippi River Basin.
Due to their potential for capturing nitrates, bioreactors are gaining popularity. Bioreactors are still a relatively new technology, however, and continued research and testing will lead to further refinement and performance improvement in the future.
Installation of a denitrifying bioreactor. Nitrates beware. Photograph by Jason Johnson, NRCS Iowa.
In Kansas, the Dakotas, Nevada and New Mexico, some places received less than 5% the normal amount of rain for the month, while others saw more than 200%.
Subsidized water cultivated the West, but this required becoming increasingly profligate with the region’s scarcest resource
The West uses too much water. For such a simple problem, the obvious solution — use less — lies frustratingly out of reach.
That inability to change may seem hard to understand, but the root of the problem becomes clearer if we consider the role of the West in the historical development of the United States:
The purpose of our system of “free water” — heavily subsidized water for irrigation — was to provide opportunities to settlers.
The frontier has served an important function in the Euro-American imagination since before there was a United States. For historians of the American West like me, the significance of the frontier has been at the center of our field for more than a century. Thomas Jefferson made the most notable case for westward expansion, prescribing it to relieve the social and political pressures that were building up as eastern populations grew and fought over limited resources. By the mid-1800s policymakers believed his ideal of yeoman homesteaders and their patchwork of farms was the Manifest Destiny of the United States’ exceptional democracy.
But that ideal never made it all the way across the continent. It ran into a problem right around the 100th meridian, west of which there wasn’t enough rainfall for agriculture.
Agriculture would require irrigation. A lot of it.
Hayfield message to President Obama 2011 via Protect the Flows
To solve this problem, the United States formed the Reclamation Service (the precursor to the Bureau of Reclamation) just over a decade after the frontier closed in 1890. While the federal government wasn’t quite powerful or rich enough, at the time, to construct many major irrigation projects, the Service provided a signal of the nation’s commitment to investing in the West as a site for settlement. It was too important a project to leave to private irrigation companies and too much work for individual homesteaders. As historian Donald Pisani put it in his book Water and American Government, “Federal reclamation was the last stage of Manifest Destiny.”
With the New Deal, the Bureau of Reclamation came into its own: Hoover Dam, completed in 1935 as the world’s largest dam, served as a symbol for the country’s ability to conquer nature.
Progressives championed desert reclamation at the turn of the century, but the federal government’s willingness to build infrastructure and give water away on extravagantly lenient terms was just as appealing for conservatives after World War II. Even Barry Goldwater, while courting the libertarians of the nascent New Right, advocated for the federally funded Central Arizona Project in his home state so that farmers could grow cotton in the Sonoran Desert.
That’s the defining contradiction of life in the West: “Government,” in Western parlance, was and is the stuff of restrictions, even when it’s the government that underwrites ever-popular sprawl.
While some made fortunes off this deluge of government spending, the enrichment of a few landowners was not the policy objective. Rather, the purpose of all the free water was to retain the West as a “safety valve,” a place of refuge for those who wanted to avoid the taxes and regulations of the East. But to accommodate growth without limits as the population boomed, the region would need to heighten the contradictions and become increasingly profligate with its scarcest resource.
Agriculture was once the means for permanent settlement of the arid West, and it continues to drive water consumption today. Around 80% of Colorado River water goes toward agriculture. About half of that is directed toward alfalfa hay that feeds cattle, an extremely inefficient way to provide calories for humans.
AZ must reduce water usage by 21% — and smaller cuts are needed in NV and Mexico — to avoid a “catastrophic collapse” of the Colorado River, the U.S. govt says.
The area is facing its worst drought in 1,200 years — now ongoing for 23 years — largely due to the climate crisis. pic.twitter.com/2n8gUy1eKV
Agricultural water rights are some of the oldest in the West, and water law here revolves around seniority. Yet even if there were a ready legal pathway to divert water away from alfalfa fields, the fact remains that the apparatus for western water delivery was simply not built with a regulatory lever. The underlying imperative to grow without limits would inevitably lead back to a state of crisis.
Consider St. George, Utah. The fastest growing metropolitan area in the country consumes almost no agricultural water, yet its lawns and golf courses quickly suck up its scarce water supply. The city, a popular destination for retirees, is expected to double in population by 2050. Officials now find themselves struggling to find sources of water for the surge in residents. What is quickly becoming a crisis for humans is also creating additional pressure on other species such as the endangered woundfin and Virgin River chub.
Pine Valley Mountains with St. George, Utah in the foreground. By Óðinn – Own work This image was created with Hugin., CC BY-SA 2.5 ca
The system’s deference to ideology over pragmatism is clear when it comes to the Basin’s 30 Native American Tribes. Collectively, they control about 20% of the water rights in the Colorado River system, yet many of those rights consist of “paper water.” They’re unrealized due to a lack of infrastructure. Building the necessary water projects for the Tribes would not only cost money but also push the system past the point of collapse. The very viability of the free water system depends on a de facto denial of the water rights of Indigenous nations, just as broken treaties facilitated the “free land” policy of the 19th century.
Free water was destined to run out eventually. Facing this problem in the West will be difficult, considering that politics and culture have worked in tandem for so long to keep “government” out of government-subsidized water. It’s unclear whether the system can be retrofitted with an off switch and whether the necessary governments can work together to do so before the Colorado River system crashes.
So how do we move forward? Ending the current subsidies seems the most commonsense solution — as well as the most unlikely to gain political traction.
Another possible solution: commodities trading. The classic solution for an imbalance of supply and demand is to introduce markets. Yet applying this approach to western water faces logistical challenges and can do little about longstanding problems of equity.
Still, the problem is big enough that all interventions may be necessary. Perhaps these first two ideas can be implemented. And perhaps we can think bigger.
One way forward is for the government to recognize the inherent worth of natural waterways, rejecting the premise that all fresh water must be consumed. Giving legal rights to ecosystems is the goal of the rights of nature movement, which has had some success across the world and even in the U.S. West. The organization Save the Colorado helped the communities of Ridgway, Nederland, and Grand Lake in Colorado pass resolutions recognizing the intrinsic rights of their watersheds. I’m part of an organization, Save Our Great Salt Lake, that’s exploring a similar strategy.
Wherever the future leads, the aridification of the American West will have consequences not just for those living here, but for the entire country.
It’s conceivable that westerners will adapt more readily to a drier climate than the rest of the nation will adapt to the loss of a region that functions as a safety valve. At any rate, we’re approaching the end of an era in which water was taken for granted. Just as human beings physically depend on water, our policies and conversations need to align with the water cycle.
Two of the biggest current topics in water resources management drew nearly 400 people to the Embassy Suites on Nov. 15.
The Northern Water Fall Symposium offered in-depth panel discussions exploring the ongoing challenges facing users of Colorado River water and the challenges of developing housing with appropriate water-conserving landscaping.
With an overall theme of the event highlighting the physical and sociological adaptations that may be required of Northern Colorado residents into the future, the Symposium brought together water users from across many municipalities, agricultural interests and industries to hear from top experts in their respective fields.
In addition to the in-depth discussions, the Symposium offered the opportunity to meet the new director of the Colorado Water Center – John Tracy, hear about the regional outlook from the state’s climatologist, forest health initiatives and local water projects.
Planning for the Spring Water Users Meeting has already begun, and more information will be released soon.
Colorado’s ski-and-snowboard industry fights to mitigate the consequences of climate change while boosting the state’s economy.
It’s the first rule of skiing and riding: You need snow.
And when Mother Nature is stingy in providing the white stuff, Colorado’s ski-and-snowboard industry ramps up its efforts to lend her an icy helping hand.
Arapahoe Basin opened Oct. 23 this year, with several other resorts following suit a few days later. Winter Park had the earliest opening day in its 83-year history despite the fact that it has seen less natural snowfall this year than last.
It’s all thanks to the resorts’ extensive snowmaking operations, where water and pressurized air are used to create artificial snow. Recent advances in snowmaking technology, coupled with some major investments in state-of-the-art equipment, often send ski-and-snowboard season off to a flying start before Halloween.
That’s great for Colorado’s outdoor industry, which generated $11.6 billion in economic activity in 2021, said Lincoln Davie, Ph.D., associate professor of Outdoor Recreation in Metropolitan State University of Denver’s School of Hospitality. Snow activities alone generated $1.3 billion in Colorado, which ranked first in the nation.
“The ski industry remains our most robust outdoor market,” Davie said, “and there’s an expectation that adventure tourism will bring in more than $1 trillion globally by 2030. So yes, you could say getting a steady supply of snow is pretty critical.”
But maintaining that steady supply to sustain a crucial sector of the state’s economy is also a balancing act. Snowmaking at Colorado ski resorts annually diverts around 1.5 billion gallons of water and uses a lot of energy, all while the state endures a crippling 23-year drought and an accelerating climate crisis.
“It’s a difficult situation, certainly” said Tom Bellinger, Ph.D., an affiliate professor of Environmental Science at MSU Denver. “Although it does help that winter recreation occurs during the ‘recharge season’ of the water year, when there’s generally less demand for irrigation, plants and crops.”
But the situation remains fragile, he warned. A string of dry winters could easily lead to a sparse mountain snow covering, resulting in a limited water supply to fill the state’s reservoirs.
“That would be a double whammy for tourism,” Bellinger said. “If you had not enough mountain snow when resorts needed it most — plus a lack of available snowmaking water — you’d likely be looking at shorter snow seasons.”
‘Stretchy’ season
There’s good reason why the ski industry is investing so heavily in man-made snow. Snowpack in the U.S. West fell by nearly 20% during the last century, according to an analysis by the Environmental Protection Agency. And as natural snow progressively arrives later and melts earlier, snowmaking has provided a means to artificially “stretch” the skiing season — in both directions.
Besides enabling record early starts this year, man-made snow has been lengthening the ski season in recent years. That’s why snowmaking is critical to the industry’s bottom line and the 46,000 year-round jobs that depend on it, Davie said.
“Without reliable snow all season long, all those other highly profitable elements of the resort experience — guest ski passes, lodging, food and drink, even parking — simply would not happen,” he said.
Snowmaking first started to gain traction around 50 years ago and has become almost ubiquitous. The National Ski Areas Association estimates that around 87% of the country’s ski resorts use snowmaking equipment.
Still, you can’t say they’ve been napping through the climate crisis. In recent years, the multibillion-dollar industry has invested heavily to make snowmaking technology more energy-efficient and environmentally conscious.
Numerous resorts have replaced their manual snow guns with fully automatic models. Fitted with onboard weather systems, these complex machines “read” forecasts and switch on only when the temperature is suitably cold and crisp. The result: more snow with less water.
Crucially, resort operators have also gotten better at utilizing another valuable resource: experience. Davie argues that decades of trial and error have made ski specialists more strategically savvy about what does and doesn’t work, and better at managing risks.
“These days, resorts know precisely where to position snow guns to maximize cover, and they carefully scrutinize weather forecasts,” he said. “It’s a finely honed operation.”
Sustainable skiing
While the 1.5 billion gallons of water used annually in Colorado snowmaking sounds like a giant number, it’s a tiny amount — a thimbleful of water in a great lake — compared with the vast reserves (85% of Colorado’s total water allowance) set aside each year for agricultural use.
And most of this man-made snow, around 80%, eventually melts and returns to the watershed during the spring.
“Last season, Winter Park took around 72 million gallons from the Vasquez Canal for its snowmaking operations,” Bellinger said. “But most of that water, excepting 20% lost to evaporation, returned right back to the canal during the melt season.”
In other words, the ski resorts are largely “borrowing” the water rather than outright taking it.
Colorado’s ski industry is also fighting to mitigate its impacts and implement progressive environmental strategies.
“The outdoor industry has really led the way in demonstrating that business can’t be relevant without a deep integration of sustainability principles,” Davie said.
As an example, he pointed to Vail Resorts, a massive company that employs thousands but nonetheless is on track to achieve a zero net operating footprint by 2030. Other ski areas have also set similar goals through aggressive sustainability plans.
“That’s the kind of progress I’d like to see across the board,” Davie said. “If more industries could follow Vail’s example and commit to such ambitious environmental targets, it might give us a fighting chance.”
Did you know New York recently had a major “lake effect” snowstorm? The view from space helps us see how this kind of storm happens. Cold air passes above unfrozen lakes and picks up moisture, which falls as snow on the downwind side of the lake. pic.twitter.com/lY7xLSmUXH
WildEarth Guardians has filed a lawsuit seeking to hold federal agencies accountable for the continued decline of imperiled species in the Middle Rio Grande, including the endangered Rio Grande silvery minnow.
The lawsuit filed today in the federal District of New Mexico, alleges that the Bureau of Reclamation and the U.S. Fish and Wildlife Service are in violation of the Endangered Species Act and seeks a court order compelling the federal agencies to reassess the effects of water management activities on threatened and endangered species along the Rio Grande. If successful, Guardians’ lawsuit would require federal agencies to develop enforceable measures to ensure that dams and diversions in the Middle Rio Grande do not jeopardize the survival or recovery of imperiled species.
The Rio Grande is a critical artery of life through the desert of the American southwest. But a century of dams, diversions, and modifications have decimated this living river and driven numerous native species to extinction and others to the brink. Critical wildlife habitat in and along the Rio Grande has been impaired, threatening bird species such as the southwestern willow flycatcher and the yellow-billed cuckoo. And nearly 30 years after the silvery minnow was listed as endangered in 1994, this once-abundant fish remains perilously close to extinction. While federal, state, and local agencies have been working to protect and recover silvery minnow populations for decades, critically-low population levels show that new solutions are desperately needed.
“Fish need water. With the Rio Grande running dry through Albuquerque during the summer of 2022—for the first time in decades—it comes as little surprise that silvery minnow populations remain in crisis,” said Daniel Timmons, Wild Rivers Program Director for WildEarth Guardians. “It is time to move beyond band-aid solutions for the Middle Rio Grande and think holistically about how to save a living river and all the native species that call the river home.”
“With the climate crisis and aridification contributing to long-term changes in Rio Grande flows, federal water managers must recognize that the status quo is a recipe for extinction,” said Timmons. “Time is running out—not just for the silvery minnow, but for a living Rio Grande. If future generations of New Mexicans are to enjoy a living, flowing Rio Grande, a verdant bosque, and abundant fish and wildlife, we must come together and figure out new, sustainable solutions to meeting human needs for water for cities and farms, while protecting our environment.”
Click the link to read the release on the Reclamation website (Becki Bryant and Michelle Helms):
The Bureau of Reclamation has begun monthly operational adjustments with reduced releases from Glen Canyon Dam under the Drought Response Operations Agreement. The adjusted releases are designed to help protect critical elevations at Lake Powell until the spring runoff materializes.
The monthly adjustments will hold back 523,000 acre-feet of water in Lake Powell from December 2022 through April 2023 when inflow to the reservoir is low. The same amount of water (523,000 acre-feet) will then be added to releases to Lake Mead between June and September after the spring runoff occurs.
Consistent with the DROA and the dam’s Long-term Experimental and Management Plan Record of Decision, only the monthly volumes are being adjusted. The annual release volume of 7.0 million acre-feet for water year 2023 (October 1, 2022, through September 30, 2023) will remain the same as described in the Colorado River Interim Guidelines for Lower Basin Shortages and Coordinated Operations for Lake Powell and Lake Mead (referred to as the 2007 Interim Guidelines).
These monthly adjustments will boost Lake Powell’s elevation by nearly 10 feet by April 2023. Latest projections show the reservoir dropping below the 3,525 feet target elevation as early as this month. The target elevation is a buffer that allows for response actions to prevent Lake Powell from dropping below elevation of 3,490 feet, the lowest elevation that Glen Canyon Dam can still release water through its eight penstocks and generate hydropower.
The modified release pattern for Glen Canyon Dam is as follows:
Modified release plan for Glen Canyon Dam December 2, 2022 via Reclamation
“Under the Drought Response Operations Agreement, making these monthly operational adjustments at Glen Canyon Dam is an integral part of ongoing actions to protect critical elevations at Lake Powell,” said Reclamation’s Upper Colorado Basin Regional Director Wayne Pullan.
Reclamation and the DROA parties have amended Attachment B – Operational Adjustments at Glen Canyon Dam to reflect the decision to modify monthly releases from the dam. Work continues to develop a Drought Response Operations Plan for the 2023 DROA year (May 1, 2023 – April 30, 2024), which could include additional water releases to Lake Powell from the upstream Colorado River Storage Project initial units of Flaming Gorge, Blue Mesa and Navajo reservoirs.
Reclamation continues to closely monitor the basin’s hydrology and will release updated projections later this month with the December 24 Month Study. Those projections, scheduled to be released Dec. 15, will include the modified monthly releases from Glen Canyon Dam.
“We’ll continue to work with our basin partners in the future in the same collaborative spirit we have demonstrated in the past,” said Reclamation’s Lower Colorado Basin Regional Director Jaci Gould.
Reclamation is working with its partners in the Colorado River Basin to meet the need for long-term adaptation for drought and a changing climate. The Bipartisan Infrastructure Law and the Inflation Reduction Act provide the resources to back up Reclamation’s commitment to work in a consensus manner to protect the Colorado River system.
A new turf replacement program, set to roll out in Colorado in 2023, will pay to convert some of the grass in urban areas and residential yards into more water-efficient landscaping. This is the first time the State of Colorado has dedicated funds expressly to turf replacement. It’s an important step to increase water conservation and get it closer to where it needs to be, said state officials and conservation leaders at a confab earlier this month. But this version of cash for grass will be just one of many tools — and maybe not the most influential one — that will transform landscaping in the state in response to climate change and reduced water availability.
As climate change, drought, and crisis on the Colorado River intensify, outdoor water use and nonessential turf become increasingly important targets for water conservation. Today, 40% of Colorado’s municipal and industrial water use goes toward outdoor irrigation.
“Water conservation is critical. We’re talking about how we can build the landscapes of tomorrow, today,” said Russ Sands section chief of water supply planning for the Colorado Water Conservation Board (CWCB) in kicking off the Colorado Landscape Summit on November 9. More than 150 people attended, either online or in person, this first-ever landscape summit hosted by the CWCB at Metro State University in Denver. “Outdoor turf removal is a really critical part of this discussion.”
The outdoor water-saving conversation has been gaining momentum in Colorado. The state legislature passed House Bill 1151 in June 2022, requiring the CWCB to develop a turf replacement program that will provide incentives for replacing nonessential irrigated turf with more water-wise landscaping. According to the bill, examples of nonessential turf include medians, land adjacent to open spaces, stormwater detention basins, commercial or industrial properties, portions of residential lawns, and more. The new law also came with an allocation of $2 million to finance the program.
Now the agency is working to set up that grant program, with details expected this spring and applications set to open sometime after July 2023. Local governments, special districts, nonprofits, and tribal nations will be eligible to apply, and individuals interested in receiving funds may be able to work with those entities to access the money.
But the program’s $2 million in initial funds won’t stretch far or transform the state’s turf on its own, said Peter Mayer with Water Demand Management, or WaterDM, an engineering consulting firm.
“The amount of money being spent in Colorado is ultimately nothing compared with what’s being spent in a single year in southern Nevada or southern California,” Mayer said.
After subtracting staffing and administration costs, some $1.5 million will remain for incentives to transform landscapes. That money is expected to be distributed in two cycles of $750,000 over two years, with the majority funneled into existing local turf replacement programs. For the program to continue beyond 2025, Colorado will have to find additional funding. However, though not specifically set aside for turf replacement, the CWCB’s Water Plan Grants and Water Supply Reserve Fund Grants may also be used to fund turf replacement work.
In August 2022, some public water providers and cities who rely on water supplies from the Colorado River Basin, including Aurora Water, Denver Water and Pueblo Water, signed a Memorandum of Understanding committing to reduce per capita water use. On November 15, additional water providers and agencies signed on, bringing the total to more than 30 entities across the West. The MOU says each of the water providers will introduce a program to reduce the amount of “non-functional turf grass by 30% through replacement with drought- and climate-resilient landscaping, while maintaining vital urban landscapes and tree canopies that benefit our communities, wildlife and the environment.” Details about how this will be accomplished have not yet been released.
Colorado is hoping to maintain those same qualities with its turf replacement program, said Sands.
But there’s still a lot to learn about how much savings Colorado can expect from turf replacement, what level of incentives are necessary to encourage participation, and what other potential costs and benefits there may be.
The state is trying to learn from neighbors with large-scale programs. The Southern Nevada Water Authority, which provides water to Las Vegas and surrounding cities, has been collecting data on its turf replacement program for almost 25 years, providing a helpful resource for Colorado officials.
Since the late 1990s, the authority has converted about 4,600 acres of turf, saving 467,000 acre-feet of water, at a cost of around $285 million. The average landscape conversion through the authority’s program resulted in a 19% to 21% reduction in water use. Among other findings, participation in the authority’s program correlates with the scale of the incentives – when cash incentives increase, participation increases.
Colorado should expect about one-third of the water savings that Nevada has seen, said Doug Jeavons, managing director with BBC Research, a firm that served as the CWCB’s water economy specialist in working on the 2019 Technical Update to the Colorado Water Plan. That is because of cooler temperatures and the fact that we don’t water turf year-round here, which means a lower starting point for outdoor water use and therefore less potential savings from turf replacement.
“Lower [water] savings basically means less favorable economics for a property that wants to participate in this program,” Jeavons said. In other words, it will take a property in Colorado more time to see the cost savings that result from reduced water bills due to their landscape conversion than it does in Nevada.
Economics aren’t the only reason to convert a property’s turf to water-wise landscaping. A 2018 Alliance for Water Efficiency study on landscape transformation found that most customers aren’t happy with their landscaping and 69% of all respondents have already considered taking out their lawns, said Mayer, who led the study.
“There’s just not enough [state] money to buy [out] all the landscapes [to transform them from grass to water-wise vegetation] so we have to do the work ourselves toward changing the market and shifting the culture,” Mayer said. “We have to create a new Colorado landscape ethos of less water use, minimizing outdoor water use.”
According to Mayer, incentives aren’t the only way to encourage that change. Codes, ordinances, regulations, land use planning and zoning, water bills, and ultimately education and culture change all play a role, he said. But while making those changes, it’s important to minimize any unintended negative impacts, maintain the tree canopy, minimize the heat island effect, and transform landscapes in an equitable way.
To date, 22 turf replacement programs exist across Colorado, and many other utilities have water conservation programs that target outdoor irrigation.
Colorado Springs Utilities offers a turf replacement rebate and works to incentivize customers to update their landscaping, shifting to plants that can thrive on 12 inches of irrigation per year or less, said Julia Gallucci, the water conservation supervisor for the utility. The city is also focusing on retrofitting parks and public areas where people can see examples of different types of water-wise landscaping.
Colorado’s West Slope communities are also looking to reduce outdoor water use, but face different challenges.
Some residents in the Roaring Fork Valley, for instance, use untreated water for outdoor irrigation that is not metered through the utility, complicating conservation efforts. “We have raw water supplies so it’s difficult to put in outdoor water restrictions because a neighbor might be pulling water from a ditch, so there’s confusion,” said April Long manager of the Ruedi Water and Power Authority. “I think we still need to do some work on changing expectations.”
Meanwhile, the City of Aurora, which offers a grass replacement incentive, upped the ante. In August 2022, the city passed an ordinance that restricts turf in new developments. The city no longer allows “non-functional,” cool weather turf to be installed at new development projects, redevelopment, or at new golf courses. The installation of turf is also banned from medians, curbsides and residential front yards.
“The key is to not put turf in in the first place,” said Tim York, water conservation supervisor for the City of Aurora. In developing its ordinance, Aurora engaged developers and community members. “You want them to get involved because it’s the right thing to do, not because we told them to do it.”
Caitlin Coleman is a contributor to Fresh Water News and is editor of Water Education Colorado’s Headwaters Magazine. She can be reached at caitlin@wateredco.org.
Borne of Water illustrates the journey of water, from mountain snow to flowing rivers. Inspired by a historical Hopi event, the film shows how climate change is impacting water and rivers today. Reduced snowpack and shrinking flows impact all who live along the river. Tiyo, a Hopi boy, grows curious about where the water goes once it passes through his village on the Colorado River. To quench his curiosity, he traverses the Colorado River in hopes of saving his village from drought. Through Tiyo’s journey and lessons about what changes and what remains, we find deeper meaning in how water connects us to past, present, and future.
The New River, a contaminated waterway that flows north from Mexico, spills into the Salton Sea in southwestern California’s Imperial Valley. (Image: U.S. Bureau of Reclamation)
Southern California’s powerful Imperial Irrigation District voted late Tuesday [November 22, 2022] 3-2 to ink an agreement with federal and state officials that could yield as much as $250 million for Salton Sea restoration projects in exchange for not using another 250,000 acre-feet of Colorado River water. An acre-foot is enough to supply about two households. The vote came despite livid objections from Imperial County farmers and environmental groups, who questioned why such a major agreement was being voted on just 24 hours after it was made public, and four days before two newly elected board members are slated to be sworn in to the five-member panel, replacing outgoing president Jim Hanks and outgoing director Norma Galindo, two of the three backers of the agreement on Tuesday…
“Most of us heard about this four-way deal for the first time through the news media Monday afternoon …. The omission of public input borders on a violation of human rights when dealing with something essential to living like water,” said Jose Flores, research and advocacy specialist at Comite Civico del Valle, a nonprofit community advocacy group, who denounced it as a “half-baked deal.”
[…]
But director JB Hamby, agreeing with a majority of the board and the district’s general manager and water director said, “there is no down side” to the agreement with the U.S. Department of Interior, the California Natural Resources Agency and the Coachella Valley Water District because while it does not bind the district to cuts, it guarantees critical federal support if cuts are implemented. The agreement also would release IID from liability for wind-borne pesticides and other toxics contained in exposed lake bed, and loss of habitat for endangered birds and other species. Instead the state of California would absorb that risk. In exchange, IID agreed to guarantee state contractors long-sought access to its lands to construct restoration projects, and to provide up to 100,000 acre-feet from New River supply, not Colorado River supply. Outgoing president Hanks said the agreement guarantees up-front for the first time in decades of cuts that federal and state officials will pay for impacts to the Salton Sea from reduced Colorado River supply. The sea is dependent on runoff from Colorado River water provided to farms along its shores for its continued existence. Since 2003, a series of agreements have diverted large amounts from the farms and the lake to urban areas.
Excess nitrogen and phosphorus in waterbodies, known as nutrient pollution, is a growing problem in Utah and across the country. Nutrients are linked to cyanobacterial growth, including harmful algal blooms, and can lower dissolved-oxygen levels in waterbodies, adversely affecting aquatic life. This pollution comes from a variety of sources, including wastewater treatment plants, nonpoint source pollution from agricultural operations, and residential and municipal stormwater runoff. Nutrient pollution poses a significant threat to Utah’s economic growth and quality of life, leading to substantial costs to the state and taxpayers if left unaddressed.
Click the link to read the article on the Reclamation website (Peter Soeth):
The Bureau of Reclamation is providing $1.69 million to nine projects that offer innovative and novel water treatment technologies that may make previously unusable water available. The funding is being provided for the recipients to conduct pilot testing on their proposed technology.
“Reclamation has been supporting utilizing new and novel technologies for water resource development for 120 years,” said Chief Engineer David Raff. “Water treatment technology is evolving rapidly, and these projects can improve and expand the accessibility to previously unusable water, especially for communities with some of the most urgent water needs.”
The projects were selected through a unique, two-stage process. For the first stage, a project description was submitted summarizing a research idea. Reviewers evaluated these ideas against the provided criteria. Those projects selected from the first stage then pitched their idea to a panel of experts through a live presentation and answered the same experts’ questions.
The selected projects are:
Carollo Engineers, Inc.: Pilot Testing of a Novel Energy Efficient Configuration for Carbon Diversion and CEC Removal, $200,000
Carollo Engineers, Inc.: An Innovative Ion Exchange-Based Advanced Treatment (XBAT) Approach for Direct and Indirect Potable Reuse, $199,989
Hazen and Sawyer: Improving RO Recovery through Optimization of Flux and Pump Usage with Real-Time Sensor Connectivity, Data-driven Modeling, and Automation, $197,294
Hazen and Sawyer: Pilot Scale PFAS Destruction in Membrane Concentrate via Electrochemical Oxidation, $196,916
Orange County Water District: In-Situ Gravity Driven Removal of PFAS During Groundwater Recharge to Protect Drinking Water, $199,430
South Platte Renew: Retrofitting Existing Infrastructure for Sidestream Biological Phosphorus Treatment to Reduce Coagulant Costs and Discharged Salts Associated with Chemical Phosphorus Removal, $100,000
Southern Nevada Water Authority: Assessment of Innovative Dissolved Air Flotation Approaches for Conventional Water Treatment, $200,000
The Research Foundation for The State University of New York – Stony Brook University: Enhancing the Removal of Hydrophilic Per- and Polyfluoroalkyl Substances (PFASs) by Granular Activated Carbon using Hydrophobic Ion-pairing as Pre-treatment, $199,601
Learn more about Reclamation’s Desalination and Water Purification Research Program and how it expands access to water by visiting www.usbr.gov/research/dwpr.
Updated Colorado River 4-Panel plot thru Water Year 2022 showing reservoirs, flows, temperatures and precipitation. All trends are in the wrong direction. Since original 2017 plot, conditions have deteriorated significantly. Brad Udall via Twitter: https://twitter.com/bradudall/status/1593316262041436160
Click the link to read the article on the Gizmodo website (Peter Deneen). Here’s an excerpt:
Floyd Dominy. Public Domain
The date is Feb. 9, 1997, and the man responsible for one of the most egregious environmental follies in human history is sitting at a restaurant in Boyce, Virginia, with the leader of the movement seeking to undo his mistake. Of the hundreds of dams Floyd Dominy green lit during his decade running the Bureau of Reclamation, none are as loathed as his crown jewel, the Glen Canyon Dam. In 1963, Dominy erected the 710-foot (216-meter) tall monument to himself out of ego and concrete, deadening the Colorado River just upstream of the Grand Canyon, drowning more than 250 square miles (648 square kilometers) in the heart of the Colorado Plateau, and inventing Lake Powell in the middle of a sun-baked desert. After a couple of drinks, Dominy asked his dinner guest, Glen Canyon Institute founder Richard Ingebretsen, for an appraisal of the effort to drain Lake Powell. “It’s pretty serious, Mr. Dominy,” Ingebretsen recalled telling him, holding back the seething discontent of the broad coalition he represented. When Ingebretsen described his hypothetical plan to drill through the twin boreholes bestriding Glen Canyon dam, Dominy replied, “Well, you can’t do that. It is 300 feet of reinforced concrete.” Then Dominy did something extraordinary—he lowered his glasses, pulled out a pen, and diagrammed precisely how he would do it on a cocktail napkin. A stunned Ingebretsen could hardly believe what was happening.
“This has never been done before,” Dominy said. “But I have been thinking about it, and it will work.”
The back of Glen Canyon Dam circa 1964, not long after the reservoir had begun filling up. Here the water level is above dead pool, meaning water can be released via the river outlets, but it is below minimum power pool, so water cannot yet enter the penstocks to generate electricity. Bureau of Reclamation photo.
In the 58 years since Glen Canyon was flooded, memory of what was lost has mostly been forgotten. Submerged beneath the water lies a desert canyon like none other that stretches some 200 miles (322 kilometers). The Colorado River was the wildest river in North America before it was arrested by the Bureau of Reclamation during the frenetic dam-building era last century. But in this section of the river, the current flowed calmly through fern-covered walls. “It was a kind of Eden,” as Elizabeth Kolbert described it in The New Yorker this summer, “more spectacular than the Grand Canyon and, at the same time, more peaceful. It was a fairy-tale maze of side canyons, and side canyons with their own side canyons, each one offering a different marvel.” Hundreds of ephemeral streams and tributaries joined the Colorado River here, each of them achingly abundant with riparian habitat and mind-bending geomorphology, where beavers and fish thrived beneath soaring rainbows of salmon-colored rock arches.
Glen Canyon is a natural wonder that’s been wasting the past six decades as an unnecessary water storage facility for the Bureau of Reclamation. The last time Lake Powell was as low as it is today, Neil Armstrong had yet to set foot on the moon. But the climate crisis and decades of water overuse have sent Powell’s shoreline receding. The telltale bathtub ring of the previous high water mark isn’t the only sign of change; habitats that were swallowed by the reservoir have sprung back to life—baby cottonwood trees, canyons full of frogs and maidenhair ferns, birds, bees, bears, and beavers have reclaimed their old territory…
September 21, 1923, 9:00 a.m. — Colorado River at Lees Ferry. From right bank on line with Klohr’s house and gage house. Old “Dugway” or inclined gage shows to left of gage house. Gage height 11.05′, discharge 27,000 cfs. Lens 16, time =1/25, camera supported. Photo by G.C. Stevens of the USGS.
Source: 1921-1937 Surface Water Records File, Colorado R. @ Lees Ferry, Laguna Niguel Federal Records Center, Accession No. 57-78-0006, Box 2 of 2 , Location No. MB053635.
Dominy’s dam, which the former House Interior Committee Chair Mo Udall as well as five-term Arizona Sen. Barry Goldwater have called “the biggest mistake in their legislative careers,” killed what was the biological heart of the Colorado River. With more than 79 species of plants, 189 species of birds, and 34 species of mammals, it was an ecological marvel. The canyon was also home to a staggering array of Indigenous sites and artifacts dating back hundreds of years, all of them now underwater. All that was traded away for the longest reservoir in the world, with approximately 2,000 miles of coastline. Unfurled, Lake Powell’s shoreline would stretch from Maine to Florida. Its primary function? To temporarily detain water for metered release to replenish Lake Mead. As Kolbert put it, Dominy built a reservoir for a reservoir. The redundant Glen Canyon Dam harnesses the Colorado River just upstream from Lee’s Ferry, an arbitrary point chosen to delineate “upper basin” states—Colorado, New Mexico, Utah, and Wyoming—from “lower basin” states—Arizona, California, and Nevada. Separating the river into two jurisdictions is seen as one of the original sins for the world’s most litigated river. Ingebretsen said Lake Powell was born as a security measure, founded on the distrust between upper and lower basin states.
This U.S. Drought Monitor (USDM) week saw areas of moderate to heavy rainfall along the central and western Gulf Coast region as well as areas further inland in the eastern half of Texas, southeastern Oklahoma, and southwestern Arkansas. In these areas, targeted improvements were made in drought-affected areas. Additionally, an outbreak of severe weather, including severe thunderstorms with tornadoes and wind damage, impacted areas of the South (Louisiana, Mississippi, and Alabama) overnight on Tuesday (Nov 29), resulting in severe damage and loss of lives reported. In the Southeast, isolated heavy rainfall accumulations led to improvements on the map in areas of Alabama, Georgia, and North Carolina. Elsewhere in the Southeast, short-term dryness over the past 90 days led to expansion of areas of severe drought in the Florida Panhandle, where rainfall deficits ranged from 3 to 9+ inches. In the Northeast, only minor changes were made on the map in areas of eastern Massachusetts and Rhode Island in response to precipitation shortfalls during the past 30–60-day period as well as below-normal streamflow activity and lack of groundwater recharge in areas of Cape Cod. In the Midwest, areas of moderate drought expanded in southern Michigan and northern Illinois where short-term precipitation deficits are negatively impacting soil moisture and streamflow levels. In the High Plains, generally dry and warmer-than-normal temperatures (2 to 10+ deg F above normal) prevailed across much of the region during the past week. Out West, drought-related conditions improved in areas of Arizona, New Mexico, Nevada, Washington, Colorado, Wyoming, and Montana. In terms of snowpack conditions in the region, the Natural Resources Conservation Service (NRCS) SNOTEL network is currently reporting the following region-level (2-digit HUC) snow water equivalent (SWE) percentages of median for the date (Nov 29): Pacific Northwest 134%, California 135%, Great Basin 157%, Lower Colorado 152%, Upper Colorado 98%, Rio Grande 76%, Arkansas-White-Red 66%, Missouri 101%, and Souris-Red-Rainy 81%. Looking back at the last several months, the contiguous U.S. experienced its 8th warmest September-October period on record since 1895 in terms of average temperatures (+2.2-deg F anomaly) and maximum temperatures (+2.6 deg F), according to NOAA National Centers for Environmental Information (NCEI). Precipitation in the contiguous U.S. during the September-October 2022 period ranked as the 11th driest (-1.14-inch anomaly)…
On this week’s map, improvements were made on the map in the greater Denver-Boulder area of Colorado and in portions of eastern Wyoming in response to above-normal precipitation in the short-term. Elsewhere in the region, no changes were made on the map. For the week, average temperatures were well above normal across the Northern Plains with average temperatures ranging from 2 to 10+ deg F above normal. However, the warmer temperatures melted the portions of the snow in areas of North Dakota allowing for beneficial percolation of meltwater into the still-unfrozen soils. According to NOAA NCEI, the Great Plains Region saw its 9th warmest (+3.0-deg F anomaly) and 8th driest (-1.4-inch anomaly) September-October on record. Statewide, Wyoming experienced its 3rd warmest (+4.2-deg F anomaly) and Colorado its 8th warmest (+3.1 deg F anomaly) September-October period on record…
Colorado Drought Monitor one week change map ending November 29, 2022.
Out West, some minor changes were made on the map in southeastern Arizona, southern New Mexico, east-central Nevada, and north-central Montana. In east-central Nevada, areas of Extreme Drought (D3) were reduced in White Pine County in response to improving conditions following above-normal precipitation during the monsoon season as well as from above-normal SWE levels currently observed in the Schell Creek and Snake ranges. Likewise, in southeastern Arizona and southwestern New Mexico, above-normal precipitation during the monsoon season as well as over the past several months led to the removal of areas of Severe Drought (D2). Further to the north in Montana, above-normal precipitation since the beginning of the Water Year (Oct 1), led to reduction of areas of Extreme Drought (D3). In terms of snowpack conditions across the region, near-normal to above-normal SWE levels are being reported across the basins of the Sierra Nevada, Great Basin ranges, Cascades, Northern Rockies, Wasatch, and areas of the Central Rockies. Further south, the basins of Southwest Colorado and the Rio Grande are currently below normal. For the week, average temperatures continued to be cooler than normal (2 to 10 deg F below normal) across much of the region except for areas of Northern California, Montana, and eastern portions of Colorado and Wyoming. Overall, much of the region was dry this week, however, some significant snowfall accumulations were observed in Pacific Northwest mountain ranges including the Olympics, Cascades, and Blue Mountains of northeastern Oregon. Likewise, snowfall was observed this week in the Wasatch Range as well as the Northern and Central Rockies, with additional mountain snow forecasted to impact areas of the West this week. According to NOAA NCEI, the September-October 2022 period was the warmest (+4.3-deg F anomaly) on record for the Rockies and Westward Region, 3rd warmest for the West Climate Region (includes California and Nevada) (+4.8-deg F anomaly), and warmest on record for the Northwest Climate Region (+5.5-deg F anomaly)…
In the South, improvements were made across areas of the eastern half of Texas, southeastern Oklahoma, western Arkansas, and southern Mississippi where locally heavy rainfall accumulations (3 to 8+ inches) were observed. Despite this week’s rainfall in portions of Texas, streamflows in the Hill Country remain below normal with numerous gauging stations reporting levels in the bottom 10th percentile, according to the USGS. In terms of reservoir storage in Texas, monitored water supply reservoirs statewide are currently 69.9% full, according to Water Data for Texas. Some low reservoir storage levels are currently being observed in the western half of the state, including at Medina Lake (west of San Antonio) which is currently 6.7% full. According to NOAA NCEI, the South Climate Region experienced its 13th driest (-2.34-inch anomaly) September-October period on record, with Louisiana observing its 6th driest (-4.35–inch anomaly) for the contemporaneous period…
Looking Ahead
The NWS WPC 7-Day Quantitative Precipitation Forecast (QPF) calls for moderate-to-heavy precipitation accumulations (including heavy snowfall accumulations) ranging from 2 to 5+ inches (liquid) across much of the Cascades of Oregon and Washington, Klamath Mountains, Coast Ranges of Northern California, and the Sierra Nevada Range. In the Intermountain West, 1 to 3+ inch (liquid) accumulations are expected in central and northern Idaho ranges as well as in the Teton Range of Wyoming. Elsewhere in the conterminous U.S., heavy precipitation accumulations are expected in Kentucky and Tennessee (3 to 5+ inches liquid) as well as in areas of the Northeast including New York, New Hampshire, and Maine. The CPC 6-10-day Outlooks call for a moderate-to-high probability of above-normal temperatures for the South, Southeast, and Mid-Atlantic regions, while much of the West, Plains, and Midwest are expected to be cooler than normal. Precipitation is forecasted to be above normal across the Pacific Northwest, Northern California, and across much of the Eastern Tier. Below-normal precipitation is expected in Florida.
US Drought Monitor one week change map ending November 29, 2022.
Click the link to read the post on The Buzz website (Floyd Ciruli):
I asked in a November 2 blog post if Colorado Republicans would best the 45 percent high they won in statewide races in 2018–answer, No. Jared Polis won the governorship in 2018 by 10 points. This year, Polis won by 19 points.
Along with the state sweep, Republicans were beaten in the marquee Federal competitions. Senator Michael Bennet was reelected by 15 points and the new 8th Congressional district rated leaning Republican, was won by the Democrats in a close race with more than 1500 votes. The seemingly safe district of controversial Congressperson Lauren Boebert was held by only 500 votes.
Click the link to read the article on the Big Pivots website (Allen Best):
Every corner of the state now has EV owners. I am told that one of Colorado’s 64 counties has no registered EVs, but my trolling of the Colorado Energy Office EV Dashboard could fine none.
Not surprisingly, the highest-per-capita rate for EVs were in Boulder County, with almost 36 per 1,000 residents, and Pitkin County – home to Aspen – with 28.75 per thousand. And Douglas County (Castle Rock) comes in third at about 20 per thousand.
After that, it’s a mixture of resort counties like Eagle, Summit, Larimer, and Denver, who all come in at 16 to 17 per thousand.
Cheyenne Wells (top photo), on the state’s eastern tier, too small to have a restaurant with operations aside from a few hours at mid-day, still manages to have 4 EVs on its roads adjacent to Kansas. On the opposite side of the state, Dolores County has 6 on the roads going into Utah.
The dashboard also says that pickup trucks now represent 17% of EV vehicles in Colorado, behind electric SVS at 39% and passenger cars at 19%.
The amount of topsoil moisture rated short to very short is highest in #Nebraska and #SouthDakota at 89% and 88%. The value for the contiguous US is 50%, which is considerably higher than the previous 7 years. This is the last USDA issuance of moisture values for 2022.
Glen Canyon Dam, seen here in May 2022, was a major electrical generation but has produced less as volumes in Lake Powell have declined. Photo credit: Allen Best/Big Pivots
As The Gazette’s report reminded us, our state’s defining river today is in greater peril than it has been at any time in history amid the West’s explosive growth and a 23-year drought that has limited the river’s flows year after year…conservation efforts alone seem like half-measures that inevitably lead to diminishing returns. As we asked here recently, what if we started putting more water into the Colorado River Basin instead of ratcheting down ever further how much is taken out of it? Increase supply, in other words, instead of futilely trying to curb demand. Some are taking up that challenge.
Arizona’s state government is laying plans with Mexico for a jointly developed desalination plant that would turn seawater into fresh water along the Arizona-Mexico border, where the Colorado River empties into the Sea of Cortez. That has the potential to lower water use downstream and leave more up river in Upper Basin states. There’s also great potential in new technology enabling water reuse, which is not so much a form of conservation as it is turning old water into new. Israel recycles and reuses nearly 90% of its water and Spain over 30%, a water expert recently wrote in a Gazette commentary.
Members of the Colorado River Commission, in Santa Fe in 1922, after signing the Colorado River Compact. From left, W. S. Norviel (Arizona), Delph E. Carpenter (Colorado), Herbert Hoover (Secretary of Commerce and Chairman of Commission), R. E. Caldwell (Utah), Clarence C. Stetson (Executive Secretary of Commission), Stephen B. Davis, Jr. (New Mexico), Frank C. Emerson (Wyoming), W. F. McClure (California), and James G. Scrugham (Nevada)
CREDIT: COLORADO STATE UNIVERSITY WATER RESOURCES ARCHIVE via Aspen Journalism
While floating through the Grand Canyon recently, river guide extraordinaire Bruce Keller taught me a new word: “mumpsimus.”
It means “a traditional notion that is obstinately held although it is unreasonable.”
I immediately thought of the way that the Colorado River Compact is being repeatedly blamed for the current water crisis in the Colorado River system. The oft-stated accusation is that the water shortages we’re experiencing now can be blamed on the fact that the framers of the Compact allocated too much water — much more than the river system could actually deliver. “The river was over-allocated from the beginning.”
In full disclosure, I must admit that I have made similar statements myself in the past. I am guilty of mumsimus. But I have reconsidered my position.
I’ve concluded that blaming the Compact is misleading and unhelpful. Implicating a Compact fashioned 100 years ago obfuscates rightful accountability. The situation we’re in now is not the fault of the Compact’s architects. This one’s on us, on our generation, not theirs.
Here’s my rationale.
We’ve Never Used as Much as Was Allocated
The framers of the Colorado River Compact of 1922 allocated 15 million acre-feet (MAF) per year for use within the US: 7.5 MAF each for the Upper and Lower Basins.** They anticipated that more water would eventually need to be allocated to Mexico. A 1944 treaty with Mexico set that country’s allocation at 1.5 MAF/year.
In sum, a total of 16.5 MAF/year has been allocated for human use.
Annual human uses of the river’s water have never come close to 16.5 MAF. According to estimates by the US Bureau of Reclamation, the average annual consumption for human uses since 2000 is about 12.6 MAF — far below what the Compact allows. The annual use would have likely been higher than 12.6 MAF if not for the Compact. In the early 2000s, California was beginning to use more than its 4.4 MAF portion of the 7.5 MAF/year allocated among the Lower Basin states of California, Arizona, and Nevada, but the federal government reeled it back in so that the total Lower Basin use would not exceed 7.5 MAF.
Yes, There Were Big Oversights
If the Compact is to be faulted, it should be for the things it didn’t say or anticipate. The framers of the Compact didn’t account for three critically important uses and needs for the river’s water today: (1) water rights legally held but not yet used by Native American tribes; (2) water needed to sustain natural ecosystem health; and (3) evaporation from the many reservoirs that would eventually be built.
Evaporative losses from the reservoirs, plus what is evaporated and transpired from the river and its associated riparian and wetland ecosystems, accounts for another 2.4 MAF/year, bringing the total volume of water consumed for human and natural purposes to about 15 MAF/year.
Still well below what was explicitly allocated in the Compact and the international treaty with Mexico.
I’ll return to the issue of Native American rights and ecosystem needs in a moment.
The Compact Held Up for Nearly 80 Years
Perhaps the greatest tribute to the durability of the Compact is the fact that cities and farmers were able to prosper for nearly 80 years after the Compact was put into place. Cities dependent on the river grew exponentially, and basin farmers were able to grow food for our country and other nations.
The reservoirs in the Colorado River Basin were nearly full in 2000. Virtually nobody was concerned about water shortages. In fact, the conversation at that time was centered on how to share surplus water!
Updated Colorado River 4-Panel plot thru Water Year 2022 showing reservoirs, flows, temperatures and precipitation. All trends are in the wrong direction. Since original 2017 plot, conditions have deteriorated significantly. Brad Udall via Twitter: https://twitter.com/bradudall/status/1593316262041436160
And Then the Climate Changed
During the 20th century, an average of 16.4 MAF/year of water flowed into and through the Colorado River each year, enough to fully serve all human uses and losses of water to evaporation.
Since 2000, that flow of water has decreased to 13.5 MAF/year, the combined result of a warming climate and lessened precipitation — now recognized as the driest 23 years in the past 1200 years. That has left a shortfall of 1.5 MAF/year, and we’ve been pillaging the water stored in big reservoirs such as Lake Mead and Lake Powell to make up the deficit.
The true reason we are experiencing a water shortage crisis in the Colorado River Basin is not because of flaws in the Compact. It is because we have been unable to reduce our use of water commensurate with the reality that the river no longer produces what it did in the last century. If we can’t own up to this truth we will not be able to build a water-secure future.
Making Things Right
It is high time to reckon with the river’s limits, and with the inherent rights of the indigenous inhabitants of the river basin. This is the time — at the 100th anniversary of the Colorado River Compact — to make things right.
The allocations of water made in the Compact and subsequent agreements are now clearly unattainable and should be revised. Given that reality, let’s take the opportunity to also address some shortcomings in the way the Compact was structured. Any reallocation of the river’s water should begin with an inalienable reserve of water for Native Americans — including both what they are already able to use, plus the other water to which they are legally entitled but not using presently. What is not presently being used by the tribes should be left in the river for use by its oldest inhabitants: ancient native creatures like the Colorado pikeminnow and the humpback chub that have been swimming in the river system for millions of years but now teeter at the brink of extinction.
Once the indigenous reserve is legitimately accounted for, the remainder of the 13.5 MAF/year flowing downriver should be shared equitably — in portions that will likely need to be renegotiated among the states and Mexico.
Only by adjusting human needs to what the river is able to give, and only by aligning those needs in a just, equitable, and sustainable manner with native peoples and ecosystems, will we be able to again realize the prosperity envisioned by the Compact’s architects.
Dories at rest on a glorious Grand Canyon eve. Photo by Brian Richter
** The Compact also allowed the lower basin states to use their own tributaries to the Colorado, but that additional 1 MAF doesn’t get included in the river’s annual budget tracking so I’ll ignore it here as well simply to match numbers with the Bureau of Reclamation. However, true and full water budget accounting for the river basin should include the water supply from the tributaries in the Lower Basin as well as the uses of that water.