What a long strange trip to kill four dams — Writers on the Range #KlamathRiver

Click the link to read the article on the Writers on the Range website (Rocky Barker):

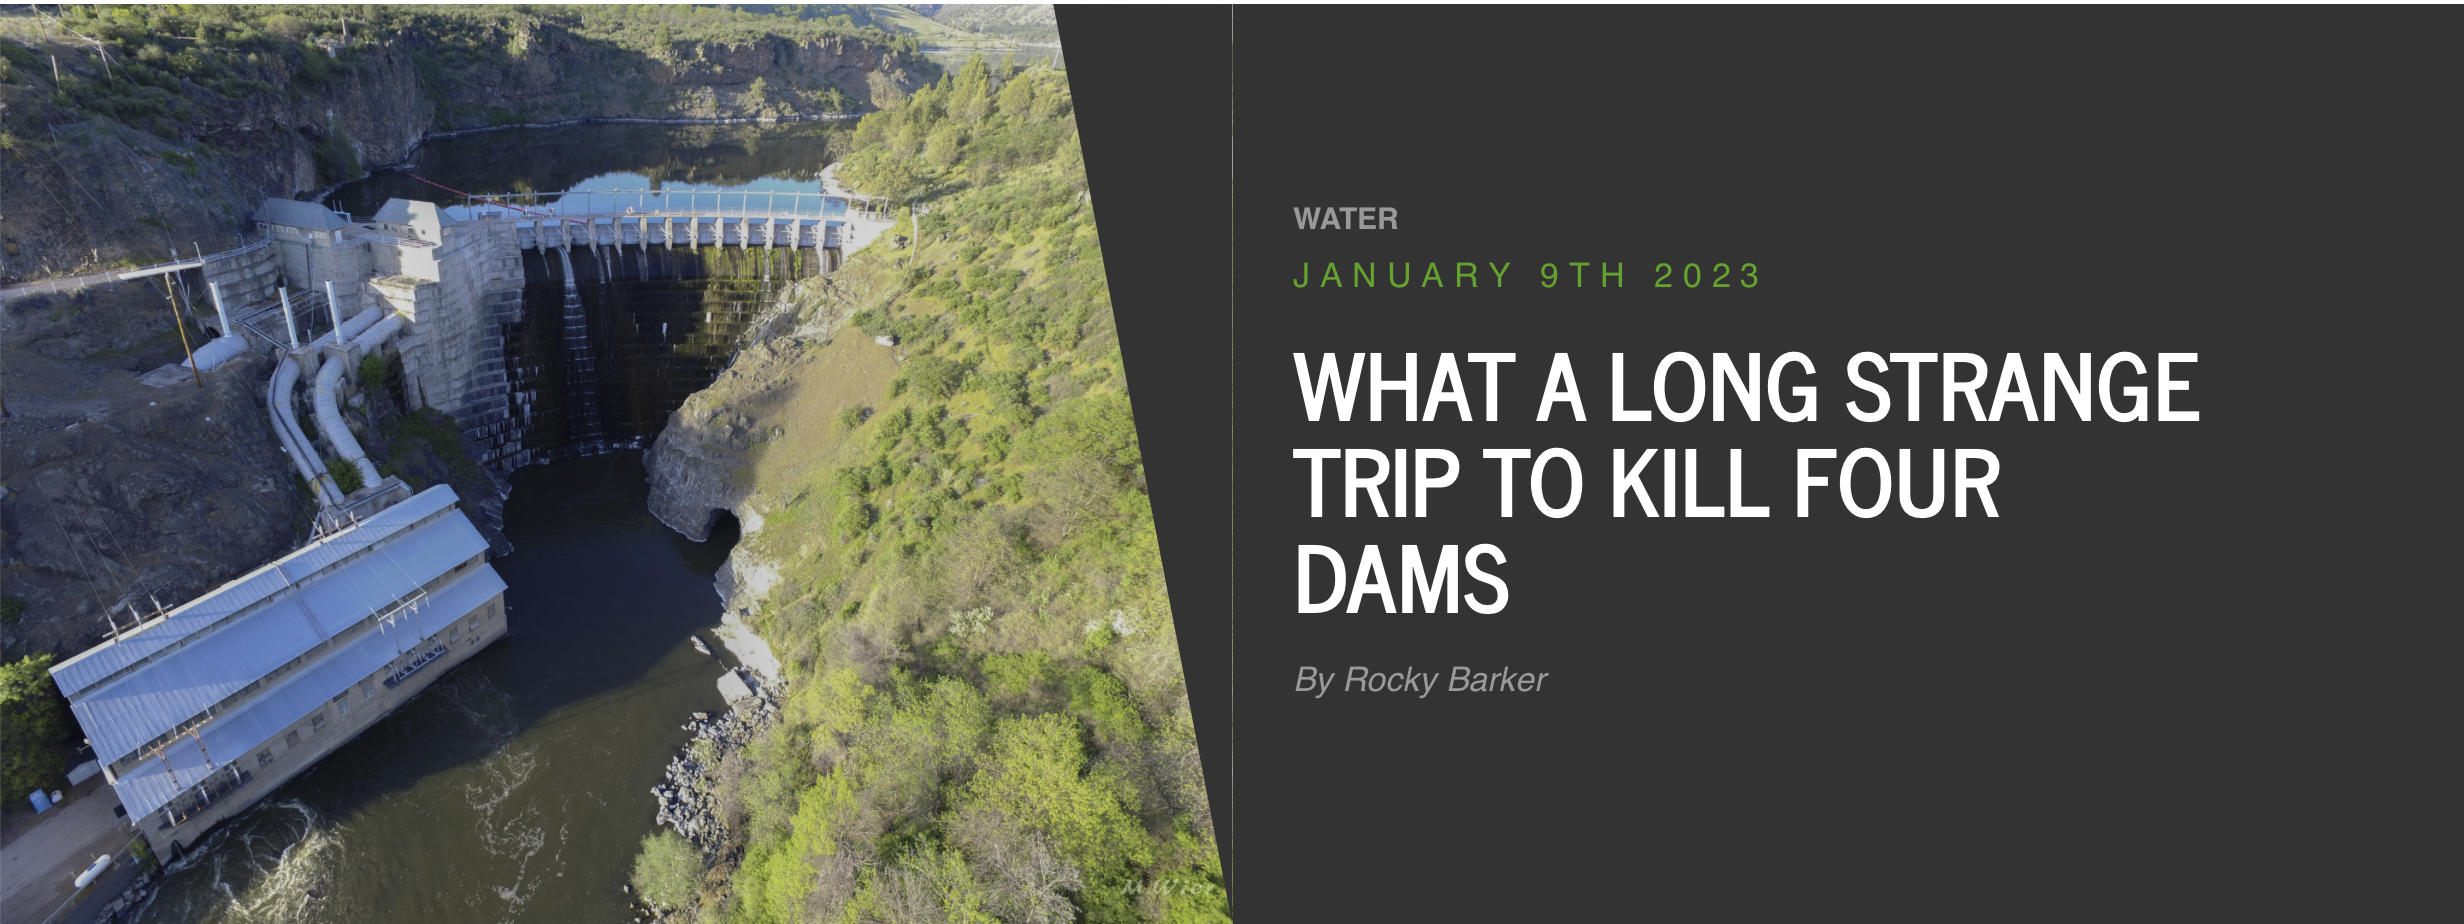
Finally, after a 50-year effort, four massive dams on the Klamath River in northern California and Oregon will start coming down this July.

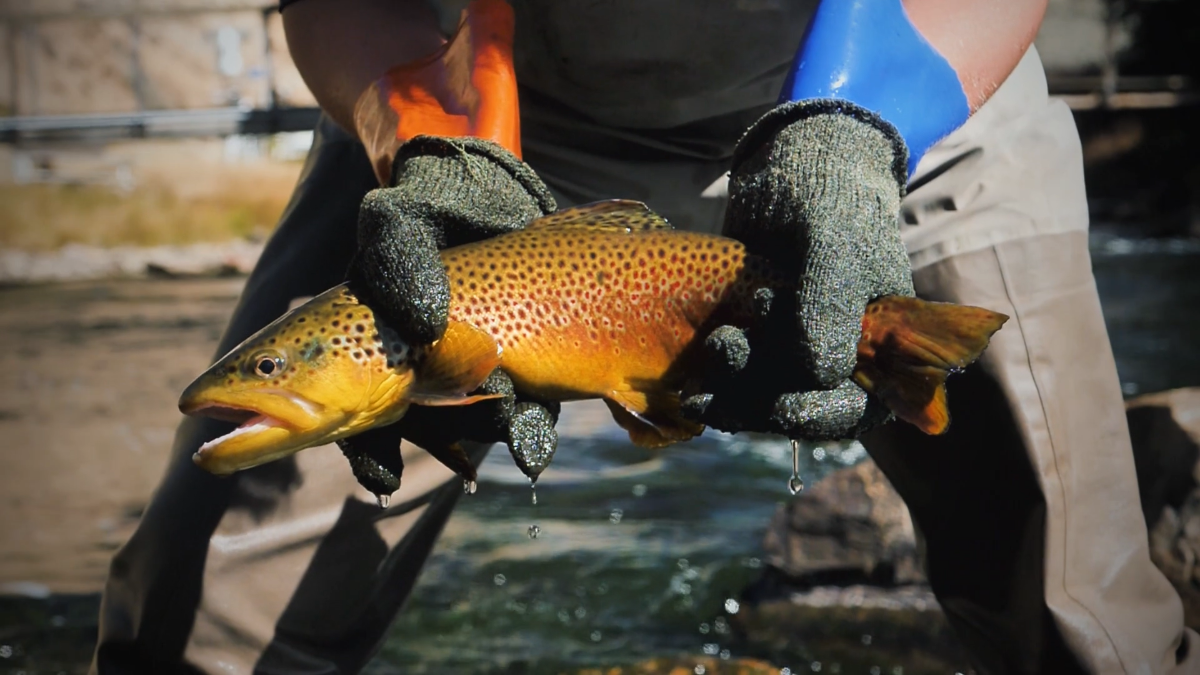
For the Yurok, Karuk, Hoopa, Shasta and Klamath tribes living along this river since time immemorial, there’s much to celebrate. They have long fought for the lives of the salmon that are harmed by these dams, and for their right to fish for them.

Even PacifiCorp, which marketed the electricity of the four hydroelectric-producing dams, will also have something to cheer about. PacifiCorp, which is owned by billionaire Warren Buffett, won’t have pricey fish ladders to install and its share of the cost of dam removal has been passed to ratepayers in both states.

Environmentalists are also hailing this latest victory for river-renewal, based on the Electric Consumers Protection Act of 1986. The law ordered operators of most federal dams to provide passages for fish so they could swim upstream to spawn.

For California and Oregon officials, along with farmers and others who had reached an agreement as far back in 2008, the dam removals signal that this long and emotional fight is finally over. And why has there been a settlement after all this time? A short answer is the growing reality of the West’s increasing aridity.

In 2001, yet another dry year in the upper Klamath, farmers woke up to find their headgates for irrigation water locked. It was done to preserve flows for endangered salmon, but for outraged farmers it meant their crops were ruined and they lost anywhere from $27 million to $47 million. Death threats followed, along with shootings and even a farmers’ cavalry charge.

The newly elected Bush administration reacted by making sure the farmers got their water, though this triggered one of the largest salmon die-offs in history. The Klamath Tribes were infuriated.

The Federal Energy Regulatory Commission started tackling the issue in 2007 by ordering PacifiCorp to install fish ladders on its four, fish-killing dams. After electric rates soared 1,000%, that left everybody mad and set the stage for a deal.

In a turnaround for the Bush administration, a pact was almost reached in 2008, when Interior Secretary Dirk Kempthorne, who had stubbornly opposed breaching dams, persuaded Oregon Democratic Gov. Ted Kulongoski and Republican California Gov. Arnold Schwarzenegger to reach an agreement.

The deal had something for everyone: The Klamath Tribes, with senior water rights, subordinated those rights for a large grant to purchase land. The federal government paid half the cost of removing the dams, and the state of California paid the other half.

Then a stumbling block intruded: Powerful Republicans opposed dam removal and the legislation that would have put the agreement into effect.

But negotiations continued, this time without the federal government picking up any of the costs. As 2022 ended, California Gov. Gavin Newsom joined Oregon Gov. Kate Brown, PacifiCorp, the Tribes and others to celebrate the Federal Energy Regulatory Commission’s approval of the dams coming down.

When they hold the big celebration this summer as the dams crumple, I hope people remember the courageous role of former Interior Secretary Kempthorne, who broke the impasse over the dams back in 2008.

When the very first American dam was destroyed, in 1999, I was in Augusta, Maine, to help celebrate. After the Edwards Dam was breached, the Kennebec River ran free for the first time since the novelist Nathaniel Hawthorne walked its banks 160 years before. On the south side of the river stood residents whose ancestors worked in the mills the dam had powered. Many were crying. It reminded me that change is never easy.

Elwha River. By Elwhajeff at English Wikipedia, CC BY-SA 3.0, https://commons.wikimedia.org/w/index.php?curid=9740555

And in 2012, I celebrated with others when the first of two dams on western Washington’s Elwha River was breached. In both places, and as is true for most of the 1,200 dams that have been removed since then, rivers have quickly returned to life.

I look forward to seeing that same amazing burst of renewal after the four lower Snake River dams finally come down.

Rocky Barker is a contributor to Writers on the Range, writersontherange.org, an independent nonprofit dedicated to spurring lively conversation about the West. He is a longtime reporter about the Northwest.

Klamath River Basin. Map credit: American Rivers

#Colorado nonprofit among winners of #ColoradoRiver scarcity challenge — @WaterEdCO #COriver #aridification

Water users are urgently trying to keep Lake Powell on the Utah-Arizona border from dropping to a point where Glen Canyon Dam can no longer generate electricity. (Source: Bureau of Reclamation)

Click the link to read the article on the Water Education Colorado website (Jerd Smith):

A Colorado nonprofit is one of three winners of the national Colorado River Basin Water Scarcity Challenge, a philanthropic initiative to spur creative solutions to water shortages in the crisis-ridden, seven-state Colorado River system.

The Denver-based Colorado Water Trust will spend the next year working with Quantified Ventures developing new models for securing funds and identifying valuable water rights that can be used to help restore riparian areas, aid streams and maintain agricultural water uses.

Founded in 2002, the Colorado Water Trust partners with existing entities, such as the Colorado Water Conservation Board, as well as environmental and farm groups, to acquire or lease water rights, keeping that water in the streams to stretch the amount of water available for fish and the environment, irrigators and industry even during dry times.

Quantified Ventures is a finance and consulting company that specializes in developing sustainable solutions to environmental problems.

Across the American West, water users, government agencies, regulators and environmental groups are scrambling to find ways to save the river. Crippled by a megadrought thought to be the worst in 1,200 years, and shifts in climate that are reducing the mountain snows on which it relies, the river system is on the brink of collapse.

The Colorado River Basin Scarcity Challenge is funded by a $500,000 donation from the  Gates Family Foundation and the Walton Family Foundation, according to Quantified Ventures spokesman Matt Lindsay. [Editor’s note: Fresh Water News is an initiative of Water Education Colorado which receives support from the Gates and Walton foundations.] Winners were announced Jan. 12.

“The Colorado River is facing an unprecedented crisis that requires innovative thinking and investment at an equally historic scale,” said Morgan Snyder, in a prepared statement. Snyder is senior program officer for the Walton Family Foundation Environment Program. “Projects like these that move past outdated systems and instead find new ways to conserve, adapt, and become more resilient are essential to ensure a sustainable water supply for the millions who depend on the river.”

Kate Ryan, a senior attorney at the Colorado Water Trust, said winning the scarcity challenge will help her organization develop new relationships in the finance world and find ways to move more quickly in an arena in which deals can take years to finalize, allowing the water trust to accomplish more.

“This will allow us to become more nimble and potentially to meet new investors,” Ryan said. “We will also be looking at strategies for using water for additional sources of revenue, such as remarketing it downstream in a way that is complementary to our project partners. It will also help us recoup investment and turn that into operating revenue, or for funding new acquisitions or leases of water.”

The Tucson, Arizona-based Watershed Management Group is another winner. The Watershed Management Group will work with Quantified Ventures to develop new “green” infrastructure to improve the health of Tucson’s groundwater system, among other projects, with the goal of using less Colorado River water, according to Watershed Management Group’s Catlow Shipek.

“Our goal is to build hydro local resilience to reduce our dependence on Colorado River supplies,” Shipek said. “The idea is how do we restore our watershed but not at the expense of another watershed.”

The third winner, Ndrip, will use Quantified Ventures to evaluate how to increase the scale of its drip irrigation systems on tribal lands throughout the Colorado River Basin. Unlike other drip irrigation systems, Ndrip uses existing water distribution systems on farms and is gravity-based. These features help offset the high capital costs of more traditional drip irrigation systems, according to Ndrip’s website.

Ndrip, which has offices in Australia, Israel, South Africa and the U.S., could not be reached for comment.

Each of the scarcity challenge winners will spend roughly the next year with Quantified Ventures developing new solutions that will help improve the sustainability of the Colorado River system.

Jerd Smith is editor of Fresh Water News. She can be reached at 720-398-6474, via email at jerd@wateredco.org or @jerd_smith.

On July 7, 2020, we closed our headgate that takes water from the Little Cimarron for irrigation. The water in the above photo will now bypass our headgate and return to the river. Photo via the Colorado Water Trust.

Changes are emerging across the #climate system. Everywhere we look, the climate is changing rapidly — @Ed_Hawkins #ActOnClimate #KeepItInTheGround

Rate of recent changes is unprecedented in at least 2000 years for many climate metrics. These changes are not natural; they are primarily caused by the burning of fossil fuels.

Scientists studying #water supply focus on weeks following peak #snowpack: April forecasts may no longer be reliable benchmark — @AspenJournalism

Volunteers learn how to measure how much water is contained in the snowpack, known as snow-water equivalent (SWE) at the SNOTEL site at the top of McClure Pass in March 2018. Water managers are gaining a better understanding that what happens in the weeks after peak snowpack in the spring can have an outsize influence on the year’s water supply. CREDIT: HEATHER SACKETT/ASPEN JOURNALISM

Click the link to read the article on the Aspen Journalism website (Heather Sackett):

Water managers in the Colorado River basin are gaining a better understanding that what happens in the weeks after peak snowpack — not just how much snow accumulated over the winter — can have an outsize influence on the year’s water supply.

Water year 2021 was historically bad, with an upper basin snowpack that peaked around 90% of average but translated to only 36% of average runoff into Lake Powell, according to the U.S. Bureau of Reclamation. It was the second-worst runoff on record after 2002. One of the culprits was exceptionally thirsty soils from 2020’s hot and dry summer and fall, which soaked up snowmelt before runoff made it to streams. But those dry soils are only part of the story.

A new paper from the Desert Research Institute, a nonprofit science arm of the Nevada university system, found that heat waves in April 2021 drove record snowmelt rates at about 25% of snow-telemetry (SNOTEL) sites looked at across the West. SNOTEL is a network of remote sensing stations throughout the West’s mountainous watersheds that collect weather and snowpack information.

A heat wave that was concentrated over the Rocky Mountains on April 1-7 contributed to record snowmelt at 74 stations, including areas that feed the Colorado River.

A few different agencies release monthly water-supply forecasts for April through July, including the National Resource Conservation Service, the Bureau of Reclamation and the Colorado Basin River Forecast Center. The April forecast is the first prediction of how streamflows will shape up for the year.

But according to the paper, in 2021, “rates of snowmelt throughout April were alarming and quickly worsened summer runoff outlooks which underscores that 1 April may no longer be a reliable benchmark for western water supply.”

The paper did not quantify what exactly the record melt speed meant for water supply, but paper author and associate research professor of climatology Dan McEvoy said it definitely contributed to the poor inflow into the nation’s second-largest reservoir in 2021. It also shows there are many more factors relevant to predicting the water supply than just how much water is in the snowpack, a metric known as snow-water equivalent (SWE), which is measured by SNOTEL sites.

“There was a combination of things that was contributing to this really low runoff in places like the Colorado River basin,” McEvoy said.

Some of these other factors include very little April precipitation and warm nighttime temperatures, which didn’t allow the snowpack to get into the daily freeze-thaw cycle that’s common in the spring. Persistent high pressure kept skies clear and sunny, which meant that more of the snowpack sublimated, evaporating instead of turning into liquid.

“When it’s sunnier and warmer, you can lose some of that water directly to the atmosphere,” McEvoy said. “It doesn’t even get to melt and go into the runoff.”

These rapid melting events could also help set up prime conditions for wildfires, he said, something he wants to continue studying.

“When you have the snow disappear earlier there’s more time with the ground exposed, which contributes to drying out the vegetation in the spring and summer and an earlier onset to wildfire season,” McEvoy said.

After peak snowpack

Climatologists at Colorado State University are working on a similar study that looks at how factors such as precipitation after peak snowpack affect spring runoff. Their findings underscore how important the conditions of the six to eight weeks after peak snowpack are for predicting streamflows.

“One of the things we found that was crystal clear from the study was that one of the major sources of water-supply forecast error is what happens after peak snowpack,” said Peter Bennett Goble, a climatologist at CSU who is working on the study. “Just knowing how much uncertainty is still out there on April 1 or even April 15 probably allows water managers to be a little more cautious, maybe hold a little bit more back, especially if it looks like it’s going to be an early runoff.”

Predicting whether reservoirs will fill — and therefore how much water to release to make room for the inflow — can be tricky. Some municipal water providers use the Colorado Airborne Snow Measurement Program — with its lidar-equipped planes — to more accurately measure snowpack. For example, Denver Water has used CASM to see how much snow is in the headwaters of the Blue River basin, which feeds Dillon Reservoir, its largest storage bucket.

But aside from this technology, which is expensive and not yet available everywhere, water managers rely heavily on data from the SNOTEL sites to make streamflow forecasts. This method has limitations, providing just a snapshot of conditions at one location.

These limitations can be seen in recent years’ forecasts for Ruedi Reservoir, on the Fryingpan River. Initial forecasts in April 2021 projected Ruedi could probably fill to its entire 102,373-acre-foot capacity, but the reservoir ended up only about 80% full that year. In 2020, each of the three main forecasting agencies also overpredicted Ruedi inflow for the months of April, May and June. (An acre-foot covers 1 acre to a depth of 1 foot.)

Tim Miller, a hydrologist with the U.S. Bureau of Reclamation who manages operations at Ruedi, said his models predicted a 2021 Ruedi inflow of 111,000 acre-feet, but only 77,000 acre-feet actually flowed in. That the models are based on historical SNOTEL data from past decades is a drawback as climate change progresses, but it’s the best we have, Miller said.

“It makes the assumption that what we have seen in the past is what we will see in the future, which is a really poor assumption when you’re in the middle of a change in the climate,” Miller said. “We will probably see events like we haven’t seen in the future and we are using what we’ve seen to predict them.”

Dave Kanzer, director of science and interstate matters for the Glenwood Springs-based Colorado River Water Conservation District, said people often look for a single explanation when streamflows don’t match predictions. The River District owns and operates Wolford Mountain Reservoir, near Kremmling, and stores water in Ruedi Reservoir. But there is often a whole host of compounding factors that water managers will have to begin weighing more heavily as the climate warms.

“It’s not just about soil moisture, it’s not just about solar radiation, it’s not just about temperatures, it’s not just about the winds — it’s everything,” Kanzer said. “In some cases, like 2021, you get what some people like to call the perfect storm.”

Aspen Journalism covers water and rivers in collaboration with The Aspen Times.

Recent precipitation and a persistent active weather pattern have led to conditions that are the wettest (or among the wettest) on record — @nwscbrfc #ColoradoRiver #COriver #aridification #snowpack (January 20, 2023)

If conditions hold through winter, we can expect above-average streamflow forecasts throughout the Colorado River Basin.

Want to solve #ClimateChange? This #California farm kingdom holds a key — The Los Angeles Times #ColoradoRiver #COriver #aridification

Southern California’s Imperial Valley. Ted Wood/The Water Desk

Click the link to read the article on The Los Angeles Times website (Sammy Roth). Here’s an excerpt:

…welcome to the Imperial Valley. Wedged in California’s southeastern corner, it’s one of the most important places you’ve probably never been. To one side of [Ralph] Strahm’s farm is the Sonoran Desert at its most stark, where creosote-studded washes give way to glimmering sand dunes and craggy mountain peaks. To the other side is an astonishingly productive agricultural empire. Nearly half a million acres of lush green fields sprawl into the distance, popping out lettuce, sugar beets, onions, cattle feed and more…

But keeping the vegetable aisle stocked comes at a cost. Imperial County farm barons use more Colorado River water than the rest of California combined. And as the planet heats up, there’s less and less water to go around…

Clean energy advocates see Imperial as an ideal place for solar farms and battery projects that can help solve the American West’s energy and water crises. The land is flat; the sunlight, abundant. The Colorado River desperately needs relief. And Imperial is one of California’s poorest counties, its agriculture-heavy economy practically crying out for diversification and higher-paying jobs But resistance to change runs deep, particularly among the few hundred families who own all the farmland. Agriculture is the only way of life many of them have known, and they’re raring to defend it. Their ancestors settled here a century ago, staking an early claim to the Colorado and carving canals to carry its riches through the desert. Again and again, they’ve faced pressure to sell water to coastal cities. They’re ready to pounce on anything that smells like a water grab. And to some of them, solar power smells like a water grab…

Lurking beneath these battles are urgent questions with no easy answers: What is the land’s best use? Who gets to decide? And how do we balance water conservation, food production and clean power generation in an era of climate emergency?

A solar farm off CO 17 in Alamosa County. The San Luis Valley produces 10 percent more power per solar panel than anywhere else in the state due to its base elevation of 7,500 feet and more days of sun than the Front Range and anywhere else in Colorado. Photo by Owen Woods via The Alamosa Citizen

#Snowpack levels in major Summit County river basin reach 121% above 30 year median (January 20, 2023) thanks to recent storm systems — The Summit Daily #BlueRiver #ColoradoRiver #COriver

Click the link to read the article on the Summit Daily website (Cody Jones). Here’s an excerpt:

According to the National Weather Service, the last winter storm front  — which hit Summit County from the evening of Tuesday, Jan. 17, to Wednesday afternoon —  brought anywhere from 3 to 7 inches of fresh snow, though local ski resorts reported higher totals at their high-elevation snow stakes…The new snow helped to further push the Blue River Basin’s snowpack in the right direction to aid summer runoff and water levels…According to data from the National Resources Conservation Service, the Blue River Basin’s snowpack and snow water equivalent is currently reading at 9.6 inches as of Thursday, Jan. 19. This week’s snowfall boosted the snowpack from 9.4 inches on Wednesday and 8.9 inches from the beginning of the week on Sunday, Jan. 15…Currently the snowpack in the Blue River Basin is at 121% of the 30-year median and 58% of the median peak.

West snowpack basin-filled map January 19, 2023 via the NRCS.

Biden-Harris Administration Launches New Efforts to Address the Wildfire Crisis — USDA

The Hayman Fire is the state’s largest recorded wildfire. Smoke from the massive blaze could be seen and smelled across the state. Photo credit to Nathan Bobbin, Flickr Creative Commons.

Click the link to read the article on the USDA website:

Today, Agriculture Secretary Tom Vilsack announced expanded efforts to reduce wildfire risk across the western U.S. These investments, made possible through President Biden’s landmark Bipartisan Infrastructure Law (BIL) and the Inflation Reduction Act (IRA), will directly protect at-risk communities and critical infrastructure across 11 additional landscapes in Arizona, California, Idaho, Nevada, Oregon, Utah and Washington.

“It is no longer a matter of if a wildfire will threaten many western communities in these landscapes, it is a matter of when,” said Secretary Vilsack. “The need to invest more and to move quickly is apparent. This is a crisis and President Biden is treating it as one. Today’s announcement will bring more than $490 million to 11 key landscapes across the western United States, and will be used to restore our national forests, including the restoration of resilient old-growth forest conditions.”

The Forest Service announced their original 10 landscape project areas last year as part of the agency’s broader strategy to protect communities, critical infrastructure and forest resources from catastrophic wildfire. Combined with these initial landscape investments, the additional efforts being announced today represent a total USDA investment of $930 million across 45 million acres.

This work spans 134 of the 250 high-risk “firesheds” identified in the Wildfire Crisis Strategy and will mitigate wildfire risk to around 200 communities in the western U.S. Firesheds are areas where wildfire is likely to pose the greatest risk to communities and resources.

The landscapes for these additional investments were selected based on the potential for wildfire to affect nearby communities and buildings, with a focus on protecting underserved communities, critical infrastructure, public water sources and Tribal lands. USDA also considered more than 3,000 comments from 11 roundtable meetings held in the first half of 2022, which included partners, industry, Tribes and other stakeholders.

“We are building on the investments announced last year and by expanding the Forest Service effort to cover 21 landscapes where communities, critical infrastructure and our natural resources are most in need of protection from the growing threat of wildfires,” said USDA Undersecretary for Natural Resources and the Environment (NRE), Dr. Homer Wilkes. “This is part of our agency wide focus to reduce wildfire risk across the country. We will use every tool we have to address this crisis and make your communities safer.”

Secretary Vilsack is also directing the Forest Service to use and prioritize a suite of provisions authorized in the Bipartisan Infrastructure Law to more quickly apply targeted treatments to the high-risk firesheds identified in the Wildfire Crisis Strategy, while opening up additional opportunities to pursue science-based reforestation, restoration of old growth forests and recovery of other areas impacted by wildfire.

These treatments are required to be ecologically appropriate, maximize the retention of large trees, protect old growth, and to consider possible effects on historically underserved communities and Tribes. Treatments are also to be carried out collaboratively alongside participating communities and partners.

“Doing this work in the right place, at the right time, and at the right scale, combined with the use of emergency authorities, will accelerate our planning, consultation, contracting, hiring and project work to reduce wildfire risk and improve forest health and resilience,” said Forest Service Chief Randy Moore. “Collaboration with Tribes, communities and partners will remain a priority, and we will continue to use the best available science when carrying out this important work.”

Background: The Forest Service Wildfire Crisis Strategy

This announcement comes on the anniversary of the launch of the Forest Service’s Wildfire Crisis Strategy, which debuted Jan. 18, 2022. A few months later, the agency introduced the initial 10 fire-prone landscapes that are now funded for the next five years through Bipartisan Infrastructure Law funds. In addition, President Biden’s Inflation Reduction Act will commit $1.8 billion to hazardous fuels reduction projects on national forests and grasslands.

Since releasing its Wildfire Crisis Strategy one year ago, the Forest Service and its partners have used the best available science and data to identify the highest risk landscapes for treatment projects. The Forest Service found that around 80% of the wildfire risk to communities is concentrated in less than 10% of firesheds. These targeted investments focus on firesheds of the highest risk, where projects are ready to begin or to expand.

The 10-year strategy calls for treating up to 20 million acres on national forests and grasslands and up to 30 million acres on other federal, state, Tribal, private and family lands to assure our forests are more resilient to wildfire and other effects of climate change, safer for communities, and remain key refuges for plants, fish and wildlife.

Over the past 20 years, many states have had record catastrophic wildfires, devastating communities, lives and livelihoods, and causing billions of dollars in damage. More than 10 million acres – more than twice the size of New Jersey – burned each year across the U.S. in 2020, 2017 and 2015.

The Wildfire Crisis Strategy builds on current work by leveraging congressional authorities and partnerships to support the department’s work to mitigate wildfire risk, and restores forest health over the next decade. In addition to State Forest Action Plans, the strategy also aligns with the Collaborative Forest Landscape Restoration ProgramTribal Forest Protection ActGood Neighbor AuthorityJoint Chiefs’ Landscape Restoration Partnership and Shared Stewardship agreements.

In June 2022, USDA released the Secretary’s Memorandum on Climate Resilience and Carbon Stewardship of America’s National Forests and Grasslands. The Secretary’s memo builds on previous actions on climate change, equity, and forest resilience, and provides more specific and time-bound actions to integrate into agency programs. The Forest Service used the guidance in the Secretary’s memo to better inform the selection criteria for projects under the Wildfire Crisis Strategy, including equity, source water protection, community infrastructure and wildlife corridors. Recognizing that insects, disease, and wildfire are among the most significant threats to mature and old growth forests, in alignment with the Biden-Harris Administration, the Forest Service will be targeting hazardous fuels reduction projects to address these threats to promote the protection and restoration of mature or old-growth forests.

USDA touches the lives of all Americans each day in so many positive ways. Under the Biden-Harris Administration, USDA is transforming America’s food system with a greater focus on more resilient local and regional food production, promoting competition and fairer markets for all producers, ensuring access to safe, healthy and nutritious food in all communities, building new markets and streams of income for farmers and producers using climate-smart food and forestry practices, making historic investments in infrastructure and clean energy capabilities in rural America, and committing to equity across the Department by removing systemic barriers and building a workforce more representative of America. To learn more, visit www.usda.gov.

The Spring Predictability Barrier: we’d rather be on Spring Break — NOAA

Click the link to read the article on the NOAA website (Michelle L’Heureux):

It’s that time of year again when ENSO forecasters stare at the latest analysis and model forecasts and shake their heads in frustration. Why?  We’re in the heart of the so-called “Spring Predictability Barrier,” which is when the models have a harder time making accurate forecasts. It’s like trying to predict the next episode of Mad Men based on the tiny amount of detail given in the “as seen on the next episode” clips. As we know from Tom’s posts on verification (hereherehere), there are many ways to measure the accuracy, or skill, of seasonal climate predictions. Here, we will focus on just one measure (1), but there are other ways to gauge the spring barrier.

What is the Spring Barrier?

Is the Spring Barrier like a brick wall? In other words, do we smack right into it and cannot see or predict anything beyond it? No, not really. It is more like a lull or a valley in ENSO forecasting accuracy. After the spring (or the autumn for our friends in the Southern Hemisphere), the ability of the models to predict becomes increasingly better. Keep in mind that, in general, the skill of the models get better the closer you get to the period of time you are predicting. If you want to know whether it is going to rain, you are usually better off using a prediction the day before than you are a week out. The same is true in seasonal climate outlooks. However, during the spring, even making an ENSO forecast for the coming summer is pretty difficult.

April 2015 is almost over, and so how useful have the model forecasts been if we want to predict ENSO for the May-June-July (MJJ) season (2)? As you will see, the Spring Barrier is the climate forecaster’s equivalent of mayhem. In a perfectly predictable world, we would be able to predict 100% of ENSO variability.  But statistical models (3) barely register a pulse, describing almost none of the fluctuations in ENSO during the MJJ season. State-of-the-art dynamical model (4) don’t fare much better, only accurately predicting about less than a third (33%) of ENSO variability in the MJJ season. So, even for the closest period coming up, ENSO forecasters can’t say a lot about it!

The skill (or forecasting ability) of model runs based on February, March, and April observations to predict the May-July (MJJ) average value in the Niño-3.4 SST region (ENSO). Results shown here are an average correlation coefficient from each of the 20 models between 2002-2011 (data used from Barnston et al, 2012). Percent Explained Variance (%) is calculated by squaring the correlation coefficient and multiplying by 100 (see footnote #1). Models that explain all ENSO variability would equal 100%, while explaining none of the ENSO variance would equal 0%. Graphic by Fiona Martin based on data from NOAA CPC and IRI.

Now let’s shift our attention to making an ENSO prediction for the coming winter season (for the November-January seasonal average). How useful are the models? Well, if you’re running a model using October data as input, then you’re in pretty good shape as you can expect close to 90% of the winter ENSO fluctuations to be predicted. In terms of lead time, that’s the same horizon as a forecast made in April for May-June-July (MJJ), and yet there is a huge difference in forecasting ability (5).

The skill (or forecasting ability) of model runs based on February-October observations to predict the November-January (NDJ) average value in the Niño-3.4 SST region (ENSO). Results shown here are an average correlation coefficient from each of the 20 models between 2002-2011 (data used from Barnston et al, 2012). Percent Explained Variance (%) is calculated by squaring the correlation coefficient and multiplying by 100 (see footnote #1). Models that explain all ENSO variability would equal 100%, while explaining none of the ENSO variance would equal 0%. Graphic by Fiona Martin based on data from NOAA CPC and IRI.

However, hope slowly grows as we emerge from the spring. In particular, models run based on May data are getting close to explaining half of the coming winter variability, which isn’t shabby. 

But, still, predictions are still far from assured. Using July and August data, about three-quarters of the winter ENSO fluctuations are predicted by the models. So while forecast “surprises” are becoming less frequent, they still lurk around.

Overcoming the Spring Barrier?

So, why is the accuracy of the models so bleak during the spring? Is there reason to believe that more model development will improve upon the low skill we see during the spring? While there are many ideas on why the spring barrier exists, there are no definitive culprits (Webster and Yang, 1992, Webster, 1995, Torrence and Webster, 1998, McPhaden, 2003, Duan and Wei, 2013). 

One of the reasons that the spring barrier is said to exist is because spring is a transitional time of year for ENSO (in our parlance, signals are low and noise is high). The spring is when ENSO is shifting around— often El Niño/La Niña events are decaying after their winter peak, sometimes passing through Neutral, before sometimes leading to El Niño/La Niña later on in the year. It is harder to predict the start or end of an event than to predict an event that is already occurring. There is also weaker coupling between the ocean-atmosphere in the spring due to a reduction in the average, or climatological, SST gradients in the tropical Pacific Ocean. However, for various reasons, these factors don’t fully explain why we see lower skill (6).

Seasonal allergies… the real cause of the Spring predictability barrier. Illustration by Emily Greenhalgh, NOAA Climate.gov.

One “clue” for the barrier lies in the fact the dynamical models perform better compared to the statistical models during the spring (see figure above: the blue bars are larger than the green bars). In fact, just during the last decade, dynamical models have slightly edged statistical models in their overall ENSO forecast ability because of their improvement during the spring (Barnston et al., 2012). During the other seasons, running a statistical or dynamical model gives you about the same amount of ENSO forecast skill. 

What is special about dynamical models during the spring? One of the attributes of dynamical models is that they are run more frequently using the most recent observed data as input. Many statistical models are built on monthly or seasonal (3-month) average data, so by comparison, are receiving inputs that are relatively older.  Dynamical models also ingest a lot more observations (such as the subsurface ocean) using complex data assimilation schemes. These qualities may allow dynamical models to “see” better and potentially lock onto potentially important changes that occur during the spring. But keep in mind this increased skill is relative to the statistical models– the dynamical model skill is still low overall.    

As Eric Guilyardi wrote in his blog post last week, there is room to improve models by better understanding their errors and improving the assimilation of observational data. Potentially, with more research and development, we will see the models become more skillful during the spring. Until then, ENSO forecasters would rather be on spring break.

Footnotes:

(1) As a first step, we calculate the “correlation coefficient” or the Pearson’s correlation coefficient. We also introduced this concept in Tony’s blog post discussing the ENSO skill over the past couple of years. The correlation coefficient ranges between 0 (no skill) and -1/+1 (perfect skill). However, in the figures above, we put it in terms of “explained variance,” by squaring the coefficient and multiplying by 100. Explained variance can range from 0% to 100%. 0% means that the models describe none of the variability of the ENSO index (the wiggles or ups and downs in the time series). 100% means that the models predict all of the fluctuations in the ENSO. So, ideally, want to see 100% variance explained even though that will never happen because our world is not perfectly predictable. 

(2) We use data gathered during a 10-year period of operational model runs, which are presented on the IRI/CPC plume of Niño-3.4 SST index predictions (Barnston et al., 2012). Un-gated copy is available here

(3) Statistical models: computer models that predict how current conditions are likely to change by applying statistics to historical conditions. Physical equations of the ocean and atmosphere are not used. These models can be run on a small desktop computer.

(4) Dynamical models: computer models that predict various oceanic, atmospheric, and land parameters by solving physical equations that use current “initial” conditions as input. State-of-the-art dynamical models must be run on high-performance supercomputers.

(5) Because of the limited length of the operational model runs, we expect that the 95% level of significance isn’t achieved until the explained variance is greater than ~45% (based on 9 degrees of freedom and using the sampling theory of correlations). Therefore, there is a fair chance that values not reaching that threshold may be randomly achieved and therefore are not particularly meaningful. 

(6) In the opinion of the author and some of her colleagues, there is a bit of a chicken-egg problem by arguing that lower skill of the models is due to the transitional nature of ENSO or the low signal-to-noise ratio in the spring. Low predictability and low signal-to-noise go hand-in-hand.  One does not cause the other. Also, the fact that the climatological SST gradient is at a minimum during the spring doesn’t clearly explain why ENSO — which is a departure from climatology (or anomaly) — would also be impacted (and the opposite should be true in the autumn when the SST gradient is maximized– yet ENSO peaks during the winter). 

References:

Anthony G. Barnston, Michael K. Tippett, Michelle L. L’Heureux, Shuhua Li, and David G. DeWitt, 2012: Skill of Real-Time Seasonal ENSO Model Predictions during 2002–11: Is Our Capability Increasing?. Bull. Amer. Meteor. Soc., 93, 631–651.

Duan, W. and Wei, C. (2013), The ‘spring predictability barrier’ for ENSO predictions and its possible mechanism: results from a fully coupled model. Int. J. Climatol., 33: 1280–1292. doi: 10.1002/joc.3513

McPhaden, M. J. (2003), Tropical Pacific Ocean heat content variations and ENSO persistence barriers, Geophys. Res. Lett., 30, 1480, doi:10.1029/2003GL016872, 9.

Torrence, C. and P. J. Webster, 1998: The Annual Cycle of Persistence in the El Niño-Southern Oscillation. Q. J. Roy. Met. Soc., 124, 1985-2004.

Webster, P. J. , 1995: The annual cycle and the predictability of the tropical coupled ocean-atmosphere system. Meteor. Atmos. Phys., 56, 33-55.

Webster, P. J. and S. Yang, 1992: Monsoon and ENSO: Selectively Interactive Systems. Quart. J. Roy. Meteor. Soc., 118, 877-926.

#GunnisonRiver, #TaylorRiver earn Gold Medal trout fishery status — #Colorado Parks & Wildlife

A rainbow trout is pictured during survey work of the Taylor River below Taylor Park Reservoir. (Jerry Neal/CPW photos taken from video)

Click the link to read the release on the Colorado Parks & Wildlife website (John Livingston):

Years of consideration and conservation work all led to a golden moment for two pristine rivers in central Colorado.

During its meeting Jan. 18 in Colorado Springs, the Colorado Parks and Wildlife Commission welcomed the Gunnison and Taylor Rivers as the newest Gold Medal trout fisheries in the state. CPW’s Gold Medal Program showcases the most elite fisheries throughout the state.

The stretches nominated and approved include 20 miles of the Taylor River below Taylor Park Reservoir and 12.5 miles of the Gunnison River starting west of the town of Gunnison at Twin Bridges extending up to the town of Almont.

“I’m pretty excited to be able to announce these two waters into our Gold Medal Program,” said CPW Assistant Aquatic Section Manager Josh Nehring. “It’s an achievement that came about by a lot of work by a lot of people over a number of decades. It’s amazing to see the quality of fisheries that we have here.”

Fisheries in Colorado may be designated by CPW as “Gold Medal” if they meet two qualifying criteria. The standard is 60 pounds of fish per acre along with at least 12 quality trout of 14 inches or greater per acre.

With the addition of the Gunnison and Taylor Rivers, Colorado now boasts 19 Gold Medal sections on 13 rivers that total roughly 362 miles. The state also has three lakes that have earned Gold Medal designation.

While the Gunnison and Taylor are newly-designated Gold Medal streams, CPW aquatic biologists believe the rivers have produced Gold Medal quality trout fishing since the 1990s. 

CPW Aquatic Biologist Dan Brauch said that while the rivers had met the biological criteria for designation for decades, it was important to ensure the streams provided long-lasting fish habitat for all life stages of trout.

“Significant work went into maintaining conditions on the Gunnison and Taylor Rivers to allow those fisheries to continue to persist,” Brauch said. “We have sampled the rivers quite a few times in the last 10 years, and we continued to see good numbers of quality-size trout and abundant trout.

“The Gunnison and Taylor Rivers really represent a successful conservation story with lots of partners that have made this fishery what it is today.”

CPW surveys streams regularly through the process of electrofishing. Fish are collected, weighed, measured and returned to the water. Data collected through these surveys provides invaluable data for CPW to assess the health of a fishery and to determine waters worthy of Gold Medal nomination.

“It does take quite a bit of work to get fisheries to this standpoint,” said Nehring, who grew up in neighboring Montrose and has enjoyed fishing the two rivers since he was a child. “Just the habitat that goes into it, the monitoring of the fisheries, making sure our regulations are appropriate and we aren’t getting too many fish harvested. There are a lot of things that go into making sure the system is healthy.”

Brauch and Nehring thanked a multitude of public and private partners that have come together throughout time to support the Gunnison and Taylor fisheries as work has been done to improve and protect trout habitat through the Gold Medal stretches.

While celebrating the conservation success story that has led to Gold Medal status for the rivers, CPW Area Wildlife Manager Brandon Diamond encouraged anglers to help protect these resources for generations to come.

“It’s extremely important right now for all water users and conservation-minded people, including anglers, to view these incredible resources through a stewardship lens,” Diamond said. “And I strongly encourage all of us to evaluate how we can contribute to the long-term conservation of these waters and how we fit in as stewards of the land and river resources.

“The Gold Medal designation is certainly something we are locally proud of. The Gunnison Valley has always been very supportive of wildlife conservation values, and we hope to continue that relationship moving forward.”