#Drought news October 3, 2024: #Wyoming and most of #Colorado saw temperatures average near or over 10 F above normal. As a result, dryness and drought in the region was unchanged or worsened

Click on a thumbnail graphic to view a gallery of drought data from the US Drought Monitor website.

Click the link to go to the US Drought Monitor website. Here’s an excerpt:

This Week’s Drought Summary

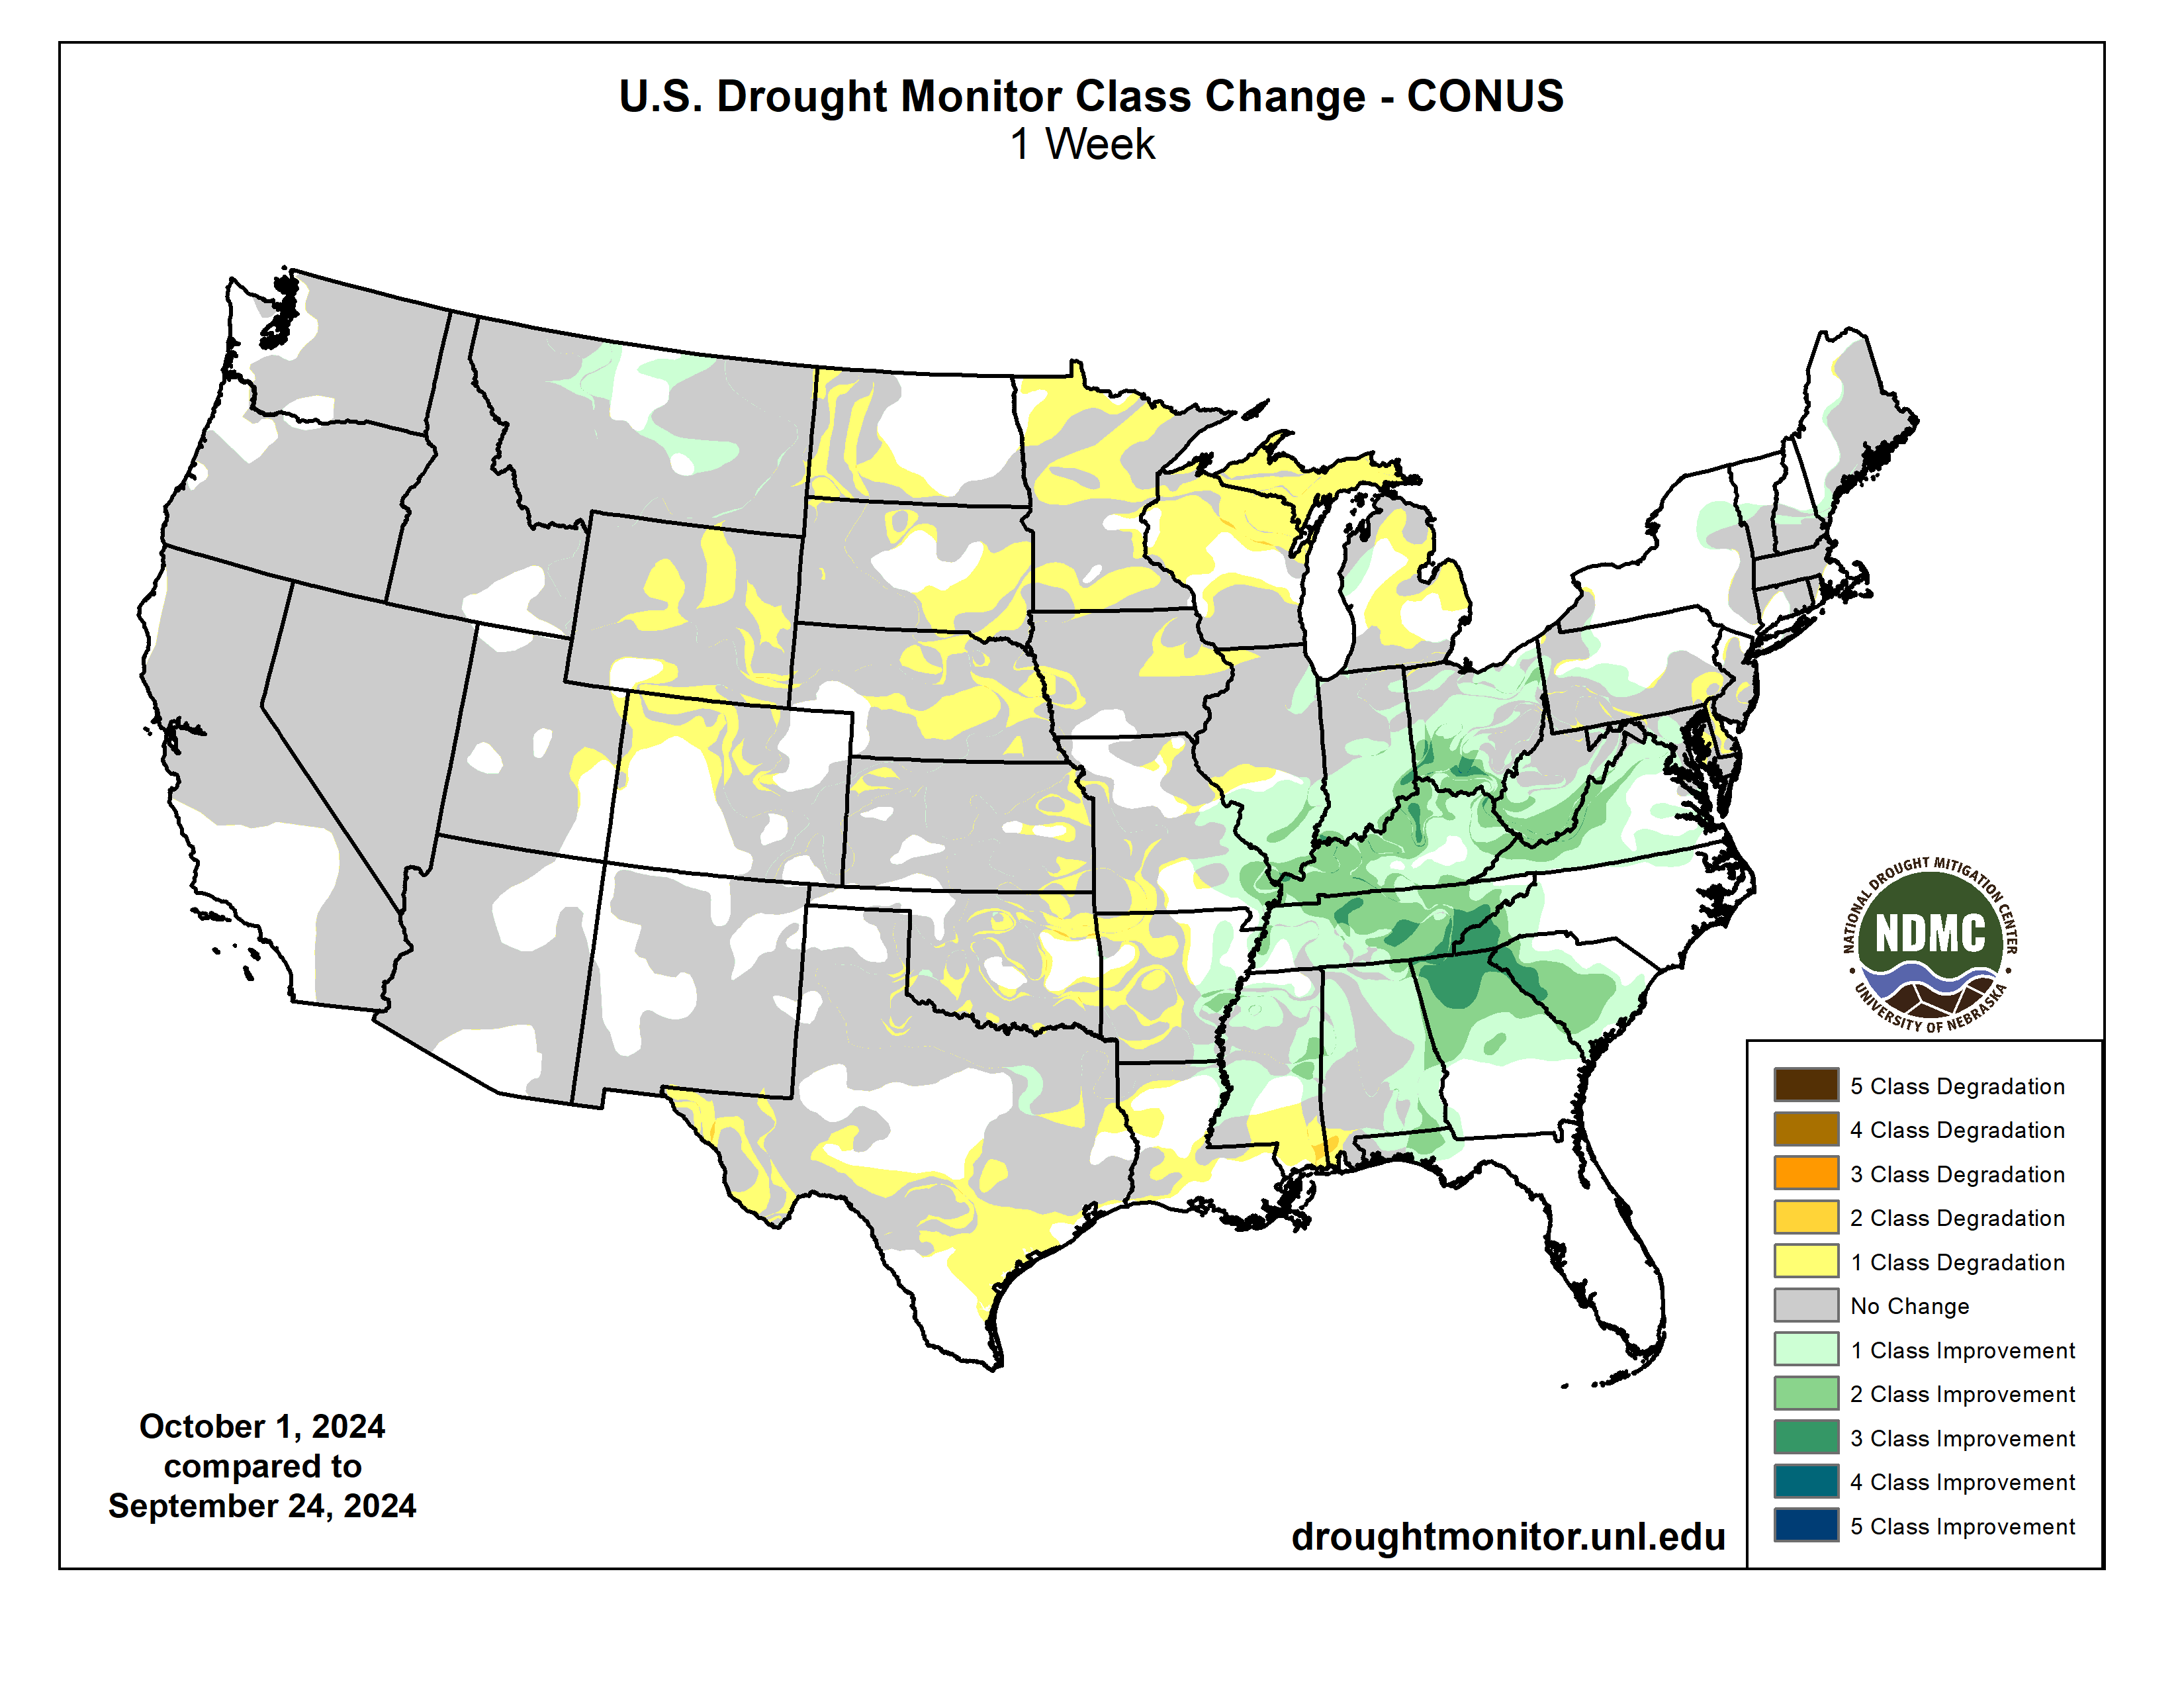
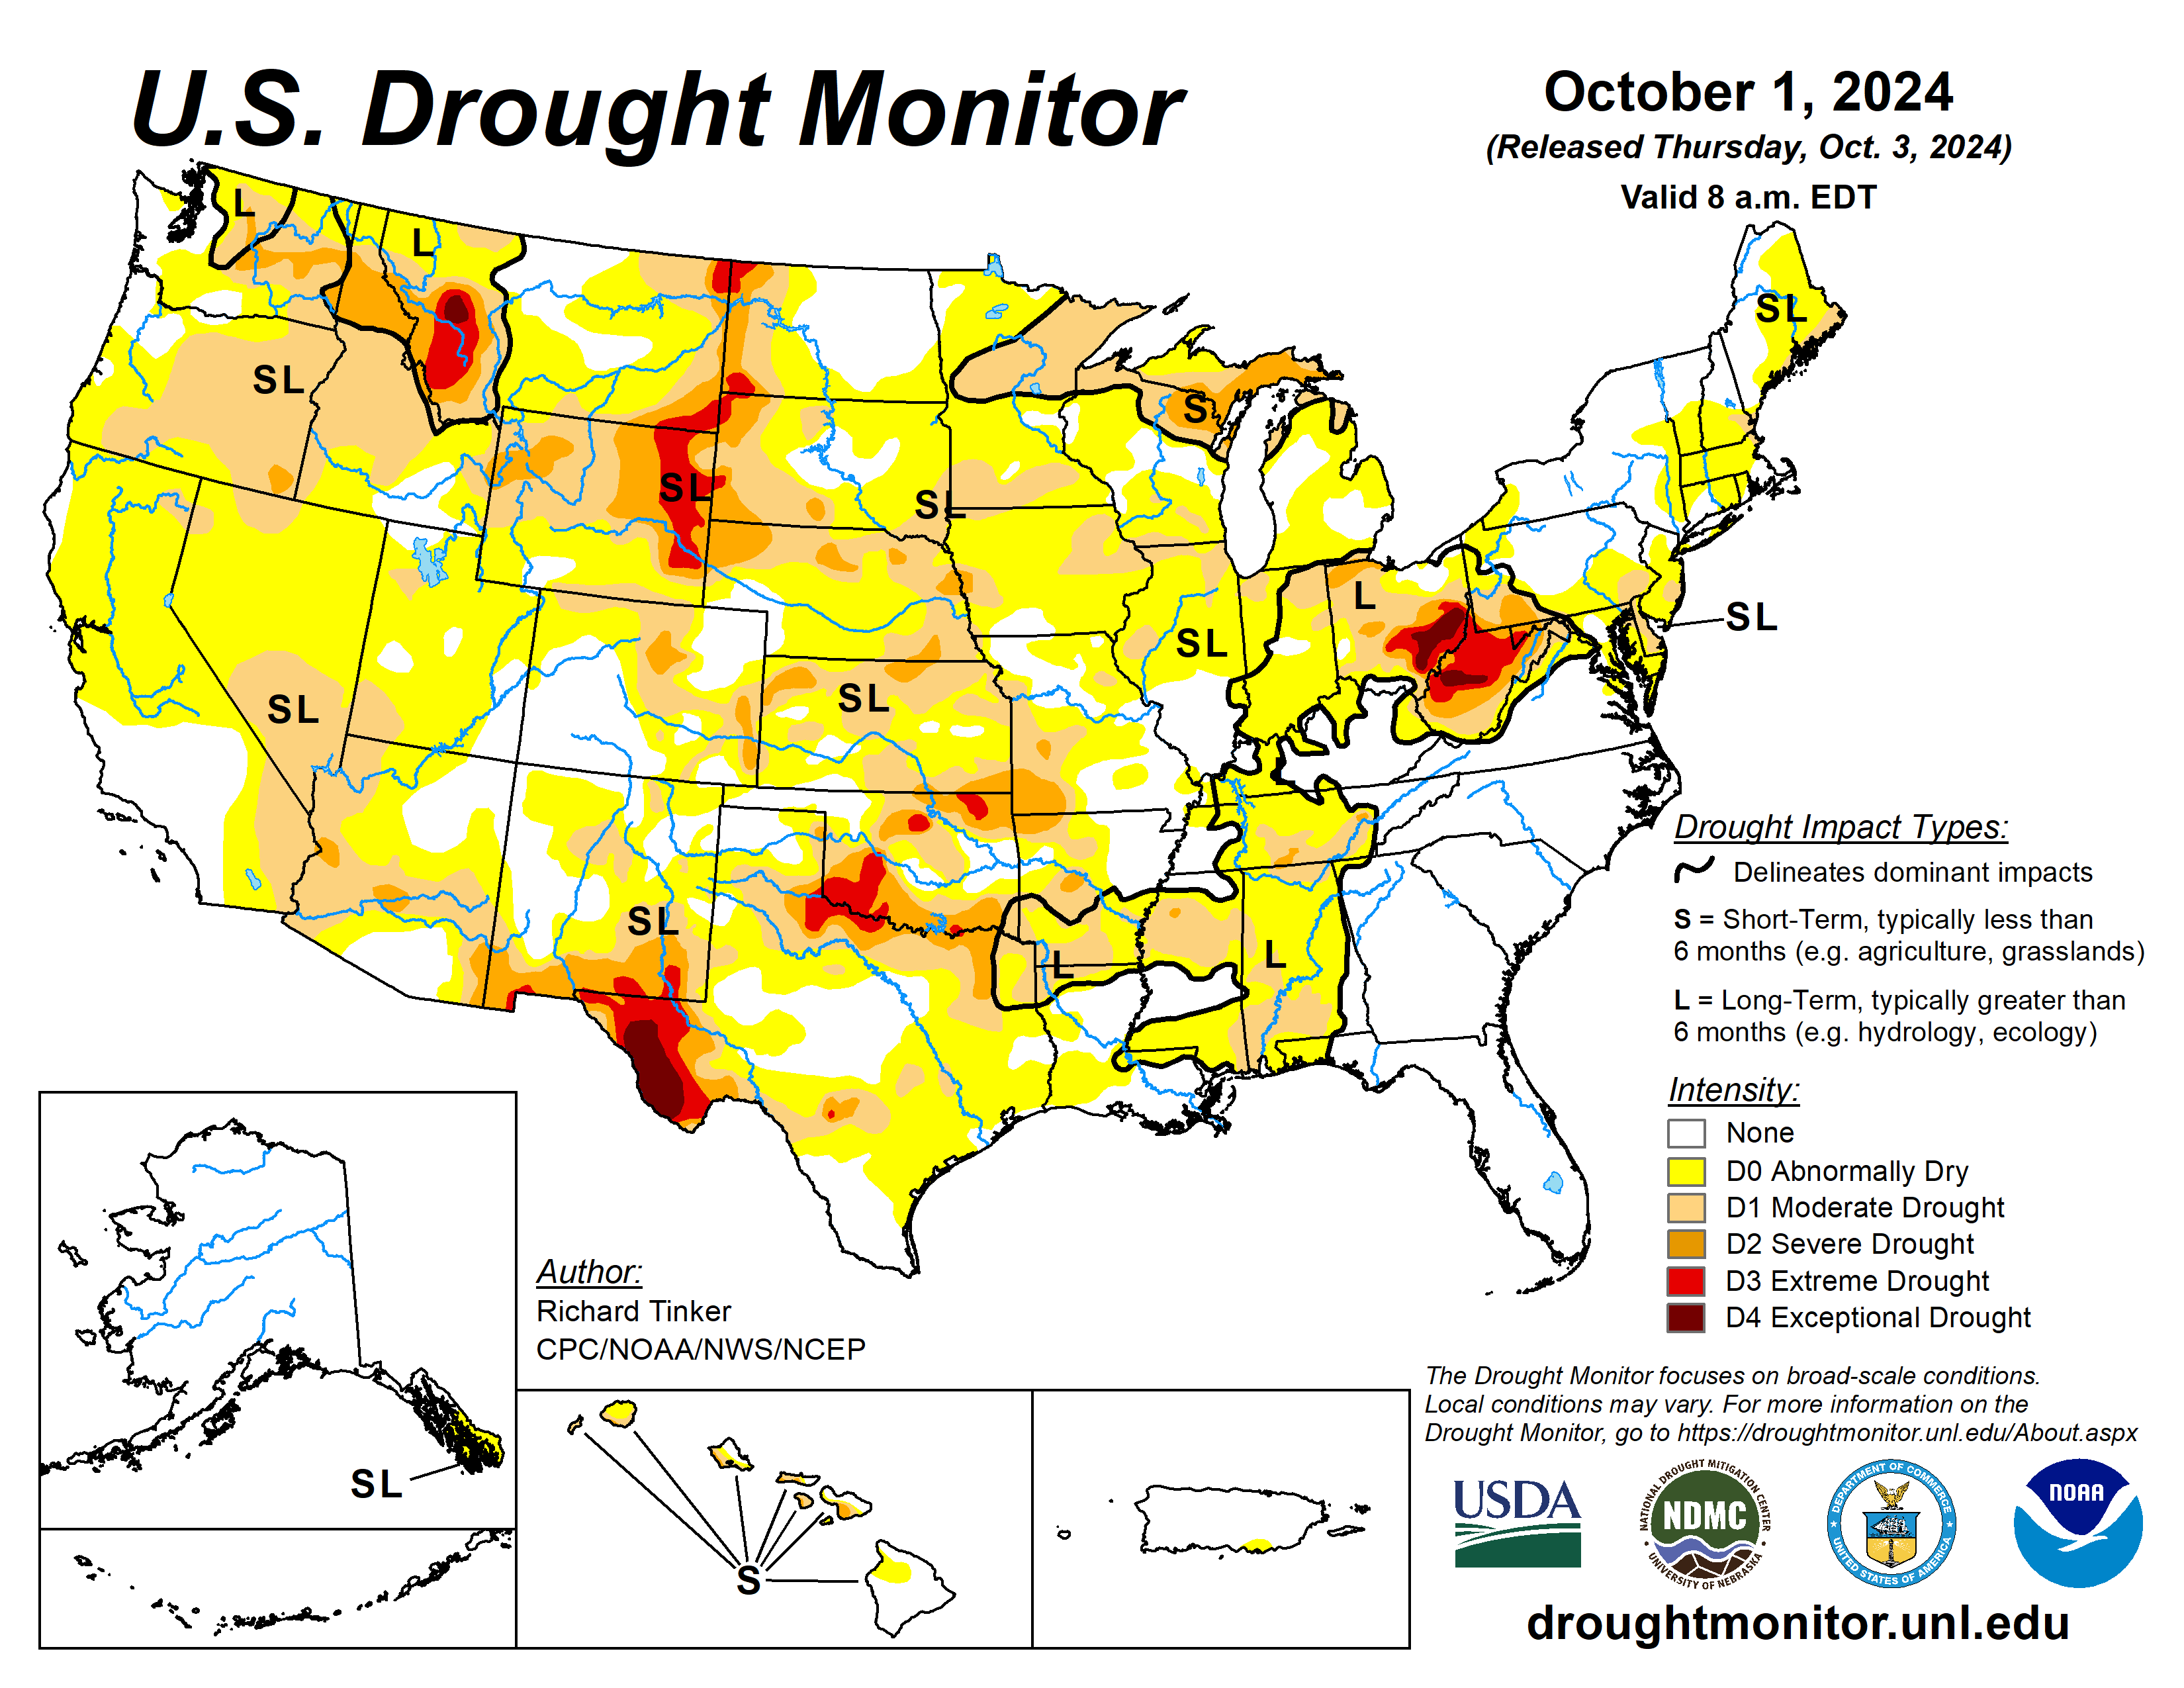
Hurricane Helene dropped heavy to excessive amounts of rain on a large area from the Ohio Valley, central Appalachians, and mid-Atlantic Piedmont southward to the eastern Gulf Coast region. The storm moved inland across the Florida Panhandle and northward into the South Atlantic States, then slowed down and drifted westward as it interacted with an upper-level low pressure system, becoming quasi-stationary as it slowly dissipated. The heaviest rains fell where precipitation was orographically enhanced on the east side of the Appalachians. Part of the central North Carolina mountains received 20 to almost 30 inches of rain, with totals topping 10 inches over the rest of the North Carolina mountains as well as the central Blue Ridge in Virginia, part of central and western South Carolina, some patches in central Georgia, and near the landfall site. More than 4 inches soaked a broad area from the middle and lower Ohio Valley southward through eastern Alabama and eastward through the central and southern Appalachians and Piedmont, including most of the Carolinas and Georgia. Widespread flooding resulted, with devastating floods impacting the wetter areas, along with prolonged power outages. Helene is the deadliest tropical system to affect the Nation since Hurricane Katrina in 2005, with a death total was approaching 200 as of this writing. At the same time, the intense rains dramatically improved or ended the various degrees of dryness and drought that had been affecting many of the areas impacted by Helene, especially from the Appalachians westward through the Ohio and Tennessee Valleys and southward to the central Gulf Coast, in addition to much of South Carolina and northern Georgia. Outside the broad area impacted by Helene, subnormal precipitation prevailed across most of the contiguous states. Precipitation was almost non-existent over a large area from the western Great Lakes and most of the Mississippi Valley westward to the Pacific Coast, with only scattered sites in the northern Intermountain West and areas from the northern Cascades to the Pacific Coast receiving over one-tenth of an inch. Above-normal temperatures accompanied the low precipitation totals, resulting in dryness and drought persisting or intensifying across this area covering a majority of the contiguous states. Farther east, the Northeast, mid-Atlantic region, and eastern Great Lakes recorded generally 0.5 to 2.0 inches of rain, with a little more reported in parts of western Michigan, southern and western Pennsylvania, and the higher elevations from upstate New York eastward across Vermont, New Hampshire, and western Maine…
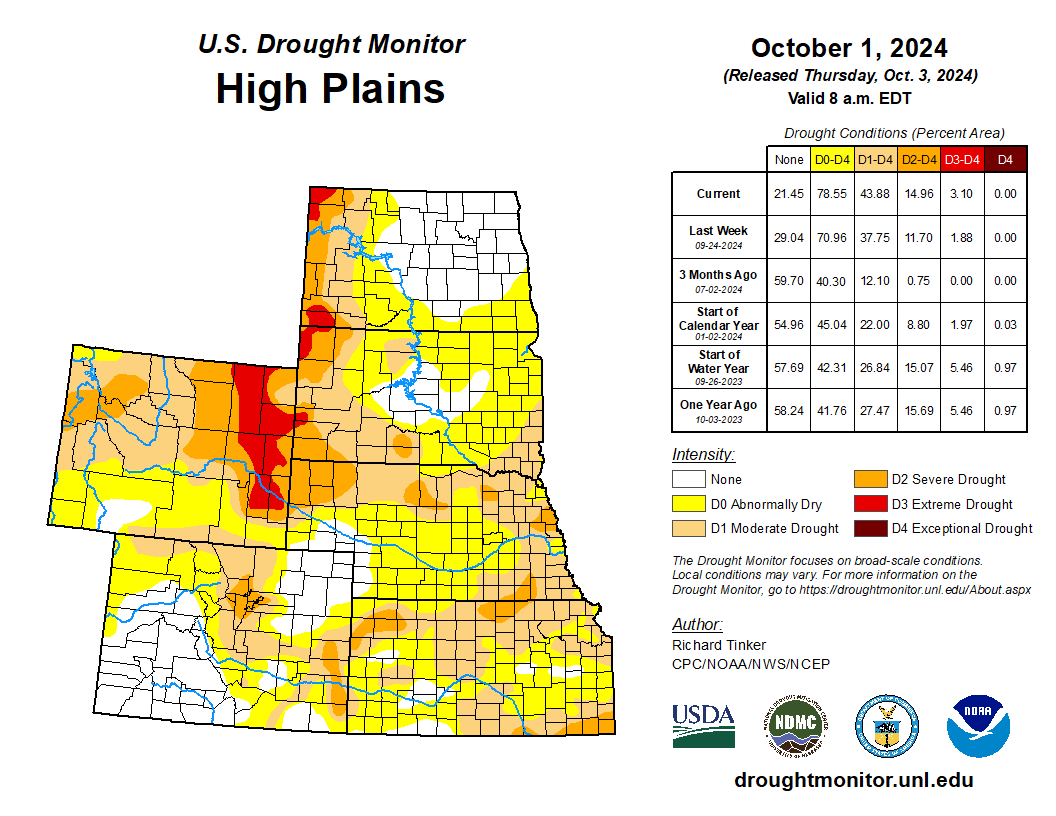
High Plains

It was very warm and almost bone dry throughout the region, with only a few highly isolated spots of measurable rainfall. Unusually high temperatures worsened the situation, with weekly mean anomalies ranging from +1 to +2 deg. F in eastern Kansas to +15 to +18 deg. F in most of the Dakotas. Wyoming and most of Colorado saw temperatures average near or over 10 deg. F above normal. As a result, dryness and drought in the region was unchanged or worsened. Moderate to severe drought expanded in coverage across the central Great Plains and northern High Plains, with increased areas of extreme drought D3) noted in eastern Wyoming, plus a few spots in the western Dakotas. Over the past 30 days, only a few tenths of an inch of rain at most has fallen on much of Wyoming and Nebraska, northern Kansas, and the southeastern Dakotas…
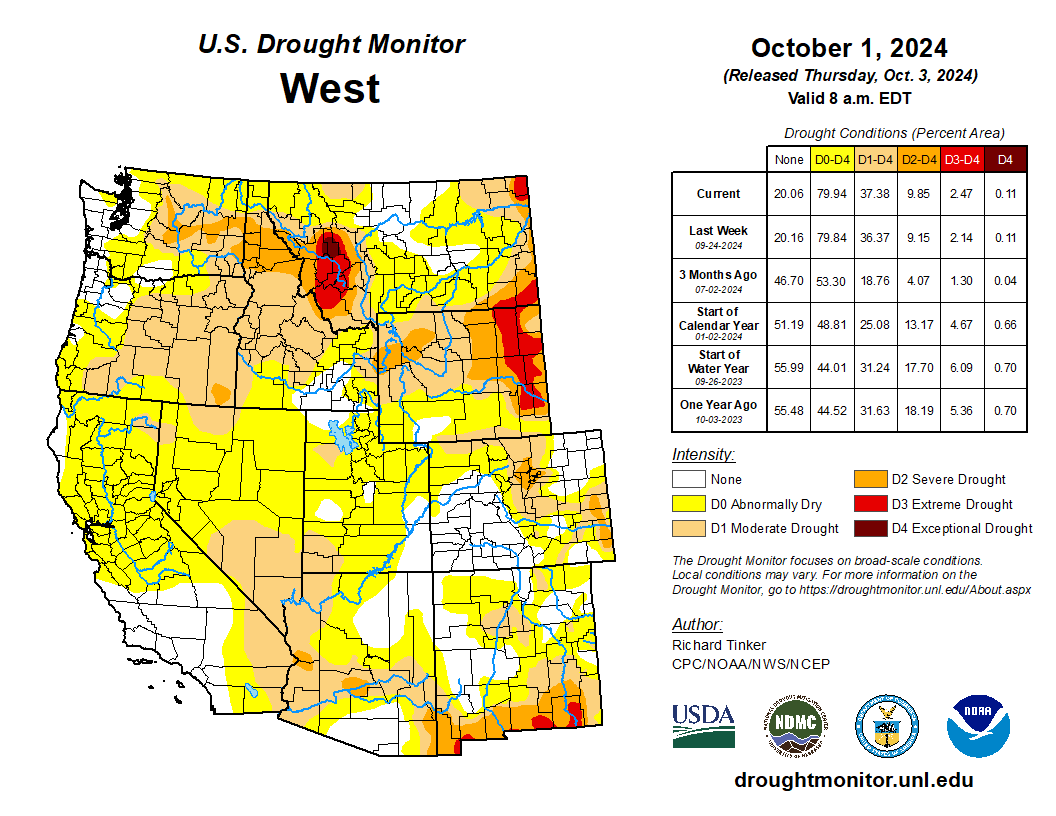
Colorado Drought Monitor one week change map ending April 1, 2024.

West

Some of the higher elevations in Washington recorded 1.0 to locally 2.5 inches of rain while a few tenths of an inch were measured in other parts of the Northwest from the Cascades to the Pacific Coast, and in portions of northern Idaho and northwestern Montana. However, most of the West was very warm and free from any measurable precipitation. A few areas in Utah saw conditions noticeably deteriorate this past week, but no other degradations took place. Some D0 and D1 areas were actually scaled back in central and northwestern Montana despite the warm and dry week due to a few rounds of heavy precipitation in late August and September, which has continued to have a positive impact on soil moisture, vegetative health, and 1- to 4-month precipitation anomalies. Elsewhere, conditions are unchanged from last week. Low relative humidity, high temperatures, and gusty winds continue to produce periods of extreme fire danger, and supplemental feeding and watering of livestock has been common in eastern Montana. With the Southwest monsoon season ending and the wet season in the West not yet underway, drought tends to progress slowly in the region this time of year…

South

Intense rains spawned by Helene dropped 2 to locally 6 inches of rain on Tennessee and northeastern Arkansas, but lesser amounts fell elsewhere. A few tenths of an inch of rain (with isolated higher amounts) fell on parts of eastern Texas and Oklahoma and scattered portions of Louisiana, Mississippi, and the remainder of Arkansas. Other locations recorded little or no rain. Predictably, the heavy rains across Tennessee led to broad-scale reductions in the areal coverage dryness and drought, leaving only south-central parts of the state in drought (D1 and isolated spots of D2). Improvements were also indicated in northern Mississippi and eastern Arkansas, where a re-assessment of conditions demonstrated that early September rainfall from Hurricane Francine was more beneficial than initially thought. Meanwhile, D0 was expanded across southern Louisiana, and areas of deterioration were identified in Texas and Oklahoma, including an expansion of exceptional drought (D4) in the Texas Big Bend, and increased coverage of severe to extreme drought (D2 to D3) in portions of Oklahoma. Rainfall during the past 60 days was less than half of normal in portions of northeastern Oklahoma, the Red River Valley, eastern Texas, and the Texas Big Bend. According to the U.S. Department of Agriculture (USDA), half of the Texas cotton crop was in poor or very poor condition, along with 31 percent of Texas corn and 24 percent of Oklahoma cotton…

Looking Ahead

During the next five days (October 3 – 7), warm and dry weather will dominate the contiguous United States. Very little if any precipitation is expected across a vast majority of the Nation. The Florida Peninsula the immediate rim of the Gulf Coast are significant exceptions, where abundant tropical moisture is expected to feed heavy rainfall. There is some potential for tropical cyclone development over the Gulf later in the period. Over an inch is forecast across the Florida Peninsula and along parts of the immediate Gulf Coast from the Florida Panhandle through coastal southern Texas. Generally 1.5 to 3.0 inches are expected in a swath across the central Florida Peninsula and near the central Gulf Coast, with heavy amounts of 3 to 5 inches forecast on the Florida West Coast from the Tampa area southward through Ft. Myers, and across the Louisiana Bayou. Moderate amounts (0.5 to 1.5 inches) are forecast from the Cascades of Washington and northern Oregon westward to the Pacific Coast, and over parts of northern Idaho and adjacent Montana. Meanwhile, several tenths of an inch are expected across most of the Great Lakes region and the Northeast. Several tenths of an inch are also expected over most of Hawaii, with the largest totals forecast in central Lanai, eastern Maui, and part of the western Big Island. Between 2 and 3 inches are expected to fall on southeasternmost Alaska, where normals are relatively high. Near normal temperatures are expected in most areas east of the Mississippi River while well above-normal temperatures should prevail farther west. Daily maximum temperatures 10 – 15 deg. F above normal are anticipated from the central and northern Plains through most of the Rockies and Intermountain West to near the California Coast. Temperatures are expected to average closer to normal across Hawaii and southeastern Alaska.

The Climate Prediction Center’s 6-10 day outlook (valid October 8 – 12) continues to favor warmer and drier than normal weather for most of the Nation. Above-normal rainfall is expected to continue across the Florida Peninsula, possibly spreading into southern Georgia. Meanwhile, marginally-enhanced chances for wetter than normal weather cover much of Maine, portions of the Far West from the Cascades westward, and west-central California. A much larger area with increased chances for drier-than normal weather stretch across the northern Rockies and from the High Plains eastward through the southern and middle Atlantic Coast. The best odds for subnormal rainfall extend from the Great Lakes southward through the lower Ohio and middle Mississippi Valleys. Surplus precipitation is expected in southeasternmost Alaska while totals over Hawaii are expected to be near normal. Meanwhile, warmer than normal weather is expected from the Great Lakes and the Mississippi Valley westward to the Pacific Coast, with odds for unusual warmth exceeding 80 percent over northern and central sections of the Rockies and Plains. Warmer than normal weather is also favored over the Florida Peninsula. In contrast, there are enhanced chances for subnormal temperatures along the Eastern Seaboard from Georgia through Maine, over most of the Appalachians, across the middle and upper Ohio Valley, and in the Tennessee Valley and adjacent areas. Outside the contiguous U.S., near normal temperatures are forecast for southeast Alaska, with nominally elevated chances for warmer than normal conditions across most of Hawaii.

US Drought Monitor one week change map ending April 1, 2024.

Romancing the River: The Headwaters Challenge 2 — George Sibley (SibleysRivers.com) #ColoradoRiver #COriver #aridification

East River. Photo credit: Sibley’s Rivers

Click the link to read the article on the Sibley’s Rivers website (George Sibley):

October 2, 2024

In the last two posts here (one of which you got twice, my apology), I’ve been trying to ā€˜revision’ the Colorado River as the classic desert river that it is. All rivers are composed of runoff – water from precipitation that did not soak into the ground, collecting in streams that ā€˜run off’ to the next lower watershed. Humid-region rivers receive new water from unused precipitation all the way along their course to the sea, but a river in the arid lands obtains nearly all of its water as runoff from a highland area high enough to force water vapor to condense into precipitation. The resulting runoff from that precipitation then flows down into the arid lands where it receives very little additional moisture and thus starts to diminish through natural processes on its way to the sea – evaporation under the desert sun, riparian vegetation use, absorption into low desert water tables. When the deserts are large enough, and the rivers’ highland water supplies erratic enough, some desert rivers disappear entirely, seasonally if not year round, before they get to the ocean.

As a desert river, the Colorado River divides naturally into a water-producing region in mountains mostly above ~8,000 feet elevation (only about 15 percent of the basin area, mostly in the Southern Rockies), and a much larger water-consuming region of arid lands, both orographic ā€˜rain-shadow’ deserts and hot subtropical deserts. Because the majority of its surface water comes from snowmelt, the pre-20th-century Colorado River regularly sent an early summer flood of water down into the Gulf of California, but later in the water year, snowpack gone, it probably did not always make it all the way through its jungly delta to the sea. Today, with 35-40 million water users in the Colorado River’s water-consuming region as well as those natural processes, the highly controlled river only makes it (almost) to the ocean in an occasional planned release.

In the last post we began exploring the river’s Headwaters – its water-producing region. To refresh your memory, here’s is the set of maps that, in effect, show the river’s water producing region – the blue areas on the map on the left, which show the average quantities of water (snow water equivalent) held in the peak snowpack, usually late March or early April:

It’s important to note that the water-producing and water-consuming regions of the Colorado River region are not congruent with the Colorado River Compact’s Upper and Lower Basins (above and below the line dividing the area outlined in black). The water-consuming region consists of nearly all of the Lower Basin and most of the Upper Basin – and includes all the trans-basin consumptions via long canals and tunnels).

The river’s actual water-producing region (blue areas inside the black line) is barely a fourth of the Upper Basin and some Lower Basin uplands that produce water for the Gila, Virgin and Little Colorado Rivers. That region is our focus today.

I will begin by suggesting that the 35-40 million of us in the water-consuming region of the Colorado River Basin (plus extensions) should have an investment of at least interest and concern, if not (yet) a fiscal investment, in our river’s water-producing region.

Whoa! What’s that? In addition to doing everything we can to conserve and extend the water we use in our deserts – we arid-land river users have to be involved – maybe eventually financially – with the river’s water-producing Headwaters as well? Why shouldn’t the people that live there take care of that?

One obvious reason is the fact that comparatively very few people live in the Headwaters above 8,000 feet. Nearly all of it is public land, National Forests managed for the ā€˜multiple uses’ of all the people. But the larger reason for water users in the consumption region to be investing at least attention and political interest in the Headwaters is the fact that we – the 40 million of us consumptive users – are the people with the greatest direct interest in what happens in the mountains. We depend on those Headwaters for 90 percent of our water supply, and our concern ought to be apparent: we want as much water as possible making its way out of water-producing region into the region of consumption, especially as our river’s flow diminishes by the decade.

Because the border between the water-producing region and the water-consuming region is a natural rather than political boundary, it is not really a line at all (like the 8,000-foot contour),Ā Ā but more of a blurry edge zone, anĀ ecotoneĀ with varying levels of both water production and consumption in it. In Gunnison where I live, for example, at 7,700 feet elevation, we receive on average just a little over 10 inches of precipitation annually – the upper edge of an arid region that continues down through the Colorado River Basin to the river’s end in the subtropical deserts. But 30 miles up the valley from Gunnison, the town of Crested Butte at 9,000 feet gets around 24 inches a year on average, a water-consuming community up in the water-producing region – and all of the valley floodplains between the two towns that are not yet subdivisions are in irrigated hay fields. This is the ecotone, the edge zone in which the net balance between water production and water consumption gradually shifts, over a mere 30 miles, from mostly production to mostly consumption, as precipitation diminishes to desert levels.

Mining and resort towns above 8,000 feet are, however, pretty minor consumers of precipitation-produced water, compared to consumption by natural forces at work in the area. In the last post we explored some of those natural forces in addressing a mystery posed by the Western Water Assessment’s report on the ā€˜State of Colorado River Science’: ~170 million acre-feet of precipitation fall on the Colorado River Basin every year on average, but only ~10 percent of that becomes the river’s water supply. What happens to the other 90 percent?

The perpetrators of this loss turn out to be the sun that originally ā€˜distills’ the freshwater from the salty ocean and the prevailing winds that carry it across a thousand miles of mountain and desert to condense it into a snowpack in the high Rockies. The sun and wind give, and the sun and wind take away – starting immediately after the giving.

The precipitation forced from water vapor in the air by our mountains is barely on the ground before the sun and wind are trying to return it again to vapor. Throughout the main water accumulation period, the winter, sublimation – the conversion of ā€˜solid water’ directly to water vapor by sun and wind – is eating away at the exposed snowpack every sunny or windy day, even at temperatures well below freezing.

Then once the mountains warm up enough for the snow to melt, the sun and wind evaporate what they can of the water that runs off on the surface, especially where it is pooled up or spread out on the streams’ floodplains. The snowmelt water that sinks into the ground goes into the root zone of all the vegetation on the land – grasses, shrubs, brush and trees – where it is sucked up by the thirsty plants, with most of that being transpired back into the atmosphere as water vapor to cool and humidify the working environment of the plants.

Sublimation, evaporation, transpiration – exactly how much water each of these activities of sun and wind convert back to water vapor is difficult to measure, but the end result is that less than a quarter of the water that falls on the mountains stays in the liquid state as runoff creating the streams that become the river flowing into the desert regions where 35-40 million of us depend on it, and less than five percent of what falls on the water-consuming desert regions augments the river there. The sun and wind give, and take away.

The question arises: are there not some ways in which we might retain or recover some of that lost water? That question may begin to sound like another charge for planet engineering – crystals in the stratosphere to reflect heat away from the planet, et cetera. I am not so ambitious as that.

But we know that the Colorado River has lost as much as 20 percent of its water over the past several decades from a combination of climate warming and drought, and even if the drought ends, we will lose morein the decades to come from the warming of the climate already made inevitable from our ongoing reluctance to do much about it. Scientists estimate that for every Fahrenheit degree of average temperature increase, we will lose 5-7 percent of our surface waters from heat- sublimation, evaporation and transpiration. So is there anything we can do – affordably, and undestructively – down here where the water is, to mitigate that loss, if only partially?

Obviously, the sun and wind rule unchallenged in the highest Headwaters, the treeless alpine tundra. But as one moves down into the treeline – another ecotone with the subalpine spruce-fir forest gradually becoming the dominant ecology over the miniature plants and windbeaten krumholz trees of the tundra. The forest shades the snow that makes it down to the snowpack from the sun, and shelters it from the wind. But the forest also catches a lot of snow on its branches, and that snow is prey to the sublimating sun and wind.

The shading trees also slow how fast the ground snowpack melts; in the deep forest, patches of dirty snow can last into the early fall. A slower melt means a higher ratio of water sinking into the ground over water running off to the 35-40 million of us waiting for it downriver. But the trees of the forest exact a high price for their protective efforts; the water sinking in is sipped up by the roots of all the forest vegetation, and the trees are heavy drinkers, transpiring most of what they drink.

Nearly all of the forests that run a wide belt through the Colorado River Headwaters region – the subalpine spruce-fir forests and the montane pine forests – are, as mentioned earlier, public lands designated National Forests, set aside to protect them.from the Early Anthropocene Age of Plunder. A huge number of them were designated by President Theodore Roosevelt, considered the Father of American Conservation, with forester Gifford Pinchot riding shotgun. Pinchot probably had a hand in crafting the 1897 Organic Act that created the National Forest concept out of scattered federal ā€˜Forest Reserves’ set aside under earlier legislation, but with no management or legally impowered managers explicit.

The Organic Act was fairly explicit in defining the purpose for creating National Forests:

Recognizing that just setting the land aside with no process for ā€˜improving and protecting the forest’ was, in the still pretty wild West, equivalent to hanging a sign on the reserve saying ā€˜Get it while you can, boys, because someday you might be banned,’ the Organic Act also provided for ā€˜such service as will insure the objects of such reservations’ – which ā€˜service’ became, under Roosevelt and Pinchot, the U.S. Forest Service.

Note that there are two fairly specific charges in the quotation from the Organic Act: ā€˜securing favorable conditions of water flows,’ and ā€˜furnishing a continuous supply of timber.’ Given the circumstances of a nation continually growing and building, with the American dream being a home of one’s own, it goes without saying which of those two tasks the evolving Forest Service has been mandated to prioritize. For much of their history, the Forest Service has been expected to fund themselves with a surplus to the U.S. Treasury through timber sales – always harvesting of course in ways that ā€˜improve and protect the forest’ (possible, but increasingly improbable when demand grows extreme and supply trudges along at nature’s unhurriable rate).

The charge to secure favorable conditions of water flows, however, has been given much less attention. Pinchot said that ā€˜the relationship between the forests and the rivers is like the relationship between fathers and sons: no forests, no rivers.’ That is clearly not the case; the forests are not the creators of rivers, they are instead just the first major user of the rivers’ waters; they protect the snowpack and slow the melt for their own needs. Pinchot was right in perceiving a relationship between forests and rivers, but had it backward: ā€˜No water, no forests’ is more accurate.

One might think, then, that in the Headwaters of the most stressed and overused river in the West, if not the world, the managers of the Headwaters forests might be expending serious effort to make sure that they are securing the most favorable flows possible from their forests.

What I am having trouble discerning is whether the Forest Service is paying any attention at all to any responsibility for a water supply that 35-40 million people are depending on. In my ā€˜home forest,’ for example, the Gunnison National Forest – now bundled together for management efficiency with two other National Forests as the ā€˜Grand Mesa Uncompahgre Gunnison National Forests (GMUG): the first draft of a GMUG Forest Management Plan being drafted over the past 2-3 years did not even mention the Colorado River Basin by name as a larger system they are part of, and hugely important to. Response letters from ecofreaks like me (I assume others also wrote them about this) got a paragraph about that larger picture into the final draft – but nowhere in the plan itself did I find explicit discussion of the larger mission that implied and of specific management strategies for making sure that the plan was fulfilling that organic charge of securing favorable – one might say ā€˜optimal’ – conditions of water flows.

Well – that launches into an exploration of National Forest management policies and activities that I am still trying to muddle through, but that can wait till next month. I’ve gone on long enough here for now, in this effort to peer over the edge of the box we’re all supposed to be trying to think outside of – the ā€˜Compact Box’ that all the water buffalo are still stalemated over, as we all try to envision river management after the expiration of the Interim Guidelines from 2007. Stay tuned.

National forests and grasslands

New SNOTEL to help #Aspen’s water planning: Castle Peak site collects weather, snowpack data — Heather Sackett (@AspenJournalism )

This new SNOTEL site near the headwaters of Castle Creek measures snowpack, temperature, soil moisture and other weather data. The city of Aspen will use the data to better understand its water supply. Credit: Heather Sackett/Aspen Journalism

Click the link to read the article on the Aspen Journalism website (Heather Sackett):

September 26, 2024

Water managers at the city of Aspen have a new tool to help them better understand and plan for the city’s water supply.

Last week, after four years of planning and permitting, crews from the National Resources Conservation Service installed a new snow telemetry (SNOTEL) site in the headwaters of Castle Creek. Named Castle Peak, the new SNOTEL site is one of the highest in the state at 11,500 feet.

The SNOTEL network is a collection of over 900 automated remote sensing sites in high-elevation, mountainous watersheds across the West. The stations collect data about snowpack depth and water content, air temperature, wind, solar radiation, humidity, precipitation and soil moisture.

This publicly available data provides a real-time snapshot of conditions in Colorado’s high country. It can help avalanche forecast centers know how much new snow is in the backcountry after a storm; soil moisture data can help wildland firefighters know when forests are dangerously dry.

Perhaps most importantly, SNOTEL data helps scientists understand climate change impacts to water supply and predict how much water will be available come spring.

ā€œIn the western United States, about 80% of the annual water used in many basins comes from mountain snow,ā€ said Brian Domonkos, NRCS Colorado snow survey supervisor. ā€œThat means it’s a resource we can monitor and get an idea of how much water we have in the snowpack and anticipate how much will be melting in the spring for use throughout the summer.ā€

The city of Aspen staff requested the site just below treeline off of Pearl Pass Road because the city gets the majority of its water from Castle Creek. NRCS agreed it would be a good spot to enhance their network of SNOTEL sites. Aspen paid the $45,000 cost of setting up the site, while NRCS will be responsible for maintaining it going forward. 

ā€œMost folks are pretty psyched that we have another piece of data and something that will be more representative of the basin than what we’ve had in the past,ā€ said Steve Hunter, utilities resource manager with the city of Aspen. 

Castle Creek flows downstream from the bridge on Midnight Mine Road, just above the city of Aspen’s diversion. Aspen is hoping to get a stream gauge on this stretch of river to better understand its water supply. Credit: Heather Sackett/Aspen Journalism

Site fills a data gap

Aspen water managers previously have used SNOTEL sites on Independence Pass, Schofield Pass, North Lost Trail, Upper Taylor in the Gunnison River basin and sites in the Fryingpan River basin to estimate how much water was in the Castle Creek drainage.

ā€œThere was really this big hole, a missing gap in this area,ā€ Hunter said. 

In many cases, SNOTEL data can help officials manage their reservoirs, releasing more water to make room for a big spring runoff or holding more back in years with a sparse snowpack. Aspen does not have a big storage bucket; the Leonard Thomas Reservoir it uses to store municipal water only holds about 10 acre-feet. Hunter said Aspen will use the SNOTEL data to make decisions about water conservation and when to enact outdoor watering restrictions.

ā€œIt gives us a way to quickly adapt, depending on what we’re seeing up there as far as snowpack,ā€ he said. ā€œI think that’s going to be super helpful.ā€

Aspen received several letters of support for the project when it was applying for a grant from the U.S. Bureau of Reclamation in 2020, including from Pitkin County, Colorado Water Conservation Board, Roaring Fork Conservancy and Aspen Global Change Institute. While the grant wasn’t funded, it demonstrated strong support for the new SNOTEL site.

ā€œSince all data from these proposed stations will be public, these monitoring sites would benefit both the city of Aspen and other mountain towns and municipalities seeking to better understand potential climate change impacts on water supplies,ā€ reads the letter from AGCI.

The Castle Peak SNOTEL is just one piece of Aspen’s effort to better understand its water supply availability. It’s 2020 Municipal Drought Mitigation and Response Plan says the city would benefit from a stream gauge on Castle Creek above its diversion point to improve monitoring and make drought declaration decisions. The city is still working on the Castle Creek stream gauge.

Along with other governments across the state, Aspen has also funded Airborne Snow Observatories, a company that measures snowpack from the air using LiDAR, a laser technology that can sense snowpack depth across a wide area. Aspen contributed $50,000 to ASO flights in the Roaring Fork watershed this year. 

Real-time data from the new SNOTEL site can be found on the NRCS website. The site does not yet have ā€œpercent of normalā€ values since this is its first year of operation.

This story ran in the Sept. 27 edition of The Aspen Times and the Vail Daily.