Revisiting #LaNiña and winter snowfall — NOAA #ENSO #snowpack

Click the link to read the article on the NOAA website (Tom Di Liberto):

October 24, 2024

I’ll cut to the chase. Spooky season is coming to an end, and people are beginning to set their sights on winter. And when it comes to winter, there’s a big, white, abominable “elephant” in the room. Snow. While you’re not going to find a seasonal snowfall prediction here at the ENSO Blog, what we can do, given that La Niña is favored this winter, is revisit the historical relationship between La Niña and snow across North America. Just promise to not take it out on your lowly ENSO Blogger if history suggests more of a winter nightmare than a winter wonderland.

Haven’t you covered this before?

Yes…and no. Back in 2017, Stephen Baxter did indeed write a very popular post on snow and La Niña winters. So why am I revisiting this topic? Well, the dataset used in that post stopped updating in 2009, or 15 years ago. And nowadays, we have access to a new snow dataset from the ECMWF ERA5 reanalysis (learn more about what that in footnote 1). Snowfall, not snow accumulations. If this dataset seems familiar, it’s because last year Michelle and Brian Brettschneider used it to look at snowfall over North America during El Niño winters (footnote 2). So let’s dig in!

What does La Nina usually do?

A quick reminder on what La Niña typically means for the atmosphere over North America during winter. During La Niña, the jet stream, that river of air 30-40,000 feet in the atmosphere that serves as a storm highway, shifts northward across the eastern Pacific Ocean. This causes a ripple effect on the atmosphere across North America. A high-pressure system tends to set up south of Alaska in the north Pacific Ocean and acts like an atmospheric boulder, forcing storms up and around. Downstream over the eastern U.S., the jet stream then dips south in response.

During La Niña, the Pacific jet stream often meanders high into the North Pacific. Southern and interior Alaska and the Pacific Northwest tend to be cooler and wetter than average, and the southern tier of U.S. states—from California to the Carolinas—tends to be warmer and drier than average. Farther north, the Ohio and Upper Mississippi River Valleys may be wetter than usual. Climate.gov image.

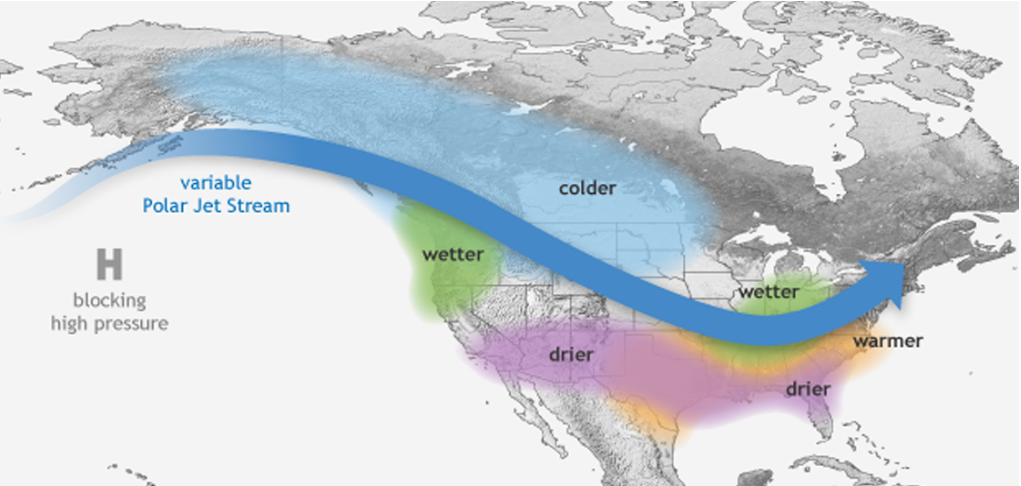
The end result is colder temperatures across western Canada and northwest/northcentral U.S. and warmer and drier-than-average conditions over the southern U.S. Wetter conditions also prevail in the Pacific Northwest and Ohio River Valley as storms follow around the blocking high in the Pacific or across more northern areas near the Great Lakes.

How does that translate to snow?

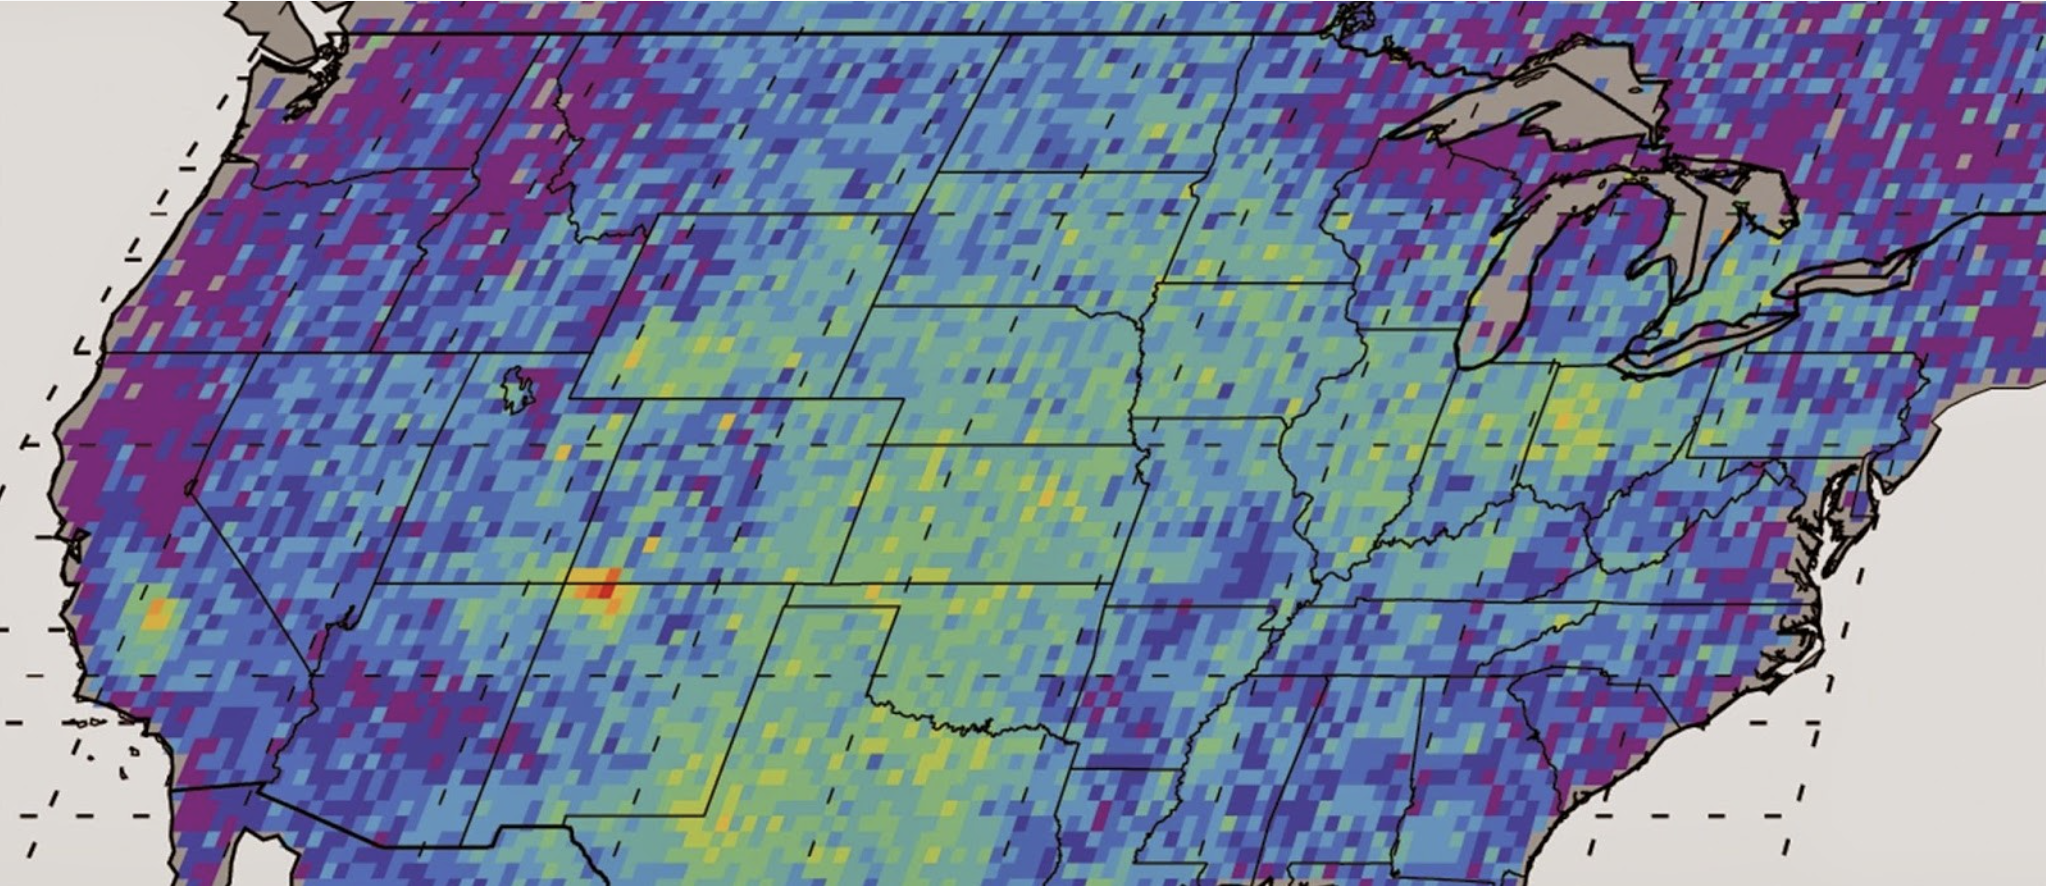
Some patterns jump out when looking at how snowfall differed from normal (the 1991-2020 average) for all La Niña winters from 1959-2024. La Niña winters tended to be banner years for snow across western Canada, the Pacific Northwest, and the northern Rockies. Snowfall also was above-average across the Great Lakes into northern New England. On the flip side, the southern tier of the United States observes below-average snowfall amounts.

January–March snowfall during all 22 La Niña winters from 1959–2024 compared to the average for all January–March periods from 1991–2020. The long-term trend in snowfall over this period has been removed, meaning the maps better show the influence of La Niña on its own. NOAA Climate.gov map, based on ERA5 reanalysis data and analysis by Michelle L’Heureux.

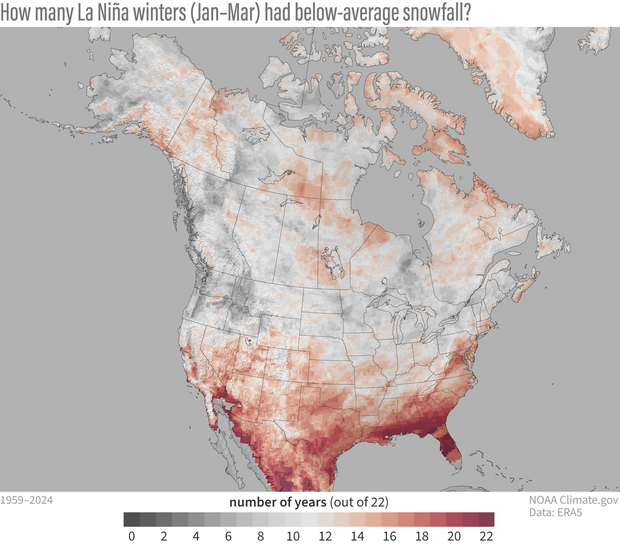
Using averages, though, can have a drawback. For one, a couple BIG snow years could make the overall average look snowier than what we typically experience. To deal with that, we can look at the 22 La Niña events on record and count those with below-average snowfall. Using this metric, the signal for above-average snow is particularly robust across the Pacific Northwest and Idaho, as out of 22 La Niña events, less than seven winters had below-average snow. Meanwhile, bad news for snow-lovers in the Mid-Atlantic: more than 15 La Niña winters had below-average snow.

This map shows how many of the 22 historical La Niña winters from 1959–2024 had below-average snowfall from January–March. Red colors mean those places had below-average snowfall more than half the time. Gray colors mean those places had below-average snowfall less than half the time. The long-term trend has been removed to better show the influence of La Niña on its own. NOAA Climate.gov map, based on ERA5 reanalysis data and analysis by Michelle L’Heureux.

Now just for weak La Ninas!

This winter, if a La Niña forms, we’re expecting it to be a weak event. If you remember, a weaker La Niña means a weaker punch on the atmosphere and a less consistent impact on climate across North America. In the nine previous weak La Niña events, the pattern of snow was similar to that of all La Niña events with above-average snowfall observed, on-average, across the northwest and north central U.S. with below-average snowfall farther south.

January–March snowfall during 9 weak La Niña winters from 1959–2024 compared to the average for all January–March periods from 1991–2020. The long-term trend in snowfall over this period has been removed, meaning the maps better show the influence of weak La Niñas by themselves. NOAA Climate.gov map, based on ERA5 reanalysis data and analysis by Michelle L’Heureux.

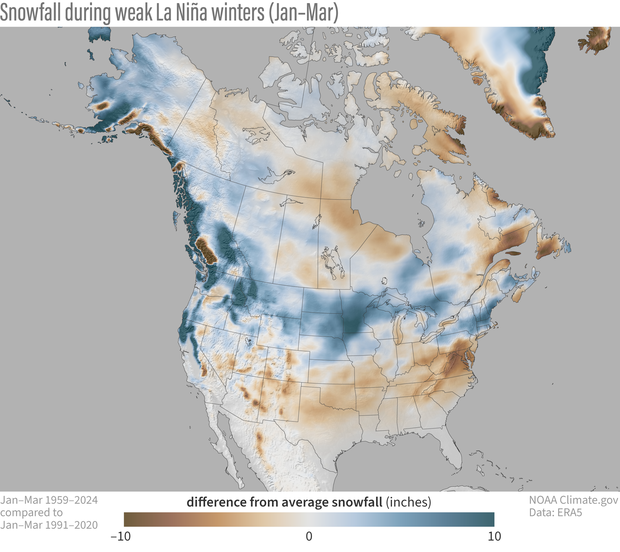
But there were some exceptions. The north-central U.S. including the Dakotas and Minnesota had an even snowier signal during weak La Niñas than the average of all La Niñas. Meanwhile, the Pacific Northwest wasn’t as snowy as compared to all La Niña events, and snowfall was actually well-below average (not above-average like in the all-La Niña event case) just over the border in southwestern Canada.

The count of how many (out of nine) weak La Nina events had below-average snowfall also showed similar patterns, with some bad news for those in Virginia, Maryland, and Washington, D.C., where every single weak La Niña winter had below-average snow.

This map shows how many of the 9 historical weak La Niña winters from 1959–2024 had below-average snowfall from January–March. Red colors mean those places had below-average snowfall more than half the time. Gray colors mean those places had below-average snowfall less than half the time. The long-term trend in snowfall over this period has been removed to better show the influence of weak La Niñas by themselves. NOAA Climate.gov map, based on ERA5 reanalysis data and analysis by Michelle L’Heureux.

Here is where you tell us about how climate change is affecting snow

La Niña isn’t the only story when it comes to snowfall across North America. An important note: the previous maps based on La Niña events have also had the long-term trends removed (footnote 3). We do that to see what impact La Niña had on snowfall by itself. In other words, how La Niña winters would have played out if there was no long-term change in snowfall to complicate things. But, there is a long-trend that has to be considered.

Changes in January–March snowfall across North America from 1959–2024. Most of the contiguous United States has seen a decline of snowfall (brown) over the period thanks to long-term warming. Farther north, where winter temperatures have room to warm and remain below freezing, snowfall has increased in places (blue). Such increases are consistent with global increases in atmospheric water vapor as a result of warming-driven evaporation. NOAA Climate.gov map, based on ERA5 reanalysis data and analysis by Michelle L’Heureux.

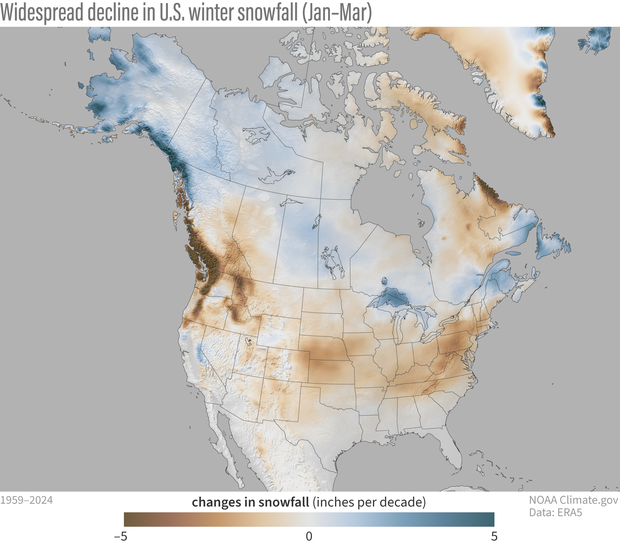
Human-caused climate change is making things warmer. And across many regions, winter is the fastest-warming season. Not surprisingly, over most of the contiguous United States, January-March snowfall has trended downwards. Less snow doesn’t necessarily mean less precipitation, though. In fact, for much of the Great Lakes and Northeast, precipitation has increased in winter. It just means that “would-be” snow is falling as rain due to warming temperatures.

What about areas farther north like Alaska? Well, an overall warmer atmosphere means the air can hold more moisture. When the atmosphere is wrung out, it means more precipitation. In places in the far north where temperatures are still cold enough for snow, that extra moisture translates into an increase in snow.

Good question. Just because snow is trending lower, or there is a La Niña, doesn’t mean there can’t be a big snowstorm in any given winter. It just might be harder for that to happen in some places. Basically, I’m telling you there’s a chance. Good luck, snow lovers!

In ski season roulette, a climate outlook will never completely crush a skier’s hopes. Even for a hypothetical forecast for an 80% chance of a warmer-than-average winter, forecasters leave at least a small chance—by convention NOAA forecasters say 3.3%—that a cold winter will happen. And of course, a single big snow event can sometimes save an otherwise poor season. NOAA Climate.gov cartoon.

Footnotes

  1. We will go ahead and copy and paste the footnote from the El Niño-snowfall blog post! We have to be careful to not take any one dataset literally, but this ECMWF ERA5 data seems to pass a few sniff tests. Sniff test #1 was “Does ERA5 snowfall reproduce the winter pattern of snowfall made with other datasets?” The answer, at least when comparing with winter 2022-23, is yes. Sniff test #2 was “Does ERA5 snowfall reproduce the historical ENSO pattern that is found within other datasets?” Here again, the answer is yes, we were able to reproduce ENSO composite maps that were made with the Rutgers gridded snow data in this older ENSO blog post.Sniff test #3 was comparing with our old ENSO snowfall composites made from an even older (not quality controlled) station-based dataset that has been discontinued.With that said, ERA5 is a newer dataset, it is “reanalysis,” which means that a very short-range weather model is used to produce snowfall from in situ observations (from the ECMWF website, it outputs the “mass of snow that has fallen to the earth’s surface”). Essentially a reanalysis is predicting what observed snowfall would have looked like based on past observational inputs from satellites, stations, buoys, and other observing systems. Therefore, we recommend you treat some of the finer details with a healthy degree of suspicion and try to corroborate them in other datasets. Hopefully this blog post will motivate the creation of additional snowfall datasets and scientists will explore how well ERA5 compares with these other snowfall measurements.Another aspect to keep in mind is that ERA5 snowfall is “Snowfall toward earth’s surface” which means measurements are not subjected to influence from pavement, canopy, surface winds, etc. which tend to reduce amounts actually measured at the surface (not to mention human error using a ruler).
  2. Some other major differences between the two snowfall datasets. The dataset used in the 2017 article looked at an October-April average over the 1949-2009 period, and compared that to the 1981-2010 climatology. The ERA5 Reanalysis dataset instead looks at the January-March period from 1959-2024, and compares to the 1991-2020 climatology. The “all La Nina event” snowfall anomaly pattern between both datasets is pretty similar. However, when comparing just the weak events, the newer dataset shows a stronger below-average snowfall signal across the Appalachians and Mid-Atlantic.
  3. To detrend the data, we subtracted a least-squares linear fit through the January–March season for the entire period of record.

Accelerating Responsible Clean Energy Development: Audubon’s Efforts in 2024

Avangrid’s Manzana Wind Power Project in the Tehachapi area in Rosamond, California. Photo: Sydney Walsh/Audubon

Click the link to read the release on the Audubon website (Garry George):

October 18, 2024

From warbler research to transmission line placement, Audubon staff worked on planning with birds and people in mind.

This year wind and solar generation in the U.S. surpassed coal for the first time, and solar is expected to supply most of the growth in electricity generation through 2025. The Inflation Reduction Act (IRA) continues to be a major catalyst for this momentum by providing substantial incentives that include tax credits for renewable energy and transmission projects. At the state and local level, clean energy goals and mandates, new jobs, and economic and community benefits are driving the growth of renewables. 

Transitioning to clean energy is crucial for protecting hundreds of North American bird species from climate change, but infrastructure must be sited and operated with birds and people in mind. Audubon staff and chapters across the U.S. are working with planners, developers, and federal and state agencies to achieve this goal. Over the last 12 months, Audubon has been involved in the planning, permitting, siting, or operation of over 36 gigawatts of onshore and offshore wind and solar projects, as well as almost 45 gigawatts of transmission capacity. This conservation work includes providing recommendations on siting, permitting, monitoring, and research, grounded in Audubon’s extensive science and policy advocacy for birds and their habitats. 

Here are some of this year’s efforts across the network:  

Transmission Lines in Minnesota 

In May, Minnesota made a significant move by passing legislation to allow transmission lines alongside highways, thanks to the efforts of Audubon Upper Mississippi River and their work with the NextGen Highways coalition. Audubon’s Birds and Transmission report shows that placing transmission lines on existing rights-of-way minimizes the overall transmission footprint, leaving more habitat intact and reducing the chance of collisions. This approach advances the clean energy transition while ensuring that Minnesota’s birds and communities benefit from responsibly sited transmission. 

Canada Geese fly above transmission lines. Mjsimage/Shutterstock

Getting Build Ready for Clean Energy in Washington 

Audubon Washington is working with local chapters Lower Columbia Basin Audubon Society, Vancouver Audubon Society, and others to accelerate the state’s transition to clean energy on several fronts. The Audubon Washington team is championing a new Build Ready Clean Energy Program and advocating for the creation of a Clean Energy Development Authority to help meet the state’s clean electricity mandates. By joining forces with the NextGen Transmission coalition and actively participating in the Western Clean Energy Advocates (WCEA), Audubon is making its voice heard on key energy and transmission issues. They’ve also weighed in on the state’s environmental impact assessments for major transmission projects, utility-scale solar, and onshore wind. Audubon has also conducted in-depth spatial analyses, pinpointing areas in Eastern Washington as candidate sites for low-conflict solar development. 

Monument Planning in California 

While Audubon California co-leads the effort to designate the Chuckwalla National Monument in California’s desert, Audubon has joined solar industry leaders and conservationists to secure monument status for this unique landscape while ensuring the designation would not impede solar development in designated areas outside the monument and existing and planned transmission development through the monument. By balancing conservation with clean energy needs, this collaborative effort aims to protect the Chuckwalla’s important habitat and natural beauty while paving the way for responsible development.

A Prothonotary Warbler is fitted with a tracker. Photo: Erik Johnson/Audubon Delta

Warbler Research in Louisiana, Kansas, Arkansas, and Ohio 

In May and June, Audubon Delta and partners fitted over 50 Prothonotary Warblers with tiny trackers across Louisiana, Kansas, Arkansas, and Ohio. The multi-sensor geolocators will collect data on the flight behavior of these songbirds as they migrate across the Gulf of Mexico. The information gathered from returning birds will offer new insights into their use of airspace and their responses to inclement weather. This research will aid in assessing collision risks for offshore wind projects in the region and support improved planning and siting efforts. 

Reasonably foreseeable development scenario solar area relative to total area of lands available for application. Credit: Bureau of Land Management

Solar Development in Western States 

The Bureau of Land Management (BLM) finalized in a plan for how utility-scale PV solar will be sited and permitted on 30 million acres of public lands across 11 states. In April, Audubon filed detailed comments on the Draft EIS that recommended improvements to BLM’s Solar PEIS, with a focus on avoiding and minimizing impacts to birds by prioritizing project development on degraded lands and close to transmission lines. Audubon also filed similar joint comments in a letter to BLM leadership in collaboration with four conservation organizations and five solar development companies. More than 2,900 Audubon supporters sent comments to the BLM in support of this approach. The Final EIS, released in August, improves on the initial draft, but further improvements are needed in plan implementation to streamline permitting for rapid deployment of solar energy on low conflict lands. 

Golden Eagle in flight. By Tony Hisgett from Birmingham, UK, CC BY 2.0, https://commons.wikimedia.org/w/index.php?curid=18249270

Improved Permitting for Wind Projects 

In February, the U.S. Fish and Wildlife Service (FWS) made their incidental take permitting program under the Bald and Golden Eagle Protection Act more efficient in ways that support the buildout of wind energy while benefitting Bald and Golden Eagle conservation. As part of the permit program, clean energy developers will commit to conservation measures and monitoring at their wind project and transmission sites, and the FWS will set the maximum number of eagles and eagle nests that might be harmed by wind energy and transmission without prosecution under the federal law. Audubon advocated for these improvements alongside conservation and industry partners to help advance wind energy development while protecting eagles. 

The Offshore Wind panel during Climate Week NYC 2024. Photo: Darien Fiorino/Audubon

Offshore Wind Development 

During Climate Week NYC, Audubon hosted a panel on the future of offshore wind in the United States. As of September, the U.S. has approved ten lease areas for offshore wind projects, representing more than 15 gigawatts of energy. That’s enough to power 5.25 million homes, and equivalent to half of the capacity needed to achieve the national goal of permitting 30 gigawatts of offshore wind by 2030. Audubon has been engaged on each project every step of the way, filing science-based comments that point to key areas that should be avoided for birds and sharing recommendations for research and operation. This is a collaborative effort with conservation partners as well as Audubon’s coasts and seabird experts and state coastal offices in the Atlantic, Gulf of Mexico, and Pacific. In the Atlantic, Audubon has a seat on the Regional Wildlife Science Collaborative for Offshore Wind (RWSC), which released a new research plan in January and announced funding commitments from federal agencies and developers to implement the plan.  

Visit Audubon’s Birds and Clean Energy page for more information. 

The Crossing Trails Wind Farm between Kit Carson and Seibert, about 150 miles east of Denver, has an installed capacity of 104 megawatts, which goes to Tri-State Generation and Transmission. Photo/Allen Best

Enforcement finally comes to the San Juan Basin gaspatch: An energy sacrifice zone no more? We’ll see — Jonathan P. Thompson (LandDesk.org) #ActOnClimate

Photo credit: Jonathan P. Thompson/The Land Desk

Click the link to read the article on The Land Desk website (Jonathan P. Thompson):

October 22, 2024

😱 Methane Madness 🛢️

The News: Last week the Land Desk reported that Hilcorp Energy had agreed to pay $9.4 million in penalties for air pollution violations in the San Juan Basin of northwestern New Mexico. It is, as one Farmington-area advocate told me, “a big deal.” It marks the culmination of years of on-the-ground efforts to get Hilcorp to clean up its act, and it potentially heralds a new era in which federal and state regulators actually enforce environmental laws in an area often treated like an energy sacrifice zone. 

The Four Corners methane hotspot is yet another environmental climate and public health disaster served to our community by industry. But now that we’ve identified the sources we can begin to hold those responsible accountable for cleaning up after themselves. The BLM methane rule and EPA methane rule are more clearly essential than ever. Photo credit: San Juan Citizens Alliance (2018)

The Context: A decade ago, scientists revealed that satellites had detected unusually high concentrations of methane over the San Juan Basin, one of the nation’s most prolific natural gas fields. This was alarming because methane, the primary ingredient in natural gas, is a potent greenhouse gas, with 86 times the warming potential of carbon dioxide over a 20-year period. The plume was named the Four Corners Methane Hot Spot, and garnered national attention. 

While coal mines and natural geologic seeps contributed to the plume, the prime culprit was no mystery: The vast oil and natural gas industry infrastructure, which is woven like rebar into the landscape here, and burps and leaks methane and other hydrocarbons and volatile organic compounds from valves, pipes, compressors, and newly completed wells. At the time, ConocoPhillips’ San Juan Basin operations were emitting an estimated 277,514 metric tons of methane each year, making them the Basin’s — and the nation’s — largest methane emitter. 

In other words, ConocoPhillips was a major contributor to this slow-moving environmental disaster, which didn’t go over so well with some of its shareholders. While it did upgrade some of its equipment in an effort to reduce emissions, the corporation ultimately chose to sell out of the Basin. In 2017 Hilcorp, a private Houston-based company, purchased all of ConocoPhillips’ San Juan Basin assets for about $3 billion. In doing so, Hilcorp not only acquired more than 11,000 oil and gas wells, many of them low-producing and high-emitting, but also the status of being one of the worst methane polluters in the country. 

The San Juan Basin has one of the highest methane emission intensities in the nation, which is the ratio of emissions to overall production. Source: Ceres.

The transfer raised concerns. Private companies like Hilcorp are less transparent than public ones, and Hilcorp has established almost no local presence, letting ConocoPhillips sleek glass and steel office building sit empty. And while a public corporation is beholden to its shareholders, Hilcorp’s levers are pulled by its founder and CEO, Jeffery Hildebrand, net worth $12.6 billion

Hildebrand is known for buying up Aspen real estate, including a ranch once owned by John Denver, and for contributing millions of dollars to Donald Trump’s presidential campaigns and to other Republican candidates. Hildebrand recently hosted a Trump fundraiser in Houston that was attended by Alaska Gov. Mike Dunleavy. Hilcorp bought up most of BP’s assets in Alaska, making it one of the state’s major oil and gas operators. Dunleavy is trying to lure energy-intensive data centers to the state to establish a better business case for the construction of a multi-billion-dollar natural gas pipeline

According to self-reported data, Hilcorp’s San Juan Basin facilities’ emissions have remained more or less steady since the 2017 transfer. But multiple studies have found that the EPA’s and industry’s estimates are far lower than actual emissions. And it is now known that Hilcorp failed to report some emissions — those from oil and gas well completions — as required by state law. 

Hilcorp remains the largest methane emitter in the country. Source: Ceres.

More than 120 of Hilcorp’s wells sit on Don and Jane Schreiber’s Devil’s Spring Ranch, located in the Blanco Canyon area east of Farmington. They’ve been pushing back against the industry and the land managers that seemed inclined to do its bidding for years — often to no avail. They’ve cooperated with Earthworks, the mining watchdog group, which has documented leaking Hilcorp facilities on and around the Schreibers’ ranch. Last week’s announcement signaled that the work was not in vain. 

While many of Hilcorp’s 11,406 San Juan Basin wells emit methane, the EPA’s and New Mexico Environment Department’s enforcement action focuses just on well completion operations — which are the post-drilling steps, including hydraulic fracturing, that put a well into production — at 192 of Hilcorp’s wells. According to the federal agency’s complaint, Hilcorp “vented all of the flowback gas emissions, including methane and VOC, directly to the atmosphere during flowback … .” (“Flowback” is when hydraulic fracturing fluids, water, sand, and associated gases surge back out of the well following fracturing). 

This violated rules requiring operators to capture the flowback gases and pipe them, reuse them, or inject them back underground. The activity resulted in excess emissions of more than 500 tons of VOC (or volatile organic compounds, which are health hazards and ozone precursors) and 1,200 tons of methane. Meanwhile, Hilcorp didn’t report the completions properly or at all, again violating state and federal rules. 

The $9.4 million penalty is more or less pocket change for a company like Hilcorp. But the consent decree also requires the firm to take extra measures to minimize emissions during completion and flowback and to properly classify its wells and report activity and emissions. The company is also required to hire an approved independent third-party verifier to conduct a compliance verification program for every well-completion it conducts for the next three years. If Hilcorp fails to live up to these terms, it will be penalized. Hilcorp must also carry out a mitigation project to replace nearly 1,300 low- and intermittent-bleed pneumatic controllers with non-emitting devices on its San Juan Basin facilities located on tribal lands. 

Methane Madness: Part I — Jonathan P. Thompson May 14, 2021

Methane producers in Southwest Colorado (a coalbed methane well and cattle). Jonathan P. Thompson photo.

Methane, it’s all the rage these days. Or maybe it would be better to say that it’s the outrage, since that’s what this greenhouse gas, consisting of one part carbon and four parts hydrogen, is causing. The alarm and outrage have surged in the wake o…

Read full story


📸 Parting Shot 🎞️

A break in last weekend’s storm brings out the whites, yellows, and oranges on the San Juan Mountain slopes south of Ouray. Jonathan P. Thompson photo.
Snow and hail and sleet and rain bring out the snowplows on Molas Pass during last weekend’s storm. The storm brought a lot of moisture to the whole area, with heavy, wet snow in the high country. It wasn’t a lot of accumulation, but enough for Wolf Creek Ski Area to plan on opening this weekend. Jonathan P. Thompson photo.

The Land Desk is a reader-supported publication, which means we need you to help us keep on keeping on by becoming a paid subscriber. Plus you get premium content and the key to the paywall (i.e. access to the treasure trove of Land Desk archives).

Part II: #ColoradoRiver Compact curtailment: The warming #climate may deliver more snow and rain. Or not. More certain will be rising temperatures. And that may cause continuing declines in decades ahead. — Allen Best (@BigPivots) #COriver #aridification

Roaring Fork River September 2022. Photo credit: Allen Best

Click the link to read the article on the Big Pivots website (Allen Best):

October 22, 2024

Our story so far: Andy Mueller used the Colroado River District seminar this year to call for Colorado to begin planning for potential curtailment of the Colorado River. The state engineer, who is legally responsible for such planning, it it occurs, pushed back, saying first things first. For Part I,  go here.

Andy Mueller, general manager of the Colorado River District, has used the district’s annual seminar in Grand Junction in years past to warn of a worsening situation in the Colorado River Basin. Two years ago, for example, he warned that flows were already well below the 20th century averages. Might those flows of 13.5 to 14 million acre feet further decline to 9.5 million acre-feet in decades ahead?

See: “Pick your Colorado River metaphor: The river is in deep doo-doo, and worse may very well come. So why such a sluggish reaction?” Big Pivots, Sept. 30. 2022.

Even relatively healthy snowfalls don’t necessarily produce robust volumes of runoff. For example, snow during the winter of 2023-24 was good but runoff just 84% of average.

“A new different” is how Dave Kanzer, the River District’s director for science and interstate matters, described the runoff numbers. [ed. emphasis mine]

“We are just kind of treading water, and where we are next year could be similar to where we are this year — unless something changes,” he added during the district’s seminar in Grand Junction. “There’s a lot of uncertainty.”

Warming temperatures most likely will produce continued declines in river flows. That was a key takeaway of the presentation by Russ Schumacher, the state climatologist. He’s a careful scientist, clear to differentiate what is known from that which is not. Much of what he said was not particularly new. Some of the conclusions he offered were little changed from those of a decade ago – but with one key difference. Another decade of data has been compiled to support those conclusions.

Seven of Colorado’s nine warmest years have occurred since 2012. The rise can be seen most clearly in summer and fall records. This past summer was part of that trend. It was the sixth hottest summer in Colorado’s recorded history going back to the late 1800s.

Some places were hotter than others, though. In Grand Junction, gages at Walker Airfield recorded the hottest June-August period ever, an average of more than 80 degrees. That’s the average temperature 24/7, day and night.

Precipitation? No clear trend has emerged. Levels vary greatly from year to year.

Graphic credit: Russ Schumacher/Colorado Climate Center

Integration of temperature and precipitation records tell a more complex and concerning story. Rising temperatures have produced earlier runoff. The warmth also exacerbates evapotranspiration, which is also called evaporative demand. The warmer it is, the more surface air draws water from the plants and dries out the soils.

The most powerful way of explaining all this was in two sequences of slides, one of which is reproduced here.

“The timing shift, even if the peak doesn’t change all that much – the timing is quite important,” said Schumacher. Colorado River flows at Dotsero, near Glenwood Canyon, have already declined 25% during late summer.

Schumacher and other scientists describe predictions with various degrees of confidence. There is, he said, high confidence of a future warming atmosphere that to an even greater degree reduces runoff no matter how much snow falls in winter. We can be sure of temperatures rising between one and four degrees F by mid-century, he said.

Unless Colorado gets far more snow and rain, the Colorado River will decline further. [ed. emphasis mine]

Future warming depends upon how rapidly greenhouse gas emissions rise globally. In mid-October, they were at 418 parts per million high on the slopes of Hawaii’s Mauna Loa. They were 315 when the first measurements were taken there in 1958 and roughly 280 at the start of the industrial era.

Graphic credit: Russ Schumacher/Colorado Climate Center

All of Schumacher’s presentation is valuable, as is his slide deck. Both can be found on the River District website under the annual seminar heading.

And that returns us to the Colorado River Compact, the foundation for deciding who gets what and where in the basin — and who doesn’t.

In 1922, when the Colorado River Compact was drawn up at a lodge near Santa Fe, the Colorado River had been producing uncommonly robust flows. In their 2019 book, “Science Be Dammed,” Fleck and Eric Kuhn, the former general manager of the River District, explained that ample evidence even in 1922 existed of drier times just decades before. Later evidence documented lesser flows in the centuries and millennia before.

Not only were flows in the Colorado River during the 20th century much less than was assumed by the compact, the document failed altogether to acknowledge water rights for Ute, Navajo and 28 other Native America tribes in the basin who were to get water as would be necessary to sustain agricultural ways of life. Just how much had not been determined, although it’s now estimated at 20% of the river’s total flow. Some claims still have not been adjudicated.

Mueller called it a “flawed document” produced by a “flawed process” that had “faulty hydrological assumptions” and did not include “major groups of people who reside in and own water rights in this basin.”

A March 31, 1922 photo of the Colorado River Commission. Standing left to right: Delph E. Carpenter (Colorado), James G. Scrugham (Nevada), R. E. Caldwell (Utah), Frank C. Emerson (Wyoming), Stephen B. Davis, Jr. (New Mexico), W. F. McClure (California) and W. S. Norviel (Arizona). Seated: Gov. Emmet D. Boyle (Nevada), Gov. Oliver H. Shoup (Colorado), Herbert Hoover (federal representative and chair) and Gov. Merritt C. Mecham (New Mexico). The governors were not members of the Commission. Photo: Colorado State University Library

For its time, though, the compact was a grand bargain. Colorado’s Delph Carpenter was a key negotiator. He had realized that if diversions from the Colorado River were determined by the doctrine of prior appropriation, the bedrock for water law in Colorado and most other states, the upper-basin states would lose out because they would develop the Colorado River more slowly. Instead, the compact created an equitable apportionment, essentially a 50-50 split of the water between upper and lower-basin states.

It was the foundation for what is now called the Law of the River, by which is meant the many laws, court decrees and agreements concerning both surpluses and droughts.

Dams were built, diversion structures constructed – including, because of a law of Congress in 1968, the Central Arizona Project (which also resulted in dams on the Animas and Dolores rivers in Western Colorado). That 1968 legislation, the Colorado River Basin Project Act, recognized that the river would be short by as much as two million acre-feet, said Mueller.

And then the agreements of the 21st century have tried to acknowledge lesser flows. But they have also deferred the really hard questions. The harder questions, as Mueller suggested, may yet provoke the states to get out their legal swords.

Central to the dispute is how much water should the upper basin states be releasing from Lake Powell? This is the key clause in the compact: “The States of the Upper Division will not cause the flow of the river at Lee Ferry to be depleted below an aggregate of 75,000,000 acre-feet for any period of ten consecutive years …”

Lee Ferry, located in Arizona but a few miles downstream from Glen Canyon Dam, is the formal dividing point between the upper-basin states and lower-basin states in the Colorado River. It is also the put-in location for boaters rafting or kayaking the Grand Canyon. Photo/Allen Best

Flows from Colorado and other upper-division states have been about 86 million acre-feet over the last 10 years.

Lower-basin states say no, that’s not enough. They argue that the upper basin states need to accept cuts, too.

For now, there is no dispute that the upper basin states are meeting that obligation. But what if a string of years like those of 2002-2004 return? And what if the case ends up before the Supreme Court and that court ultimately rules against the upper basin?

This sets up the potential – Mueller characterized it as a certainty – for conflict, a court case that will have to go before the U.S. Supreme Court.

“I don’t believe we’re violating the compact today, and I don’t think we’re going to be violating the compact necessarily if the river drops, if our delivery below Glen Canyon drops,” he said. “What I can tell you is we’re going to have litigation.”

In May 2022, a couple paused at once had been the bottom of the boat put-in ramp in Antelope Canyon to lok down on the receding waters of Lake Powell. The reservoir at that point was 22% full. Photo/Allen Best

Colorado, Mueller asserted, must put together rules for how it will handle shortages if the state must curtail it diversions in order to allow water to flow downstream. He called it a painful process but warned that the “future is not far away.”

The River District position is that the burden within Colorado cannot fall entirely on the Western Slope and its ag users. Programs designed to reduce compensation have been focused solely on the Western Slope and agriculture, says Lindsay DeFrates, deputy director of public relations.

“If we are looking to reduce water long term, we can’t put it on the backs of West Slope users,” she says. “It has to be a shared burden.”

Journalists insist that it’s Western Slope. People in the water community invariably say “West Slope.”

Next: Colorado River Basin states have scaled back their demands on the river. But But agreement about solutions proportionate to the challenge remain distant as deadline near.

Colorado transmountain diversions via the State Engineer’s office

Tribes won’t be paid for unused water through a federal fund. #Colorado lawmakers want that to change — Fresh Water News

The Ute Mountain Ute and Southern Ute Indian tribes, which have reservation land in Colorado, have rights to water they currently can’t access in Lake Nighthorse Reservoir near Durango. Lake Nighthorse, near Durango, Colorado on May 26, 2023. Bureau of Reclamation officials have promised more tribal inclusion in the negotiation of the post-2026 reservoir operating guidelines. Mitch Tobin/The Water Desk

Click the link to read the article on the Water Education Colorado website (Shannon Mullane):

October 24, 2024

Colorado elected leaders this week rallied behind two tribal nations who are willing to forgo future water use in exchange for payment through a new federal conservation fund meant to address drought in the Colorado River Basin.

At issue is whether the tribes’ proposal is eligible for the funding under federal rules.

The Southern Ute and Ute Mountain Ute tribes would like funding for a program that pays tribes to save water by not developing it for future use. Federal officials say the tribes’ proposal doesn’t fit the parameters of the new conservation fund. This week, Colorado Gov. Jared Polis and U.S. Senators John Hickenlooper and Michael Bennet called on the U.S. Bureau of Reclamation to change its mind.

“We write to urge you to ensure that the Southern Ute Indian Tribe and Ute Mountain Ute Tribe have the opportunity to apply for funding programs that address drought and water supply management in the Colorado River Basin, including through upcoming drought mitigation funding under the Inflation Reduction Act,” the lawmakers wrote in a joint letter released Tuesday.

The funding in question, known as Bucket 2 Water Conservation or B2W for short, will focus on long-term projects that cut down on water use or demand for water. Water officials are already eyeing it while waiting to learn about application guidelines, like final eligibility rules.

It’s a much-anticipated addition to billions of taxpayer dollars that are already pouring into the West from big COVID-era programs, like the Inflation Reduction Act. Millions of dollars are filtering down to communities in the Colorado River Basin to help conserve water, upgrade water infrastructure, address drought impacts and restore ecosystems.

It’s the type of money that can make a water official’s long-held dreams come true.

Funding a forbearance program — a top priority for Southern Ute and Ute Mountain Ute officials — would incentivize tribes not to use or develop all their water rights.

The idea could help reduce future demand in an already overburdened river system, supporters say. But it runs counter to ongoing water conservation efforts, which have primarily called on irrigators to cut back on their existing water use.

Paying tribes, who already aren’t using water, to continue to not use it does not fit funding requirements, according to Reclamation. Conservation projects need to offer measurable, new additions to the amount of water flowing through rivers and streams in the Colorado River Basin, Reclamation said.

Native America in the Colorado River Basin. Credit: USBR

“A matter of fairness and justice”

Incentivizing tribes not to fully develop their water rights could have a big impact in the Colorado River Basin. The 30 federally recognized tribes within the basin have recognized rights to a total of about 26% of the river’s average flow.

But when programs, like the Bucket 2 conservation fund, require water to be used before it can be conserved, it poses a challenge for tribal nations across the Colorado River Basin.

About a dozen tribes are still trying to quantify their rights, a long legal process that must be completed before the water can be used. Others have quantified rights but lack the infrastructure to deliver water to homes, businesses and farms on tribal lands.

The Southern Ute and Ute Mountain Ute Tribes fall into the latter camp: Both tribes have the need for water, plans to use their water, and quantified rights to water held in Lake Nighthorse, a federal reservoir outside of Durango.

Neither tribe has put that water to use, citing expensive fees and the high costs of building new water infrastructure.

Until September, tribal officials thought they would be eligible for Bucket 2 funding to launch a compensated tribal forbearance program.

During the Colorado River District’s annual seminar in Grand Junction on Sept. 20, Southern Ute Vice Chair Lorelei Cloud shared Reclamation’s determination, just days prior, that the proposed program was not eligible for the upcoming round of conservation funding.

“We had something on the table until Wednesday when that changed,” Cloud told the room of water professionals. “Sorry, this is emotional to me, because we worked very hard so that we could get the compensation for our water.”

When unused water passes reservations, downstream water users have the option to get paid with federal money to forgo using what is, essentially, tribal water, said Peter Ortego, general counsel for the Ute Mountain Ute Tribe. But the tribes are not always able to participate in those same programs.

“It’s a matter of fairness and justice,” he said in a written statement.

Colorado officials weigh in

Reclamation officials say the upcoming round of conservation funding is limited by legal language in the Inflation Reduction Act that requires new, verifiable contributions to Colorado River system water. Tribal and nontribal projects that meet this standard are eligible, the agency said in a prepared statement Wednesday.

Hickenlooper, Bennet and Polis urged Reclamation to ensure the tribes could apply for the next round of funding.

The lawmakers stressed that, although Reclamation believes the forbearance program would not qualify, the lack of opportunity to develop water supplies does not equal a lack of demand, the letter said. They also urged Reclamation to consider other funding avenues for the tribes.

Colorado River Commissioner Becky Mitchell, Colorado’s top negotiator on river matters, also weighed in to support the tribes’ efforts.

“I continue to urge Reclamation to address this historic inequity and to identify a funding source for Tribal forbearance projects,” she said in a written statement.

If funding through the upcoming Bucket 2 Water Conservation Program isn’t an option, the Southern Ute Indian Tribe asked the Department of Interior, which houses the Bureau of Reclamation, to provide funding for a separate, standalone program.

“To rectify historical wrongs, the Tribe must be adequately compensated for its unused water, especially knowing that junior water users and the Colorado River system are being propped up by our unused water,” the tribe’s statement said.

More by Shannon Mullane

Colorado River “Beginnings”. Photo: Brent Gardner-Smith/Aspen Journalism